Argentinean vs Immigrants from Austria Male Disability
COMPARE
Argentinean
Immigrants from Austria
Male Disability
Male Disability Comparison
Argentineans
Immigrants from Austria
10.1%
MALE DISABILITY
99.9/ 100
METRIC RATING
32nd/ 347
METRIC RANK
11.4%
MALE DISABILITY
27.3/ 100
METRIC RATING
187th/ 347
METRIC RANK
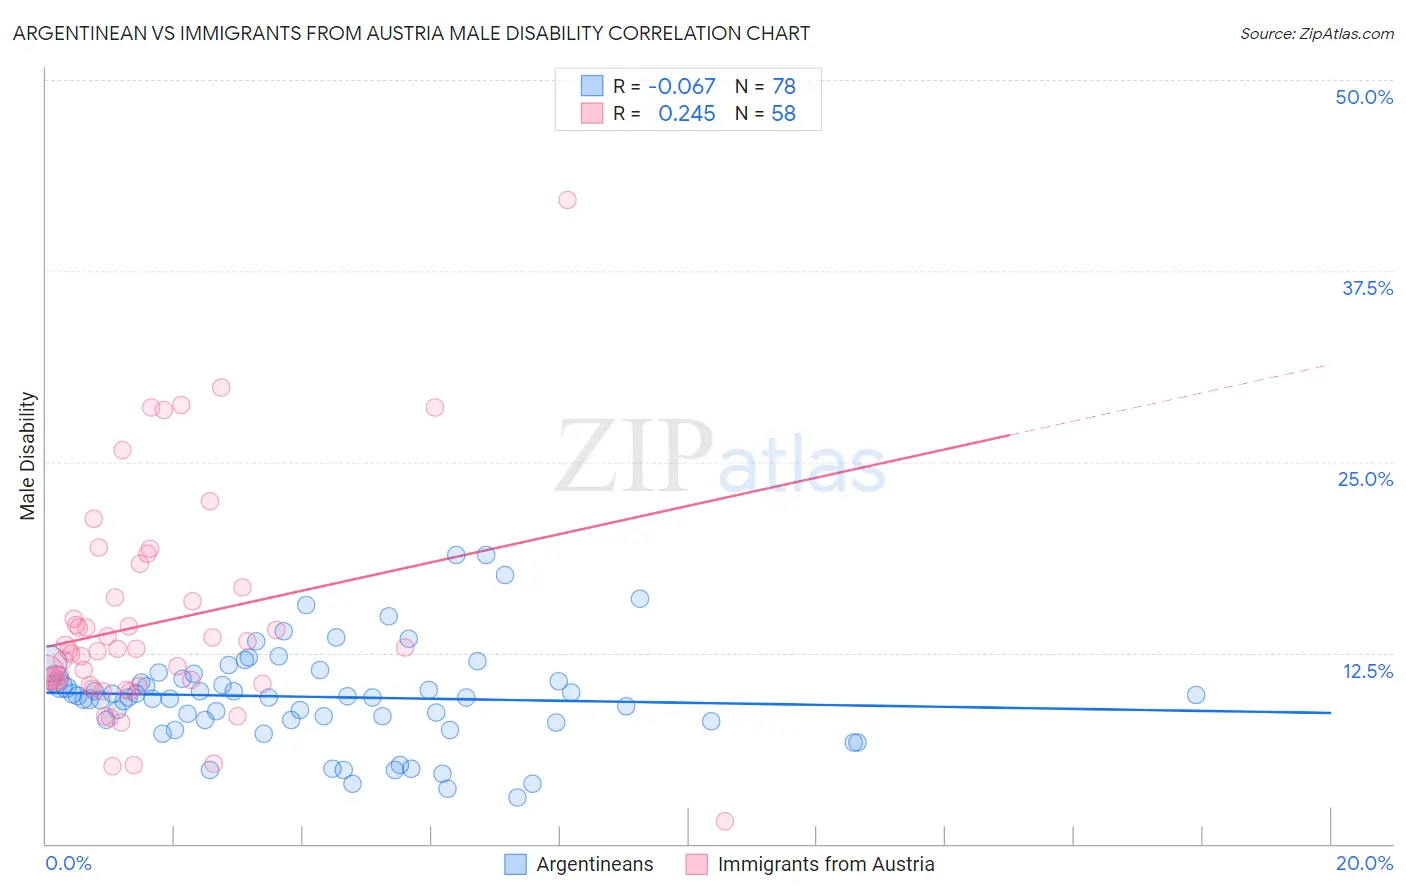
Argentinean vs Immigrants from Austria Male Disability Correlation Chart
The statistical analysis conducted on geographies consisting of 297,137,654 people shows a slight negative correlation between the proportion of Argentineans and percentage of males with a disability in the United States with a correlation coefficient (R) of -0.067 and weighted average of 10.1%. Similarly, the statistical analysis conducted on geographies consisting of 167,973,228 people shows a weak positive correlation between the proportion of Immigrants from Austria and percentage of males with a disability in the United States with a correlation coefficient (R) of 0.245 and weighted average of 11.4%, a difference of 12.2%.
Male Disability Correlation Summary
| Measurement | Argentinean | Immigrants from Austria |
| Minimum | 3.0% | 1.4% |
| Maximum | 18.9% | 42.1% |
| Range | 15.9% | 40.7% |
| Mean | 9.6% | 14.5% |
| Median | 9.6% | 12.7% |
| Interquartile 25% (IQ1) | 8.1% | 10.5% |
| Interquartile 75% (IQ3) | 10.8% | 16.1% |
| Interquartile Range (IQR) | 2.7% | 5.7% |
| Standard Deviation (Sample) | 3.2% | 7.2% |
| Standard Deviation (Population) | 3.2% | 7.2% |
Similar Demographics by Male Disability
Demographics Similar to Argentineans by Male Disability
In terms of male disability, the demographic groups most similar to Argentineans are Soviet Union (10.1%, a difference of 0.15%), Immigrants from Egypt (10.1%, a difference of 0.22%), Venezuelan (10.1%, a difference of 0.25%), Vietnamese (10.1%, a difference of 0.41%), and Egyptian (10.1%, a difference of 0.43%).
| Demographics | Rating | Rank | Male Disability |
| Immigrants | Malaysia | 99.9 /100 | #25 | Exceptional 10.0% |
| Paraguayans | 99.9 /100 | #26 | Exceptional 10.1% |
| Egyptians | 99.9 /100 | #27 | Exceptional 10.1% |
| Vietnamese | 99.9 /100 | #28 | Exceptional 10.1% |
| Venezuelans | 99.9 /100 | #29 | Exceptional 10.1% |
| Immigrants | Egypt | 99.9 /100 | #30 | Exceptional 10.1% |
| Soviet Union | 99.9 /100 | #31 | Exceptional 10.1% |
| Argentineans | 99.9 /100 | #32 | Exceptional 10.1% |
| Immigrants | Ethiopia | 99.9 /100 | #33 | Exceptional 10.2% |
| Immigrants | Turkey | 99.9 /100 | #34 | Exceptional 10.2% |
| Immigrants | Argentina | 99.9 /100 | #35 | Exceptional 10.2% |
| Ethiopians | 99.8 /100 | #36 | Exceptional 10.2% |
| Immigrants | Indonesia | 99.8 /100 | #37 | Exceptional 10.2% |
| Immigrants | Kuwait | 99.8 /100 | #38 | Exceptional 10.2% |
| Afghans | 99.8 /100 | #39 | Exceptional 10.2% |
Demographics Similar to Immigrants from Austria by Male Disability
In terms of male disability, the demographic groups most similar to Immigrants from Austria are Immigrants from Zaire (11.4%, a difference of 0.020%), Estonian (11.4%, a difference of 0.040%), Immigrants from Netherlands (11.4%, a difference of 0.10%), Immigrants from Bosnia and Herzegovina (11.4%, a difference of 0.14%), and Pakistani (11.3%, a difference of 0.20%).
| Demographics | Rating | Rank | Male Disability |
| Hondurans | 41.1 /100 | #180 | Average 11.3% |
| Immigrants | Senegal | 34.4 /100 | #181 | Fair 11.3% |
| Immigrants | Belize | 33.7 /100 | #182 | Fair 11.3% |
| Immigrants | Central America | 32.9 /100 | #183 | Fair 11.3% |
| Iraqis | 30.5 /100 | #184 | Fair 11.3% |
| Pakistanis | 30.3 /100 | #185 | Fair 11.3% |
| Immigrants | Zaire | 27.6 /100 | #186 | Fair 11.4% |
| Immigrants | Austria | 27.3 /100 | #187 | Fair 11.4% |
| Estonians | 26.8 /100 | #188 | Fair 11.4% |
| Immigrants | Netherlands | 25.9 /100 | #189 | Fair 11.4% |
| Immigrants | Bosnia and Herzegovina | 25.4 /100 | #190 | Fair 11.4% |
| Senegalese | 23.2 /100 | #191 | Fair 11.4% |
| Assyrians/Chaldeans/Syriacs | 23.2 /100 | #192 | Fair 11.4% |
| Greeks | 22.2 /100 | #193 | Fair 11.4% |
| Belizeans | 21.2 /100 | #194 | Fair 11.4% |