Argentinean vs Immigrants from Latvia Male Disability
COMPARE
Argentinean
Immigrants from Latvia
Male Disability
Male Disability Comparison
Argentineans
Immigrants from Latvia
10.1%
MALE DISABILITY
99.9/ 100
METRIC RATING
32nd/ 347
METRIC RANK
10.9%
MALE DISABILITY
85.5/ 100
METRIC RATING
128th/ 347
METRIC RANK
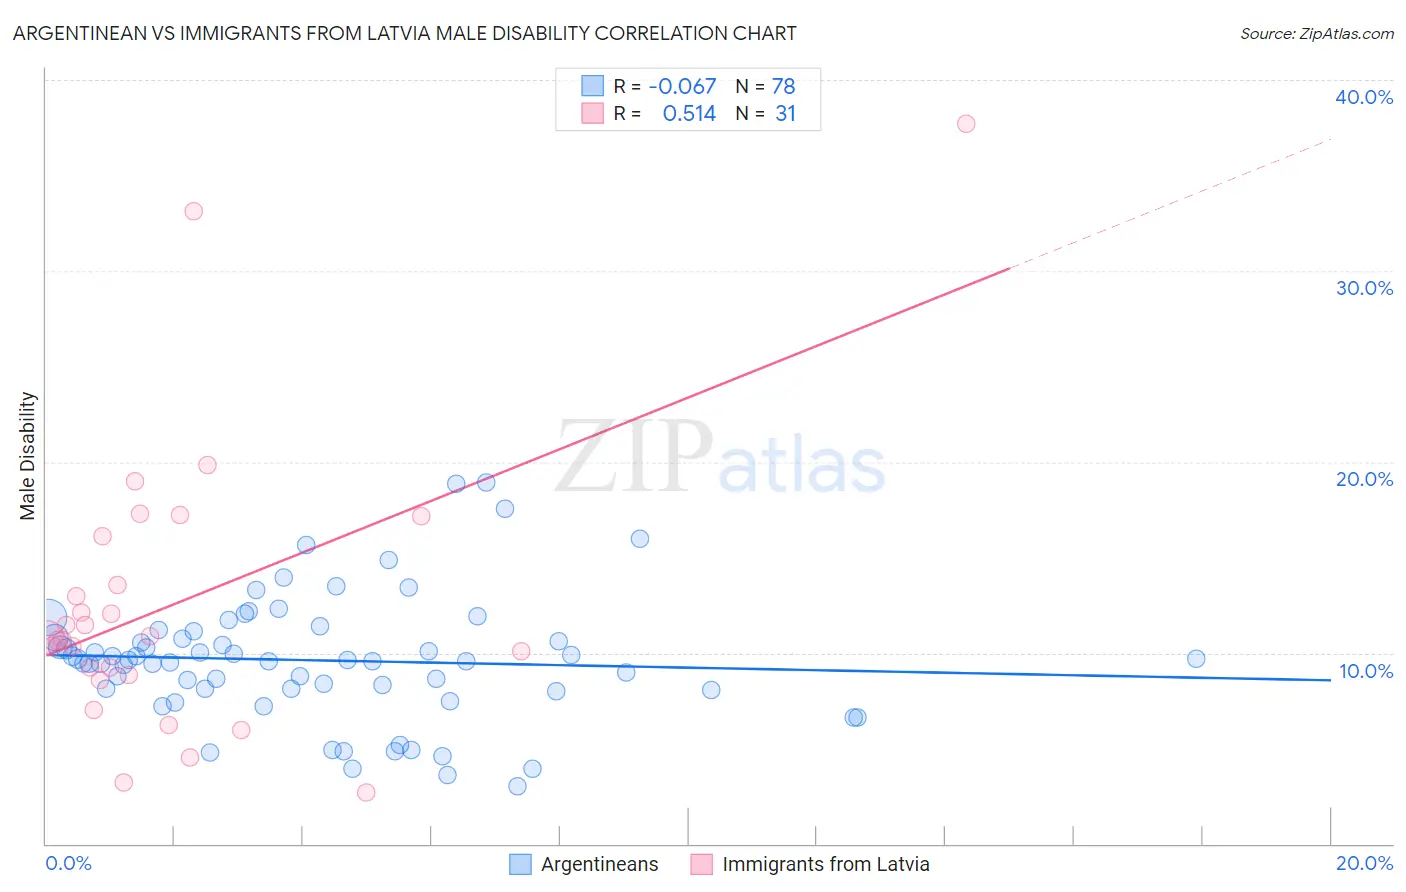
Argentinean vs Immigrants from Latvia Male Disability Correlation Chart
The statistical analysis conducted on geographies consisting of 297,137,654 people shows a slight negative correlation between the proportion of Argentineans and percentage of males with a disability in the United States with a correlation coefficient (R) of -0.067 and weighted average of 10.1%. Similarly, the statistical analysis conducted on geographies consisting of 113,739,259 people shows a substantial positive correlation between the proportion of Immigrants from Latvia and percentage of males with a disability in the United States with a correlation coefficient (R) of 0.514 and weighted average of 10.9%, a difference of 8.0%.
Male Disability Correlation Summary
| Measurement | Argentinean | Immigrants from Latvia |
| Minimum | 3.0% | 2.7% |
| Maximum | 18.9% | 37.7% |
| Range | 15.9% | 35.1% |
| Mean | 9.6% | 12.6% |
| Median | 9.6% | 10.8% |
| Interquartile 25% (IQ1) | 8.1% | 8.9% |
| Interquartile 75% (IQ3) | 10.8% | 16.1% |
| Interquartile Range (IQR) | 2.7% | 7.2% |
| Standard Deviation (Sample) | 3.2% | 7.5% |
| Standard Deviation (Population) | 3.2% | 7.4% |
Similar Demographics by Male Disability
Demographics Similar to Argentineans by Male Disability
In terms of male disability, the demographic groups most similar to Argentineans are Soviet Union (10.1%, a difference of 0.15%), Immigrants from Egypt (10.1%, a difference of 0.22%), Venezuelan (10.1%, a difference of 0.25%), Vietnamese (10.1%, a difference of 0.41%), and Egyptian (10.1%, a difference of 0.43%).
| Demographics | Rating | Rank | Male Disability |
| Immigrants | Malaysia | 99.9 /100 | #25 | Exceptional 10.0% |
| Paraguayans | 99.9 /100 | #26 | Exceptional 10.1% |
| Egyptians | 99.9 /100 | #27 | Exceptional 10.1% |
| Vietnamese | 99.9 /100 | #28 | Exceptional 10.1% |
| Venezuelans | 99.9 /100 | #29 | Exceptional 10.1% |
| Immigrants | Egypt | 99.9 /100 | #30 | Exceptional 10.1% |
| Soviet Union | 99.9 /100 | #31 | Exceptional 10.1% |
| Argentineans | 99.9 /100 | #32 | Exceptional 10.1% |
| Immigrants | Ethiopia | 99.9 /100 | #33 | Exceptional 10.2% |
| Immigrants | Turkey | 99.9 /100 | #34 | Exceptional 10.2% |
| Immigrants | Argentina | 99.9 /100 | #35 | Exceptional 10.2% |
| Ethiopians | 99.8 /100 | #36 | Exceptional 10.2% |
| Immigrants | Indonesia | 99.8 /100 | #37 | Exceptional 10.2% |
| Immigrants | Kuwait | 99.8 /100 | #38 | Exceptional 10.2% |
| Afghans | 99.8 /100 | #39 | Exceptional 10.2% |
Demographics Similar to Immigrants from Latvia by Male Disability
In terms of male disability, the demographic groups most similar to Immigrants from Latvia are Immigrants from Philippines (10.9%, a difference of 0.0%), Brazilian (10.9%, a difference of 0.0%), Macedonian (11.0%, a difference of 0.14%), Immigrants from Ukraine (10.9%, a difference of 0.16%), and Immigrants from Fiji (11.0%, a difference of 0.16%).
| Demographics | Rating | Rank | Male Disability |
| Immigrants | South Eastern Asia | 89.2 /100 | #121 | Excellent 10.9% |
| Immigrants | Ghana | 89.0 /100 | #122 | Excellent 10.9% |
| Immigrants | Czechoslovakia | 88.4 /100 | #123 | Excellent 10.9% |
| South American Indians | 88.1 /100 | #124 | Excellent 10.9% |
| Immigrants | North Macedonia | 88.1 /100 | #125 | Excellent 10.9% |
| Immigrants | Trinidad and Tobago | 86.9 /100 | #126 | Excellent 10.9% |
| Immigrants | Ukraine | 86.8 /100 | #127 | Excellent 10.9% |
| Immigrants | Latvia | 85.5 /100 | #128 | Excellent 10.9% |
| Immigrants | Philippines | 85.4 /100 | #129 | Excellent 10.9% |
| Brazilians | 85.4 /100 | #130 | Excellent 10.9% |
| Macedonians | 84.2 /100 | #131 | Excellent 11.0% |
| Immigrants | Fiji | 84.0 /100 | #132 | Excellent 11.0% |
| Ugandans | 83.9 /100 | #133 | Excellent 11.0% |
| Bhutanese | 83.4 /100 | #134 | Excellent 11.0% |
| Trinidadians and Tobagonians | 83.3 /100 | #135 | Excellent 11.0% |