Zip Codes with the Highest Percentage of Population Employed in Farming, Fishing & Forestry in Montrose, CO
RELATED REPORTS & OPTIONS
Farming, Fishing & Forestry
Montrose
Compare Zip Codes
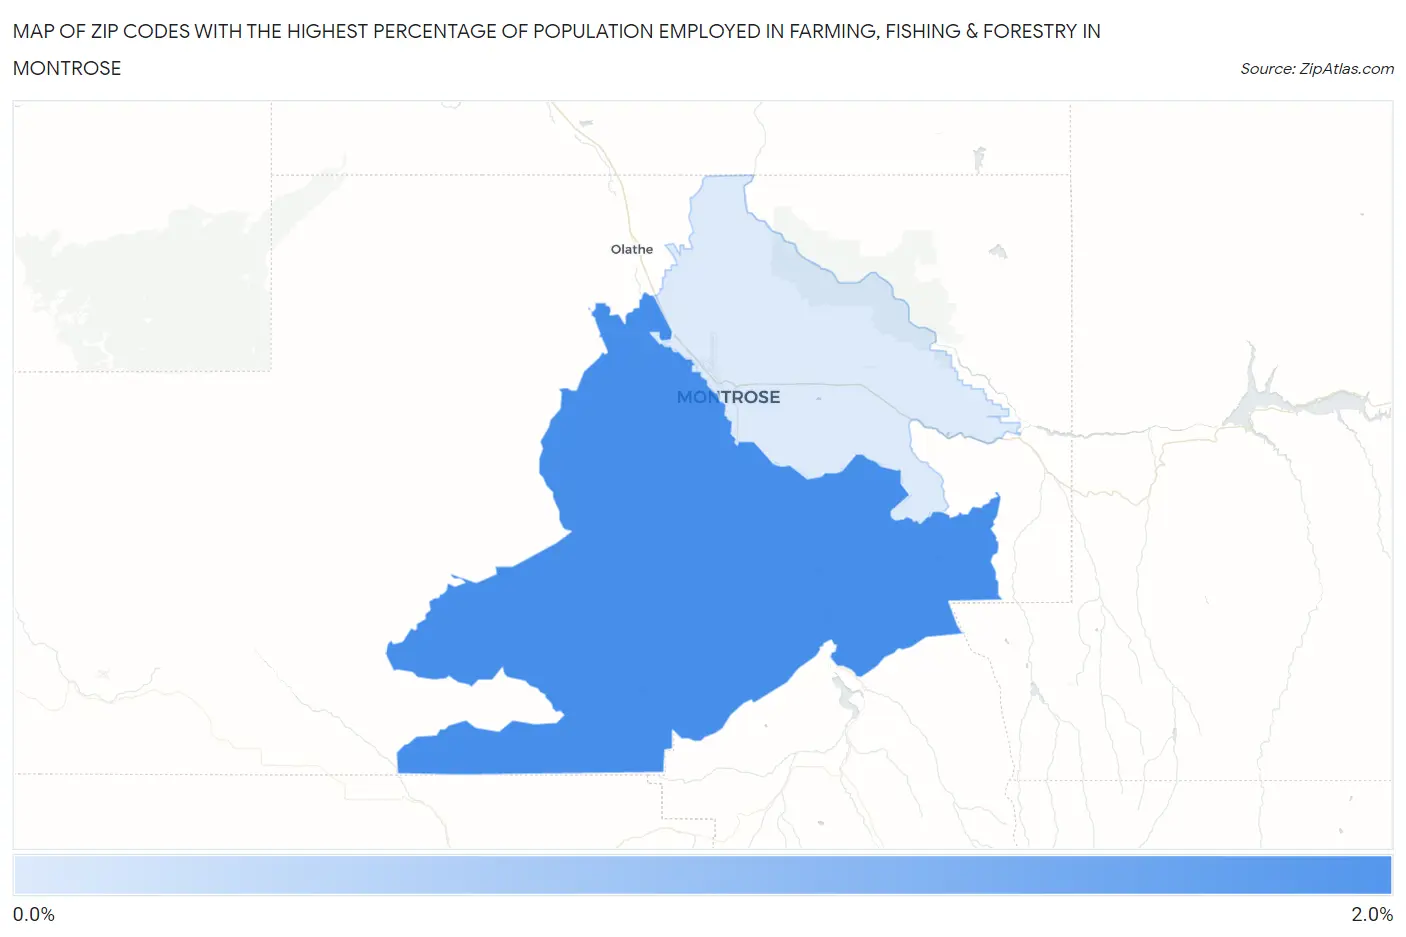
Map of Zip Codes with the Highest Percentage of Population Employed in Farming, Fishing & Forestry in Montrose
0.30%
1.8%
Zip Codes with the Highest Percentage of Population Employed in Farming, Fishing & Forestry in Montrose, CO
| Zip Code | % Employed | vs State | vs National | |
| 1. | 81403 | 1.8% | 0.49%(+1.35)#122 | 0.61%(+1.24)#6,918 |
| 2. | 81401 | 0.30% | 0.49%(-0.191)#244 | 0.61%(-0.309)#14,877 |
1
Common Questions
What are the Top Zip Codes with the Highest Percentage of Population Employed in Farming, Fishing & Forestry in Montrose, CO?
Top Zip Codes with the Highest Percentage of Population Employed in Farming, Fishing & Forestry in Montrose, CO are:
What zip code has the Highest Percentage of Population Employed in Farming, Fishing & Forestry in Montrose, CO?
81403 has the Highest Percentage of Population Employed in Farming, Fishing & Forestry in Montrose, CO with 1.8%.
What is the Percentage of Population Employed in Farming, Fishing & Forestry in Montrose, CO?
Percentage of Population Employed in Farming, Fishing & Forestry in Montrose is 0.20%.
What is the Percentage of Population Employed in Farming, Fishing & Forestry in Colorado?
Percentage of Population Employed in Farming, Fishing & Forestry in Colorado is 0.49%.
What is the Percentage of Population Employed in Farming, Fishing & Forestry in the United States?
Percentage of Population Employed in Farming, Fishing & Forestry in the United States is 0.61%.