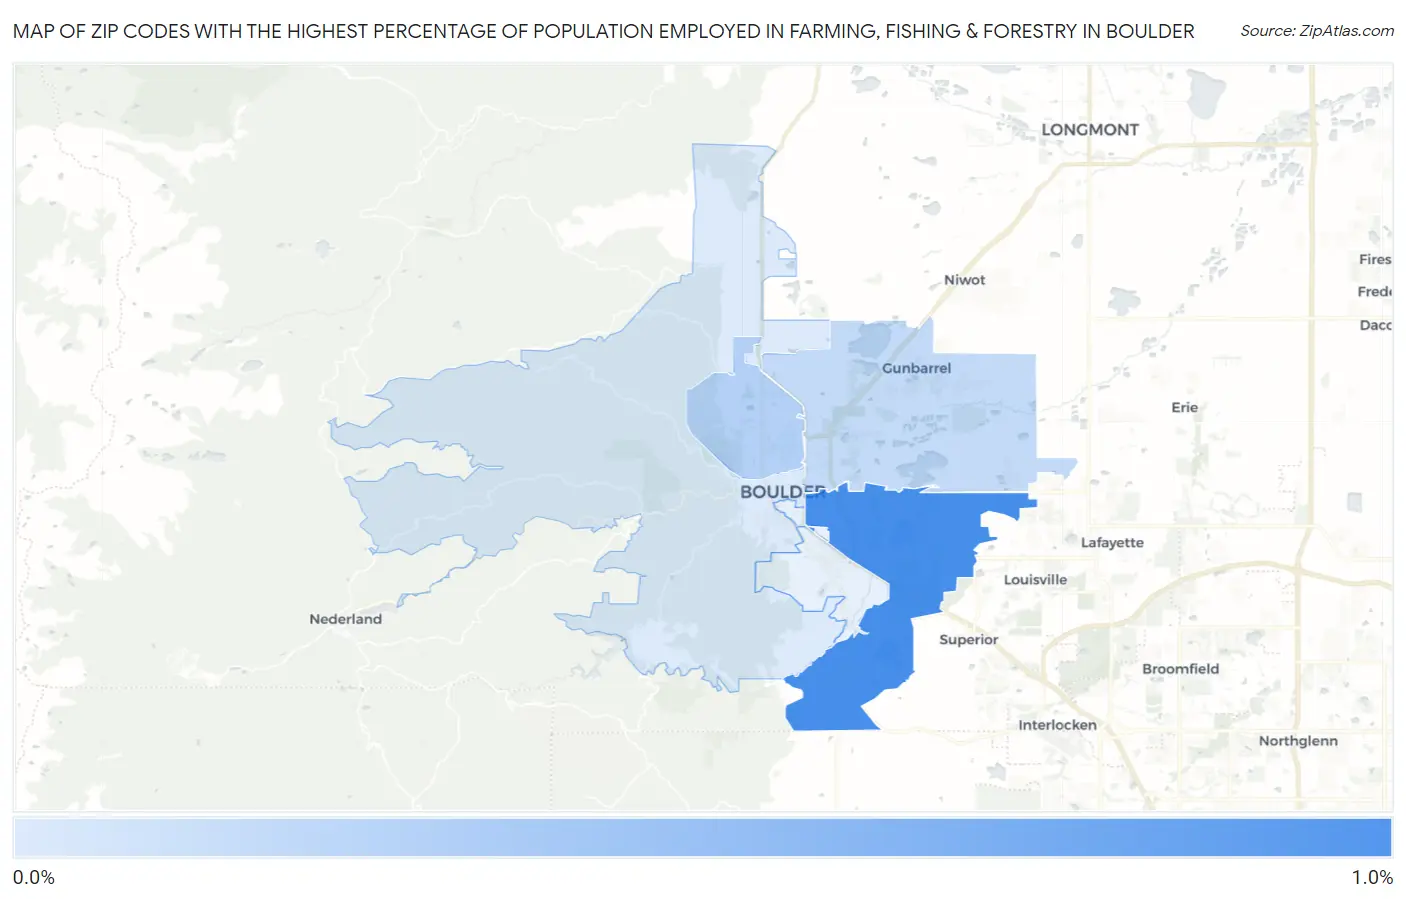
Zip Codes with the Highest Percentage of Population Employed in Farming, Fishing & Forestry in Boulder, CO
RELATED REPORTS & OPTIONS
Farming, Fishing & Forestry
Boulder
Compare Zip Codes
Map of Zip Codes with the Highest Percentage of Population Employed in Farming, Fishing & Forestry in Boulder
0.089%
0.92%
Zip Codes with the Highest Percentage of Population Employed in Farming, Fishing & Forestry in Boulder, CO
| Zip Code | % Employed | vs State | vs National | |
| 1. | 80303 | 0.92% | 0.49%(+0.436)#160 | 0.61%(+0.318)#10,111 |
| 2. | 80304 | 0.32% | 0.49%(-0.169)#237 | 0.61%(-0.288)#14,623 |
| 3. | 80301 | 0.23% | 0.49%(-0.257)#263 | 0.61%(-0.375)#15,683 |
| 4. | 80302 | 0.089% | 0.49%(-0.398)#302 | 0.61%(-0.516)#17,940 |
1
Common Questions
What are the Top 5 Zip Codes with the Highest Percentage of Population Employed in Farming, Fishing & Forestry in Boulder, CO?
Top 5 Zip Codes with the Highest Percentage of Population Employed in Farming, Fishing & Forestry in Boulder, CO are:
What zip code has the Highest Percentage of Population Employed in Farming, Fishing & Forestry in Boulder, CO?
80303 has the Highest Percentage of Population Employed in Farming, Fishing & Forestry in Boulder, CO with 0.92%.
What is the Percentage of Population Employed in Farming, Fishing & Forestry in Boulder, CO?
Percentage of Population Employed in Farming, Fishing & Forestry in Boulder is 0.34%.
What is the Percentage of Population Employed in Farming, Fishing & Forestry in Colorado?
Percentage of Population Employed in Farming, Fishing & Forestry in Colorado is 0.49%.
What is the Percentage of Population Employed in Farming, Fishing & Forestry in the United States?
Percentage of Population Employed in Farming, Fishing & Forestry in the United States is 0.61%.