Zip Codes with the Highest Percentage of Population Employed in Farming, Fishing & Forestry in Parker, CO
RELATED REPORTS & OPTIONS
Farming, Fishing & Forestry
Parker
Compare Zip Codes
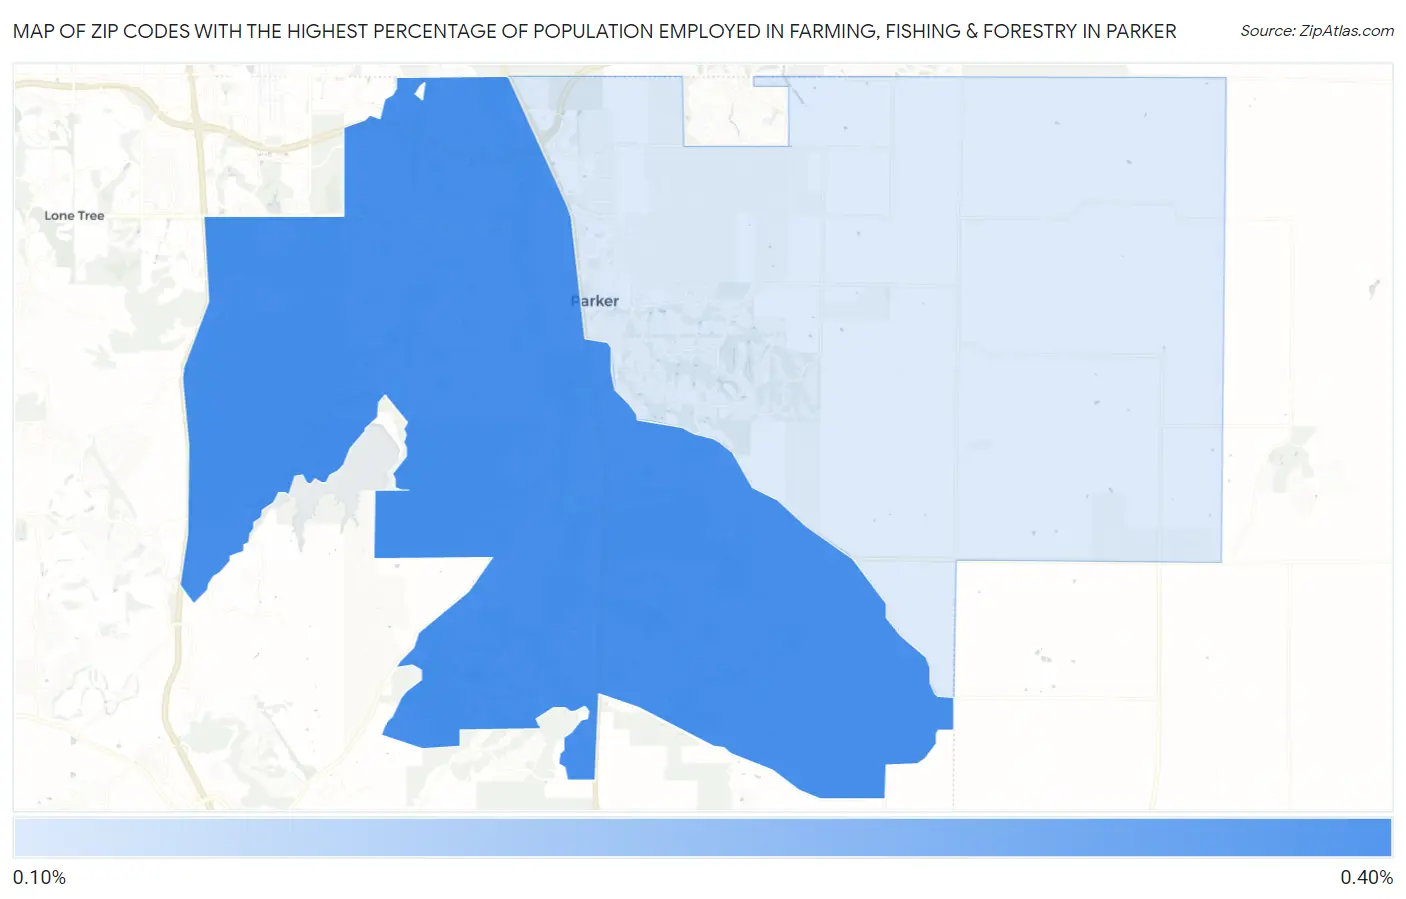
Map of Zip Codes with the Highest Percentage of Population Employed in Farming, Fishing & Forestry in Parker
0.12%
0.35%
Zip Codes with the Highest Percentage of Population Employed in Farming, Fishing & Forestry in Parker, CO
| Zip Code | % Employed | vs State | vs National | |
| 1. | 80134 | 0.35% | 0.49%(-0.142)#233 | 0.61%(-0.260)#14,315 |
| 2. | 80138 | 0.12% | 0.49%(-0.362)#294 | 0.61%(-0.481)#17,349 |
1
Common Questions
What are the Top Zip Codes with the Highest Percentage of Population Employed in Farming, Fishing & Forestry in Parker, CO?
Top Zip Codes with the Highest Percentage of Population Employed in Farming, Fishing & Forestry in Parker, CO are:
What zip code has the Highest Percentage of Population Employed in Farming, Fishing & Forestry in Parker, CO?
80134 has the Highest Percentage of Population Employed in Farming, Fishing & Forestry in Parker, CO with 0.35%.
What is the Percentage of Population Employed in Farming, Fishing & Forestry in Parker, CO?
Percentage of Population Employed in Farming, Fishing & Forestry in Parker is 0.42%.
What is the Percentage of Population Employed in Farming, Fishing & Forestry in Colorado?
Percentage of Population Employed in Farming, Fishing & Forestry in Colorado is 0.49%.
What is the Percentage of Population Employed in Farming, Fishing & Forestry in the United States?
Percentage of Population Employed in Farming, Fishing & Forestry in the United States is 0.61%.