Zip Codes with the Highest Percentage of Population Employed in Farming, Fishing & Forestry in Aurora, CO
RELATED REPORTS & OPTIONS
Farming, Fishing & Forestry
Aurora
Compare Zip Codes
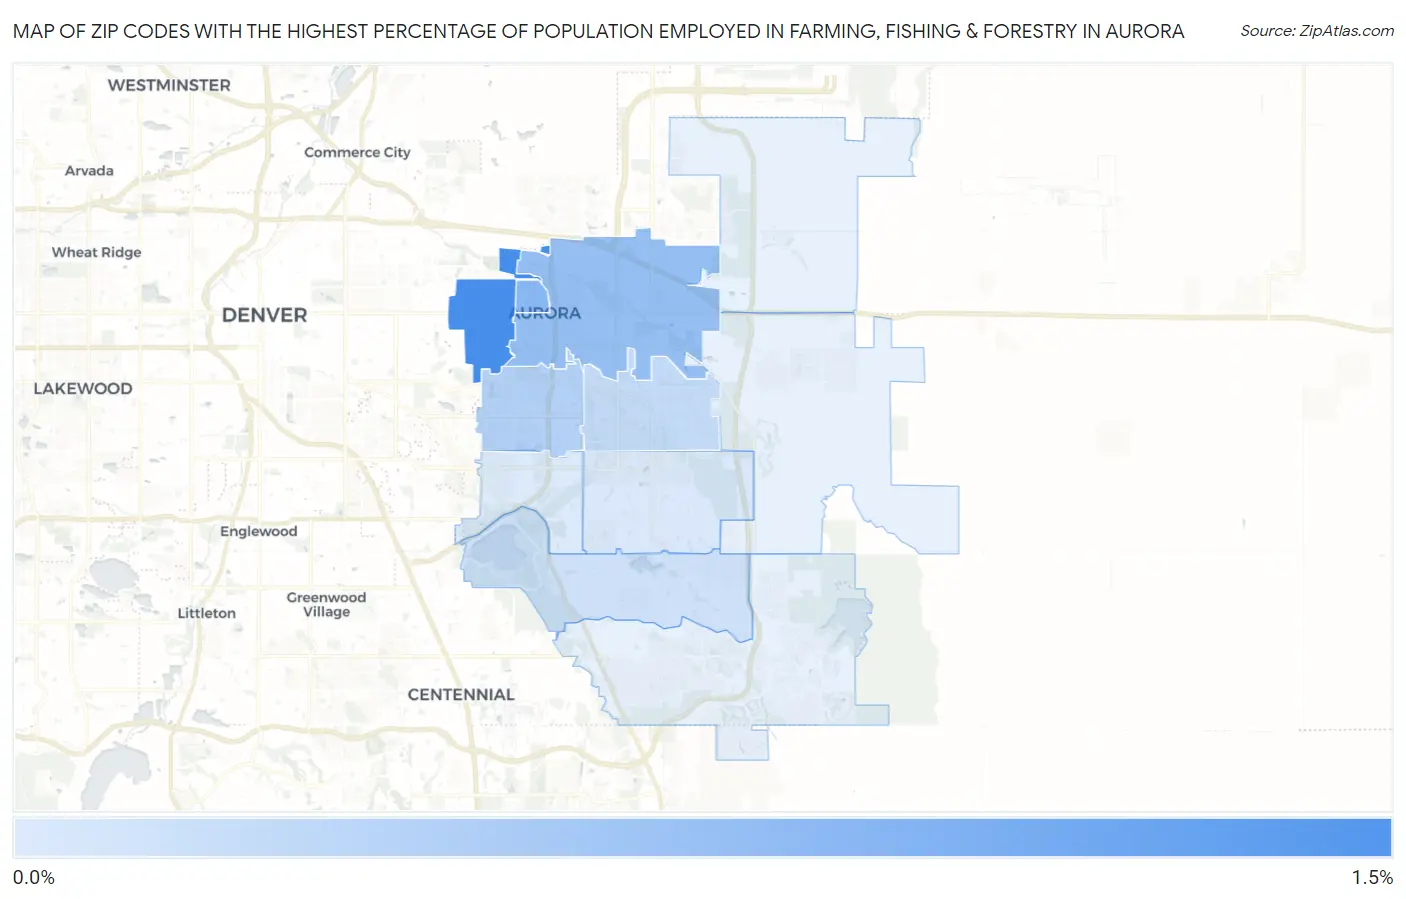
Map of Zip Codes with the Highest Percentage of Population Employed in Farming, Fishing & Forestry in Aurora
0.039%
1.3%
Zip Codes with the Highest Percentage of Population Employed in Farming, Fishing & Forestry in Aurora, CO
| Zip Code | % Employed | vs State | vs National | |
| 1. | 80010 | 1.3% | 0.49% (+0.808)#143 | 0.61% (+0.689)#8,586 |
| 2. | 80045 | 0.74% | 0.49% (+0.249)#175 | 0.61% (+0.131)#11,157 |
| 3. | 80011 | 0.63% | 0.49% (+0.147)#180 | 0.61% (+0.028)#11,795 |
| 4. | 80012 | 0.38% | 0.49% (-0.111)#229 | 0.61% (-0.229)#13,984 |
| 5. | 80017 | 0.25% | 0.49% (-0.240)#260 | 0.61% (-0.358)#15,451 |
| 6. | 80015 | 0.15% | 0.49% (-0.335)#287 | 0.61% (-0.454)#16,881 |
| 7. | 80013 | 0.057% | 0.49% (-0.430)#310 | 0.61% (-0.548)#18,531 |
| 8. | 80014 | 0.039% | 0.49% (-0.448)#314 | 0.61% (-0.566)#18,814 |
1
Common Questions
What are the Top 10 Zip Codes with the Highest Percentage of Population Employed in Farming, Fishing & Forestry in Aurora, CO?
Top 10 Zip Codes with the Highest Percentage of Population Employed in Farming, Fishing & Forestry in Aurora, CO are:
What zip code has the Highest Percentage of Population Employed in Farming, Fishing & Forestry in Aurora, CO?
80010 has the Highest Percentage of Population Employed in Farming, Fishing & Forestry in Aurora, CO with 1.3%.
What is the Percentage of Population Employed in Farming, Fishing & Forestry in Aurora, CO?
Percentage of Population Employed in Farming, Fishing & Forestry in Aurora is 0.32%.
What is the Percentage of Population Employed in Farming, Fishing & Forestry in Colorado?
Percentage of Population Employed in Farming, Fishing & Forestry in Colorado is 0.49%.
What is the Percentage of Population Employed in Farming, Fishing & Forestry in the United States?
Percentage of Population Employed in Farming, Fishing & Forestry in the United States is 0.61%.