Zip Codes with the Highest Percentage of Population Employed in Mining, Quarrying, & Extraction in Garden Grove, CA

RELATED REPORTS & OPTIONS

Mining, Quarrying, & Extraction
Population
Families and Households
Female Fertility
Female Fertility (Unmarried)
Race (Community Size)
Race (Percentage)
Ancestry (Community Size)
AfghanAfricanAmericanApacheArabArgentineanArmenianAustralianAustrianBangladeshiBasqueBelgianBhutaneseBlackfeetBolivianBrazilianBritishBurmeseCanadianCentral AmericanCentral American IndianCherokeeChileanChoctawColombianCosta RicanCroatianCubanCzechCzechoslovakianDanishDutchEastern EuropeanEcuadorianEgyptianEnglishEstonianEthiopianEuropeanFilipinoFinnishFrenchFrench CanadianGermanGreekGuatemalanHaitianHungarianIndian (Asian)IranianIrishItalianJapaneseKoreanLaotianLebaneseLithuanianMalaysianMexicanMexican American IndianNative HawaiianNavajoNicaraguanNorthern EuropeanNorwegianPakistaniPanamanianPeruvianPolishPortuguesePuerto RicanRomanianRussianSalvadoranSamoanScandinavianScotch-IrishScottishSlovakSouth AmericanSpaniardSpanishSri LankanSubsaharan AfricanSwedishSwissThaiTurkishUkrainianVenezuelanVietnameseWelshYugoslavian
Ancestry (Percentage)
AfghanAfricanAmericanApacheArabArgentineanArmenianAustralianAustrianBangladeshiBasqueBelgianBhutaneseBlackfeetBolivianBrazilianBritishBurmeseCanadianCentral AmericanCentral American IndianCherokeeChileanChoctawColombianCosta RicanCroatianCubanCzechCzechoslovakianDanishDutchEastern EuropeanEcuadorianEgyptianEnglishEstonianEthiopianEuropeanFilipinoFinnishFrenchFrench CanadianGermanGreekGuatemalanHaitianHungarianIndian (Asian)IranianIrishItalianJapaneseKoreanLaotianLebaneseLithuanianMalaysianMexicanMexican American IndianNative HawaiianNavajoNicaraguanNorthern EuropeanNorwegianPakistaniPanamanianPeruvianPolishPortuguesePuerto RicanRomanianRussianSalvadoranSamoanScandinavianScotch-IrishScottishSlovakSouth AmericanSpaniardSpanishSri LankanSubsaharan AfricanSwedishSwissThaiTurkishUkrainianVenezuelanVietnameseWelshYugoslavian
Immigrant Origin (Total)
Immigrant Origin (Percentage)
Income
Income (Families)
Income (Households)
Poverty
Poverty (Families)
Unemployment
Employment Occupations
Employment Industries
Employer Class
Commute Time
Commute Means
School Enrollment
Education by Degree Field
Occupancy
Finances
Physical Characteristics
Garden Grove
Compare Zip Codes
Comparison Subject

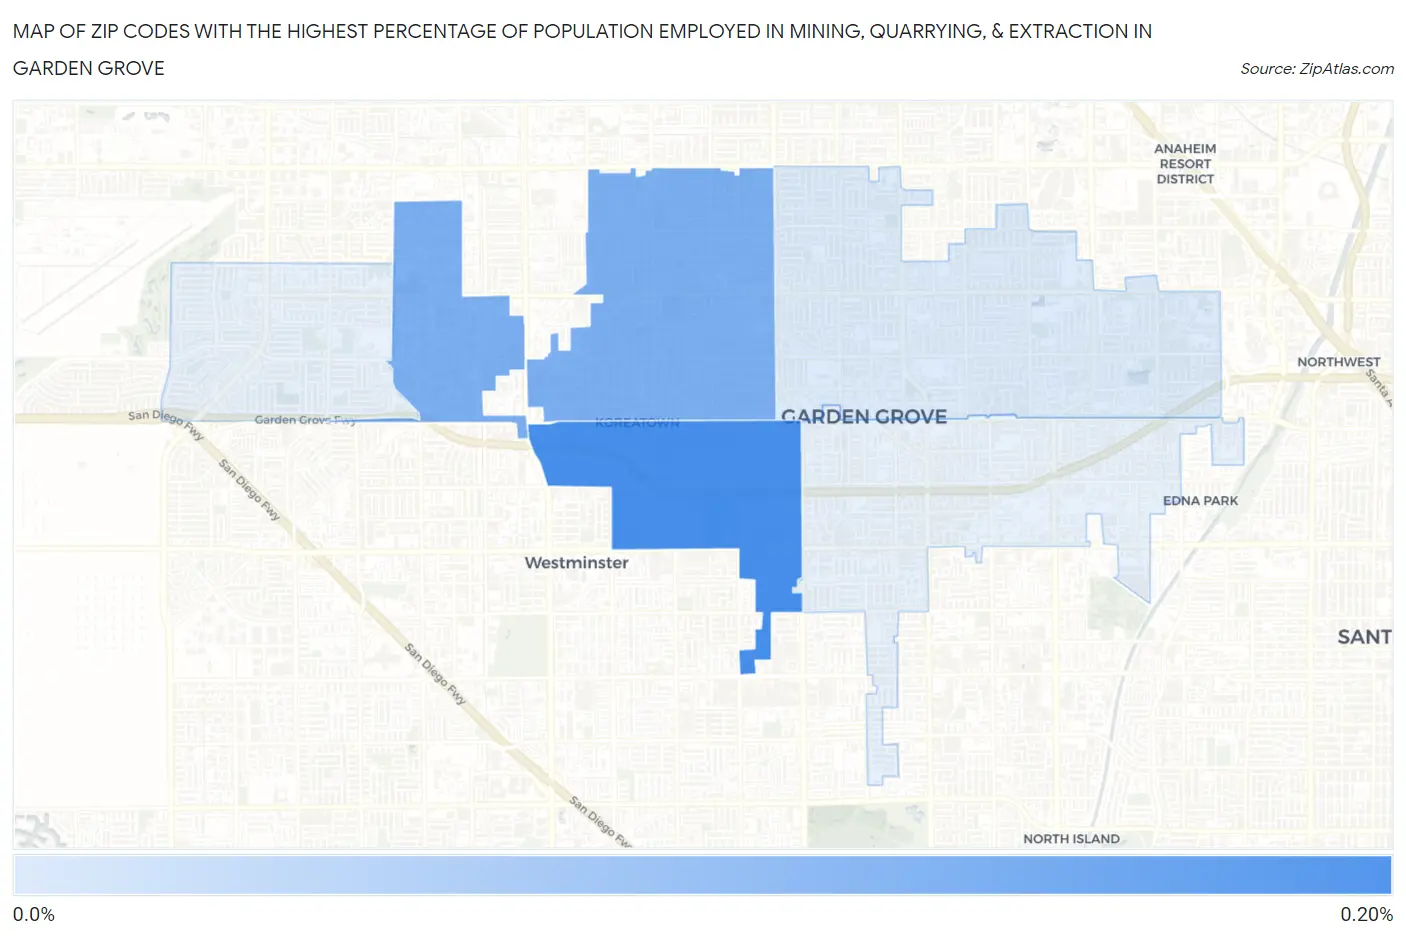
Map of Zip Codes with the Highest Percentage of Population Employed in Mining, Quarrying, & Extraction in Garden Grove

0.0%
0.20%
Zip Codes with the Highest Percentage of Population Employed in Mining, Quarrying, & Extraction in Garden Grove Map

Zip Codes with the Highest Percentage of Population Employed in Mining, Quarrying, & Extraction in Garden Grove, CA

Zip Code % Employed vs State vs National
1.928440.17%0.12%(+0.051)#2190.44%(-0.266)#9,804
2.928410.13%0.12%(+0.005)#2690.44%(-0.313)#10,406
3.928400.043%0.12%(-0.080)#4420.44%(-0.397)#11,744

Common Questions

What are the Top 3 Zip Codes with the Highest Percentage of Population Employed in Mining, Quarrying, & Extraction in Garden Grove, CA?
Top 3 Zip Codes with the Highest Percentage of Population Employed in Mining, Quarrying, & Extraction in Garden Grove, CA are:
#1
0.17%
#2
0.13%
#3
0.043%
What zip code has the Highest Percentage of Population Employed in Mining, Quarrying, & Extraction in Garden Grove, CA?
92844 has the Highest Percentage of Population Employed in Mining, Quarrying, & Extraction in Garden Grove, CA with 0.17%.
What is the Percentage of Population Employed in Mining, Quarrying, & Extraction in Garden Grove, CA?
Percentage of Population Employed in Mining, Quarrying, & Extraction in Garden Grove is 0.060%.
What is the Percentage of Population Employed in Mining, Quarrying, & Extraction in California?
Percentage of Population Employed in Mining, Quarrying, & Extraction in California is 0.12%.
What is the Percentage of Population Employed in Mining, Quarrying, & Extraction in the United States?
Percentage of Population Employed in Mining, Quarrying, & Extraction in the United States is 0.44%.