Zip Codes with the Highest Percentage of Population Employed in Installation, Maintenance & Repair in Fort Smith, AR
RELATED REPORTS & OPTIONS
Installation, Maintenance & Repair
Fort Smith
Compare Zip Codes
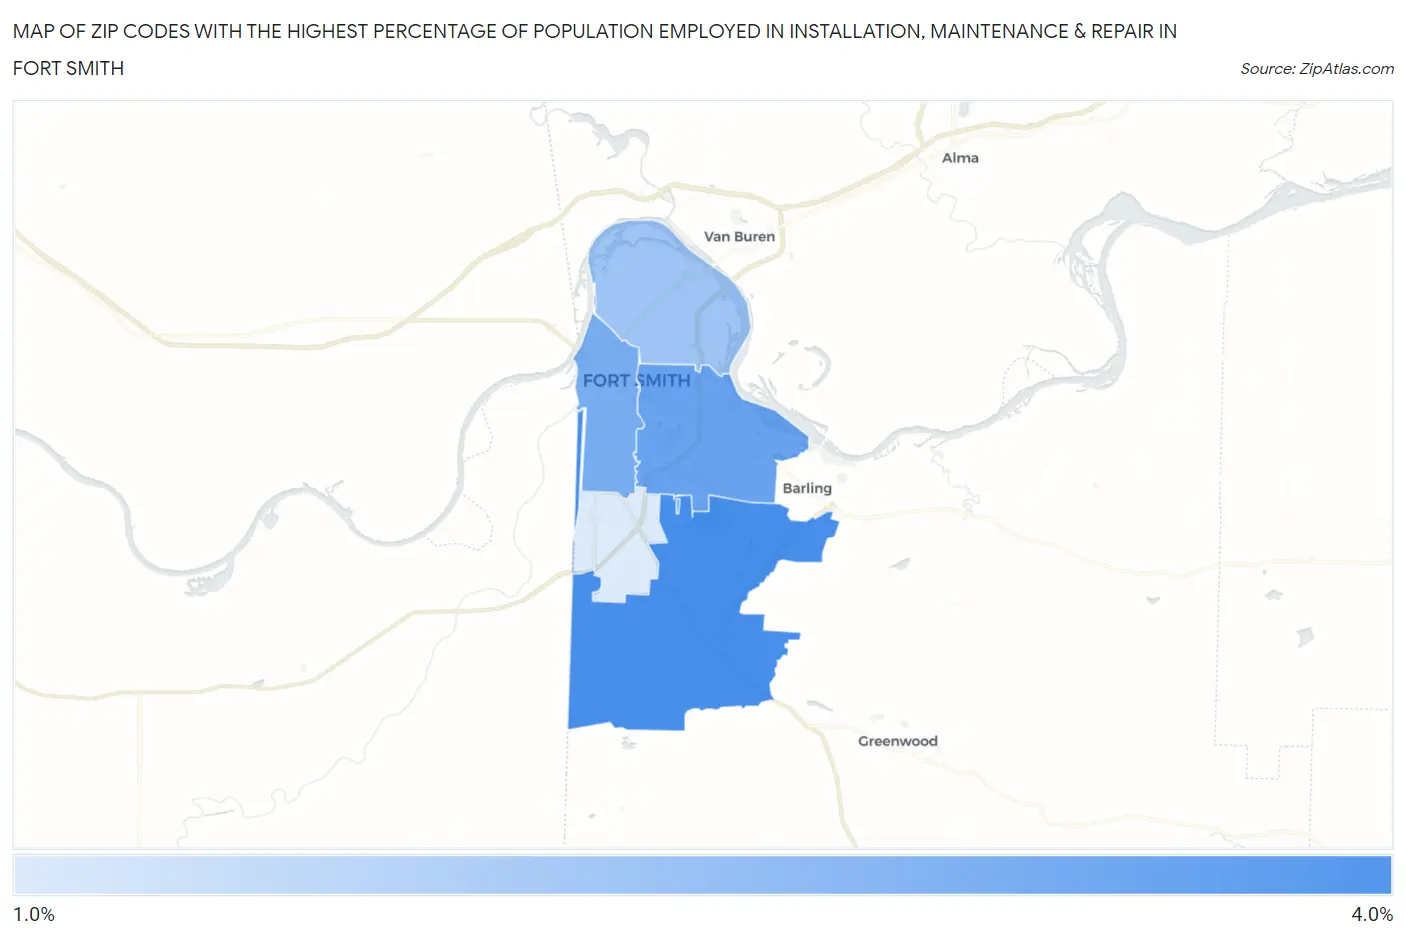
Map of Zip Codes with the Highest Percentage of Population Employed in Installation, Maintenance & Repair in Fort Smith
1.5%
3.2%
Zip Codes with the Highest Percentage of Population Employed in Installation, Maintenance & Repair in Fort Smith, AR
| Zip Code | % Employed | vs State | vs National | |
| 1. | 72916 | 3.2% | 3.8%(-0.572)#298 | 3.1%(+0.158)#15,906 |
| 2. | 72903 | 2.8% | 3.8%(-0.967)#313 | 3.1%(-0.238)#17,846 |
| 3. | 72901 | 2.6% | 3.8%(-1.15)#325 | 3.1%(-0.425)#18,853 |
| 4. | 72904 | 2.2% | 3.8%(-1.60)#355 | 3.1%(-0.875)#21,109 |
| 5. | 72908 | 1.5% | 3.8%(-2.34)#403 | 3.1%(-1.61)#24,345 |
1
Common Questions
What are the Top 3 Zip Codes with the Highest Percentage of Population Employed in Installation, Maintenance & Repair in Fort Smith, AR?
Top 3 Zip Codes with the Highest Percentage of Population Employed in Installation, Maintenance & Repair in Fort Smith, AR are:
What zip code has the Highest Percentage of Population Employed in Installation, Maintenance & Repair in Fort Smith, AR?
72916 has the Highest Percentage of Population Employed in Installation, Maintenance & Repair in Fort Smith, AR with 3.2%.
What is the Percentage of Population Employed in Installation, Maintenance & Repair in Fort Smith, AR?
Percentage of Population Employed in Installation, Maintenance & Repair in Fort Smith is 2.4%.
What is the Percentage of Population Employed in Installation, Maintenance & Repair in Arkansas?
Percentage of Population Employed in Installation, Maintenance & Repair in Arkansas is 3.8%.
What is the Percentage of Population Employed in Installation, Maintenance & Repair in the United States?
Percentage of Population Employed in Installation, Maintenance & Repair in the United States is 3.1%.