Johnsonville, SC Map & Demographics
Johnsonville Map
Johnsonville Overview
$23,854
PER CAPITA INCOME
$57,878
AVG FAMILY INCOME
$46,528
AVG HOUSEHOLD INCOME
28.8%
WAGE / INCOME GAP [ % ]
71.2¢/ $1
WAGE / INCOME GAP [ $ ]
0.47
INEQUALITY / GINI INDEX
1,108
TOTAL POPULATION
474
MALE POPULATION
634
FEMALE POPULATION
74.76
MALES / 100 FEMALES
133.76
FEMALES / 100 MALES
34.6
MEDIAN AGE
3.0
AVG FAMILY SIZE
2.4
AVG HOUSEHOLD SIZE
420
LABOR FORCE [ PEOPLE ]
51.0%
PERCENT IN LABOR FORCE
3.3%
UNEMPLOYMENT RATE
Johnsonville Zip Codes
Johnsonville Area Codes
Income in Johnsonville
Income Overview in Johnsonville
Per Capita Income in Johnsonville is $23,854, while median incomes of families and households are $57,878 and $46,528 respectively.
| Characteristic | Number | Measure |
| Per Capita Income | 1,108 | $23,854 |
| Median Family Income | 313 | $57,878 |
| Mean Family Income | 313 | $66,690 |
| Median Household Income | 462 | $46,528 |
| Mean Household Income | 462 | $56,924 |
| Income Deficit | 313 | $0 |
| Wage / Income Gap (%) | 1,108 | 28.81% |
| Wage / Income Gap ($) | 1,108 | 71.19¢ per $1 |
| Gini / Inequality Index | 1,108 | 0.47 |
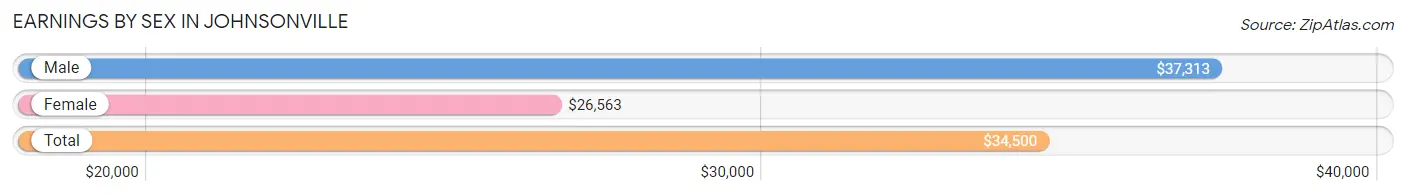
Earnings by Sex in Johnsonville
Average Earnings in Johnsonville are $34,500, $37,313 for men and $26,563 for women, a difference of 28.8%.
| Sex | Number | Average Earnings |
| Male | 207 (48.6%) | $37,313 |
| Female | 219 (51.4%) | $26,563 |
| Total | 426 (100.0%) | $34,500 |
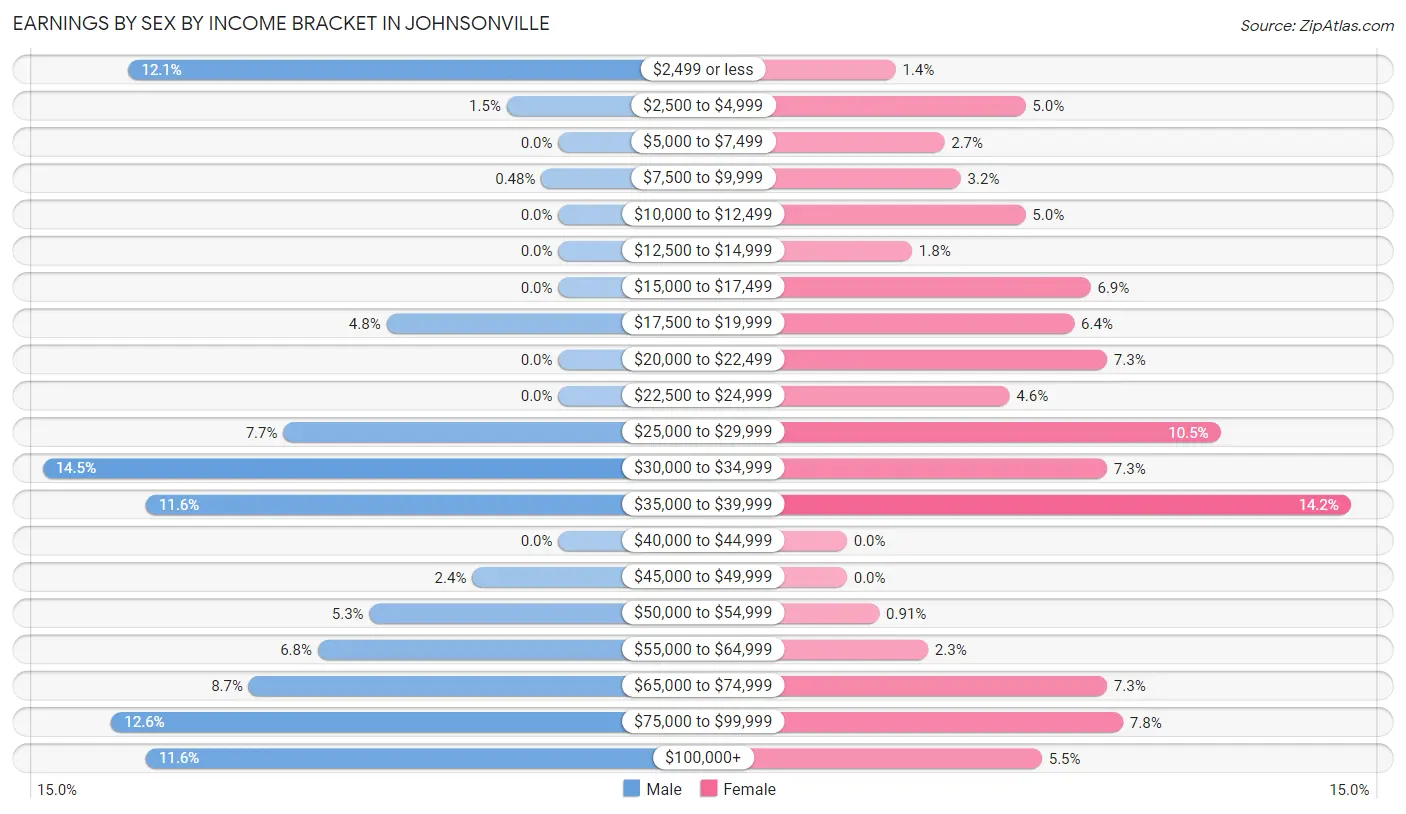
Earnings by Sex by Income Bracket in Johnsonville
The most common earnings brackets in Johnsonville are $30,000 to $34,999 for men (30 | 14.5%) and $35,000 to $39,999 for women (31 | 14.2%).
| Income | Male | Female |
| $2,499 or less | 25 (12.1%) | 3 (1.4%) |
| $2,500 to $4,999 | 3 (1.5%) | 11 (5.0%) |
| $5,000 to $7,499 | 0 (0.0%) | 6 (2.7%) |
| $7,500 to $9,999 | 1 (0.5%) | 7 (3.2%) |
| $10,000 to $12,499 | 0 (0.0%) | 11 (5.0%) |
| $12,500 to $14,999 | 0 (0.0%) | 4 (1.8%) |
| $15,000 to $17,499 | 0 (0.0%) | 15 (6.9%) |
| $17,500 to $19,999 | 10 (4.8%) | 14 (6.4%) |
| $20,000 to $22,499 | 0 (0.0%) | 16 (7.3%) |
| $22,500 to $24,999 | 0 (0.0%) | 10 (4.6%) |
| $25,000 to $29,999 | 16 (7.7%) | 23 (10.5%) |
| $30,000 to $34,999 | 30 (14.5%) | 16 (7.3%) |
| $35,000 to $39,999 | 24 (11.6%) | 31 (14.2%) |
| $40,000 to $44,999 | 0 (0.0%) | 0 (0.0%) |
| $45,000 to $49,999 | 5 (2.4%) | 0 (0.0%) |
| $50,000 to $54,999 | 11 (5.3%) | 2 (0.9%) |
| $55,000 to $64,999 | 14 (6.8%) | 5 (2.3%) |
| $65,000 to $74,999 | 18 (8.7%) | 16 (7.3%) |
| $75,000 to $99,999 | 26 (12.6%) | 17 (7.8%) |
| $100,000+ | 24 (11.6%) | 12 (5.5%) |
| Total | 207 (100.0%) | 219 (100.0%) |
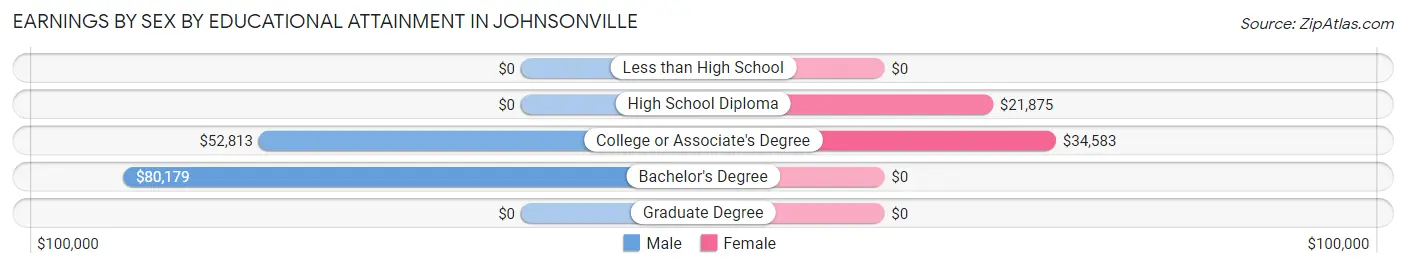
Earnings by Sex by Educational Attainment in Johnsonville
Average earnings in Johnsonville are $53,281 for men and $33,672 for women, a difference of 36.8%. Men with an educational attainment of bachelor's degree enjoy the highest average annual earnings of $80,179, while those with college or associate's degree education earn the least with $52,813. Women with an educational attainment of college or associate's degree earn the most with the average annual earnings of $34,583, while those with high school diploma education have the smallest earnings of $21,875.
| Educational Attainment | Male Income | Female Income |
| Less than High School | - | - |
| High School Diploma | - | - |
| College or Associate's Degree | $52,813 | $34,583 |
| Bachelor's Degree | $80,179 | $0 |
| Graduate Degree | - | - |
| Total | $53,281 | $33,672 |
Family Income in Johnsonville
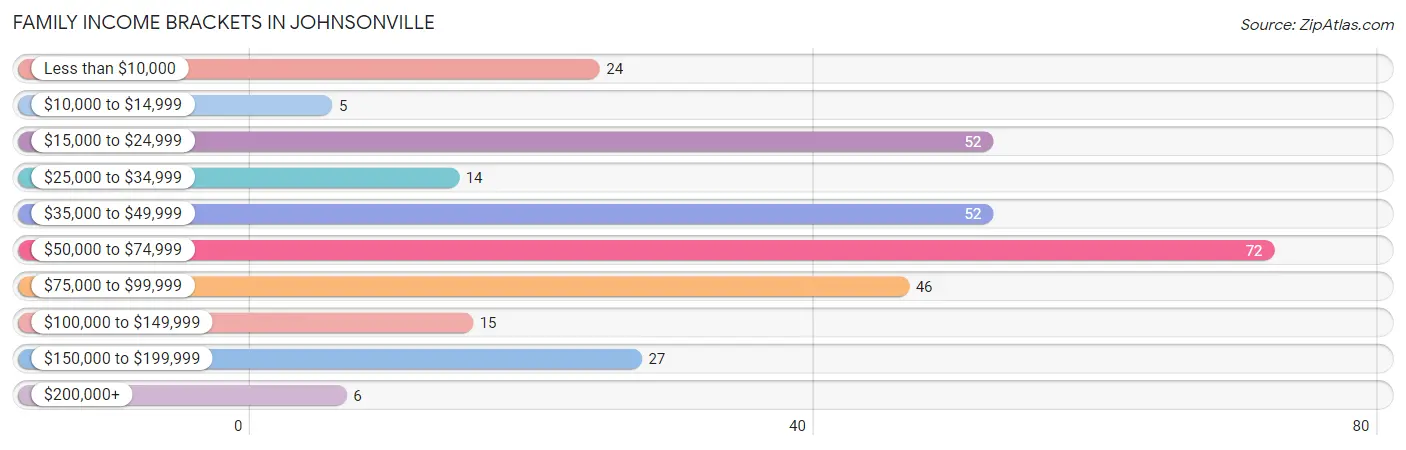
Family Income Brackets in Johnsonville
According to the Johnsonville family income data, there are 72 families falling into the $50,000 to $74,999 income range, which is the most common income bracket and makes up 23.0% of all families. Conversely, the $10,000 to $14,999 income bracket is the least frequent group with only 5 families (1.6%) belonging to this category.
| Income Bracket | # Families | % Families |
| Less than $10,000 | 24 | 7.7% |
| $10,000 to $14,999 | 5 | 1.6% |
| $15,000 to $24,999 | 52 | 16.6% |
| $25,000 to $34,999 | 14 | 4.5% |
| $35,000 to $49,999 | 52 | 16.6% |
| $50,000 to $74,999 | 72 | 23.0% |
| $75,000 to $99,999 | 46 | 14.7% |
| $100,000 to $149,999 | 15 | 4.8% |
| $150,000 to $199,999 | 27 | 8.6% |
| $200,000+ | 6 | 1.9% |
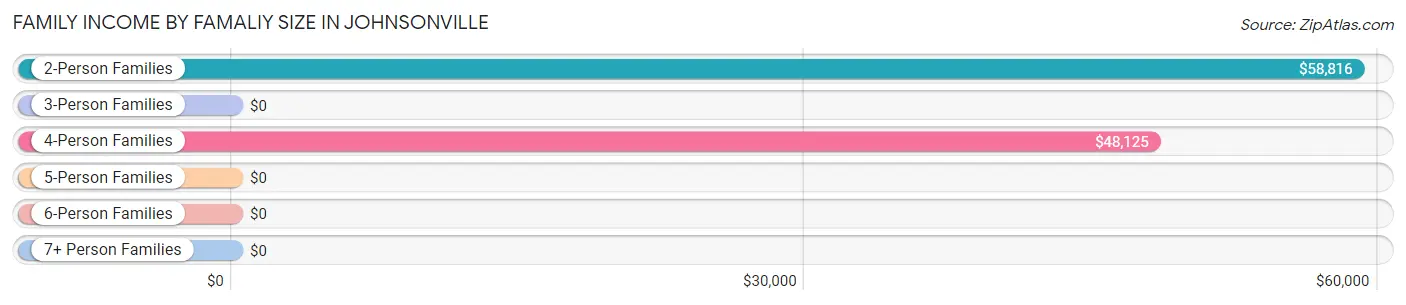
Family Income by Famaliy Size in Johnsonville
2-person families (182 | 58.2%) account for the highest median family income in Johnsonville with $58,816 per family, while 2-person families (182 | 58.2%) have the highest median income of $29,408 per family member.
| Income Bracket | # Families | Median Income |
| 2-Person Families | 182 (58.2%) | $58,816 |
| 3-Person Families | 61 (19.5%) | $0 |
| 4-Person Families | 34 (10.9%) | $48,125 |
| 5-Person Families | 36 (11.5%) | $0 |
| 6-Person Families | 0 (0.0%) | $0 |
| 7+ Person Families | 0 (0.0%) | $0 |
| Total | 313 (100.0%) | $57,878 |
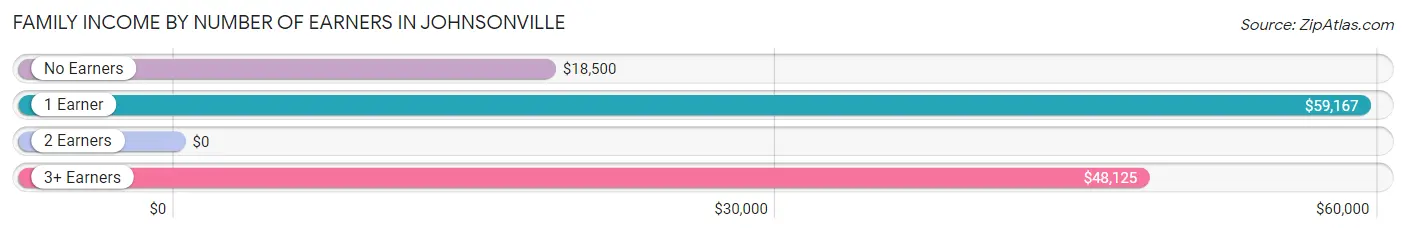
Family Income by Number of Earners in Johnsonville
| Number of Earners | # Families | Median Income |
| No Earners | 82 (26.2%) | $18,500 |
| 1 Earner | 130 (41.5%) | $59,167 |
| 2 Earners | 86 (27.5%) | $0 |
| 3+ Earners | 15 (4.8%) | $48,125 |
| Total | 313 (100.0%) | $57,878 |
Household Income in Johnsonville
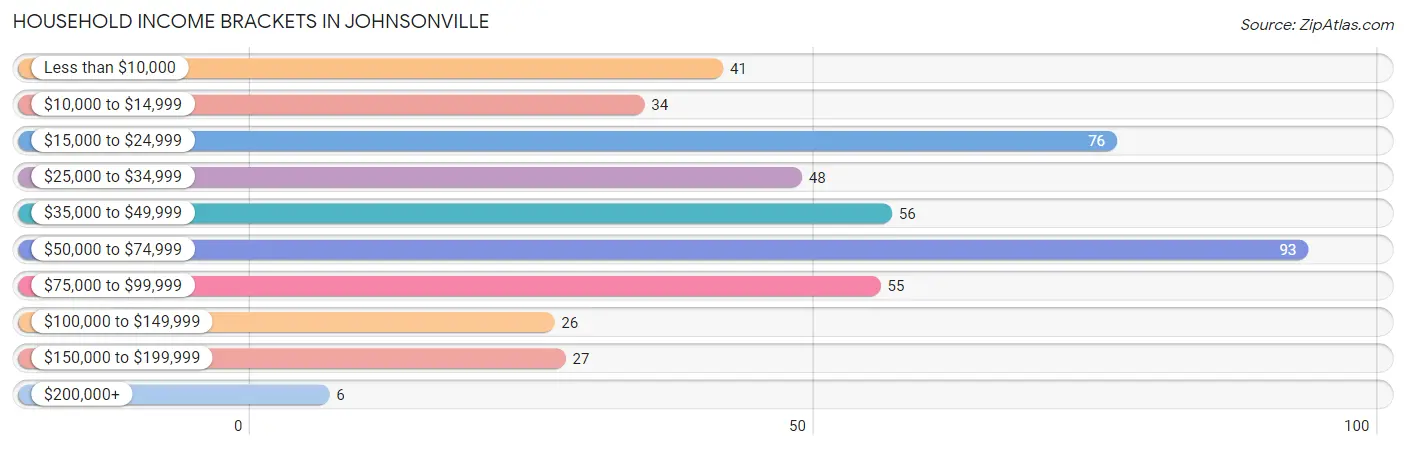
Household Income Brackets in Johnsonville
With 93 households falling in the category, the $50,000 to $74,999 income range is the most frequent in Johnsonville, accounting for 20.1% of all households. In contrast, only 6 households (1.3%) fall into the $200,000+ income bracket, making it the least populous group.
| Income Bracket | # Households | % Households |
| Less than $10,000 | 41 | 8.9% |
| $10,000 to $14,999 | 34 | 7.4% |
| $15,000 to $24,999 | 76 | 16.5% |
| $25,000 to $34,999 | 48 | 10.4% |
| $35,000 to $49,999 | 56 | 12.1% |
| $50,000 to $74,999 | 93 | 20.1% |
| $75,000 to $99,999 | 55 | 11.9% |
| $100,000 to $149,999 | 26 | 5.6% |
| $150,000 to $199,999 | 27 | 5.8% |
| $200,000+ | 6 | 1.3% |
Household Income by Householder Age in Johnsonville
The median household income in Johnsonville is $46,528, with the highest median household income of $63,000 found in the 25 to 44 years age bracket for the primary householder. A total of 150 households (32.5%) fall into this category. Meanwhile, the 15 to 24 years age bracket for the primary householder has the lowest median household income of $0, with 19 households (4.1%) in this group.
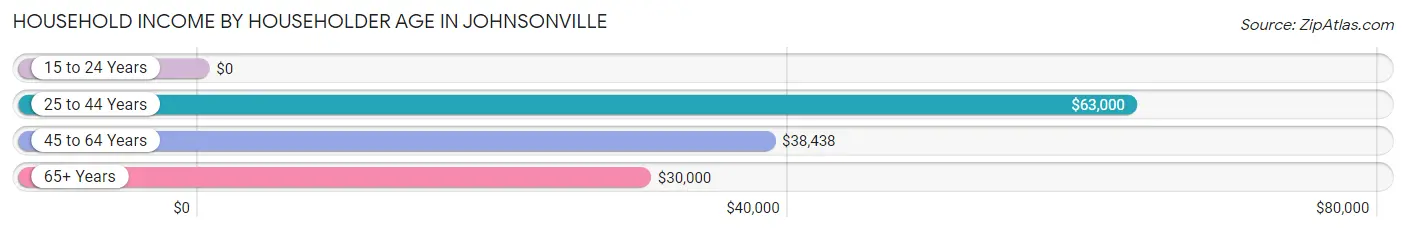
| Income Bracket | # Households | Median Income |
| 15 to 24 Years | 19 (4.1%) | $0 |
| 25 to 44 Years | 150 (32.5%) | $63,000 |
| 45 to 64 Years | 145 (31.4%) | $38,438 |
| 65+ Years | 148 (32.0%) | $30,000 |
| Total | 462 (100.0%) | $46,528 |
Poverty in Johnsonville
Income Below Poverty by Sex and Age in Johnsonville
With 26.2% poverty level for males and 23.3% for females among the residents of Johnsonville, 15 year old males and 12 to 14 year old females are the most vulnerable to poverty, with 15 males (78.9%) and 17 females (44.7%) in their respective age groups living below the poverty level.
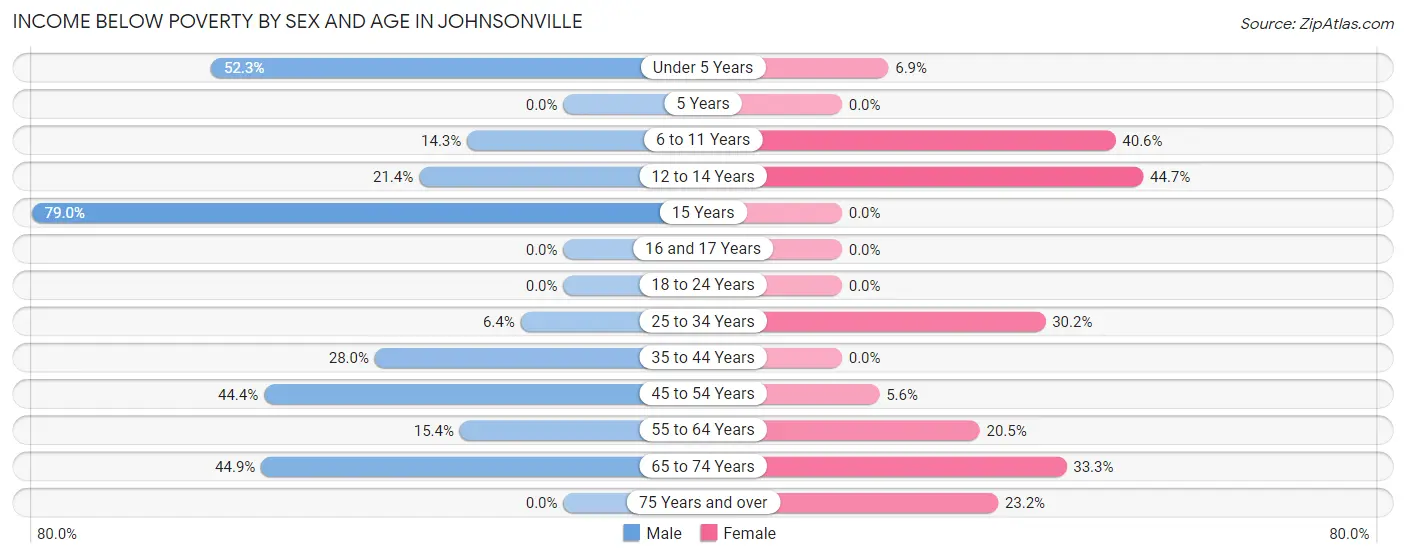
| Age Bracket | Male | Female |
| Under 5 Years | 34 (52.3%) | 2 (6.9%) |
| 5 Years | 0 (0.0%) | 0 (0.0%) |
| 6 to 11 Years | 3 (14.3%) | 39 (40.6%) |
| 12 to 14 Years | 3 (21.4%) | 17 (44.7%) |
| 15 Years | 15 (78.9%) | 0 (0.0%) |
| 16 and 17 Years | 0 (0.0%) | 0 (0.0%) |
| 18 to 24 Years | 0 (0.0%) | 0 (0.0%) |
| 25 to 34 Years | 4 (6.4%) | 29 (30.2%) |
| 35 to 44 Years | 14 (28.0%) | 0 (0.0%) |
| 45 to 54 Years | 8 (44.4%) | 3 (5.6%) |
| 55 to 64 Years | 8 (15.4%) | 18 (20.4%) |
| 65 to 74 Years | 35 (44.9%) | 24 (33.3%) |
| 75 Years and over | 0 (0.0%) | 16 (23.2%) |
| Total | 124 (26.2%) | 148 (23.3%) |
Income Above Poverty by Sex and Age in Johnsonville
According to the poverty statistics in Johnsonville, males aged 5 years and females aged 16 and 17 years are the age groups that are most secure financially, with 100.0% of males and 100.0% of females in these age groups living above the poverty line.
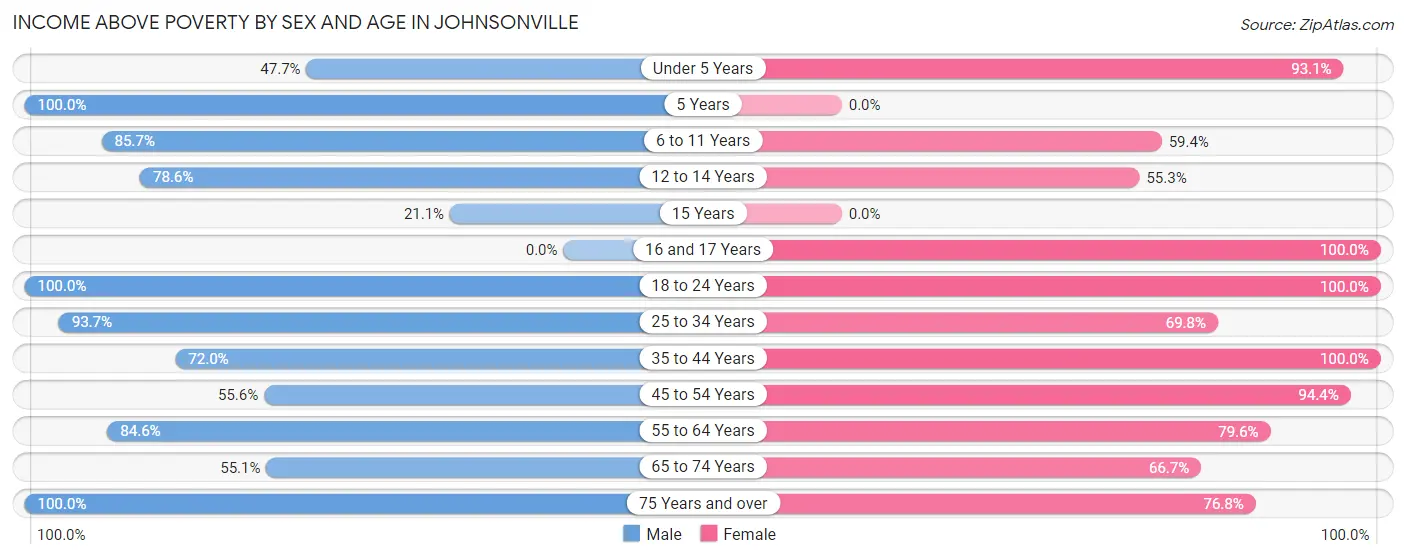
| Age Bracket | Male | Female |
| Under 5 Years | 31 (47.7%) | 27 (93.1%) |
| 5 Years | 3 (100.0%) | 0 (0.0%) |
| 6 to 11 Years | 18 (85.7%) | 57 (59.4%) |
| 12 to 14 Years | 11 (78.6%) | 21 (55.3%) |
| 15 Years | 4 (21.0%) | 0 (0.0%) |
| 16 and 17 Years | 0 (0.0%) | 27 (100.0%) |
| 18 to 24 Years | 69 (100.0%) | 21 (100.0%) |
| 25 to 34 Years | 59 (93.6%) | 67 (69.8%) |
| 35 to 44 Years | 36 (72.0%) | 44 (100.0%) |
| 45 to 54 Years | 10 (55.6%) | 51 (94.4%) |
| 55 to 64 Years | 44 (84.6%) | 70 (79.5%) |
| 65 to 74 Years | 43 (55.1%) | 48 (66.7%) |
| 75 Years and over | 22 (100.0%) | 53 (76.8%) |
| Total | 350 (73.8%) | 486 (76.7%) |
Income Below Poverty Among Married-Couple Families in Johnsonville
The poverty statistics for married-couple families in Johnsonville show that 14.6% or 29 of the total 199 families live below the poverty line. Families with no children have the highest poverty rate of 18.1%, comprising of 29 families. On the other hand, families with 1 or 2 children have the lowest poverty rate of 0.0%, which includes 0 families.
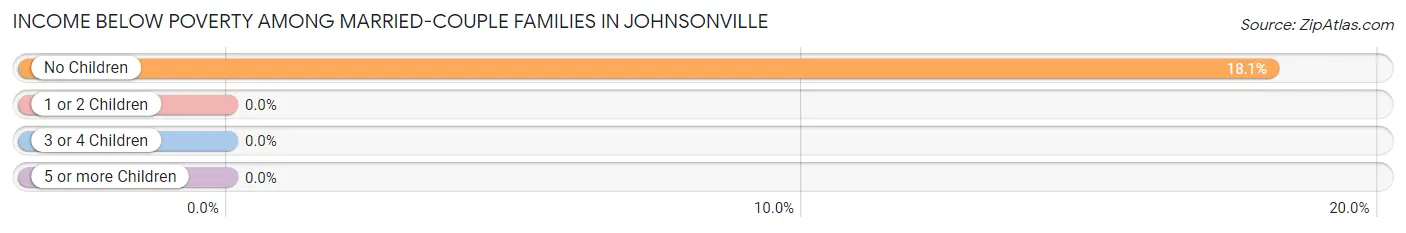
| Children | Above Poverty | Below Poverty |
| No Children | 131 (81.9%) | 29 (18.1%) |
| 1 or 2 Children | 25 (100.0%) | 0 (0.0%) |
| 3 or 4 Children | 14 (100.0%) | 0 (0.0%) |
| 5 or more Children | 0 (0.0%) | 0 (0.0%) |
| Total | 170 (85.4%) | 29 (14.6%) |
Income Below Poverty Among Single-Parent Households in Johnsonville
According to the poverty data in Johnsonville, 18.8% or 3 single-father households and 28.6% or 28 single-mother households are living below the poverty line. Among single-father households, those with 3 or 4 children have the highest poverty rate, with 3 households (100.0%) experiencing poverty. Likewise, among single-mother households, those with 3 or 4 children have the highest poverty rate, with 15 households (100.0%) falling below the poverty line.
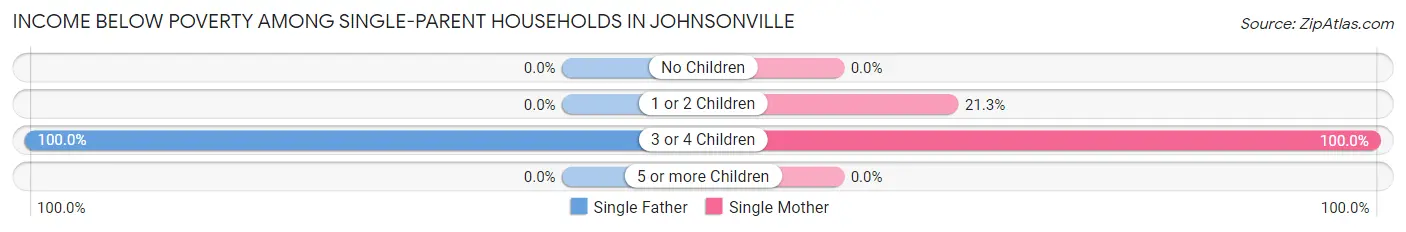
| Children | Single Father | Single Mother |
| No Children | 0 (0.0%) | 0 (0.0%) |
| 1 or 2 Children | 0 (0.0%) | 13 (21.3%) |
| 3 or 4 Children | 3 (100.0%) | 15 (100.0%) |
| 5 or more Children | 0 (0.0%) | 0 (0.0%) |
| Total | 3 (18.8%) | 28 (28.6%) |
Income Below Poverty Among Married-Couple vs Single-Parent Households in Johnsonville
The poverty data for Johnsonville shows that 29 of the married-couple family households (14.6%) and 31 of the single-parent households (27.2%) are living below the poverty level. Within the married-couple family households, those with no children have the highest poverty rate, with 29 households (18.1%) falling below the poverty line. Among the single-parent households, those with 3 or 4 children have the highest poverty rate, with 18 household (100.0%) living below poverty.
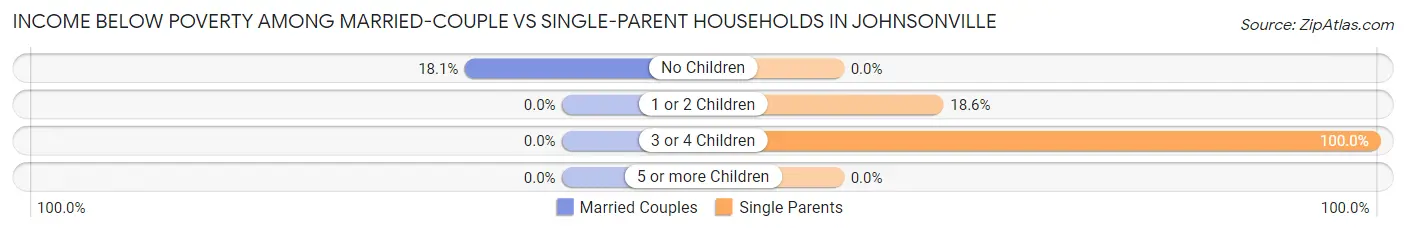
| Children | Married-Couple Families | Single-Parent Households |
| No Children | 29 (18.1%) | 0 (0.0%) |
| 1 or 2 Children | 0 (0.0%) | 13 (18.6%) |
| 3 or 4 Children | 0 (0.0%) | 18 (100.0%) |
| 5 or more Children | 0 (0.0%) | 0 (0.0%) |
| Total | 29 (14.6%) | 31 (27.2%) |
Race in Johnsonville
The most populous races in Johnsonville are White / Caucasian (754 | 68.0%), Black / African American (283 | 25.5%), and Two or more Races (45 | 4.1%).
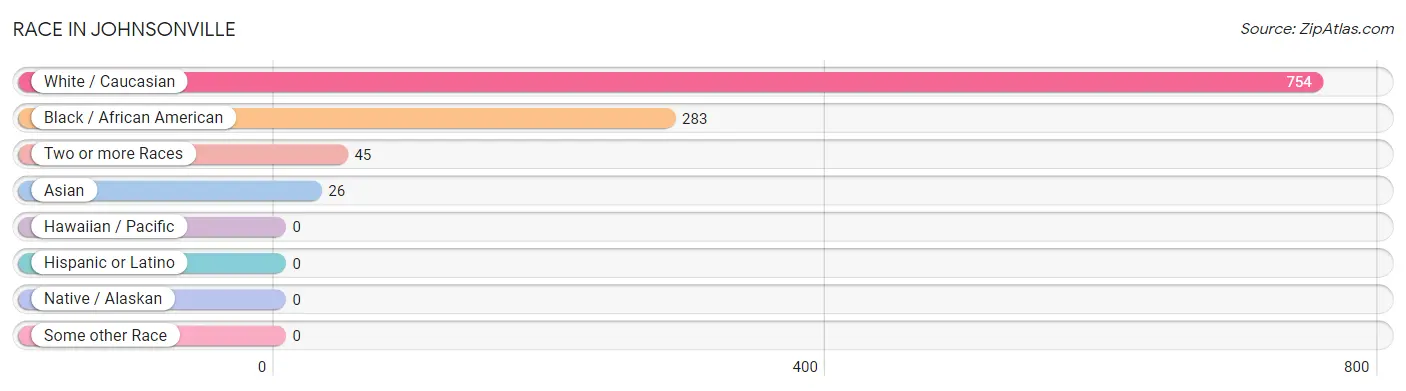
| Race | # Population | % Population |
| Asian | 26 | 2.4% |
| Black / African American | 283 | 25.5% |
| Hawaiian / Pacific | 0 | 0.0% |
| Hispanic or Latino | 0 | 0.0% |
| Native / Alaskan | 0 | 0.0% |
| White / Caucasian | 754 | 68.0% |
| Two or more Races | 45 | 4.1% |
| Some other Race | 0 | 0.0% |
| Total | 1,108 | 100.0% |
Ancestry in Johnsonville
The most populous ancestries reported in Johnsonville are English (177 | 16.0%), American (94 | 8.5%), Scotch-Irish (37 | 3.3%), Welsh (28 | 2.5%), and German (26 | 2.4%), together accounting for 32.7% of all Johnsonville residents.
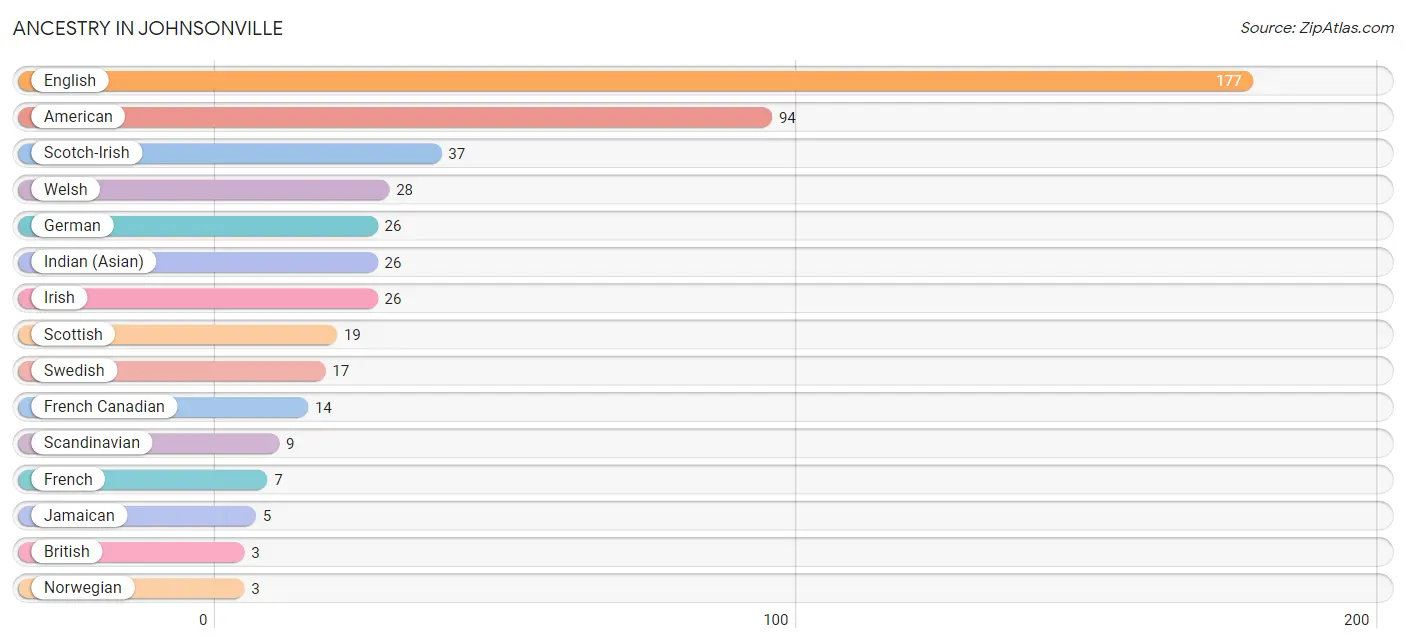
| Ancestry | # Population | % Population |
| African | 2 | 0.2% |
| American | 94 | 8.5% |
| British | 3 | 0.3% |
| English | 177 | 16.0% |
| French | 7 | 0.6% |
| French Canadian | 14 | 1.3% |
| German | 26 | 2.4% |
| Indian (Asian) | 26 | 2.4% |
| Irish | 26 | 2.4% |
| Jamaican | 5 | 0.4% |
| Norwegian | 3 | 0.3% |
| Scandinavian | 9 | 0.8% |
| Scotch-Irish | 37 | 3.3% |
| Scottish | 19 | 1.7% |
| Subsaharan African | 2 | 0.2% |
| Swedish | 17 | 1.5% |
| Welsh | 28 | 2.5% | View All 17 Rows |
Immigrants in Johnsonville
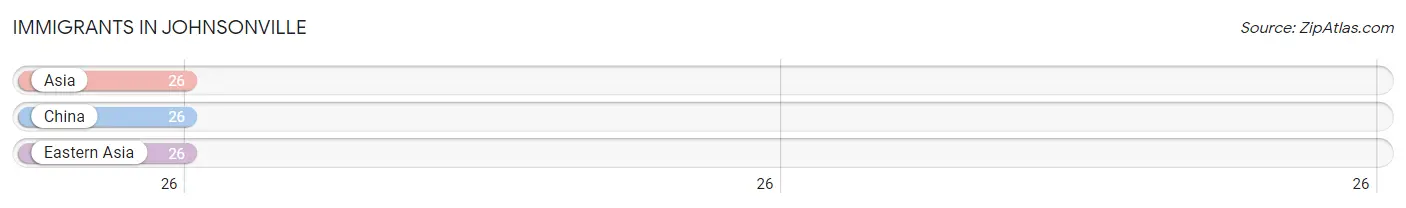
The most numerous immigrant groups reported in Johnsonville came from Asia (26 | 2.4%), China (26 | 2.4%), and Eastern Asia (26 | 2.4%), together accounting for 7.1% of all Johnsonville residents.
| Immigration Origin | # Population | % Population |
| Asia | 26 | 2.4% |
| China | 26 | 2.4% |
| Eastern Asia | 26 | 2.4% | View All 3 Rows |
Sex and Age in Johnsonville
Sex and Age in Johnsonville
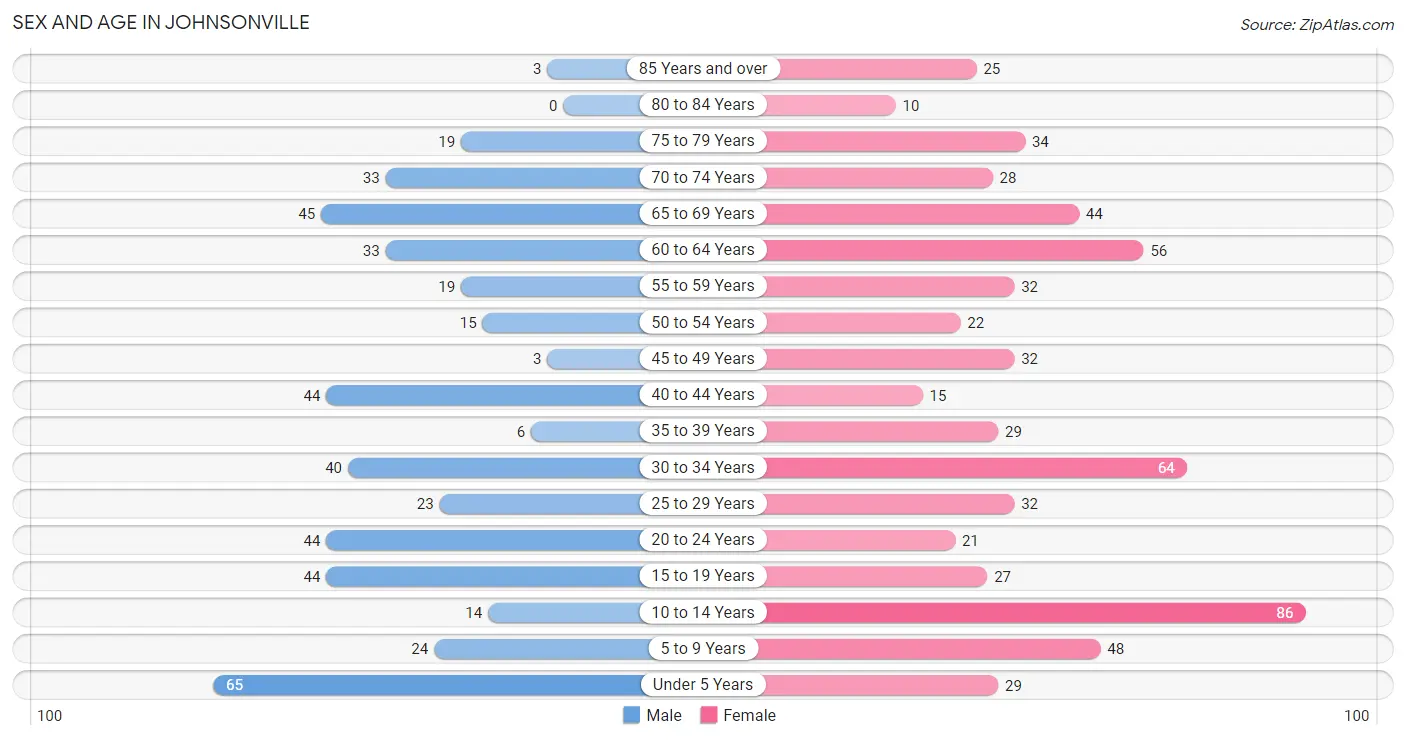
The most populous age groups in Johnsonville are Under 5 Years (65 | 13.7%) for men and 10 to 14 Years (86 | 13.6%) for women.
| Age Bracket | Male | Female |
| Under 5 Years | 65 (13.7%) | 29 (4.6%) |
| 5 to 9 Years | 24 (5.1%) | 48 (7.6%) |
| 10 to 14 Years | 14 (2.9%) | 86 (13.6%) |
| 15 to 19 Years | 44 (9.3%) | 27 (4.3%) |
| 20 to 24 Years | 44 (9.3%) | 21 (3.3%) |
| 25 to 29 Years | 23 (4.9%) | 32 (5.1%) |
| 30 to 34 Years | 40 (8.4%) | 64 (10.1%) |
| 35 to 39 Years | 6 (1.3%) | 29 (4.6%) |
| 40 to 44 Years | 44 (9.3%) | 15 (2.4%) |
| 45 to 49 Years | 3 (0.6%) | 32 (5.1%) |
| 50 to 54 Years | 15 (3.2%) | 22 (3.5%) |
| 55 to 59 Years | 19 (4.0%) | 32 (5.1%) |
| 60 to 64 Years | 33 (7.0%) | 56 (8.8%) |
| 65 to 69 Years | 45 (9.5%) | 44 (6.9%) |
| 70 to 74 Years | 33 (7.0%) | 28 (4.4%) |
| 75 to 79 Years | 19 (4.0%) | 34 (5.4%) |
| 80 to 84 Years | 0 (0.0%) | 10 (1.6%) |
| 85 Years and over | 3 (0.6%) | 25 (3.9%) |
| Total | 474 (100.0%) | 634 (100.0%) |
Families and Households in Johnsonville
Median Family Size in Johnsonville
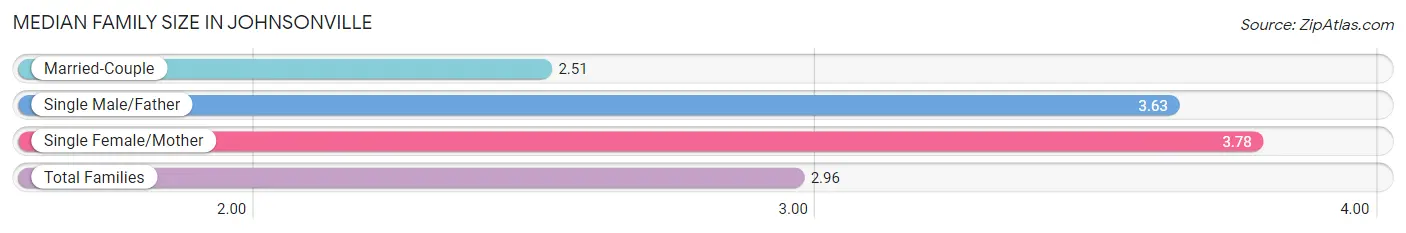
The median family size in Johnsonville is 2.96 persons per family, with single female/mother families (98 | 31.3%) accounting for the largest median family size of 3.78 persons per family. On the other hand, married-couple families (199 | 63.6%) represent the smallest median family size with 2.51 persons per family.
| Family Type | # Families | Family Size |
| Married-Couple | 199 (63.6%) | 2.51 |
| Single Male/Father | 16 (5.1%) | 3.63 |
| Single Female/Mother | 98 (31.3%) | 3.78 |
| Total Families | 313 (100.0%) | 2.96 |
Median Household Size in Johnsonville
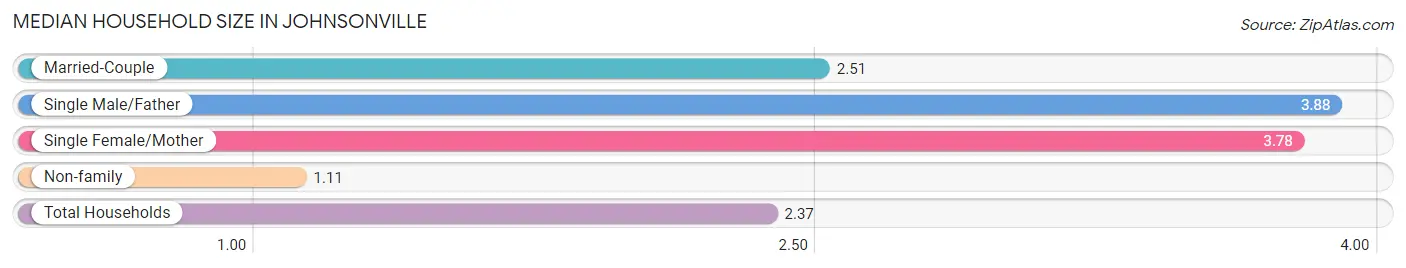
The median household size in Johnsonville is 2.37 persons per household, with single male/father households (16 | 3.5%) accounting for the largest median household size of 3.88 persons per household. non-family households (149 | 32.3%) represent the smallest median household size with 1.11 persons per household.
| Household Type | # Households | Household Size |
| Married-Couple | 199 (43.1%) | 2.51 |
| Single Male/Father | 16 (3.5%) | 3.88 |
| Single Female/Mother | 98 (21.2%) | 3.78 |
| Non-family | 149 (32.3%) | 1.11 |
| Total Households | 462 (100.0%) | 2.37 |
Household Size by Marriage Status in Johnsonville
Out of a total of 462 households in Johnsonville, 313 (67.7%) are family households, while 149 (32.3%) are nonfamily households. The most numerous type of family households are 2-person households, comprising 182, and the most common type of nonfamily households are 1-person households, comprising 138.
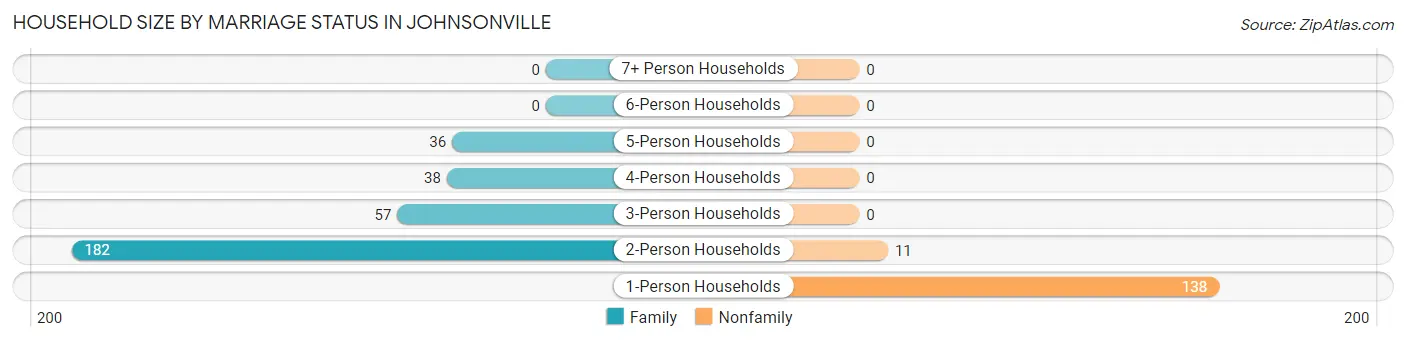
| Household Size | Family Households | Nonfamily Households |
| 1-Person Households | - | 138 (29.9%) |
| 2-Person Households | 182 (39.4%) | 11 (2.4%) |
| 3-Person Households | 57 (12.3%) | 0 (0.0%) |
| 4-Person Households | 38 (8.2%) | 0 (0.0%) |
| 5-Person Households | 36 (7.8%) | 0 (0.0%) |
| 6-Person Households | 0 (0.0%) | 0 (0.0%) |
| 7+ Person Households | 0 (0.0%) | 0 (0.0%) |
| Total | 313 (67.7%) | 149 (32.3%) |
Female Fertility in Johnsonville
Fertility by Age in Johnsonville
Average fertility rate in Johnsonville is 78.0 births per 1,000 women. Women in the age bracket of 20 to 34 years have the highest fertility rate with 154.0 births per 1,000 women. Women in the age bracket of 20 to 34 years acount for 100.0% of all women with births.
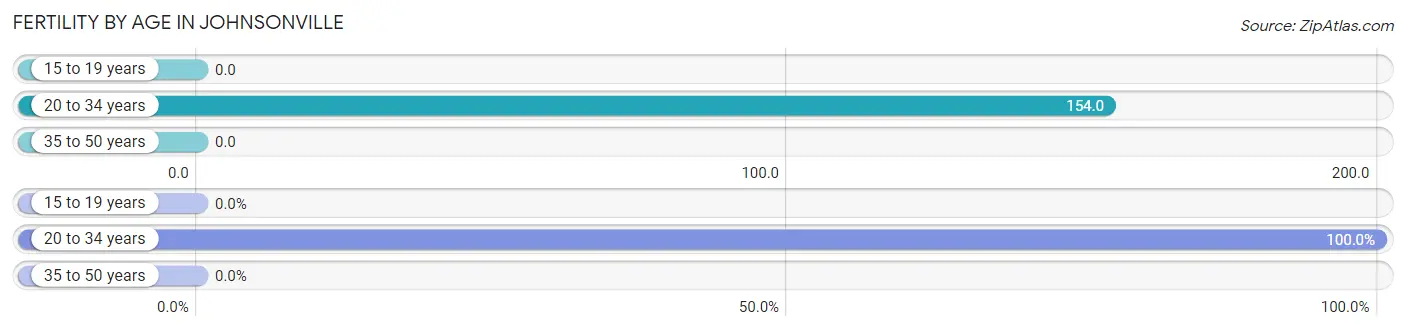
| Age Bracket | Women with Births | Births / 1,000 Women |
| 15 to 19 years | 0 (0.0%) | 0.0 |
| 20 to 34 years | 18 (100.0%) | 154.0 |
| 35 to 50 years | 0 (0.0%) | 0.0 |
| Total | 18 (100.0%) | 78.0 |
Fertility by Age by Marriage Status in Johnsonville
16.7% of women with births (18) in Johnsonville are married. The highest percentage of unmarried women with births falls into 20 to 34 years age bracket with 83.3% of them unmarried at the time of birth, while the lowest percentage of unmarried women with births belong to 20 to 34 years age bracket with 83.3% of them unmarried.
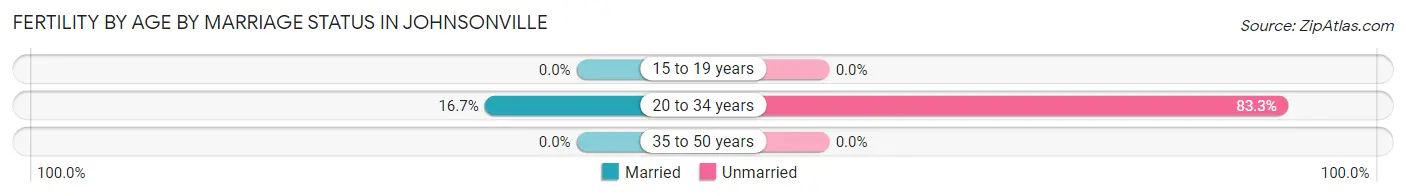
| Age Bracket | Married | Unmarried |
| 15 to 19 years | 0 (0.0%) | 0 (0.0%) |
| 20 to 34 years | 3 (16.7%) | 15 (83.3%) |
| 35 to 50 years | 0 (0.0%) | 0 (0.0%) |
| Total | 3 (16.7%) | 15 (83.3%) |
Fertility by Education in Johnsonville
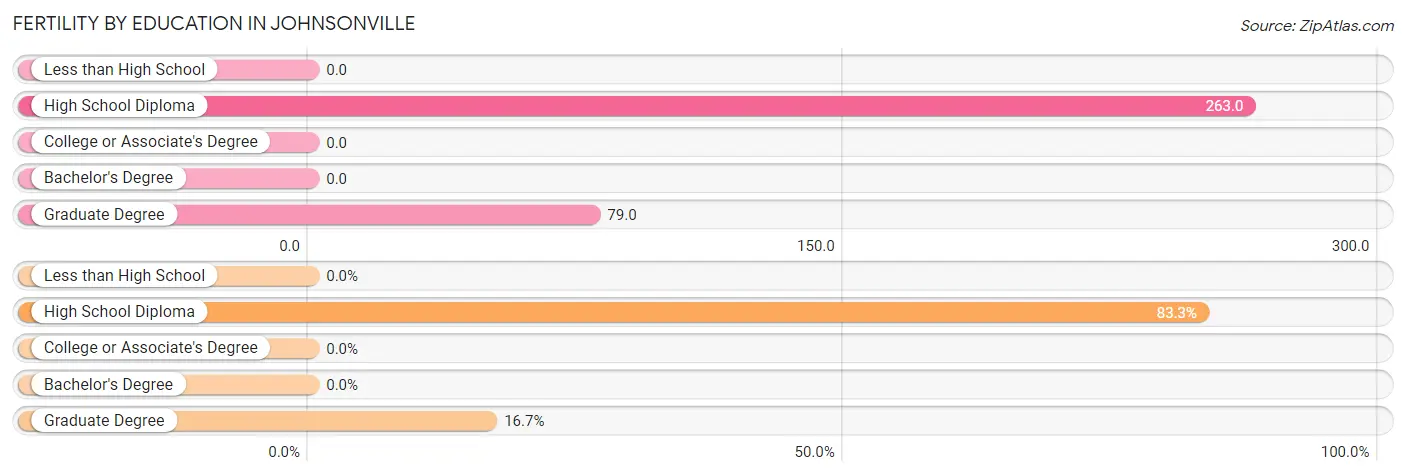
| Educational Attainment | Women with Births | Births / 1,000 Women |
| Less than High School | 0 (0.0%) | 0.0 |
| High School Diploma | 15 (83.3%) | 263.0 |
| College or Associate's Degree | 0 (0.0%) | 0.0 |
| Bachelor's Degree | 0 (0.0%) | 0.0 |
| Graduate Degree | 3 (16.7%) | 79.0 |
| Total | 18 (100.0%) | 78.0 |
Fertility by Education by Marriage Status in Johnsonville
83.3% of women with births in Johnsonville are unmarried. Women with the educational attainment of graduate degree are most likely to be married with 100.0% of them married at childbirth, while women with the educational attainment of high school diploma are least likely to be married with 100.0% of them unmarried at childbirth.
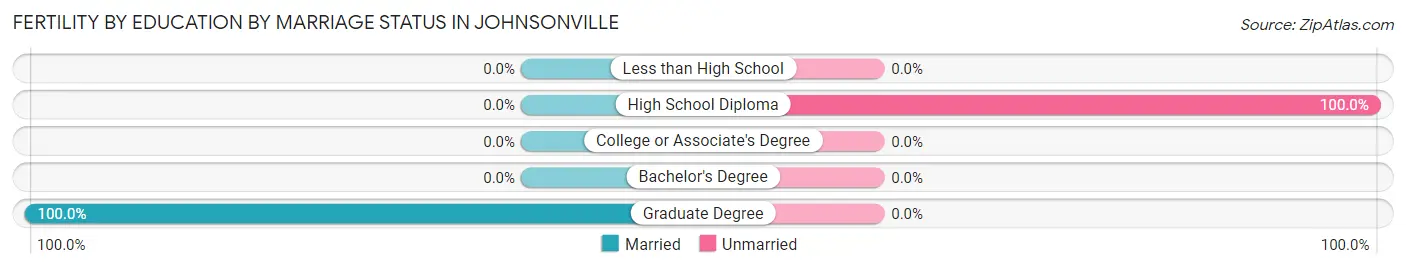
| Educational Attainment | Married | Unmarried |
| Less than High School | 0 (0.0%) | 0 (0.0%) |
| High School Diploma | 0 (0.0%) | 15 (100.0%) |
| College or Associate's Degree | 0 (0.0%) | 0 (0.0%) |
| Bachelor's Degree | 0 (0.0%) | 0 (0.0%) |
| Graduate Degree | 3 (100.0%) | 0 (0.0%) |
| Total | 3 (16.7%) | 15 (83.3%) |
Employment Characteristics in Johnsonville
Employment by Class of Employer in Johnsonville
Among the 406 employed individuals in Johnsonville, private company employees (300 | 73.9%), state government employees (45 | 11.1%), and not-for-profit organizations (22 | 5.4%) make up the most common classes of employment.
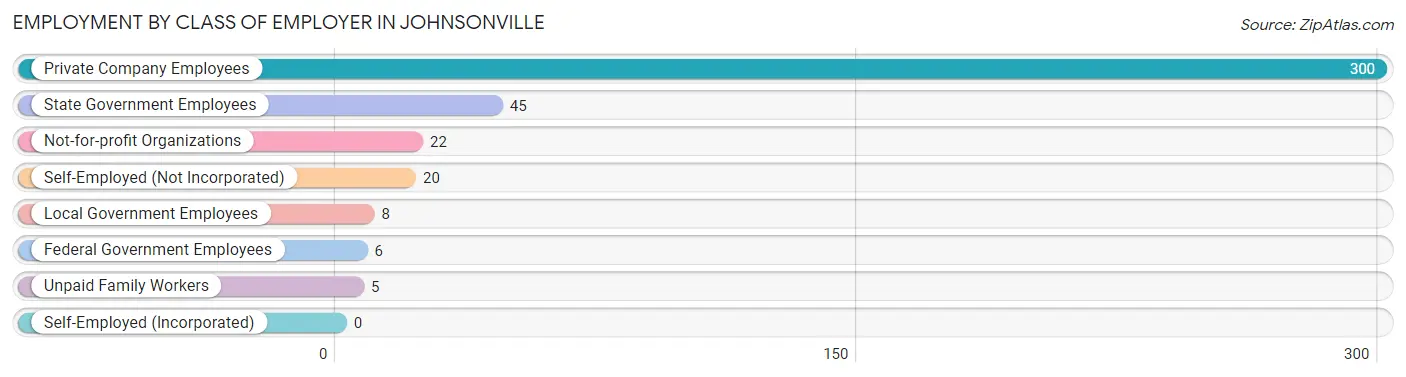
| Employer Class | # Employees | % Employees |
| Private Company Employees | 300 | 73.9% |
| Self-Employed (Incorporated) | 0 | 0.0% |
| Self-Employed (Not Incorporated) | 20 | 4.9% |
| Not-for-profit Organizations | 22 | 5.4% |
| Local Government Employees | 8 | 2.0% |
| State Government Employees | 45 | 11.1% |
| Federal Government Employees | 6 | 1.5% |
| Unpaid Family Workers | 5 | 1.2% |
| Total | 406 | 100.0% |
Employment Status by Age in Johnsonville
According to the labor force statistics for Johnsonville, out of the total population over 16 years of age (823), 51.0% or 420 individuals are in the labor force, with 3.3% or 14 of them unemployed. The age group with the highest labor force participation rate is 20 to 24 years, with 96.9% or 63 individuals in the labor force. Within the labor force, the 25 to 29 years age range has the highest percentage of unemployed individuals, with 14.9% or 7 of them being unemployed.
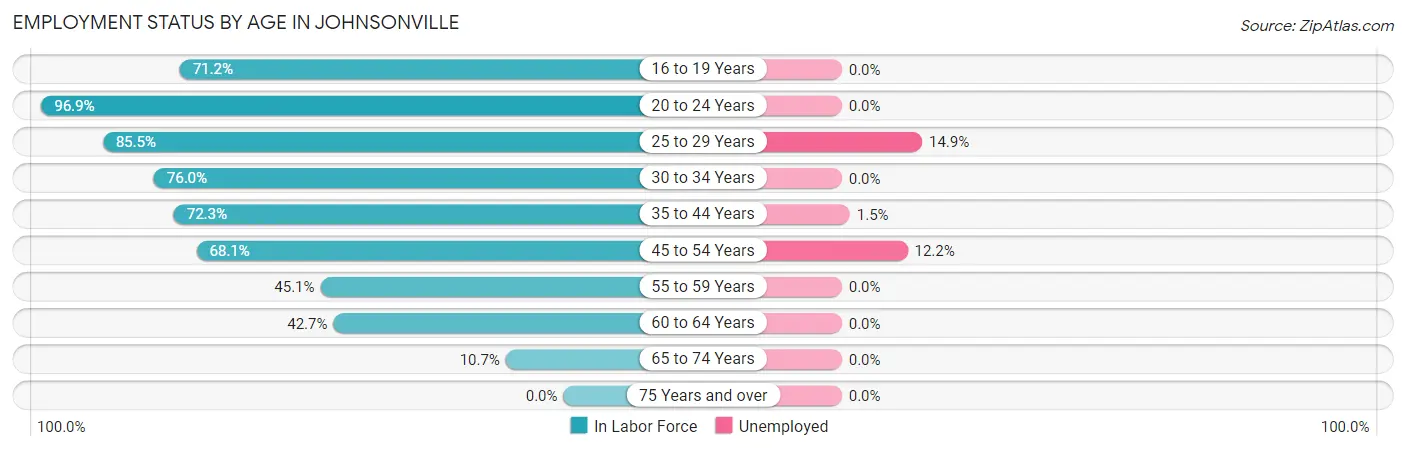
| Age Bracket | In Labor Force | Unemployed |
| 16 to 19 Years | 37 (71.2%) | 0 (0.0%) |
| 20 to 24 Years | 63 (96.9%) | 0 (0.0%) |
| 25 to 29 Years | 47 (85.5%) | 7 (14.9%) |
| 30 to 34 Years | 79 (76.0%) | 0 (0.0%) |
| 35 to 44 Years | 68 (72.3%) | 1 (1.5%) |
| 45 to 54 Years | 49 (68.1%) | 6 (12.2%) |
| 55 to 59 Years | 23 (45.1%) | 0 (0.0%) |
| 60 to 64 Years | 38 (42.7%) | 0 (0.0%) |
| 65 to 74 Years | 16 (10.7%) | 0 (0.0%) |
| 75 Years and over | 0 (0.0%) | 0 (0.0%) |
| Total | 420 (51.0%) | 14 (3.3%) |
Employment Status by Educational Attainment in Johnsonville
According to labor force statistics for Johnsonville, 65.4% of individuals (304) out of the total population between 25 and 64 years of age (465) are in the labor force, with 4.6% or 14 of them being unemployed. The group with the highest labor force participation rate are those with the educational attainment of college / associate degree, with 83.6% or 143 individuals in the labor force. Within the labor force, individuals with less than high school education have the highest percentage of unemployment, with 57.1% or 4 of them being unemployed.
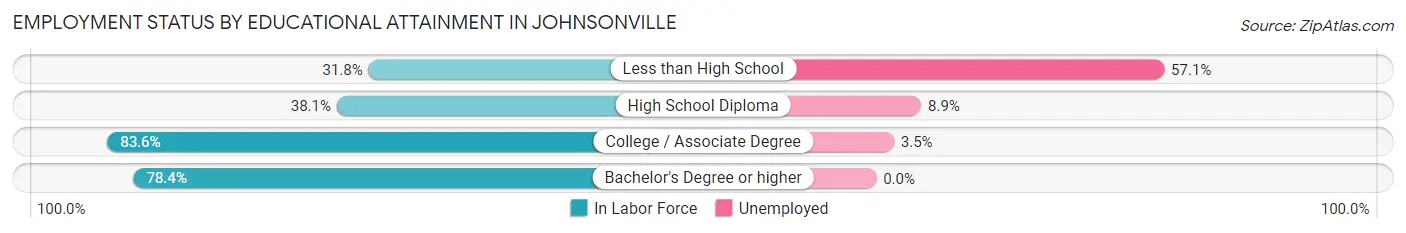
| Educational Attainment | In Labor Force | Unemployed |
| Less than High School | 7 (31.8%) | 13 (57.1%) |
| High School Diploma | 56 (38.1%) | 13 (8.9%) |
| College / Associate Degree | 143 (83.6%) | 6 (3.5%) |
| Bachelor's Degree or higher | 98 (78.4%) | 0 (0.0%) |
| Total | 304 (65.4%) | 21 (4.6%) |
Employment Occupations by Sex in Johnsonville
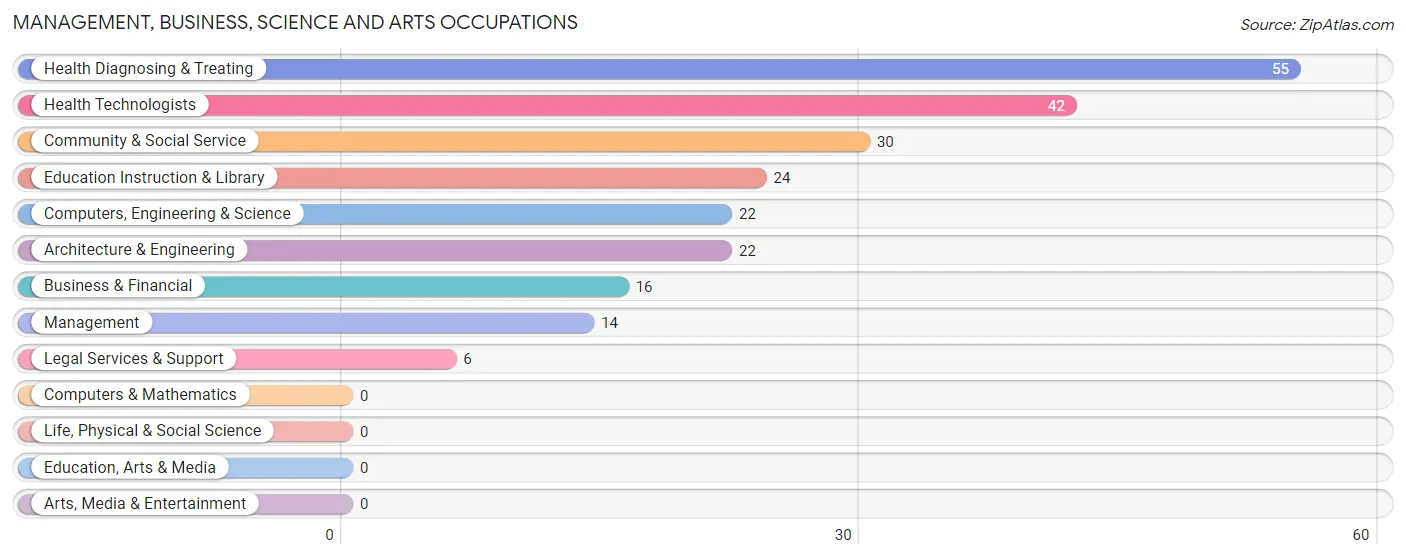
Management, Business, Science and Arts Occupations
The most common Management, Business, Science and Arts occupations in Johnsonville are Health Diagnosing & Treating (55 | 13.6%), Health Technologists (42 | 10.3%), Community & Social Service (30 | 7.4%), Education Instruction & Library (24 | 5.9%), and Computers, Engineering & Science (22 | 5.4%).
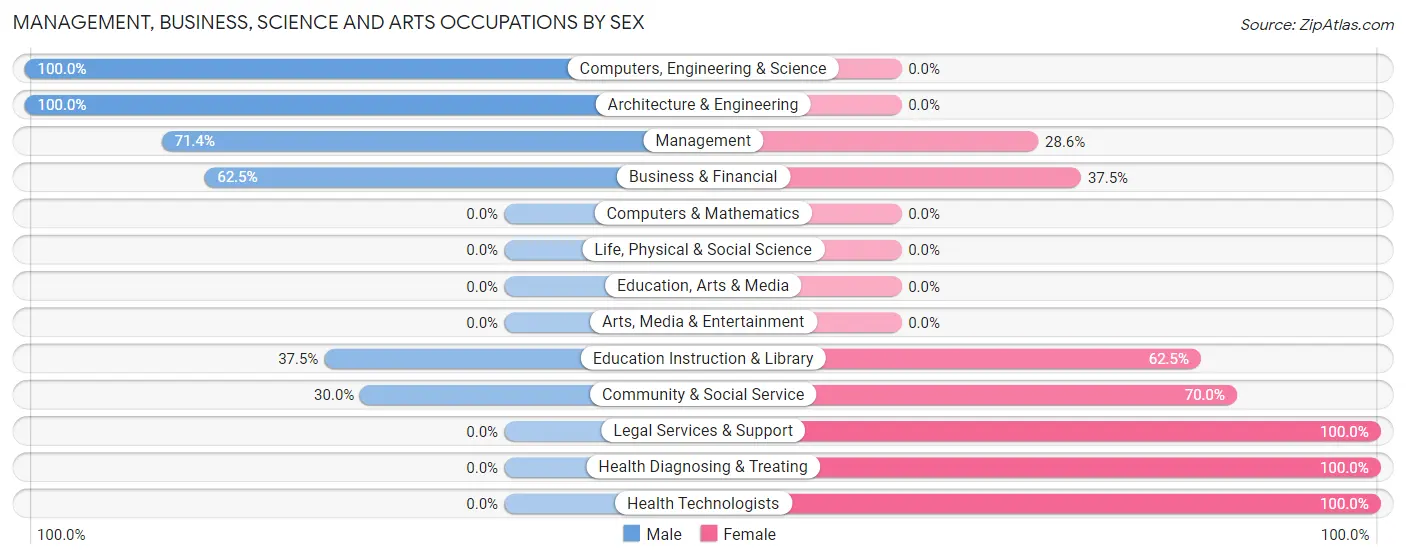
Management, Business, Science and Arts Occupations by Sex
Within the Management, Business, Science and Arts occupations in Johnsonville, the most male-oriented occupations are Computers, Engineering & Science (100.0%), Architecture & Engineering (100.0%), and Management (71.4%), while the most female-oriented occupations are Legal Services & Support (100.0%), Health Diagnosing & Treating (100.0%), and Health Technologists (100.0%).
| Occupation | Male | Female |
| Management | 10 (71.4%) | 4 (28.6%) |
| Business & Financial | 10 (62.5%) | 6 (37.5%) |
| Computers, Engineering & Science | 22 (100.0%) | 0 (0.0%) |
| Computers & Mathematics | 0 (0.0%) | 0 (0.0%) |
| Architecture & Engineering | 22 (100.0%) | 0 (0.0%) |
| Life, Physical & Social Science | 0 (0.0%) | 0 (0.0%) |
| Community & Social Service | 9 (30.0%) | 21 (70.0%) |
| Education, Arts & Media | 0 (0.0%) | 0 (0.0%) |
| Legal Services & Support | 0 (0.0%) | 6 (100.0%) |
| Education Instruction & Library | 9 (37.5%) | 15 (62.5%) |
| Arts, Media & Entertainment | 0 (0.0%) | 0 (0.0%) |
| Health Diagnosing & Treating | 0 (0.0%) | 55 (100.0%) |
| Health Technologists | 0 (0.0%) | 42 (100.0%) |
| Total (Category) | 51 (37.2%) | 86 (62.8%) |
| Total (Overall) | 197 (48.5%) | 209 (51.5%) |
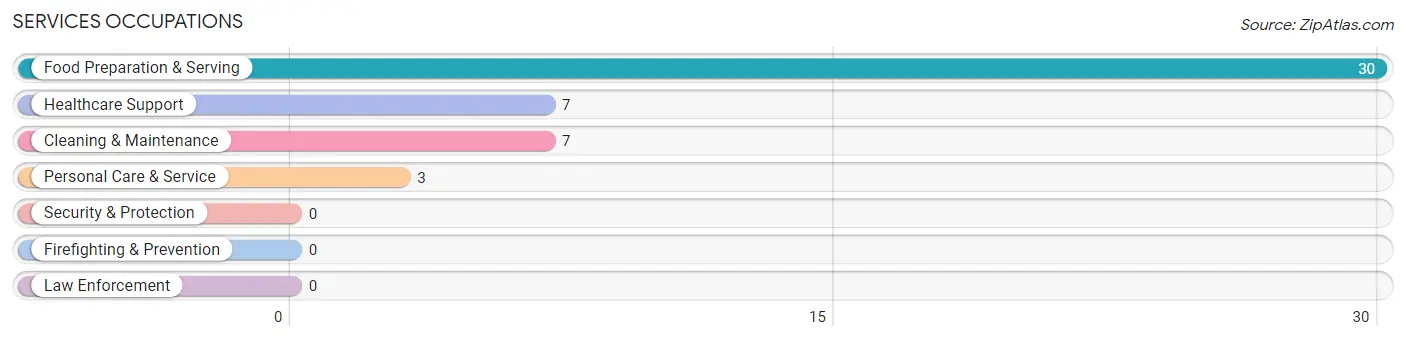
Services Occupations
The most common Services occupations in Johnsonville are Food Preparation & Serving (30 | 7.4%), Healthcare Support (7 | 1.7%), Cleaning & Maintenance (7 | 1.7%), and Personal Care & Service (3 | 0.7%).
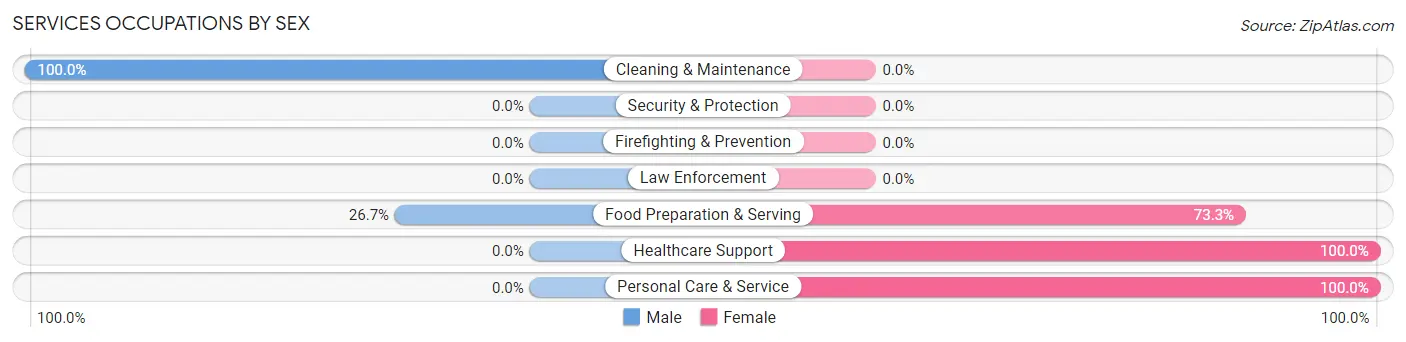
Services Occupations by Sex
Within the Services occupations in Johnsonville, the most male-oriented occupations are Cleaning & Maintenance (100.0%), and Food Preparation & Serving (26.7%), while the most female-oriented occupations are Healthcare Support (100.0%), Personal Care & Service (100.0%), and Food Preparation & Serving (73.3%).
| Occupation | Male | Female |
| Healthcare Support | 0 (0.0%) | 7 (100.0%) |
| Security & Protection | 0 (0.0%) | 0 (0.0%) |
| Firefighting & Prevention | 0 (0.0%) | 0 (0.0%) |
| Law Enforcement | 0 (0.0%) | 0 (0.0%) |
| Food Preparation & Serving | 8 (26.7%) | 22 (73.3%) |
| Cleaning & Maintenance | 7 (100.0%) | 0 (0.0%) |
| Personal Care & Service | 0 (0.0%) | 3 (100.0%) |
| Total (Category) | 15 (31.9%) | 32 (68.1%) |
| Total (Overall) | 197 (48.5%) | 209 (51.5%) |
Sales and Office Occupations
The most common Sales and Office occupations in Johnsonville are Office & Administration (60 | 14.8%), and Sales & Related (24 | 5.9%).

Sales and Office Occupations by Sex
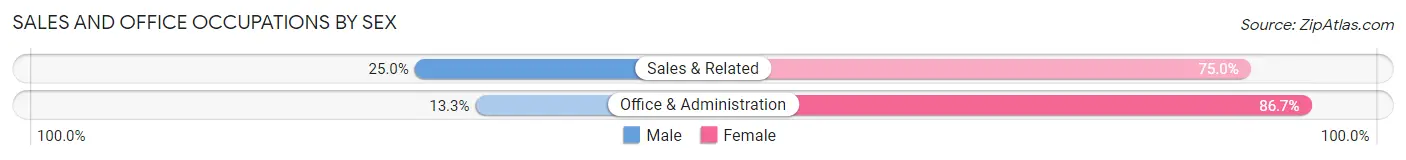
| Occupation | Male | Female |
| Sales & Related | 6 (25.0%) | 18 (75.0%) |
| Office & Administration | 8 (13.3%) | 52 (86.7%) |
| Total (Category) | 14 (16.7%) | 70 (83.3%) |
| Total (Overall) | 197 (48.5%) | 209 (51.5%) |
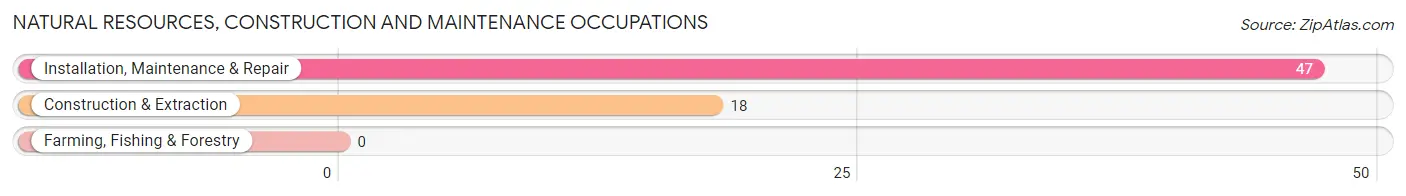
Natural Resources, Construction and Maintenance Occupations
The most common Natural Resources, Construction and Maintenance occupations in Johnsonville are Installation, Maintenance & Repair (47 | 11.6%), and Construction & Extraction (18 | 4.4%).
Natural Resources, Construction and Maintenance Occupations by Sex
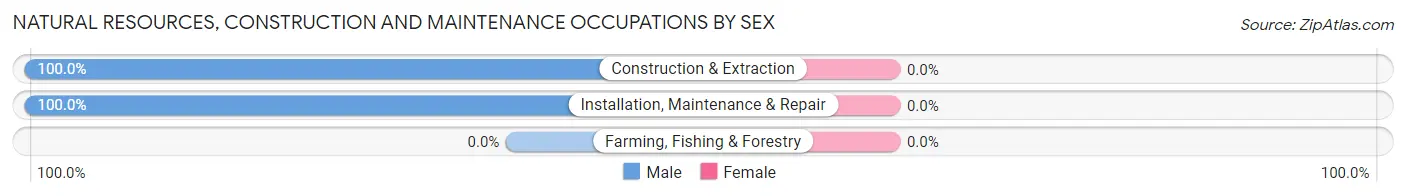
| Occupation | Male | Female |
| Farming, Fishing & Forestry | 0 (0.0%) | 0 (0.0%) |
| Construction & Extraction | 18 (100.0%) | 0 (0.0%) |
| Installation, Maintenance & Repair | 47 (100.0%) | 0 (0.0%) |
| Total (Category) | 65 (100.0%) | 0 (0.0%) |
| Total (Overall) | 197 (48.5%) | 209 (51.5%) |
Production, Transportation and Moving Occupations
The most common Production, Transportation and Moving occupations in Johnsonville are Production (52 | 12.8%), Transportation (15 | 3.7%), and Material Moving (6 | 1.5%).
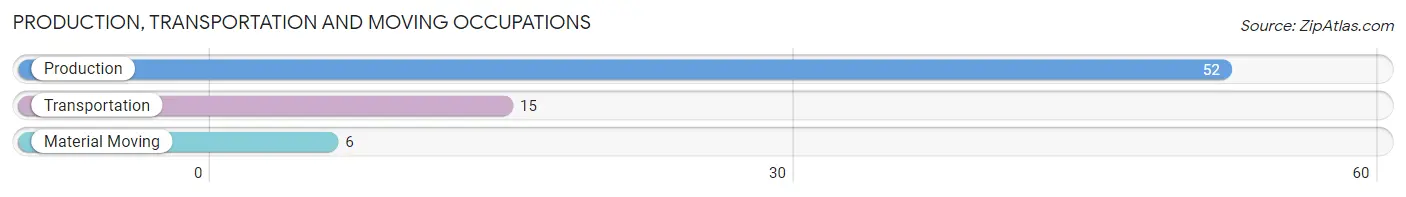
Production, Transportation and Moving Occupations by Sex
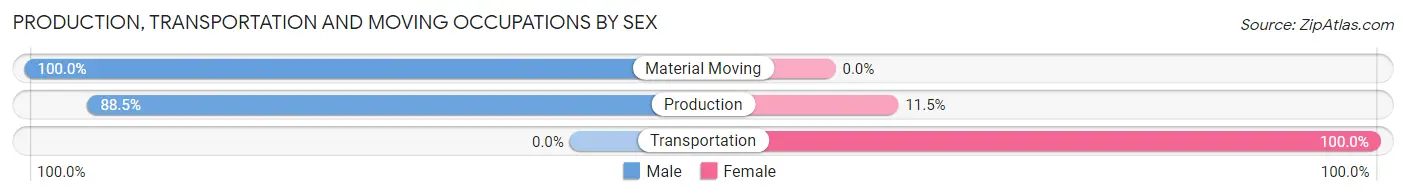
| Occupation | Male | Female |
| Production | 46 (88.5%) | 6 (11.5%) |
| Transportation | 0 (0.0%) | 15 (100.0%) |
| Material Moving | 6 (100.0%) | 0 (0.0%) |
| Total (Category) | 52 (71.2%) | 21 (28.8%) |
| Total (Overall) | 197 (48.5%) | 209 (51.5%) |
Employment Industries by Sex in Johnsonville
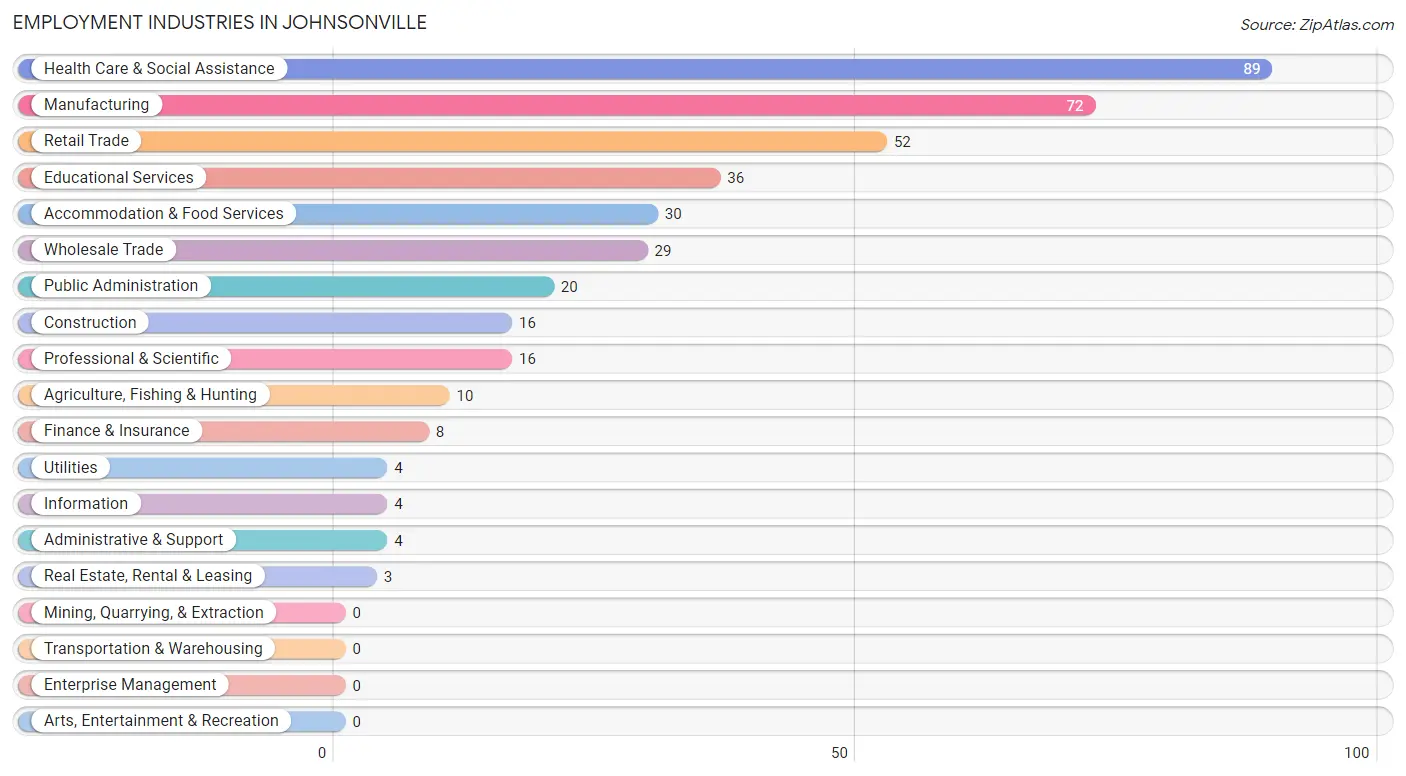
Employment Industries in Johnsonville
The major employment industries in Johnsonville include Health Care & Social Assistance (89 | 21.9%), Manufacturing (72 | 17.7%), Retail Trade (52 | 12.8%), Educational Services (36 | 8.9%), and Accommodation & Food Services (30 | 7.4%).
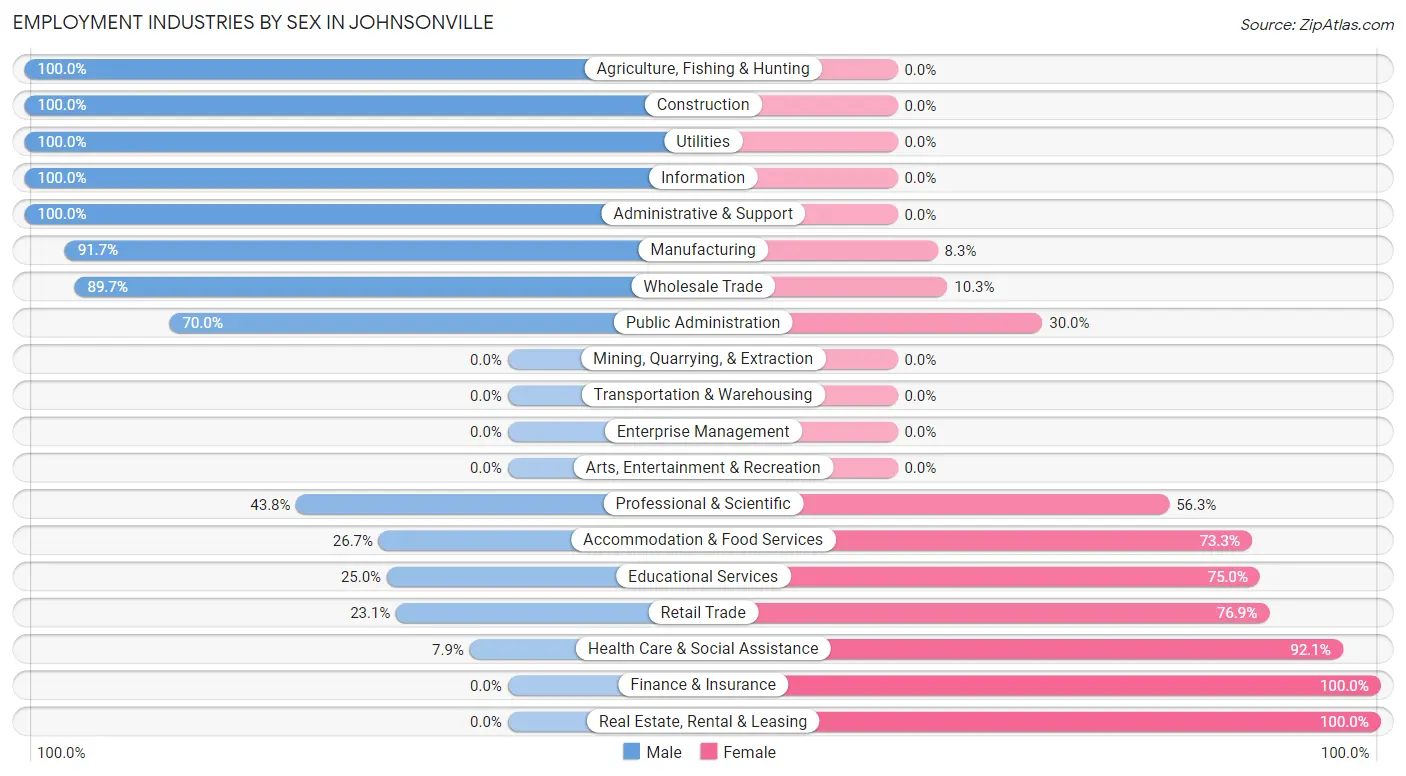
Employment Industries by Sex in Johnsonville
The Johnsonville industries that see more men than women are Agriculture, Fishing & Hunting (100.0%), Construction (100.0%), and Utilities (100.0%), whereas the industries that tend to have a higher number of women are Finance & Insurance (100.0%), Real Estate, Rental & Leasing (100.0%), and Health Care & Social Assistance (92.1%).
| Industry | Male | Female |
| Agriculture, Fishing & Hunting | 10 (100.0%) | 0 (0.0%) |
| Mining, Quarrying, & Extraction | 0 (0.0%) | 0 (0.0%) |
| Construction | 16 (100.0%) | 0 (0.0%) |
| Manufacturing | 66 (91.7%) | 6 (8.3%) |
| Wholesale Trade | 26 (89.7%) | 3 (10.3%) |
| Retail Trade | 12 (23.1%) | 40 (76.9%) |
| Transportation & Warehousing | 0 (0.0%) | 0 (0.0%) |
| Utilities | 4 (100.0%) | 0 (0.0%) |
| Information | 4 (100.0%) | 0 (0.0%) |
| Finance & Insurance | 0 (0.0%) | 8 (100.0%) |
| Real Estate, Rental & Leasing | 0 (0.0%) | 3 (100.0%) |
| Professional & Scientific | 7 (43.8%) | 9 (56.2%) |
| Enterprise Management | 0 (0.0%) | 0 (0.0%) |
| Administrative & Support | 4 (100.0%) | 0 (0.0%) |
| Educational Services | 9 (25.0%) | 27 (75.0%) |
| Health Care & Social Assistance | 7 (7.9%) | 82 (92.1%) |
| Arts, Entertainment & Recreation | 0 (0.0%) | 0 (0.0%) |
| Accommodation & Food Services | 8 (26.7%) | 22 (73.3%) |
| Public Administration | 14 (70.0%) | 6 (30.0%) |
| Total | 197 (48.5%) | 209 (51.5%) |
Education in Johnsonville
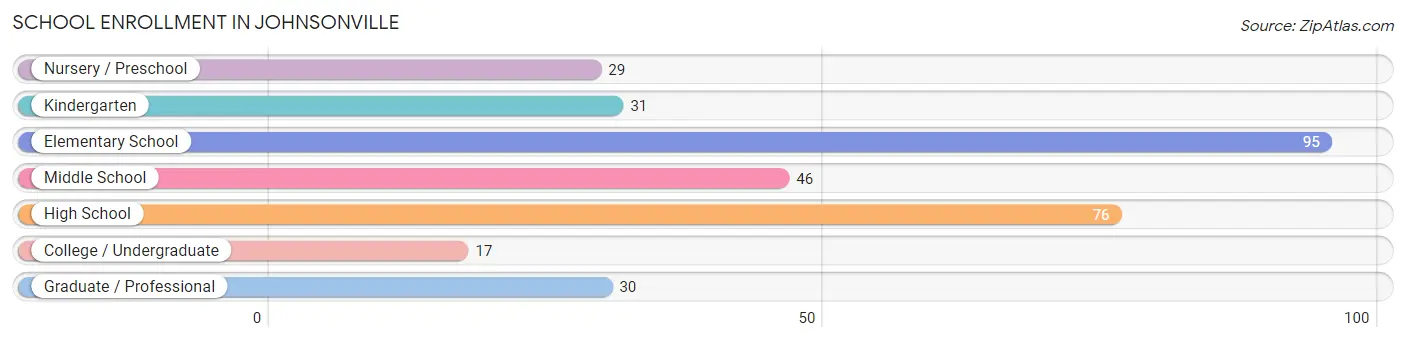
School Enrollment in Johnsonville
The most common levels of schooling among the 324 students in Johnsonville are elementary school (95 | 29.3%), high school (76 | 23.5%), and middle school (46 | 14.2%).
| School Level | # Students | % Students |
| Nursery / Preschool | 29 | 8.9% |
| Kindergarten | 31 | 9.6% |
| Elementary School | 95 | 29.3% |
| Middle School | 46 | 14.2% |
| High School | 76 | 23.5% |
| College / Undergraduate | 17 | 5.2% |
| Graduate / Professional | 30 | 9.3% |
| Total | 324 | 100.0% |
School Enrollment by Age by Funding Source in Johnsonville
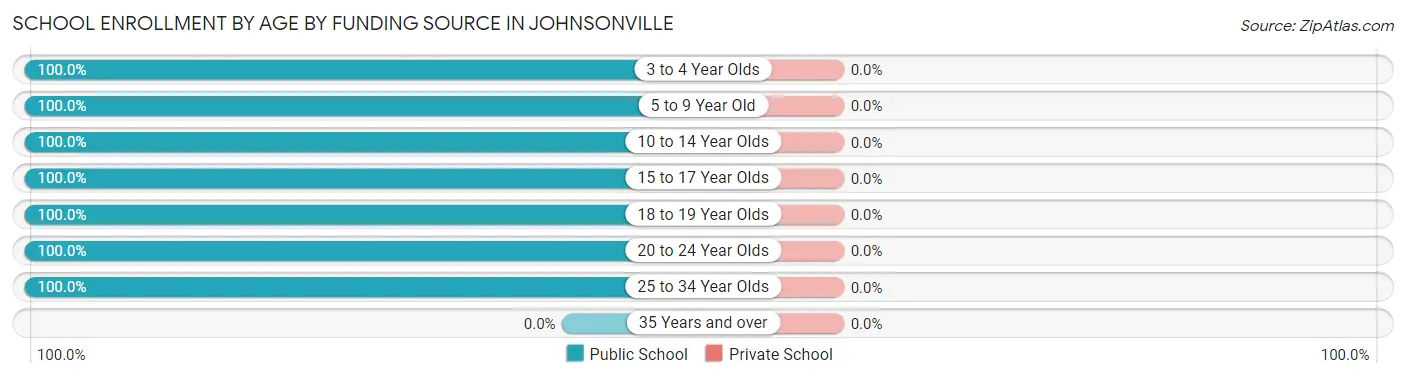
| Age Bracket | Public School | Private School |
| 3 to 4 Year Olds | 49 (100.0%) | 0 (0.0%) |
| 5 to 9 Year Old | 69 (100.0%) | 0 (0.0%) |
| 10 to 14 Year Olds | 100 (100.0%) | 0 (0.0%) |
| 15 to 17 Year Olds | 42 (100.0%) | 0 (0.0%) |
| 18 to 19 Year Olds | 25 (100.0%) | 0 (0.0%) |
| 20 to 24 Year Olds | 6 (100.0%) | 0 (0.0%) |
| 25 to 34 Year Olds | 33 (100.0%) | 0 (0.0%) |
| 35 Years and over | 0 (0.0%) | 0 (0.0%) |
| Total | 324 (100.0%) | 0 (0.0%) |
Educational Attainment by Field of Study in Johnsonville
Education (75 | 41.0%), engineering (24 | 13.1%), business (23 | 12.6%), bio, nature & agricultural (22 | 12.0%), and science & technology (15 | 8.2%) are the most common fields of study among 183 individuals in Johnsonville who have obtained a bachelor's degree or higher.
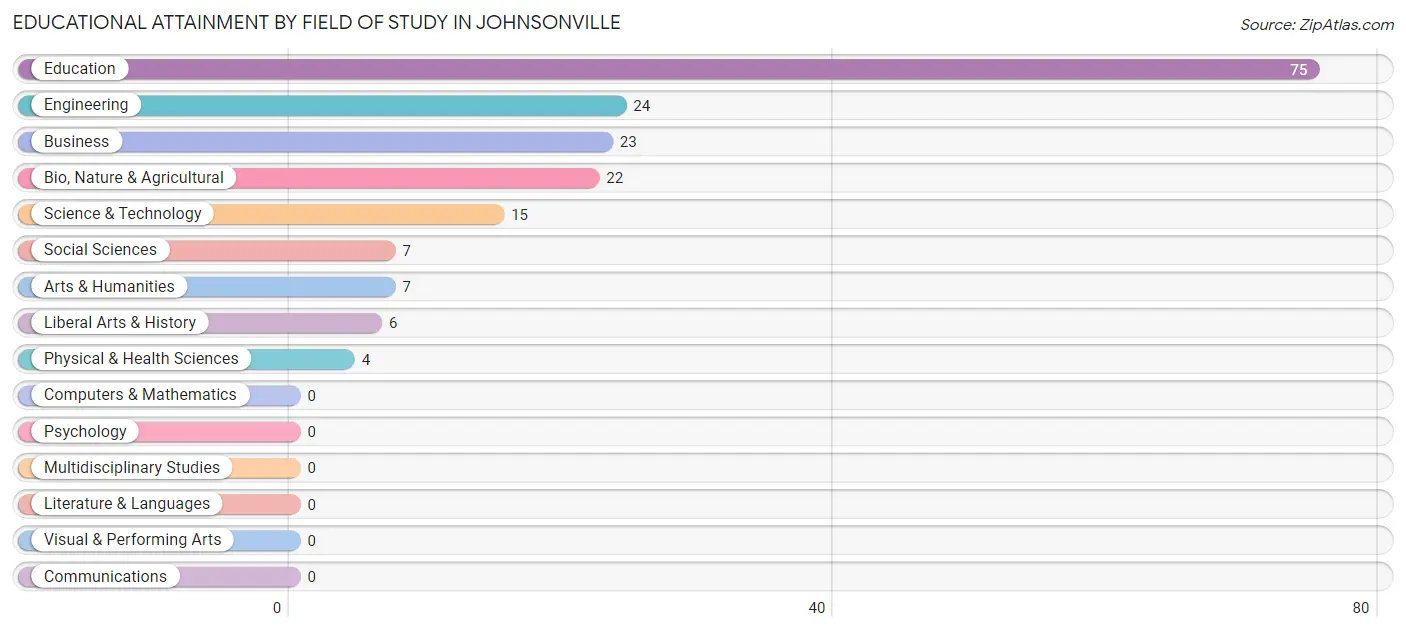
| Field of Study | # Graduates | % Graduates |
| Computers & Mathematics | 0 | 0.0% |
| Bio, Nature & Agricultural | 22 | 12.0% |
| Physical & Health Sciences | 4 | 2.2% |
| Psychology | 0 | 0.0% |
| Social Sciences | 7 | 3.8% |
| Engineering | 24 | 13.1% |
| Multidisciplinary Studies | 0 | 0.0% |
| Science & Technology | 15 | 8.2% |
| Business | 23 | 12.6% |
| Education | 75 | 41.0% |
| Literature & Languages | 0 | 0.0% |
| Liberal Arts & History | 6 | 3.3% |
| Visual & Performing Arts | 0 | 0.0% |
| Communications | 0 | 0.0% |
| Arts & Humanities | 7 | 3.8% |
| Total | 183 | 100.0% |
Transportation & Commute in Johnsonville
Vehicle Availability by Sex in Johnsonville
The most prevalent vehicle ownership categories in Johnsonville are males with 3 vehicles (85, accounting for 43.8%) and females with 3 vehicles (65, making up 40.7%).
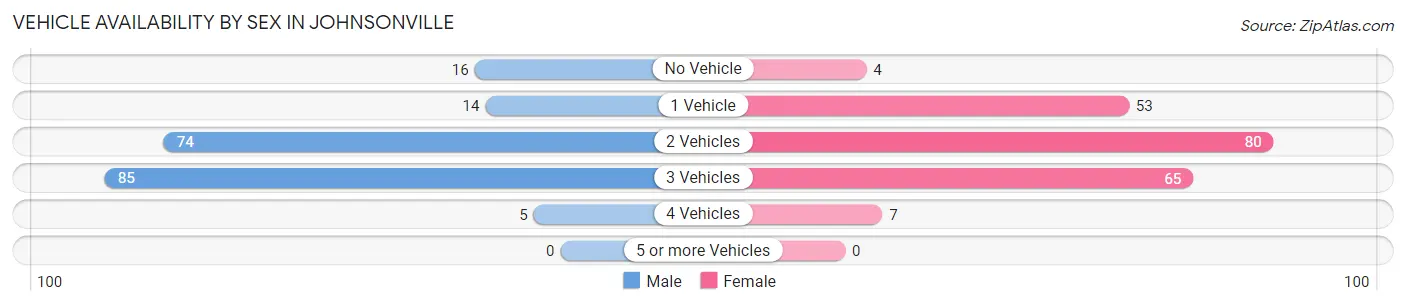
| Vehicles Available | Male | Female |
| No Vehicle | 16 (8.3%) | 4 (1.9%) |
| 1 Vehicle | 14 (7.2%) | 53 (25.4%) |
| 2 Vehicles | 74 (38.1%) | 80 (38.3%) |
| 3 Vehicles | 85 (43.8%) | 65 (31.1%) |
| 4 Vehicles | 5 (2.6%) | 7 (3.4%) |
| 5 or more Vehicles | 0 (0.0%) | 0 (0.0%) |
| Total | 194 (100.0%) | 209 (100.0%) |
Commute Time in Johnsonville
The most frequently occuring commute durations in Johnsonville are 5 to 9 minutes (79 commuters, 19.6%), 45 to 59 minutes (73 commuters, 18.1%), and 10 to 14 minutes (69 commuters, 17.1%).
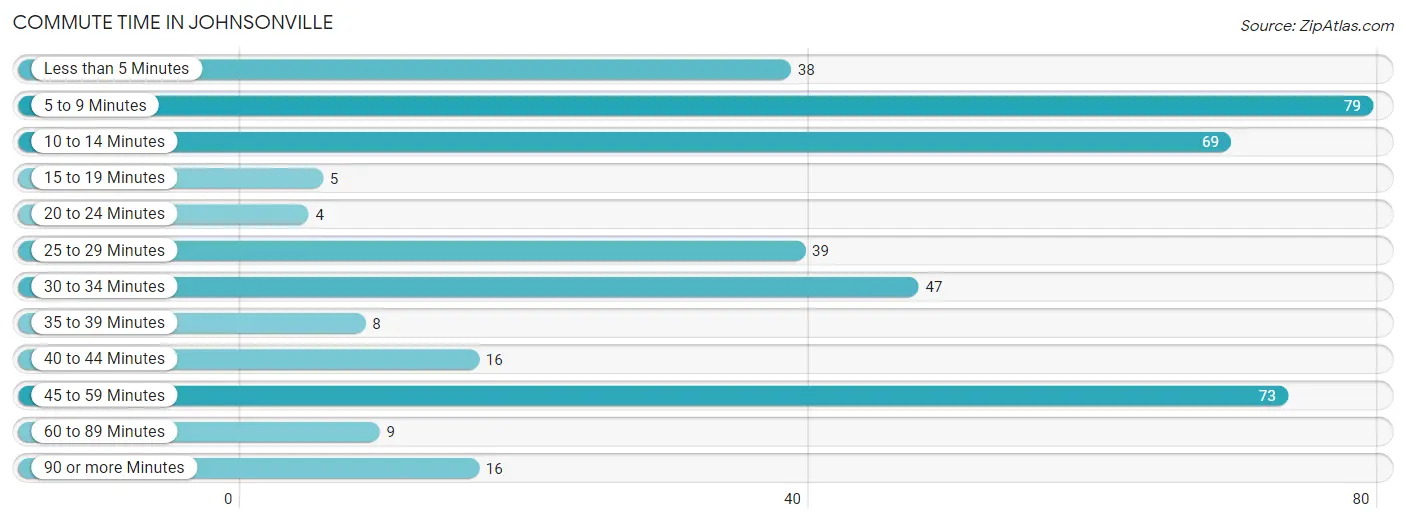
| Commute Time | # Commuters | % Commuters |
| Less than 5 Minutes | 38 | 9.4% |
| 5 to 9 Minutes | 79 | 19.6% |
| 10 to 14 Minutes | 69 | 17.1% |
| 15 to 19 Minutes | 5 | 1.2% |
| 20 to 24 Minutes | 4 | 1.0% |
| 25 to 29 Minutes | 39 | 9.7% |
| 30 to 34 Minutes | 47 | 11.7% |
| 35 to 39 Minutes | 8 | 2.0% |
| 40 to 44 Minutes | 16 | 4.0% |
| 45 to 59 Minutes | 73 | 18.1% |
| 60 to 89 Minutes | 9 | 2.2% |
| 90 or more Minutes | 16 | 4.0% |
Commute Time by Sex in Johnsonville
The most common commute times in Johnsonville are 5 to 9 minutes (39 commuters, 20.1%) for males and 5 to 9 minutes (40 commuters, 19.1%) for females.
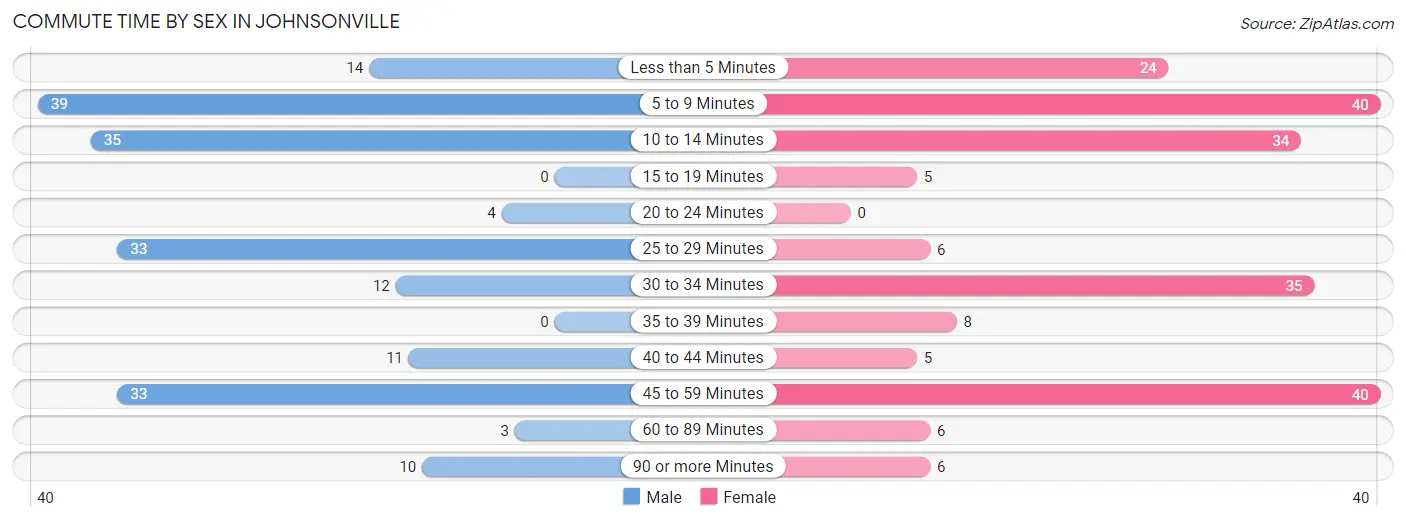
| Commute Time | Male | Female |
| Less than 5 Minutes | 14 (7.2%) | 24 (11.5%) |
| 5 to 9 Minutes | 39 (20.1%) | 40 (19.1%) |
| 10 to 14 Minutes | 35 (18.0%) | 34 (16.3%) |
| 15 to 19 Minutes | 0 (0.0%) | 5 (2.4%) |
| 20 to 24 Minutes | 4 (2.1%) | 0 (0.0%) |
| 25 to 29 Minutes | 33 (17.0%) | 6 (2.9%) |
| 30 to 34 Minutes | 12 (6.2%) | 35 (16.8%) |
| 35 to 39 Minutes | 0 (0.0%) | 8 (3.8%) |
| 40 to 44 Minutes | 11 (5.7%) | 5 (2.4%) |
| 45 to 59 Minutes | 33 (17.0%) | 40 (19.1%) |
| 60 to 89 Minutes | 3 (1.5%) | 6 (2.9%) |
| 90 or more Minutes | 10 (5.1%) | 6 (2.9%) |
Time of Departure to Work by Sex in Johnsonville
The most frequent times of departure to work in Johnsonville are 7:00 AM to 7:29 AM (38, 19.6%) for males and 7:00 AM to 7:29 AM (57, 27.3%) for females.
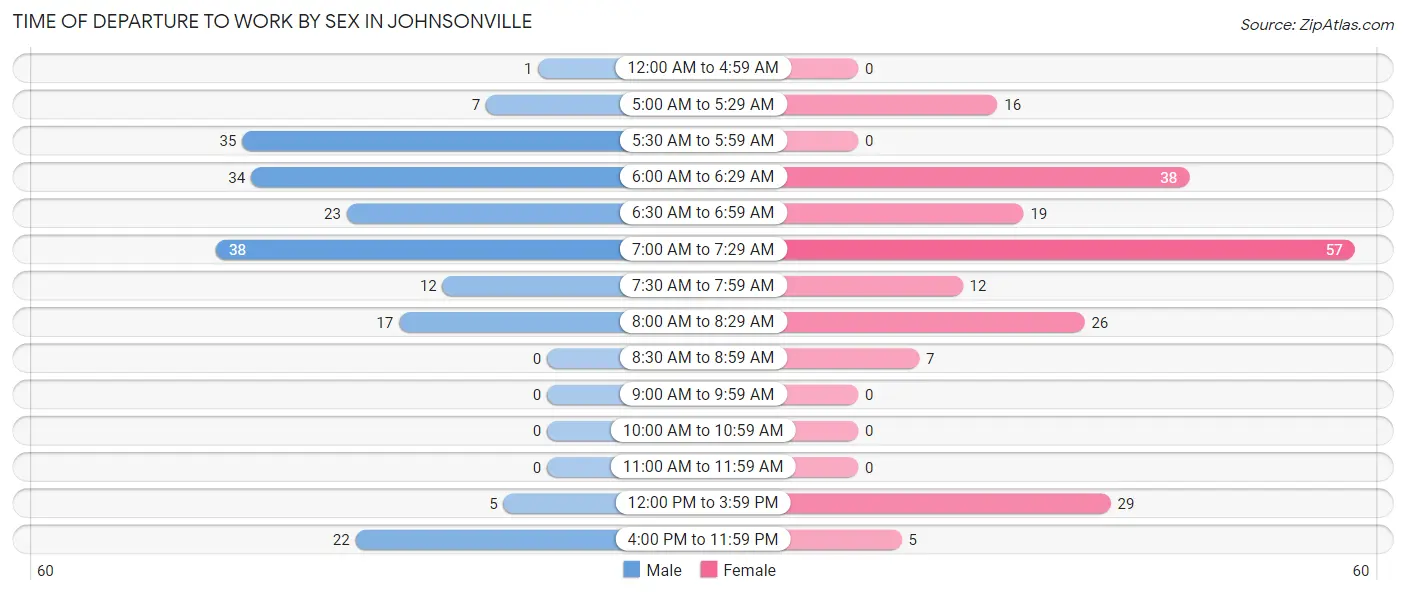
| Time of Departure | Male | Female |
| 12:00 AM to 4:59 AM | 1 (0.5%) | 0 (0.0%) |
| 5:00 AM to 5:29 AM | 7 (3.6%) | 16 (7.7%) |
| 5:30 AM to 5:59 AM | 35 (18.0%) | 0 (0.0%) |
| 6:00 AM to 6:29 AM | 34 (17.5%) | 38 (18.2%) |
| 6:30 AM to 6:59 AM | 23 (11.9%) | 19 (9.1%) |
| 7:00 AM to 7:29 AM | 38 (19.6%) | 57 (27.3%) |
| 7:30 AM to 7:59 AM | 12 (6.2%) | 12 (5.7%) |
| 8:00 AM to 8:29 AM | 17 (8.8%) | 26 (12.4%) |
| 8:30 AM to 8:59 AM | 0 (0.0%) | 7 (3.4%) |
| 9:00 AM to 9:59 AM | 0 (0.0%) | 0 (0.0%) |
| 10:00 AM to 10:59 AM | 0 (0.0%) | 0 (0.0%) |
| 11:00 AM to 11:59 AM | 0 (0.0%) | 0 (0.0%) |
| 12:00 PM to 3:59 PM | 5 (2.6%) | 29 (13.9%) |
| 4:00 PM to 11:59 PM | 22 (11.3%) | 5 (2.4%) |
| Total | 194 (100.0%) | 209 (100.0%) |
Housing Occupancy in Johnsonville
Occupancy by Ownership in Johnsonville
Of the total 462 dwellings in Johnsonville, owner-occupied units account for 314 (68.0%), while renter-occupied units make up 148 (32.0%).
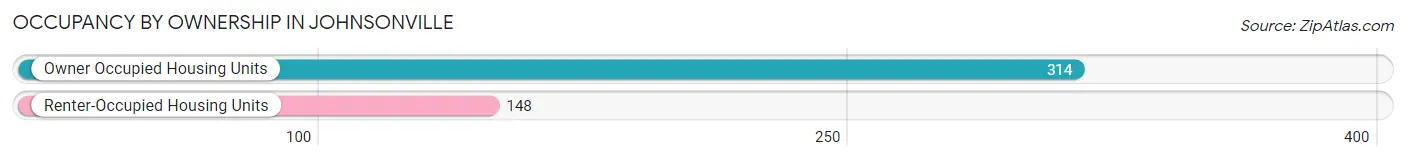
| Occupancy | # Housing Units | % Housing Units |
| Owner Occupied Housing Units | 314 | 68.0% |
| Renter-Occupied Housing Units | 148 | 32.0% |
| Total Occupied Housing Units | 462 | 100.0% |
Occupancy by Household Size in Johnsonville
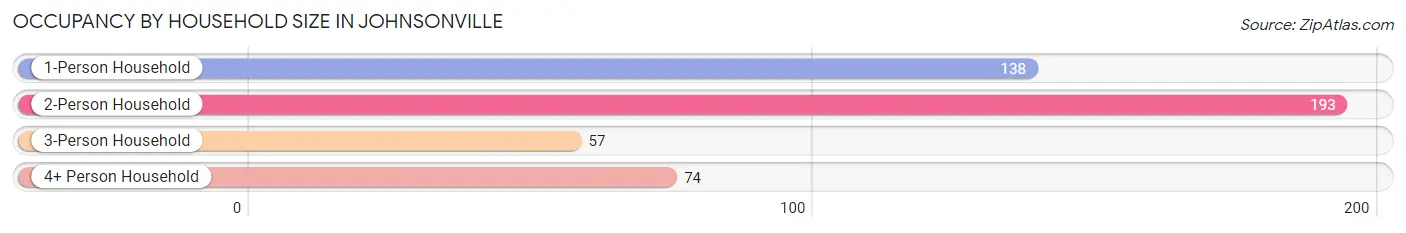
| Household Size | # Housing Units | % Housing Units |
| 1-Person Household | 138 | 29.9% |
| 2-Person Household | 193 | 41.8% |
| 3-Person Household | 57 | 12.3% |
| 4+ Person Household | 74 | 16.0% |
| Total Housing Units | 462 | 100.0% |
Occupancy by Ownership by Household Size in Johnsonville
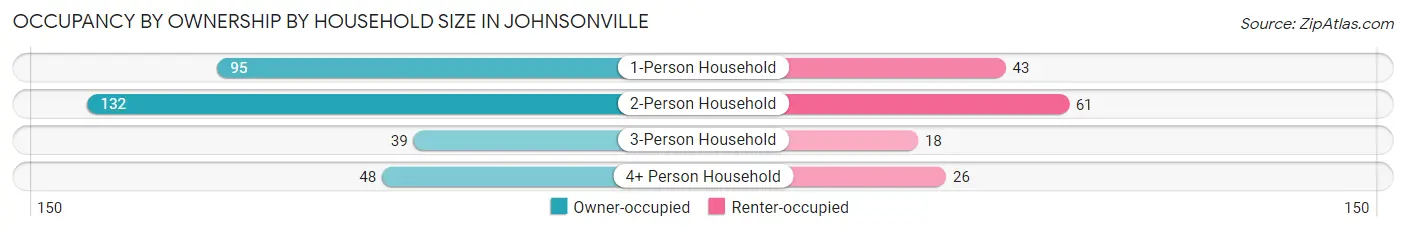
| Household Size | Owner-occupied | Renter-occupied |
| 1-Person Household | 95 (68.8%) | 43 (31.2%) |
| 2-Person Household | 132 (68.4%) | 61 (31.6%) |
| 3-Person Household | 39 (68.4%) | 18 (31.6%) |
| 4+ Person Household | 48 (64.9%) | 26 (35.1%) |
| Total Housing Units | 314 (68.0%) | 148 (32.0%) |
Occupancy by Educational Attainment in Johnsonville
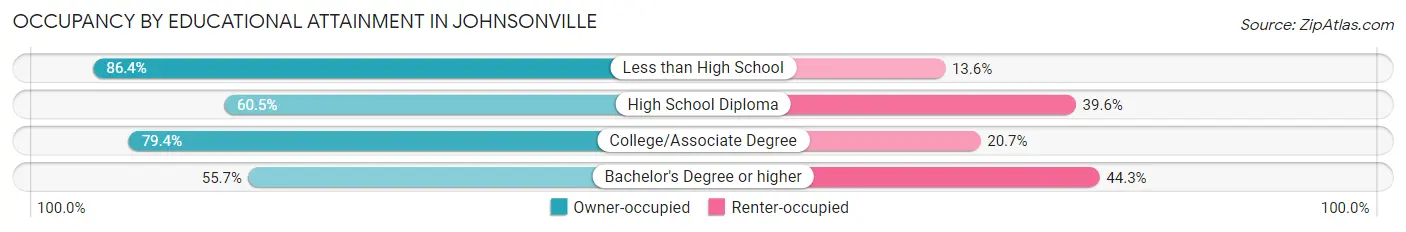
| Household Size | Owner-occupied | Renter-occupied |
| Less than High School | 19 (86.4%) | 3 (13.6%) |
| High School Diploma | 81 (60.5%) | 53 (39.6%) |
| College/Associate Degree | 146 (79.3%) | 38 (20.6%) |
| Bachelor's Degree or higher | 68 (55.7%) | 54 (44.3%) |
Occupancy by Age of Householder in Johnsonville
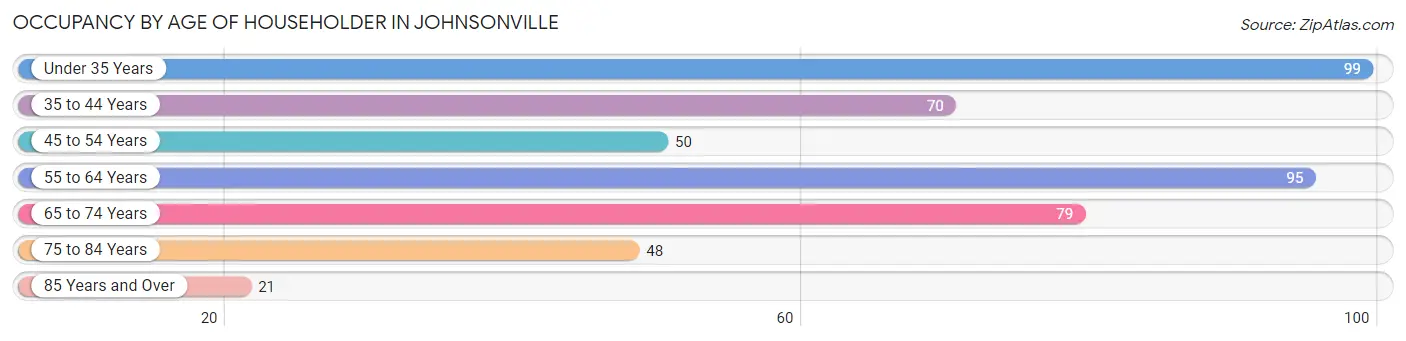
| Age Bracket | # Households | % Households |
| Under 35 Years | 99 | 21.4% |
| 35 to 44 Years | 70 | 15.1% |
| 45 to 54 Years | 50 | 10.8% |
| 55 to 64 Years | 95 | 20.6% |
| 65 to 74 Years | 79 | 17.1% |
| 75 to 84 Years | 48 | 10.4% |
| 85 Years and Over | 21 | 4.5% |
| Total | 462 | 100.0% |
Housing Finances in Johnsonville
Median Income by Occupancy in Johnsonville
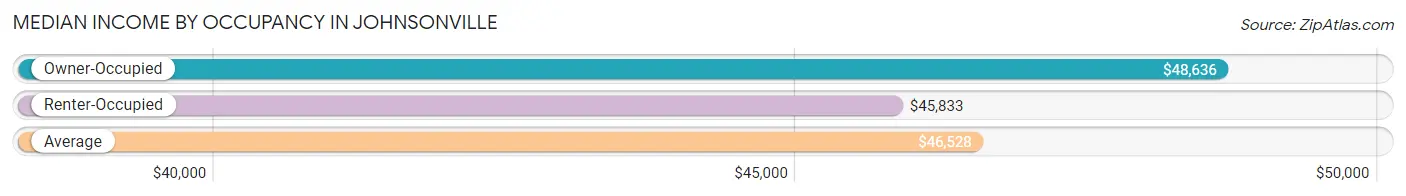
| Occupancy Type | # Households | Median Income |
| Owner-Occupied | 314 (68.0%) | $48,636 |
| Renter-Occupied | 148 (32.0%) | $45,833 |
| Average | 462 (100.0%) | $46,528 |
Occupancy by Householder Income Bracket in Johnsonville
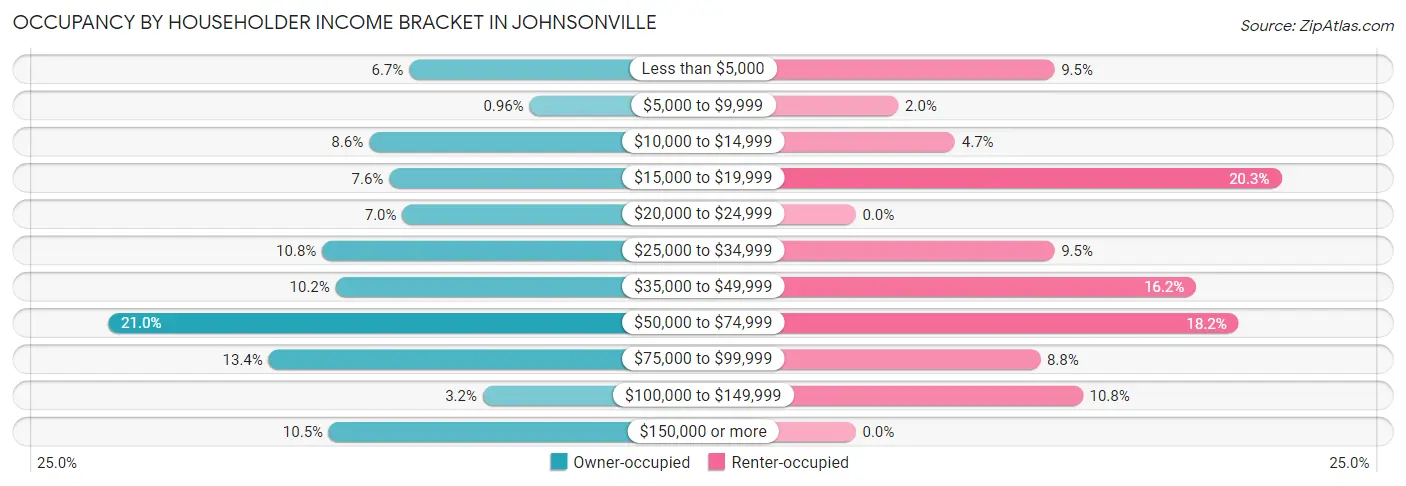
| Income Bracket | Owner-occupied | Renter-occupied |
| Less than $5,000 | 21 (6.7%) | 14 (9.5%) |
| $5,000 to $9,999 | 3 (1.0%) | 3 (2.0%) |
| $10,000 to $14,999 | 27 (8.6%) | 7 (4.7%) |
| $15,000 to $19,999 | 24 (7.6%) | 30 (20.3%) |
| $20,000 to $24,999 | 22 (7.0%) | 0 (0.0%) |
| $25,000 to $34,999 | 34 (10.8%) | 14 (9.5%) |
| $35,000 to $49,999 | 32 (10.2%) | 24 (16.2%) |
| $50,000 to $74,999 | 66 (21.0%) | 27 (18.2%) |
| $75,000 to $99,999 | 42 (13.4%) | 13 (8.8%) |
| $100,000 to $149,999 | 10 (3.2%) | 16 (10.8%) |
| $150,000 or more | 33 (10.5%) | 0 (0.0%) |
| Total | 314 (100.0%) | 148 (100.0%) |
Monthly Housing Cost Tiers in Johnsonville
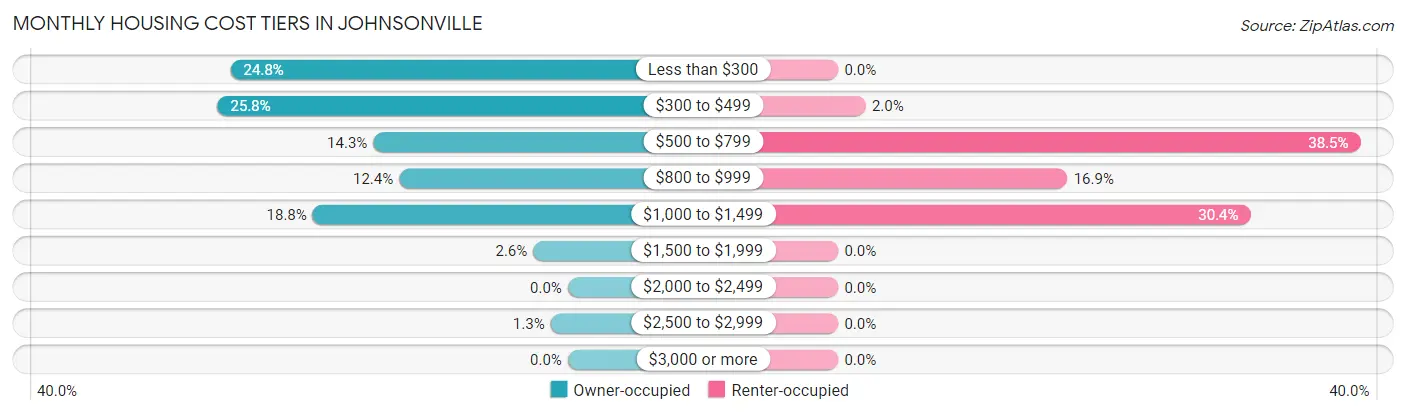
| Monthly Cost | Owner-occupied | Renter-occupied |
| Less than $300 | 78 (24.8%) | 0 (0.0%) |
| $300 to $499 | 81 (25.8%) | 3 (2.0%) |
| $500 to $799 | 45 (14.3%) | 57 (38.5%) |
| $800 to $999 | 39 (12.4%) | 25 (16.9%) |
| $1,000 to $1,499 | 59 (18.8%) | 45 (30.4%) |
| $1,500 to $1,999 | 8 (2.5%) | 0 (0.0%) |
| $2,000 to $2,499 | 0 (0.0%) | 0 (0.0%) |
| $2,500 to $2,999 | 4 (1.3%) | 0 (0.0%) |
| $3,000 or more | 0 (0.0%) | 0 (0.0%) |
| Total | 314 (100.0%) | 148 (100.0%) |
Physical Housing Characteristics in Johnsonville
Housing Structures in Johnsonville
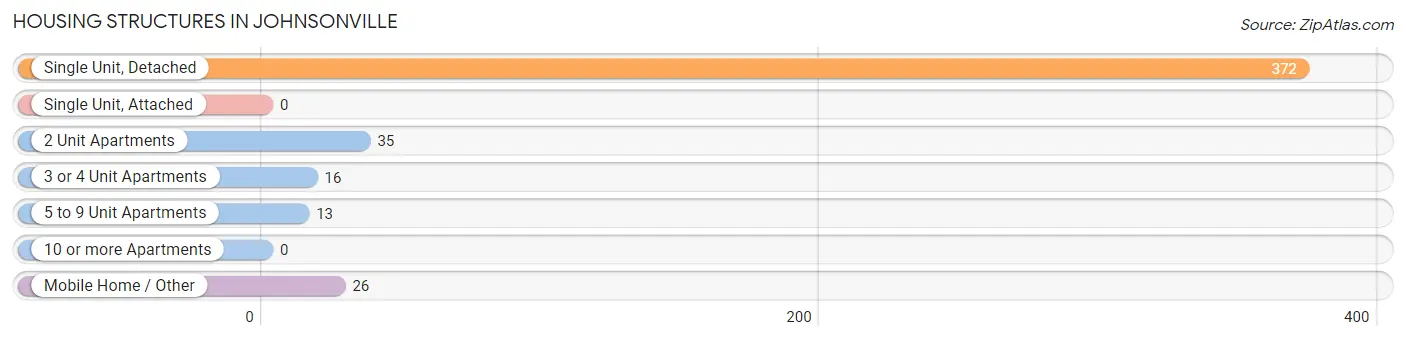
| Structure Type | # Housing Units | % Housing Units |
| Single Unit, Detached | 372 | 80.5% |
| Single Unit, Attached | 0 | 0.0% |
| 2 Unit Apartments | 35 | 7.6% |
| 3 or 4 Unit Apartments | 16 | 3.5% |
| 5 to 9 Unit Apartments | 13 | 2.8% |
| 10 or more Apartments | 0 | 0.0% |
| Mobile Home / Other | 26 | 5.6% |
| Total | 462 | 100.0% |
Housing Structures by Occupancy in Johnsonville
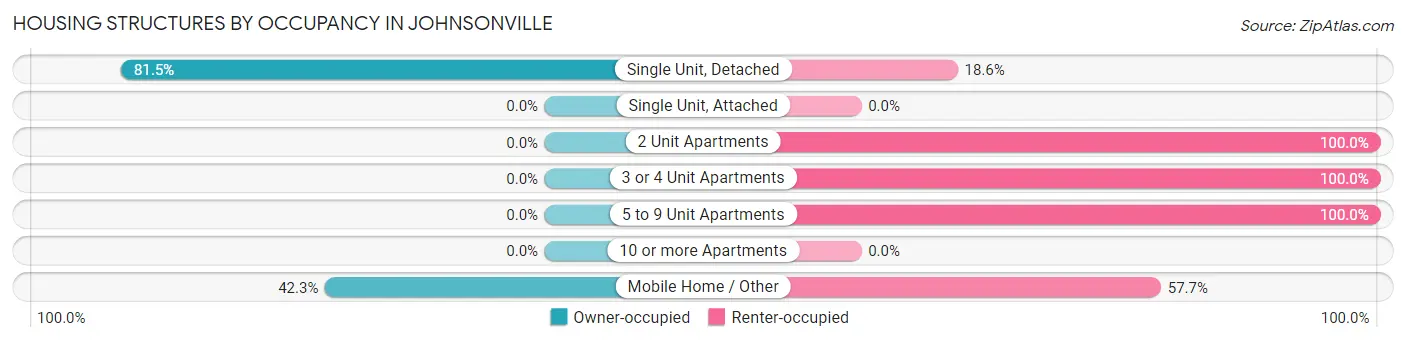
| Structure Type | Owner-occupied | Renter-occupied |
| Single Unit, Detached | 303 (81.5%) | 69 (18.5%) |
| Single Unit, Attached | 0 (0.0%) | 0 (0.0%) |
| 2 Unit Apartments | 0 (0.0%) | 35 (100.0%) |
| 3 or 4 Unit Apartments | 0 (0.0%) | 16 (100.0%) |
| 5 to 9 Unit Apartments | 0 (0.0%) | 13 (100.0%) |
| 10 or more Apartments | 0 (0.0%) | 0 (0.0%) |
| Mobile Home / Other | 11 (42.3%) | 15 (57.7%) |
| Total | 314 (68.0%) | 148 (32.0%) |
Housing Structures by Number of Rooms in Johnsonville
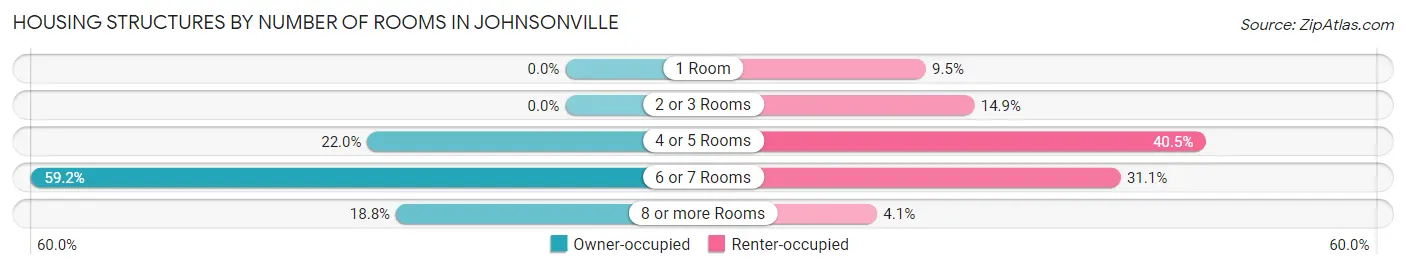
| Number of Rooms | Owner-occupied | Renter-occupied |
| 1 Room | 0 (0.0%) | 14 (9.5%) |
| 2 or 3 Rooms | 0 (0.0%) | 22 (14.9%) |
| 4 or 5 Rooms | 69 (22.0%) | 60 (40.5%) |
| 6 or 7 Rooms | 186 (59.2%) | 46 (31.1%) |
| 8 or more Rooms | 59 (18.8%) | 6 (4.1%) |
| Total | 314 (100.0%) | 148 (100.0%) |
Housing Structure by Heating Type in Johnsonville
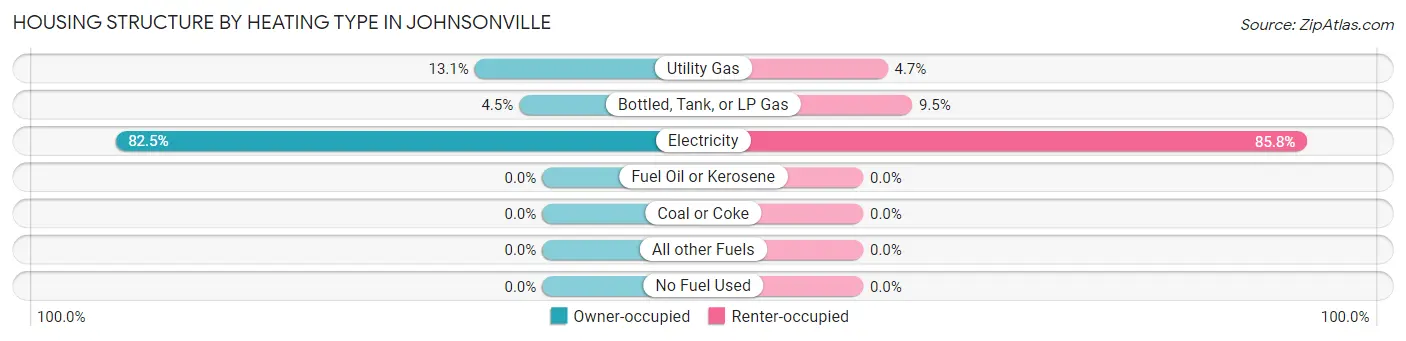
| Heating Type | Owner-occupied | Renter-occupied |
| Utility Gas | 41 (13.1%) | 7 (4.7%) |
| Bottled, Tank, or LP Gas | 14 (4.5%) | 14 (9.5%) |
| Electricity | 259 (82.5%) | 127 (85.8%) |
| Fuel Oil or Kerosene | 0 (0.0%) | 0 (0.0%) |
| Coal or Coke | 0 (0.0%) | 0 (0.0%) |
| All other Fuels | 0 (0.0%) | 0 (0.0%) |
| No Fuel Used | 0 (0.0%) | 0 (0.0%) |
| Total | 314 (100.0%) | 148 (100.0%) |
Household Vehicle Usage in Johnsonville
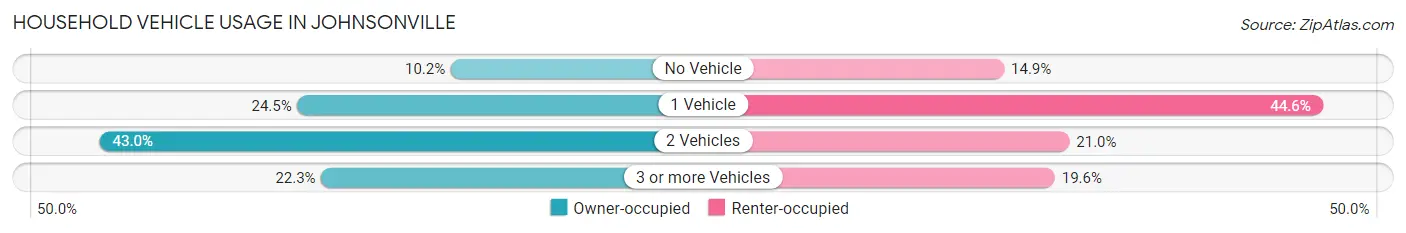
| Vehicles per Household | Owner-occupied | Renter-occupied |
| No Vehicle | 32 (10.2%) | 22 (14.9%) |
| 1 Vehicle | 77 (24.5%) | 66 (44.6%) |
| 2 Vehicles | 135 (43.0%) | 31 (20.9%) |
| 3 or more Vehicles | 70 (22.3%) | 29 (19.6%) |
| Total | 314 (100.0%) | 148 (100.0%) |
Real Estate & Mortgages in Johnsonville
Real Estate and Mortgage Overview in Johnsonville
| Characteristic | Without Mortgage | With Mortgage |
| Housing Units | 185 | 129 |
| Median Property Value | $83,400 | $136,400 |
| Median Household Income | $33,274 | $20 |
| Monthly Housing Costs | $329 | $0 |
| Real Estate Taxes | $433 | $0 |
Property Value by Mortgage Status in Johnsonville
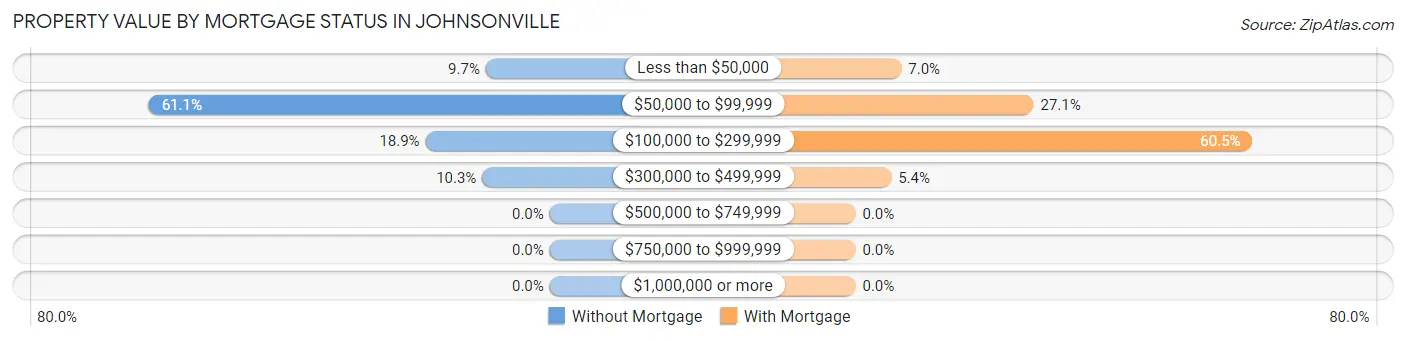
| Property Value | Without Mortgage | With Mortgage |
| Less than $50,000 | 18 (9.7%) | 9 (7.0%) |
| $50,000 to $99,999 | 113 (61.1%) | 35 (27.1%) |
| $100,000 to $299,999 | 35 (18.9%) | 78 (60.5%) |
| $300,000 to $499,999 | 19 (10.3%) | 7 (5.4%) |
| $500,000 to $749,999 | 0 (0.0%) | 0 (0.0%) |
| $750,000 to $999,999 | 0 (0.0%) | 0 (0.0%) |
| $1,000,000 or more | 0 (0.0%) | 0 (0.0%) |
| Total | 185 (100.0%) | 129 (100.0%) |
Household Income by Mortgage Status in Johnsonville
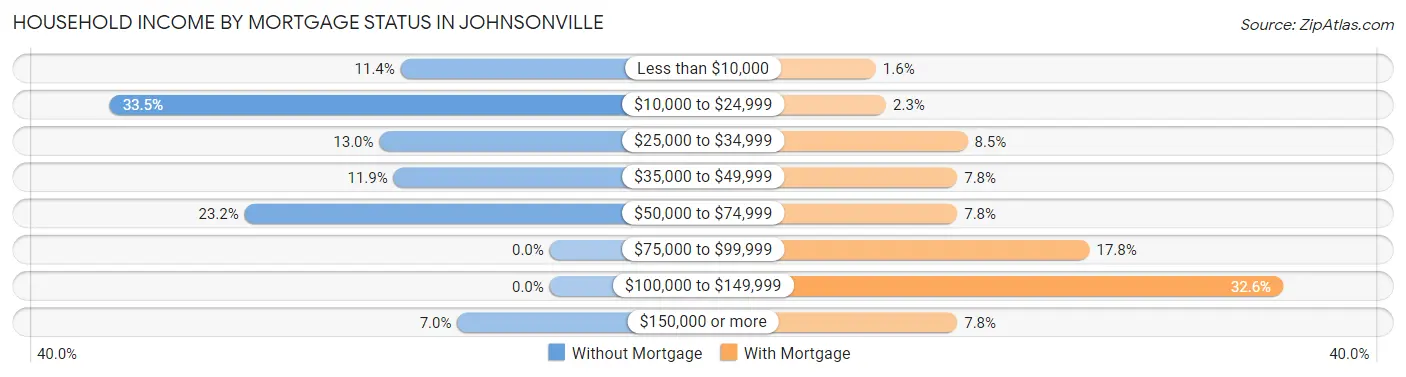
| Household Income | Without Mortgage | With Mortgage |
| Less than $10,000 | 21 (11.4%) | 2 (1.5%) |
| $10,000 to $24,999 | 62 (33.5%) | 3 (2.3%) |
| $25,000 to $34,999 | 24 (13.0%) | 11 (8.5%) |
| $35,000 to $49,999 | 22 (11.9%) | 10 (7.7%) |
| $50,000 to $74,999 | 43 (23.2%) | 10 (7.7%) |
| $75,000 to $99,999 | 0 (0.0%) | 23 (17.8%) |
| $100,000 to $149,999 | 0 (0.0%) | 42 (32.6%) |
| $150,000 or more | 13 (7.0%) | 10 (7.7%) |
| Total | 185 (100.0%) | 129 (100.0%) |
Property Value to Household Income Ratio in Johnsonville
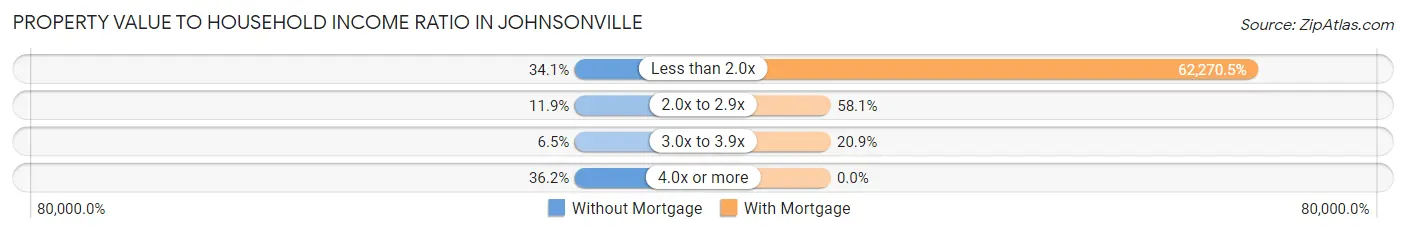
| Value-to-Income Ratio | Without Mortgage | With Mortgage |
| Less than 2.0x | 63 (34.1%) | 80,329 (62,270.5%) |
| 2.0x to 2.9x | 22 (11.9%) | 75 (58.1%) |
| 3.0x to 3.9x | 12 (6.5%) | 27 (20.9%) |
| 4.0x or more | 67 (36.2%) | 0 (0.0%) |
| Total | 185 (100.0%) | 129 (100.0%) |
Real Estate Taxes by Mortgage Status in Johnsonville
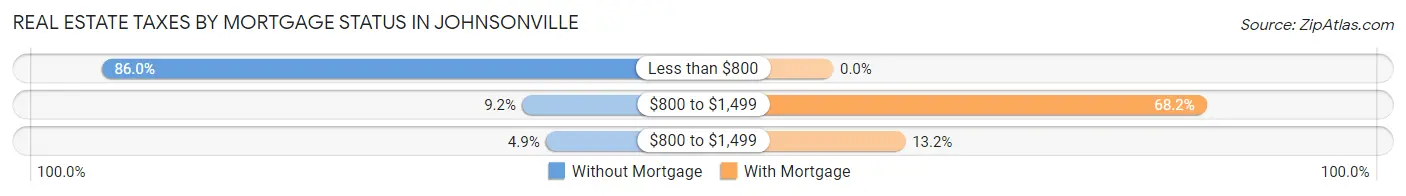
| Property Taxes | Without Mortgage | With Mortgage |
| Less than $800 | 159 (86.0%) | 0 (0.0%) |
| $800 to $1,499 | 17 (9.2%) | 88 (68.2%) |
| $800 to $1,499 | 9 (4.9%) | 17 (13.2%) |
| Total | 185 (100.0%) | 129 (100.0%) |
Health & Disability in Johnsonville
Health Insurance Coverage by Age in Johnsonville
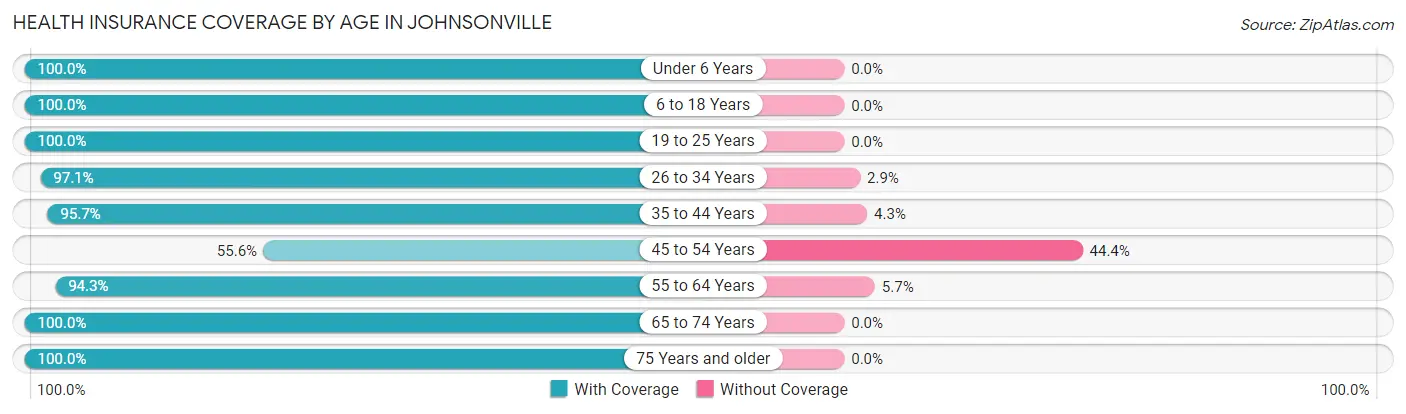
| Age Bracket | With Coverage | Without Coverage |
| Under 6 Years | 97 (100.0%) | 0 (0.0%) |
| 6 to 18 Years | 232 (100.0%) | 0 (0.0%) |
| 19 to 25 Years | 96 (100.0%) | 0 (0.0%) |
| 26 to 34 Years | 132 (97.1%) | 4 (2.9%) |
| 35 to 44 Years | 90 (95.7%) | 4 (4.3%) |
| 45 to 54 Years | 40 (55.6%) | 32 (44.4%) |
| 55 to 64 Years | 132 (94.3%) | 8 (5.7%) |
| 65 to 74 Years | 150 (100.0%) | 0 (0.0%) |
| 75 Years and older | 91 (100.0%) | 0 (0.0%) |
| Total | 1,060 (95.7%) | 48 (4.3%) |
Health Insurance Coverage by Citizenship Status in Johnsonville
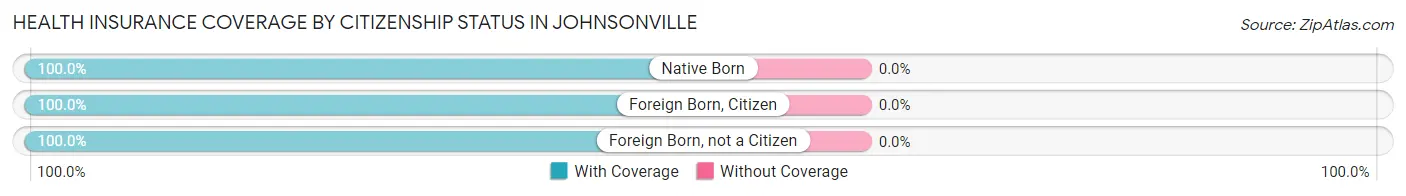
| Citizenship Status | With Coverage | Without Coverage |
| Native Born | 97 (100.0%) | 0 (0.0%) |
| Foreign Born, Citizen | 232 (100.0%) | 0 (0.0%) |
| Foreign Born, not a Citizen | 96 (100.0%) | 0 (0.0%) |
Health Insurance Coverage by Household Income in Johnsonville
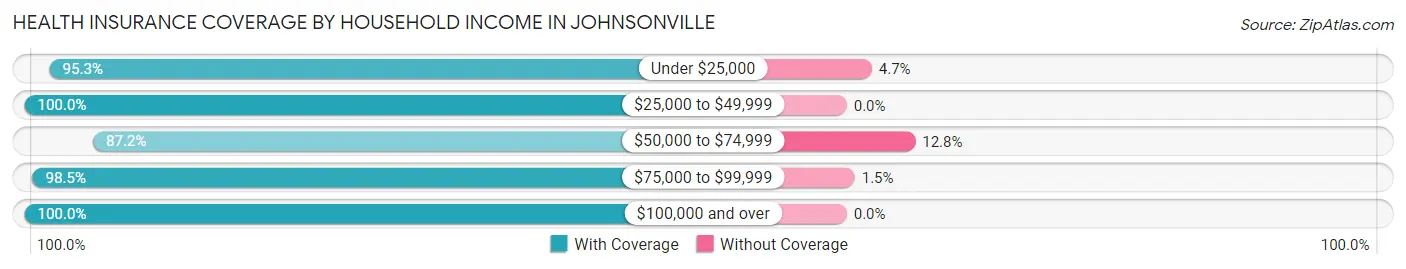
| Household Income | With Coverage | Without Coverage |
| Under $25,000 | 304 (95.3%) | 15 (4.7%) |
| $25,000 to $49,999 | 261 (100.0%) | 0 (0.0%) |
| $50,000 to $74,999 | 190 (87.2%) | 28 (12.8%) |
| $75,000 to $99,999 | 131 (98.5%) | 2 (1.5%) |
| $100,000 and over | 165 (100.0%) | 0 (0.0%) |
Public vs Private Health Insurance Coverage by Age in Johnsonville
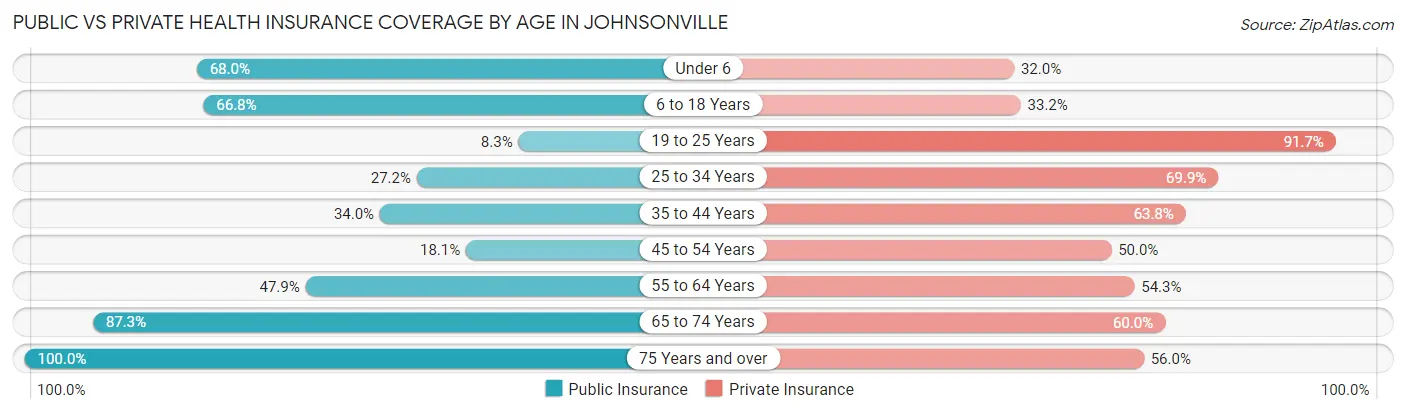
| Age Bracket | Public Insurance | Private Insurance |
| Under 6 | 66 (68.0%) | 31 (32.0%) |
| 6 to 18 Years | 155 (66.8%) | 77 (33.2%) |
| 19 to 25 Years | 8 (8.3%) | 88 (91.7%) |
| 25 to 34 Years | 37 (27.2%) | 95 (69.9%) |
| 35 to 44 Years | 32 (34.0%) | 60 (63.8%) |
| 45 to 54 Years | 13 (18.1%) | 36 (50.0%) |
| 55 to 64 Years | 67 (47.9%) | 76 (54.3%) |
| 65 to 74 Years | 131 (87.3%) | 90 (60.0%) |
| 75 Years and over | 91 (100.0%) | 51 (56.0%) |
| Total | 600 (54.1%) | 604 (54.5%) |
Disability Status by Sex by Age in Johnsonville
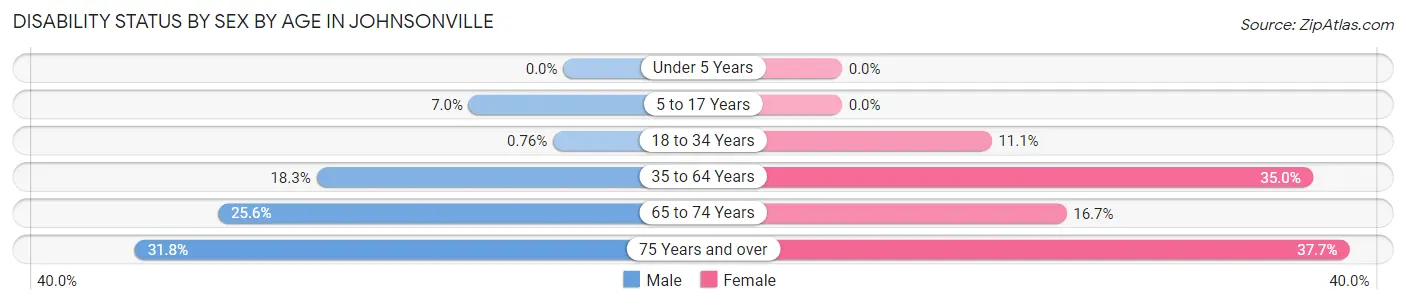
| Age Bracket | Male | Female |
| Under 5 Years | 0 (0.0%) | 0 (0.0%) |
| 5 to 17 Years | 4 (7.0%) | 0 (0.0%) |
| 18 to 34 Years | 1 (0.8%) | 13 (11.1%) |
| 35 to 64 Years | 22 (18.3%) | 65 (34.9%) |
| 65 to 74 Years | 20 (25.6%) | 12 (16.7%) |
| 75 Years and over | 7 (31.8%) | 26 (37.7%) |
Disability Class by Sex by Age in Johnsonville
Disability Class: Hearing Difficulty
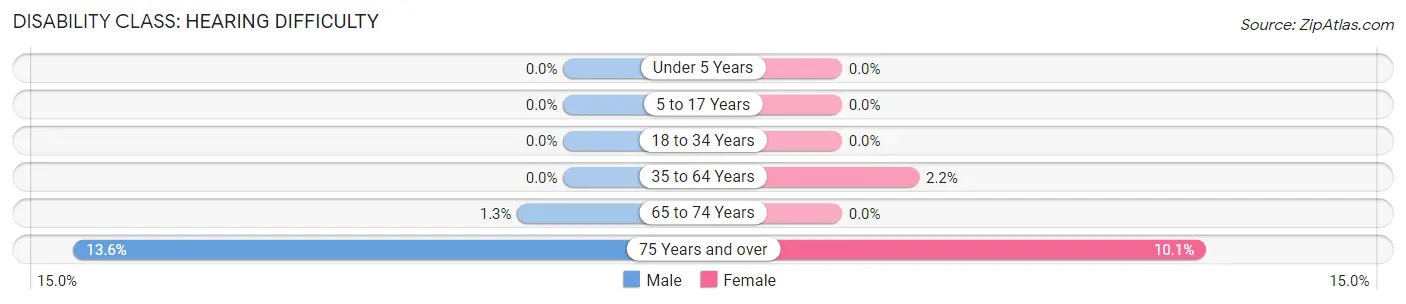
| Age Bracket | Male | Female |
| Under 5 Years | 0 (0.0%) | 0 (0.0%) |
| 5 to 17 Years | 0 (0.0%) | 0 (0.0%) |
| 18 to 34 Years | 0 (0.0%) | 0 (0.0%) |
| 35 to 64 Years | 0 (0.0%) | 4 (2.1%) |
| 65 to 74 Years | 1 (1.3%) | 0 (0.0%) |
| 75 Years and over | 3 (13.6%) | 7 (10.1%) |
Disability Class: Vision Difficulty
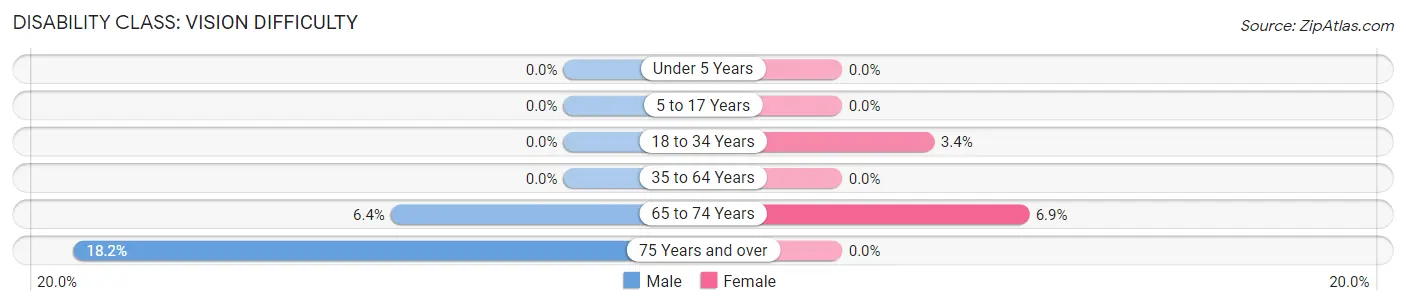
| Age Bracket | Male | Female |
| Under 5 Years | 0 (0.0%) | 0 (0.0%) |
| 5 to 17 Years | 0 (0.0%) | 0 (0.0%) |
| 18 to 34 Years | 0 (0.0%) | 4 (3.4%) |
| 35 to 64 Years | 0 (0.0%) | 0 (0.0%) |
| 65 to 74 Years | 5 (6.4%) | 5 (6.9%) |
| 75 Years and over | 4 (18.2%) | 0 (0.0%) |
Disability Class: Cognitive Difficulty
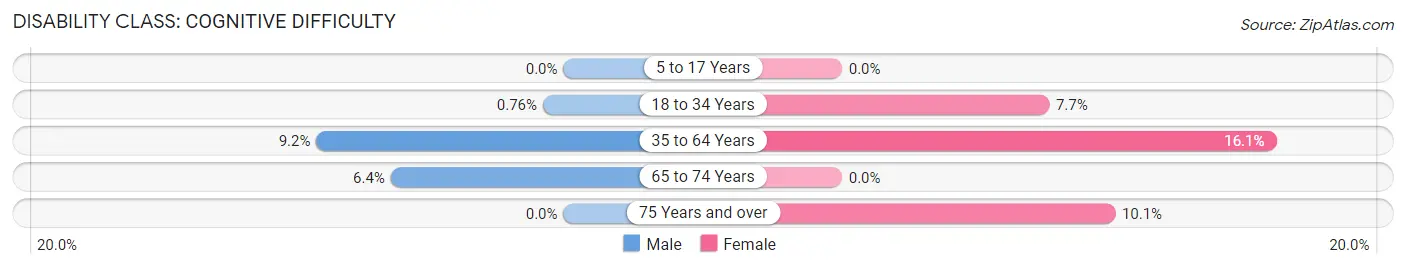
| Age Bracket | Male | Female |
| 5 to 17 Years | 0 (0.0%) | 0 (0.0%) |
| 18 to 34 Years | 1 (0.8%) | 9 (7.7%) |
| 35 to 64 Years | 11 (9.2%) | 30 (16.1%) |
| 65 to 74 Years | 5 (6.4%) | 0 (0.0%) |
| 75 Years and over | 0 (0.0%) | 7 (10.1%) |
Disability Class: Ambulatory Difficulty
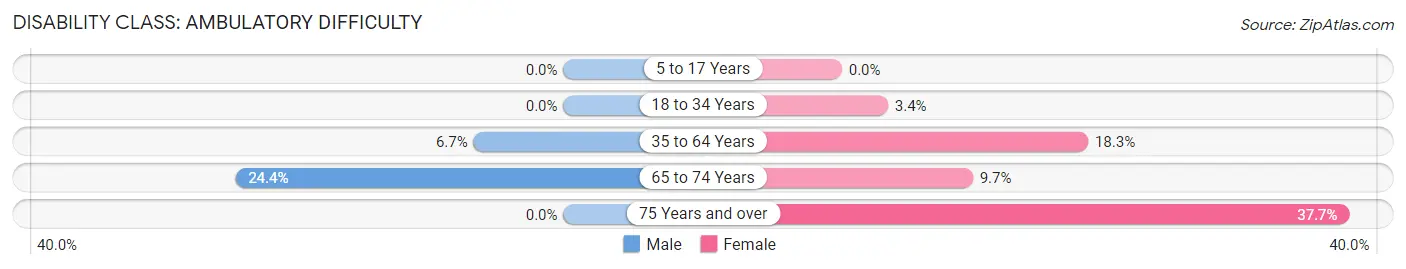
| Age Bracket | Male | Female |
| 5 to 17 Years | 0 (0.0%) | 0 (0.0%) |
| 18 to 34 Years | 0 (0.0%) | 4 (3.4%) |
| 35 to 64 Years | 8 (6.7%) | 34 (18.3%) |
| 65 to 74 Years | 19 (24.4%) | 7 (9.7%) |
| 75 Years and over | 0 (0.0%) | 26 (37.7%) |
Disability Class: Self-Care Difficulty
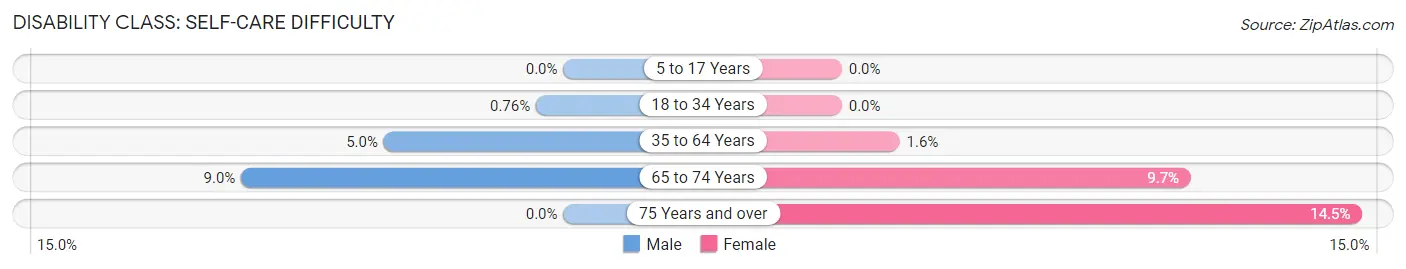
| Age Bracket | Male | Female |
| 5 to 17 Years | 0 (0.0%) | 0 (0.0%) |
| 18 to 34 Years | 1 (0.8%) | 0 (0.0%) |
| 35 to 64 Years | 6 (5.0%) | 3 (1.6%) |
| 65 to 74 Years | 7 (9.0%) | 7 (9.7%) |
| 75 Years and over | 0 (0.0%) | 10 (14.5%) |
Technology Access in Johnsonville
Computing Device Access in Johnsonville
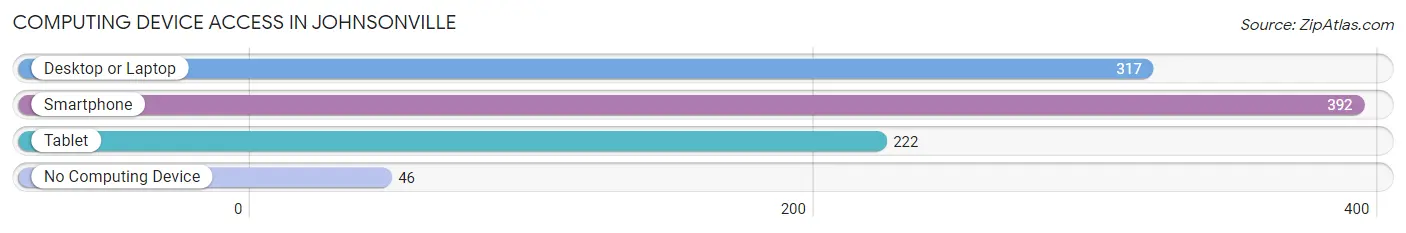
| Device Type | # Households | % Households |
| Desktop or Laptop | 317 | 68.6% |
| Smartphone | 392 | 84.9% |
| Tablet | 222 | 48.0% |
| No Computing Device | 46 | 10.0% |
| Total | 462 | 100.0% |
Internet Access in Johnsonville
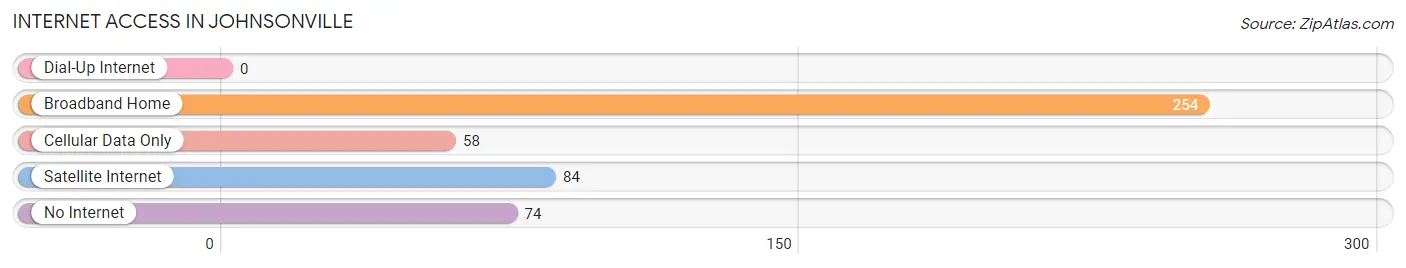
| Internet Type | # Households | % Households |
| Dial-Up Internet | 0 | 0.0% |
| Broadband Home | 254 | 55.0% |
| Cellular Data Only | 58 | 12.6% |
| Satellite Internet | 84 | 18.2% |
| No Internet | 74 | 16.0% |
| Total | 462 | 100.0% |
Johnsonville Summary
Jacksonville, SC is a small town located in the heart of South Carolina. It is situated in the Pee Dee region of the state, and is the county seat of Williamsburg County. The town is located on the banks of the Black River, and is home to a population of approximately 2,000 people.
History
Jacksonville was founded in 1790 by William and Mary Jackson, who were among the first settlers in the area. The town was named after the Jacksons, and was originally known as Jackson’s Ferry. The town was incorporated in 1802, and was the first town in Williamsburg County.
In the early 19th century, Jacksonville was a thriving port town, with a bustling economy based on the lumber and turpentine industries. The town was also a major stop on the stagecoach route between Charleston and Columbia.
In the late 19th century, the town’s economy shifted to agriculture, with cotton and tobacco being the main crops. The town also became a major railroad hub, with the Atlantic Coast Line Railroad and the Seaboard Air Line Railroad both having stops in Jacksonville.
Geography
Jacksonville is located in the Pee Dee region of South Carolina, in the northeastern corner of Williamsburg County. The town is situated on the banks of the Black River, and is surrounded by the Francis Marion National Forest. The town is located approximately 40 miles from the Atlantic Ocean, and is about an hour’s drive from both Charleston and Columbia.
The town has a total area of 1.3 square miles, all of which is land. The town has a humid subtropical climate, with hot, humid summers and mild winters. The average annual temperature is around 70 degrees Fahrenheit, and the average annual precipitation is around 50 inches.
Economy
Jacksonville’s economy is largely based on agriculture, with cotton and tobacco being the main crops. The town is also home to several manufacturing companies, including a paper mill and a furniture factory. The town is also home to a number of small businesses, including restaurants, shops, and other services.
Demographics
As of the 2010 census, Jacksonville had a population of 2,000 people. The racial makeup of the town was 79.2% White, 17.2% African American, 0.7% Native American, 0.3% Asian, and 2.6% from other races. The median household income was $30,000, and the median family income was $35,000.
Conclusion
Jacksonville, SC is a small town located in the Pee Dee region of South Carolina. It was founded in 1790, and has a population of approximately 2,000 people. The town’s economy is largely based on agriculture, with cotton and tobacco being the main crops. The town also has a number of small businesses, and is home to several manufacturing companies. The town has a humid subtropical climate, with hot, humid summers and mild winters.
Common Questions
What is Per Capita Income in Johnsonville?
Per Capita income in Johnsonville is $23,854.
What is the Median Family Income in Johnsonville?
Median Family Income in Johnsonville is $57,878.
What is the Median Household income in Johnsonville?
Median Household Income in Johnsonville is $46,528.
What is Income or Wage Gap in Johnsonville?
Income or Wage Gap in Johnsonville is 28.8%.
Women in Johnsonville earn 71.2 cents for every dollar earned by a man.
What is Inequality or Gini Index in Johnsonville?
Inequality or Gini Index in Johnsonville is 0.47.
What is the Total Population of Johnsonville?
Total Population of Johnsonville is 1,108.
What is the Total Male Population of Johnsonville?
Total Male Population of Johnsonville is 474.
What is the Total Female Population of Johnsonville?
Total Female Population of Johnsonville is 634.
What is the Ratio of Males per 100 Females in Johnsonville?
There are 74.76 Males per 100 Females in Johnsonville.
What is the Ratio of Females per 100 Males in Johnsonville?
There are 133.76 Females per 100 Males in Johnsonville.
What is the Median Population Age in Johnsonville?
Median Population Age in Johnsonville is 34.6 Years.
What is the Average Family Size in Johnsonville
Average Family Size in Johnsonville is 3.0 People.
What is the Average Household Size in Johnsonville
Average Household Size in Johnsonville is 2.4 People.
How Large is the Labor Force in Johnsonville?
There are 420 People in the Labor Forcein in Johnsonville.
What is the Percentage of People in the Labor Force in Johnsonville?
51.0% of People are in the Labor Force in Johnsonville.
What is the Unemployment Rate in Johnsonville?
Unemployment Rate in Johnsonville is 3.3%.