Walterboro, SC Map & Demographics
Walterboro Map
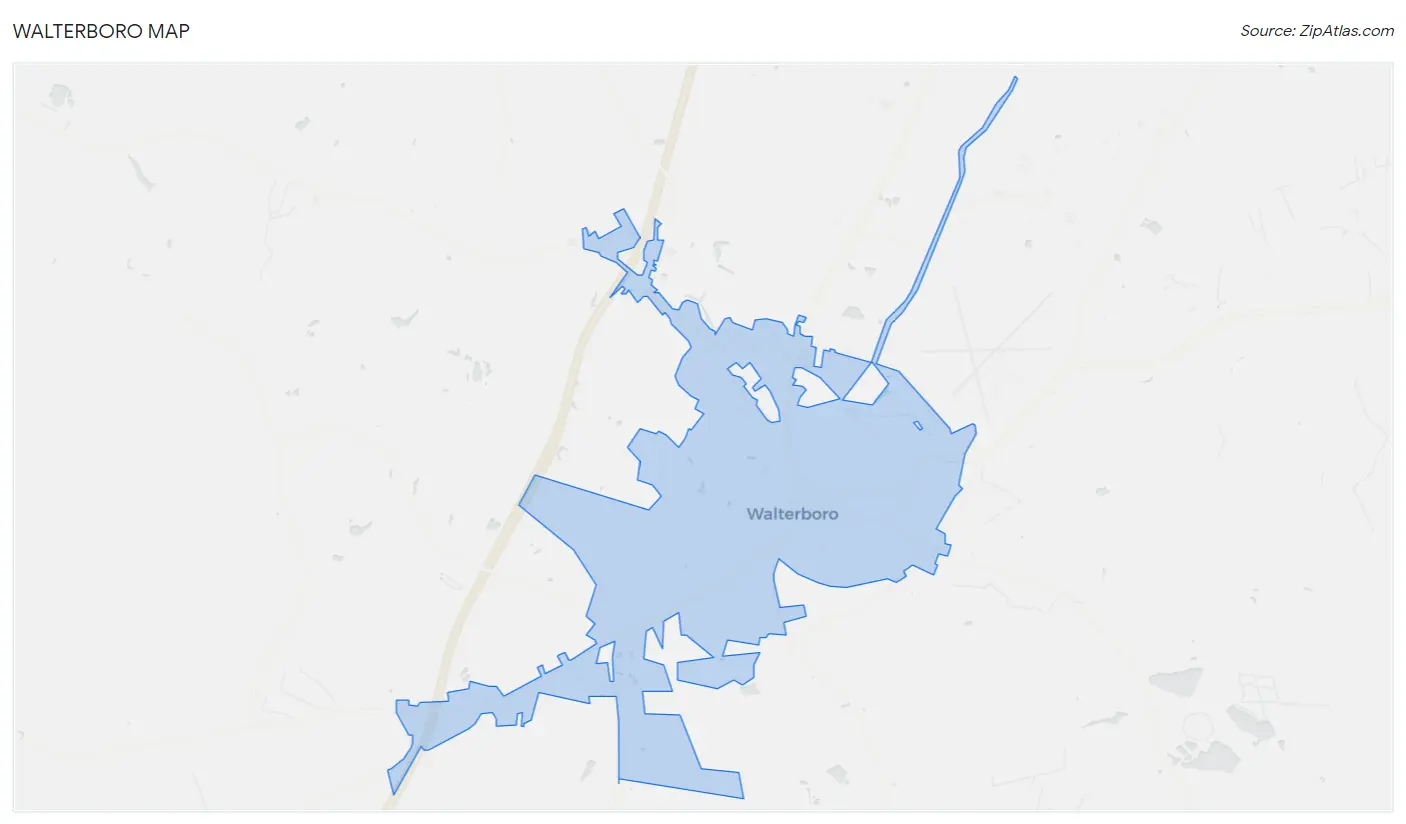
Walterboro Overview
$25,507
PER CAPITA INCOME
$52,069
AVG FAMILY INCOME
$46,119
AVG HOUSEHOLD INCOME
43.0%
WAGE / INCOME GAP [ % ]
57.0¢/ $1
WAGE / INCOME GAP [ $ ]
0.47
INEQUALITY / GINI INDEX
5,515
TOTAL POPULATION
2,372
MALE POPULATION
3,143
FEMALE POPULATION
75.47
MALES / 100 FEMALES
132.50
FEMALES / 100 MALES
40.4
MEDIAN AGE
2.7
AVG FAMILY SIZE
2.4
AVG HOUSEHOLD SIZE
2,516
LABOR FORCE [ PEOPLE ]
56.7%
PERCENT IN LABOR FORCE
3.1%
UNEMPLOYMENT RATE
Walterboro Zip Codes
Walterboro Area Codes
Income in Walterboro
Income Overview in Walterboro
Per Capita Income in Walterboro is $25,507, while median incomes of families and households are $52,069 and $46,119 respectively.
| Characteristic | Number | Measure |
| Per Capita Income | 5,515 | $25,507 |
| Median Family Income | 1,501 | $52,069 |
| Mean Family Income | 1,501 | $67,164 |
| Median Household Income | 2,275 | $46,119 |
| Mean Household Income | 2,275 | $58,658 |
| Income Deficit | 1,501 | $0 |
| Wage / Income Gap (%) | 5,515 | 42.95% |
| Wage / Income Gap ($) | 5,515 | 57.05¢ per $1 |
| Gini / Inequality Index | 5,515 | 0.47 |
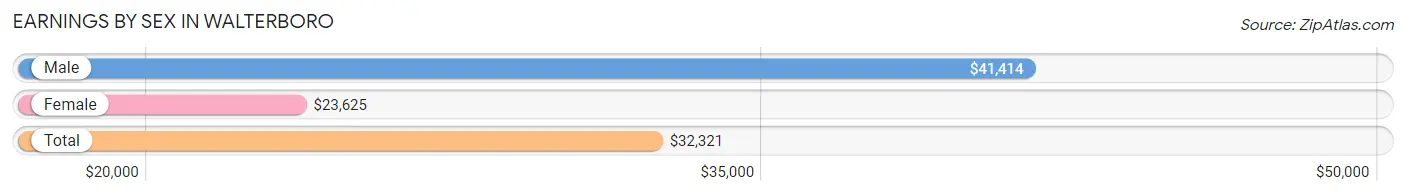
Earnings by Sex in Walterboro
Average Earnings in Walterboro are $32,321, $41,414 for men and $23,625 for women, a difference of 42.9%.
| Sex | Number | Average Earnings |
| Male | 1,191 (45.0%) | $41,414 |
| Female | 1,454 (55.0%) | $23,625 |
| Total | 2,645 (100.0%) | $32,321 |
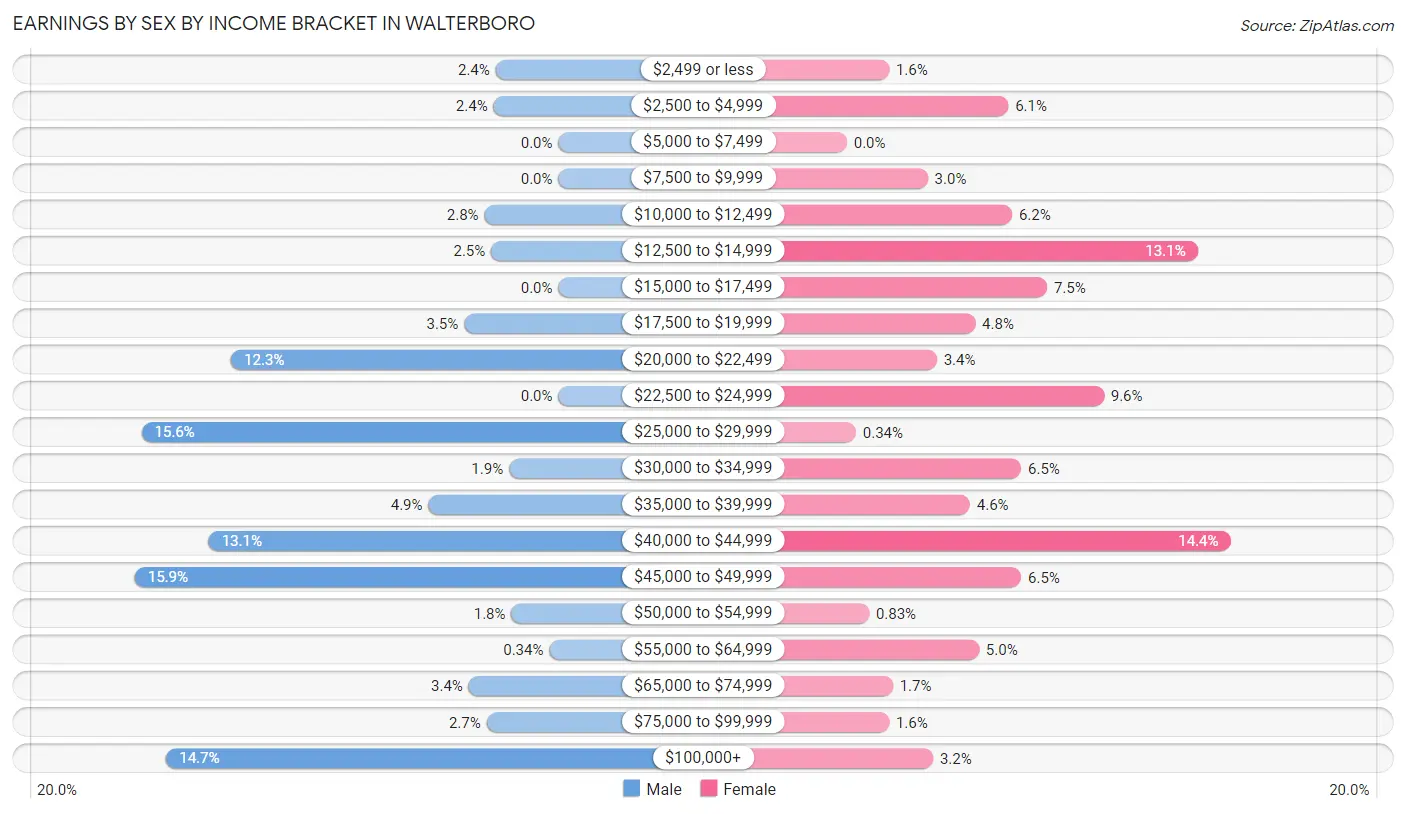
Earnings by Sex by Income Bracket in Walterboro
The most common earnings brackets in Walterboro are $45,000 to $49,999 for men (189 | 15.9%) and $40,000 to $44,999 for women (209 | 14.4%).
| Income | Male | Female |
| $2,499 or less | 28 (2.4%) | 23 (1.6%) |
| $2,500 to $4,999 | 29 (2.4%) | 88 (6.0%) |
| $5,000 to $7,499 | 0 (0.0%) | 0 (0.0%) |
| $7,500 to $9,999 | 0 (0.0%) | 44 (3.0%) |
| $10,000 to $12,499 | 33 (2.8%) | 90 (6.2%) |
| $12,500 to $14,999 | 30 (2.5%) | 191 (13.1%) |
| $15,000 to $17,499 | 0 (0.0%) | 109 (7.5%) |
| $17,500 to $19,999 | 42 (3.5%) | 70 (4.8%) |
| $20,000 to $22,499 | 146 (12.3%) | 49 (3.4%) |
| $22,500 to $24,999 | 0 (0.0%) | 140 (9.6%) |
| $25,000 to $29,999 | 186 (15.6%) | 5 (0.3%) |
| $30,000 to $34,999 | 22 (1.8%) | 95 (6.5%) |
| $35,000 to $39,999 | 58 (4.9%) | 67 (4.6%) |
| $40,000 to $44,999 | 156 (13.1%) | 209 (14.4%) |
| $45,000 to $49,999 | 189 (15.9%) | 95 (6.5%) |
| $50,000 to $54,999 | 21 (1.8%) | 12 (0.8%) |
| $55,000 to $64,999 | 4 (0.3%) | 72 (5.0%) |
| $65,000 to $74,999 | 40 (3.4%) | 25 (1.7%) |
| $75,000 to $99,999 | 32 (2.7%) | 23 (1.6%) |
| $100,000+ | 175 (14.7%) | 47 (3.2%) |
| Total | 1,191 (100.0%) | 1,454 (100.0%) |
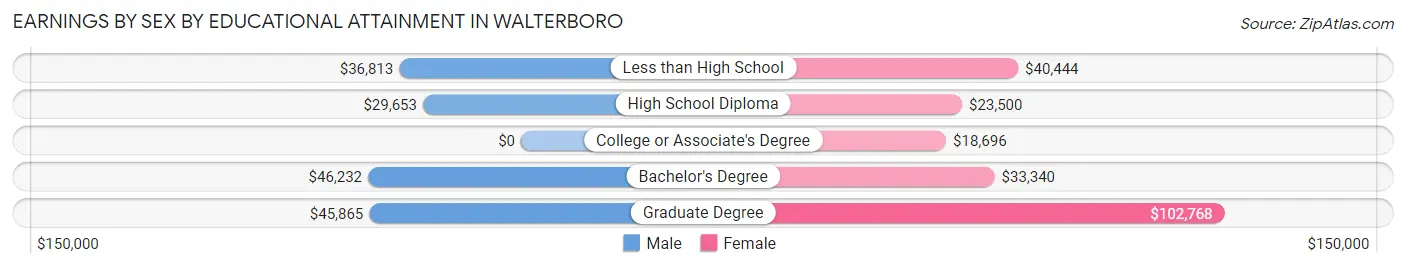
Earnings by Sex by Educational Attainment in Walterboro
Average earnings in Walterboro are $43,157 for men and $23,938 for women, a difference of 44.5%. Men with an educational attainment of bachelor's degree enjoy the highest average annual earnings of $46,232, while those with high school diploma education earn the least with $29,653. Women with an educational attainment of graduate degree earn the most with the average annual earnings of $102,768, while those with college or associate's degree education have the smallest earnings of $18,696.
| Educational Attainment | Male Income | Female Income |
| Less than High School | $36,813 | $40,444 |
| High School Diploma | $29,653 | $23,500 |
| College or Associate's Degree | - | - |
| Bachelor's Degree | $46,232 | $33,340 |
| Graduate Degree | $45,865 | $102,768 |
| Total | $43,157 | $23,938 |
Family Income in Walterboro
Family Income Brackets in Walterboro
According to the Walterboro family income data, there are 402 families falling into the $50,000 to $74,999 income range, which is the most common income bracket and makes up 26.8% of all families. Conversely, the $25,000 to $34,999 income bracket is the least frequent group with only 41 families (2.7%) belonging to this category.
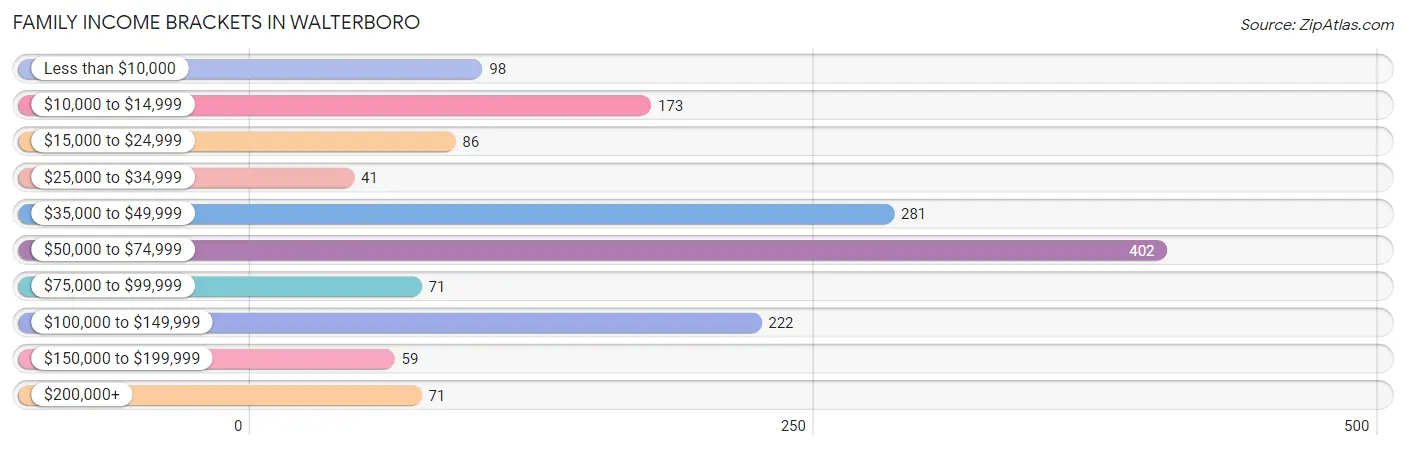
| Income Bracket | # Families | % Families |
| Less than $10,000 | 98 | 6.5% |
| $10,000 to $14,999 | 173 | 11.5% |
| $15,000 to $24,999 | 86 | 5.7% |
| $25,000 to $34,999 | 41 | 2.7% |
| $35,000 to $49,999 | 281 | 18.7% |
| $50,000 to $74,999 | 402 | 26.8% |
| $75,000 to $99,999 | 71 | 4.7% |
| $100,000 to $149,999 | 222 | 14.8% |
| $150,000 to $199,999 | 59 | 3.9% |
| $200,000+ | 71 | 4.7% |
Family Income by Famaliy Size in Walterboro
2-person families (835 | 55.6%) account for the highest median family income in Walterboro with $58,313 per family, while 2-person families (835 | 55.6%) have the highest median income of $29,156 per family member.
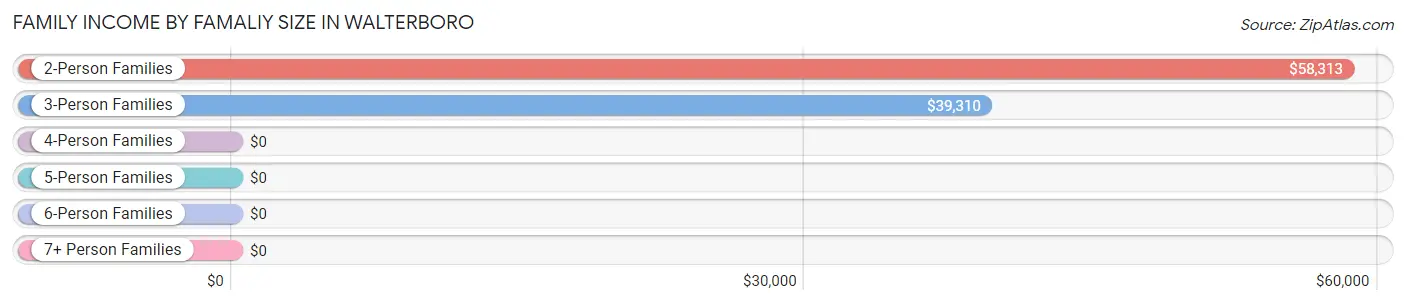
| Income Bracket | # Families | Median Income |
| 2-Person Families | 835 (55.6%) | $58,313 |
| 3-Person Families | 461 (30.7%) | $39,310 |
| 4-Person Families | 129 (8.6%) | $0 |
| 5-Person Families | 68 (4.5%) | $0 |
| 6-Person Families | 8 (0.5%) | $0 |
| 7+ Person Families | 0 (0.0%) | $0 |
| Total | 1,501 (100.0%) | $52,069 |
Family Income by Number of Earners in Walterboro
The median family income in Walterboro is $52,069, with families comprising 3+ earners (75) having the highest median family income of $132,768, while families with no earners (373) have the lowest median family income of $24,844, accounting for 5.0% and 24.8% of families, respectively.
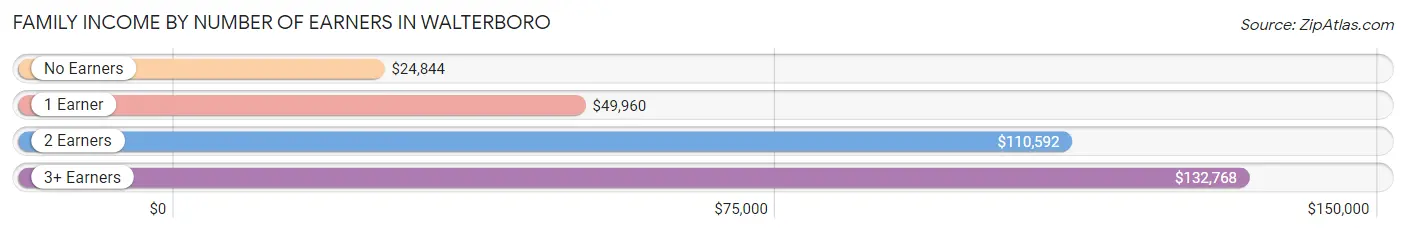
| Number of Earners | # Families | Median Income |
| No Earners | 373 (24.8%) | $24,844 |
| 1 Earner | 662 (44.1%) | $49,960 |
| 2 Earners | 391 (26.1%) | $110,592 |
| 3+ Earners | 75 (5.0%) | $132,768 |
| Total | 1,501 (100.0%) | $52,069 |
Household Income in Walterboro
Household Income Brackets in Walterboro
With 487 households falling in the category, the $35,000 to $49,999 income range is the most frequent in Walterboro, accounting for 21.4% of all households. In contrast, only 77 households (3.4%) fall into the $200,000+ income bracket, making it the least populous group.
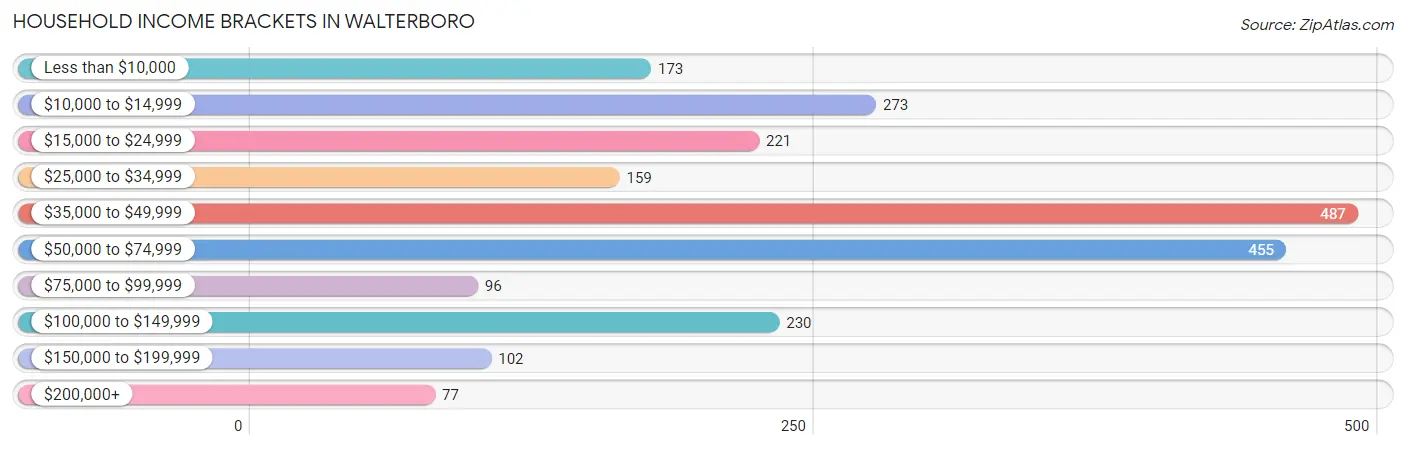
| Income Bracket | # Households | % Households |
| Less than $10,000 | 173 | 7.6% |
| $10,000 to $14,999 | 273 | 12.0% |
| $15,000 to $24,999 | 221 | 9.7% |
| $25,000 to $34,999 | 159 | 7.0% |
| $35,000 to $49,999 | 487 | 21.4% |
| $50,000 to $74,999 | 455 | 20.0% |
| $75,000 to $99,999 | 96 | 4.2% |
| $100,000 to $149,999 | 230 | 10.1% |
| $150,000 to $199,999 | 102 | 4.5% |
| $200,000+ | 77 | 3.4% |
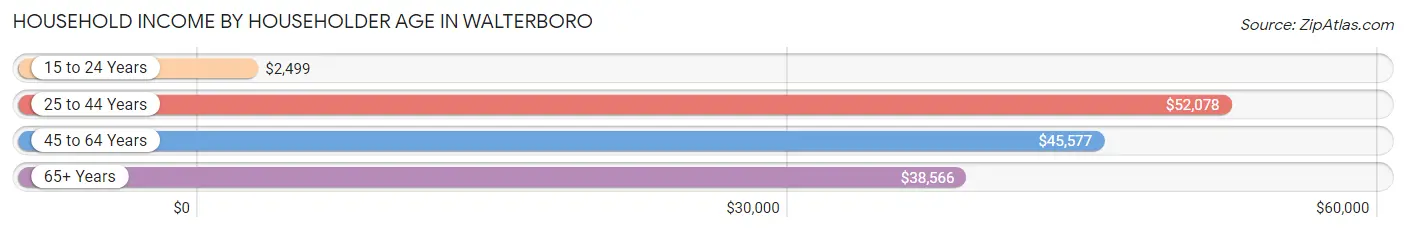
Household Income by Householder Age in Walterboro
The median household income in Walterboro is $46,119, with the highest median household income of $52,078 found in the 25 to 44 years age bracket for the primary householder. A total of 756 households (33.2%) fall into this category. Meanwhile, the 15 to 24 years age bracket for the primary householder has the lowest median household income of $2,499, with 138 households (6.1%) in this group.
| Income Bracket | # Households | Median Income |
| 15 to 24 Years | 138 (6.1%) | $2,499 |
| 25 to 44 Years | 756 (33.2%) | $52,078 |
| 45 to 64 Years | 816 (35.9%) | $45,577 |
| 65+ Years | 565 (24.8%) | $38,566 |
| Total | 2,275 (100.0%) | $46,119 |
Poverty in Walterboro
Income Below Poverty by Sex and Age in Walterboro
With 13.6% poverty level for males and 29.2% for females among the residents of Walterboro, 5 year old males and under 5 year old females are the most vulnerable to poverty, with 32 males (39.0%) and 68 females (100.0%) in their respective age groups living below the poverty level.
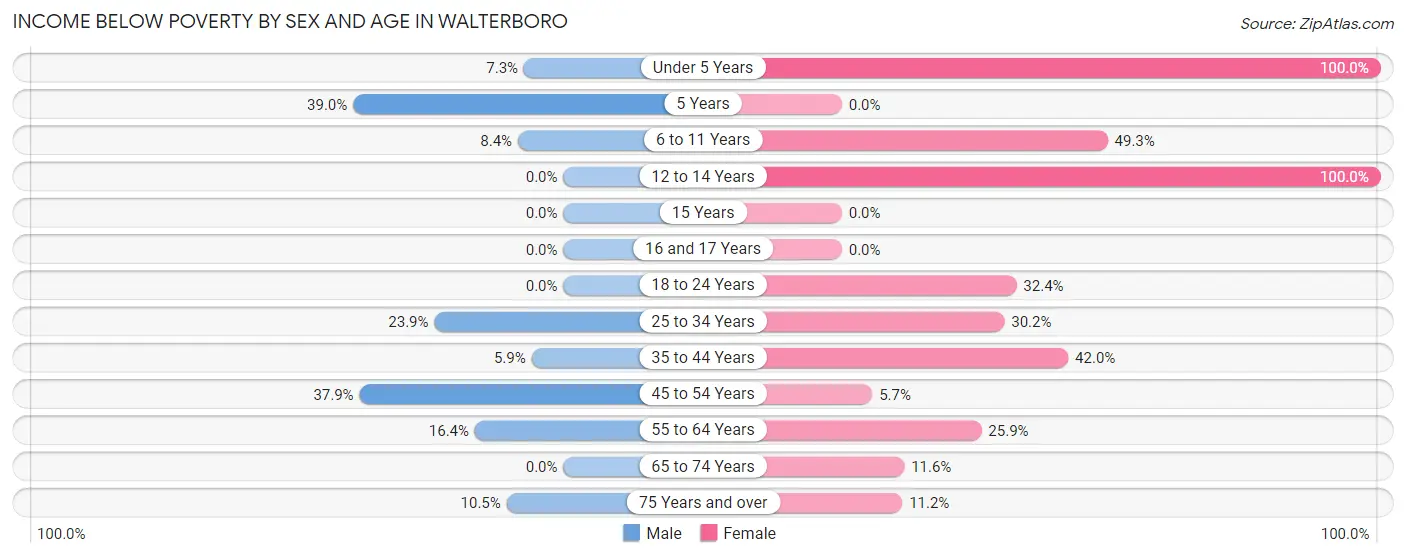
| Age Bracket | Male | Female |
| Under 5 Years | 6 (7.3%) | 68 (100.0%) |
| 5 Years | 32 (39.0%) | 0 (0.0%) |
| 6 to 11 Years | 7 (8.4%) | 261 (49.3%) |
| 12 to 14 Years | 0 (0.0%) | 19 (100.0%) |
| 15 Years | 0 (0.0%) | 0 (0.0%) |
| 16 and 17 Years | 0 (0.0%) | 0 (0.0%) |
| 18 to 24 Years | 0 (0.0%) | 70 (32.4%) |
| 25 to 34 Years | 45 (23.9%) | 171 (30.2%) |
| 35 to 44 Years | 20 (5.9%) | 108 (42.0%) |
| 45 to 54 Years | 137 (37.9%) | 17 (5.7%) |
| 55 to 64 Years | 45 (16.4%) | 135 (25.9%) |
| 65 to 74 Years | 0 (0.0%) | 33 (11.6%) |
| 75 Years and over | 8 (10.5%) | 25 (11.2%) |
| Total | 300 (13.6%) | 907 (29.2%) |
Income Above Poverty by Sex and Age in Walterboro
According to the poverty statistics in Walterboro, males aged 12 to 14 years and females aged 5 years are the age groups that are most secure financially, with 100.0% of males and 100.0% of females in these age groups living above the poverty line.
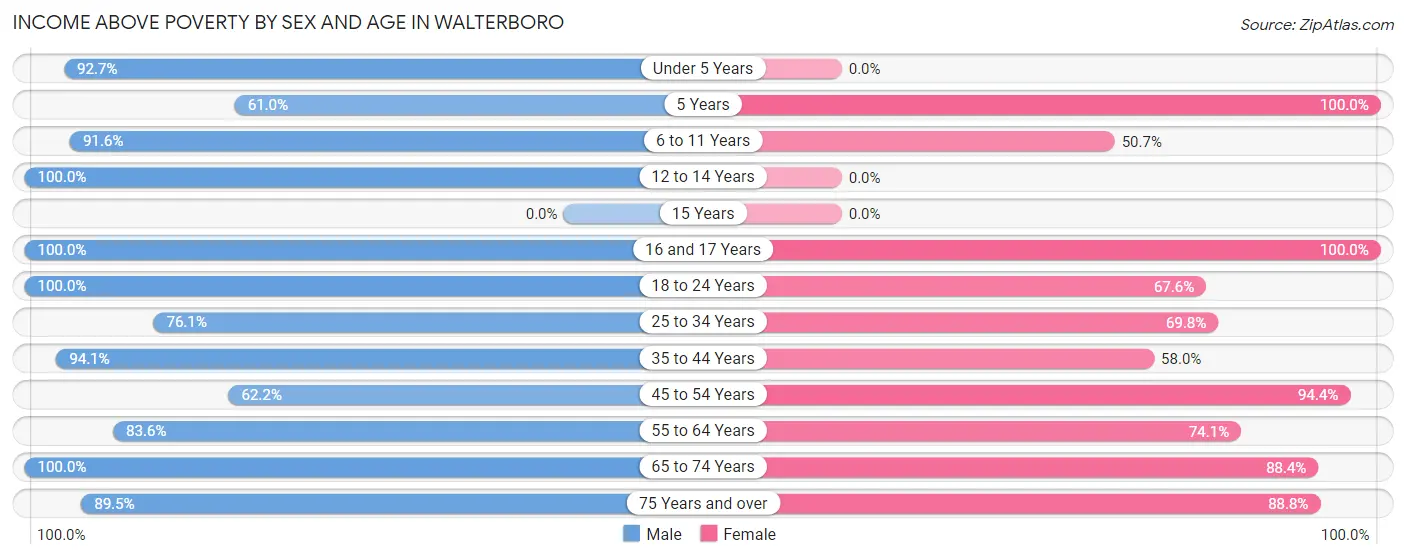
| Age Bracket | Male | Female |
| Under 5 Years | 76 (92.7%) | 0 (0.0%) |
| 5 Years | 50 (61.0%) | 21 (100.0%) |
| 6 to 11 Years | 76 (91.6%) | 268 (50.7%) |
| 12 to 14 Years | 140 (100.0%) | 0 (0.0%) |
| 15 Years | 0 (0.0%) | 0 (0.0%) |
| 16 and 17 Years | 61 (100.0%) | 101 (100.0%) |
| 18 to 24 Years | 169 (100.0%) | 146 (67.6%) |
| 25 to 34 Years | 143 (76.1%) | 396 (69.8%) |
| 35 to 44 Years | 319 (94.1%) | 149 (58.0%) |
| 45 to 54 Years | 225 (62.2%) | 284 (94.4%) |
| 55 to 64 Years | 229 (83.6%) | 386 (74.1%) |
| 65 to 74 Years | 356 (100.0%) | 252 (88.4%) |
| 75 Years and over | 68 (89.5%) | 198 (88.8%) |
| Total | 1,912 (86.4%) | 2,201 (70.8%) |
Income Below Poverty Among Married-Couple Families in Walterboro
The poverty statistics for married-couple families in Walterboro show that 3.2% or 28 of the total 886 families live below the poverty line. Families with 1 or 2 children have the highest poverty rate of 12.1%, comprising of 20 families. On the other hand, families with no children have the lowest poverty rate of 0.0%, which includes 0 families.
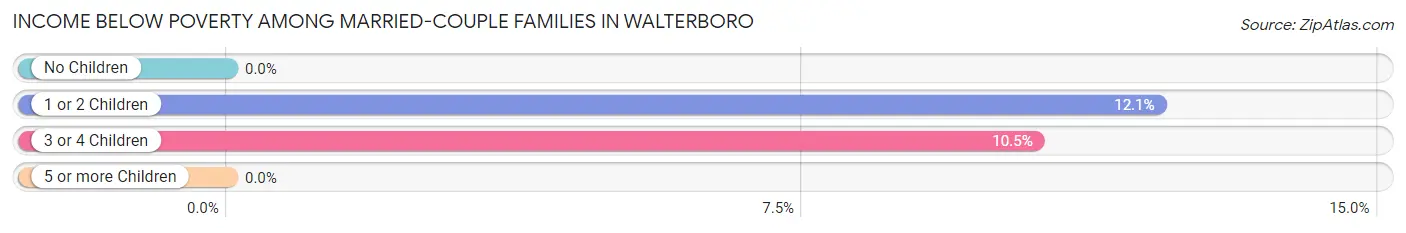
| Children | Above Poverty | Below Poverty |
| No Children | 645 (100.0%) | 0 (0.0%) |
| 1 or 2 Children | 145 (87.9%) | 20 (12.1%) |
| 3 or 4 Children | 68 (89.5%) | 8 (10.5%) |
| 5 or more Children | 0 (0.0%) | 0 (0.0%) |
| Total | 858 (96.8%) | 28 (3.2%) |
Income Below Poverty Among Single-Parent Households in Walterboro
According to the poverty data in Walterboro, 12.4% or 12 single-father households and 59.3% or 307 single-mother households are living below the poverty line. Among single-father households, those with no children have the highest poverty rate, with 12 households (16.7%) experiencing poverty. Likewise, among single-mother households, those with no children have the highest poverty rate, with 77 households (70.6%) falling below the poverty line.
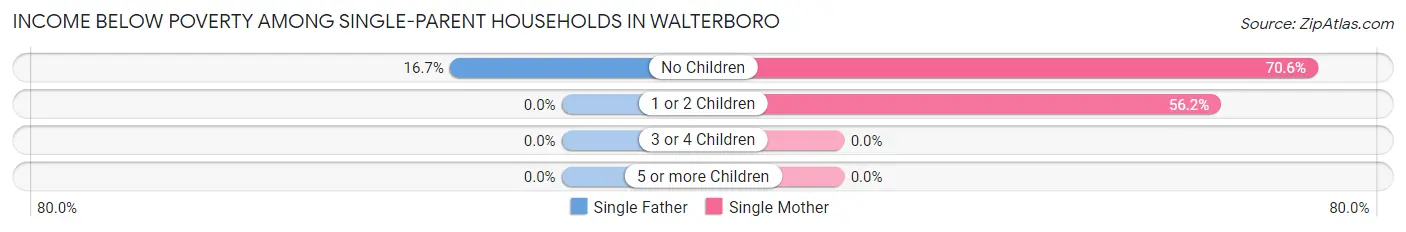
| Children | Single Father | Single Mother |
| No Children | 12 (16.7%) | 77 (70.6%) |
| 1 or 2 Children | 0 (0.0%) | 230 (56.2%) |
| 3 or 4 Children | 0 (0.0%) | 0 (0.0%) |
| 5 or more Children | 0 (0.0%) | 0 (0.0%) |
| Total | 12 (12.4%) | 307 (59.3%) |
Income Below Poverty Among Married-Couple vs Single-Parent Households in Walterboro
The poverty data for Walterboro shows that 28 of the married-couple family households (3.2%) and 319 of the single-parent households (51.9%) are living below the poverty level. Within the married-couple family households, those with 1 or 2 children have the highest poverty rate, with 20 households (12.1%) falling below the poverty line. Among the single-parent households, those with 1 or 2 children have the highest poverty rate, with 230 household (53.0%) living below poverty.
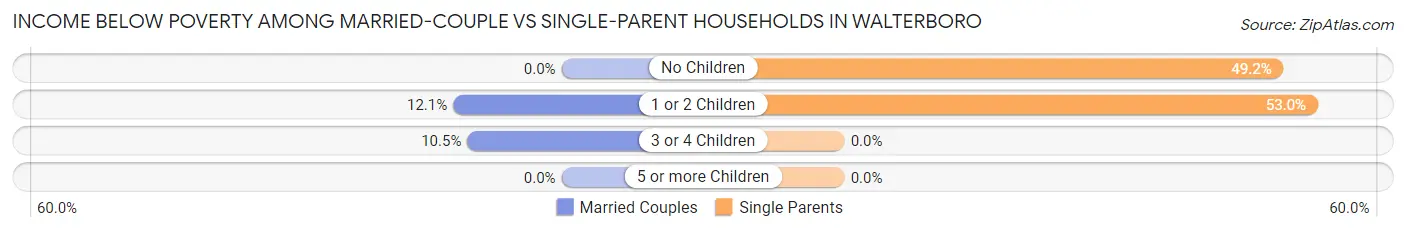
| Children | Married-Couple Families | Single-Parent Households |
| No Children | 0 (0.0%) | 89 (49.2%) |
| 1 or 2 Children | 20 (12.1%) | 230 (53.0%) |
| 3 or 4 Children | 8 (10.5%) | 0 (0.0%) |
| 5 or more Children | 0 (0.0%) | 0 (0.0%) |
| Total | 28 (3.2%) | 319 (51.9%) |
Race in Walterboro
The most populous races in Walterboro are White / Caucasian (2,797 | 50.7%), Black / African American (2,324 | 42.1%), and Hispanic or Latino (366 | 6.6%).
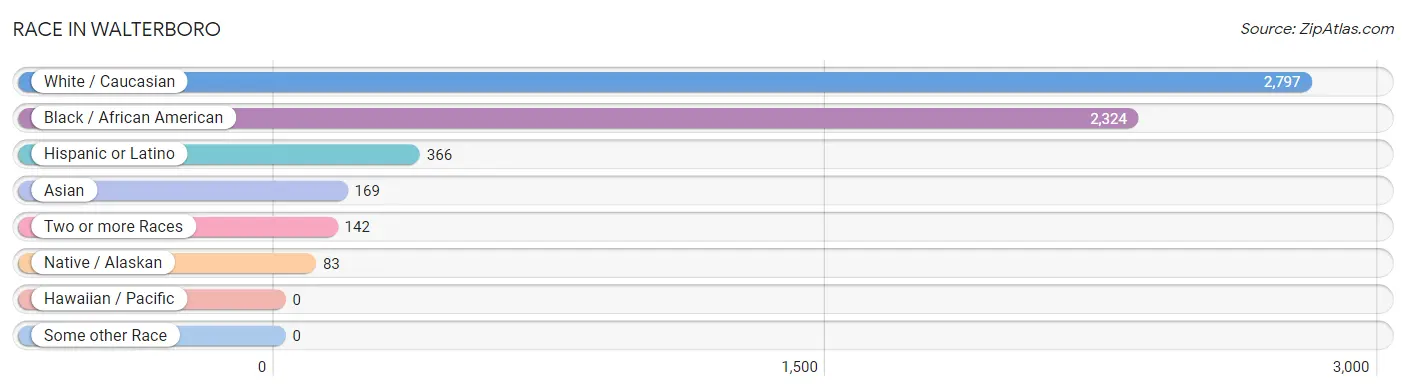
| Race | # Population | % Population |
| Asian | 169 | 3.1% |
| Black / African American | 2,324 | 42.1% |
| Hawaiian / Pacific | 0 | 0.0% |
| Hispanic or Latino | 366 | 6.6% |
| Native / Alaskan | 83 | 1.5% |
| White / Caucasian | 2,797 | 50.7% |
| Two or more Races | 142 | 2.6% |
| Some other Race | 0 | 0.0% |
| Total | 5,515 | 100.0% |
Ancestry in Walterboro
The most populous ancestries reported in Walterboro are English (526 | 9.5%), German (517 | 9.4%), European (516 | 9.4%), American (465 | 8.4%), and Irish (403 | 7.3%), together accounting for 44.0% of all Walterboro residents.
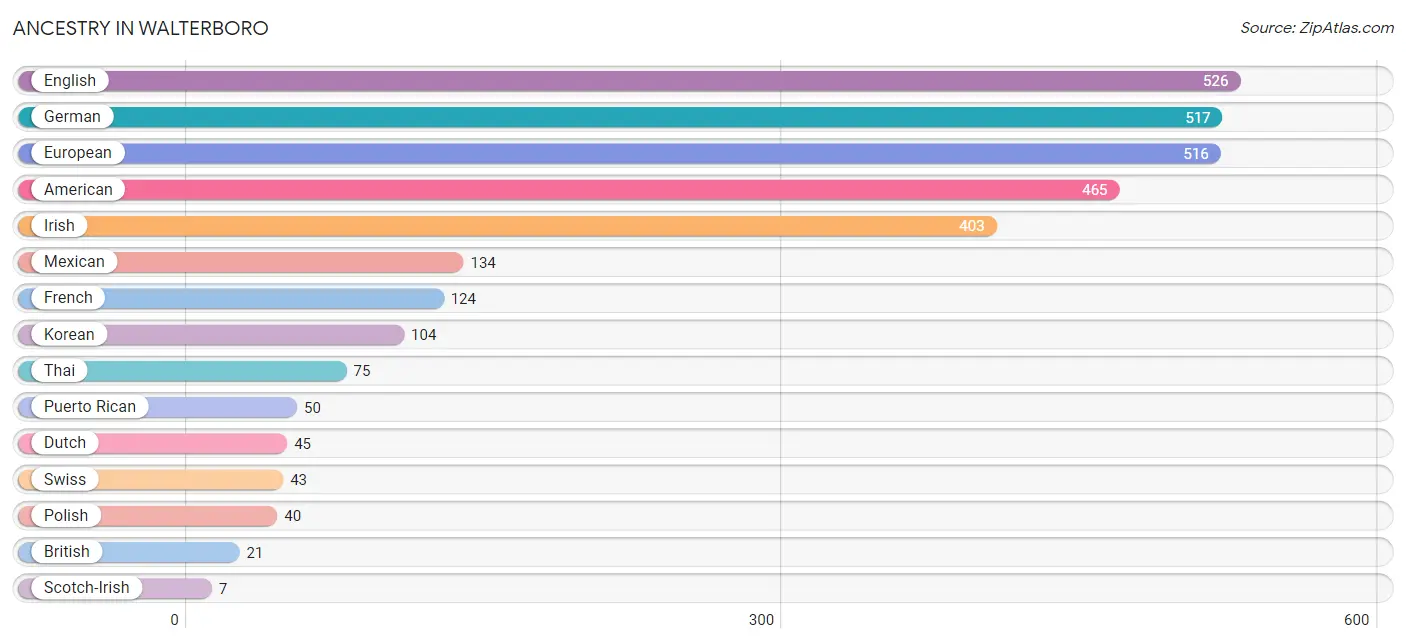
| Ancestry | # Population | % Population |
| American | 465 | 8.4% |
| British | 21 | 0.4% |
| Dutch | 45 | 0.8% |
| English | 526 | 9.5% |
| European | 516 | 9.4% |
| French | 124 | 2.2% |
| German | 517 | 9.4% |
| Irish | 403 | 7.3% |
| Korean | 104 | 1.9% |
| Lithuanian | 6 | 0.1% |
| Mexican | 134 | 2.4% |
| Polish | 40 | 0.7% |
| Puerto Rican | 50 | 0.9% |
| Scotch-Irish | 7 | 0.1% |
| Sri Lankan | 1 | 0.0% |
| Swiss | 43 | 0.8% |
| Thai | 75 | 1.4% |
| Ukrainian | 6 | 0.1% | View All 18 Rows |
Immigrants in Walterboro
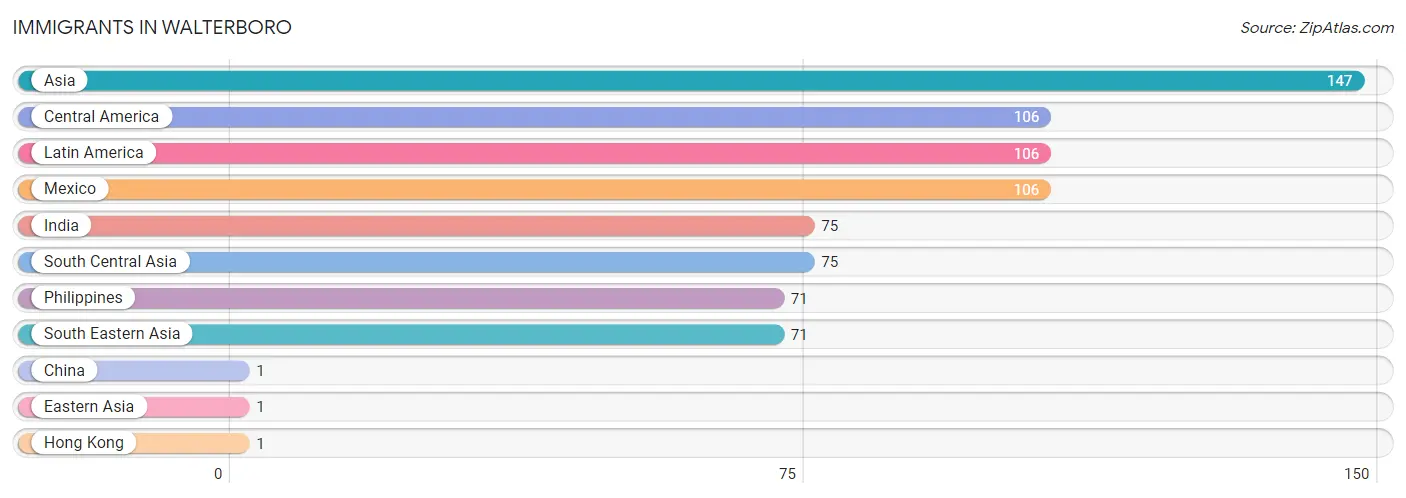
The most numerous immigrant groups reported in Walterboro came from Asia (147 | 2.7%), Central America (106 | 1.9%), Latin America (106 | 1.9%), Mexico (106 | 1.9%), and India (75 | 1.4%), together accounting for 9.8% of all Walterboro residents.
| Immigration Origin | # Population | % Population |
| Asia | 147 | 2.7% |
| Central America | 106 | 1.9% |
| China | 1 | 0.0% |
| Eastern Asia | 1 | 0.0% |
| Hong Kong | 1 | 0.0% |
| India | 75 | 1.4% |
| Latin America | 106 | 1.9% |
| Mexico | 106 | 1.9% |
| Philippines | 71 | 1.3% |
| South Central Asia | 75 | 1.4% |
| South Eastern Asia | 71 | 1.3% | View All 11 Rows |
Sex and Age in Walterboro
Sex and Age in Walterboro
The most populous age groups in Walterboro are 5 to 9 Years (219 | 9.2%) for men and 5 to 9 Years (381 | 12.1%) for women.
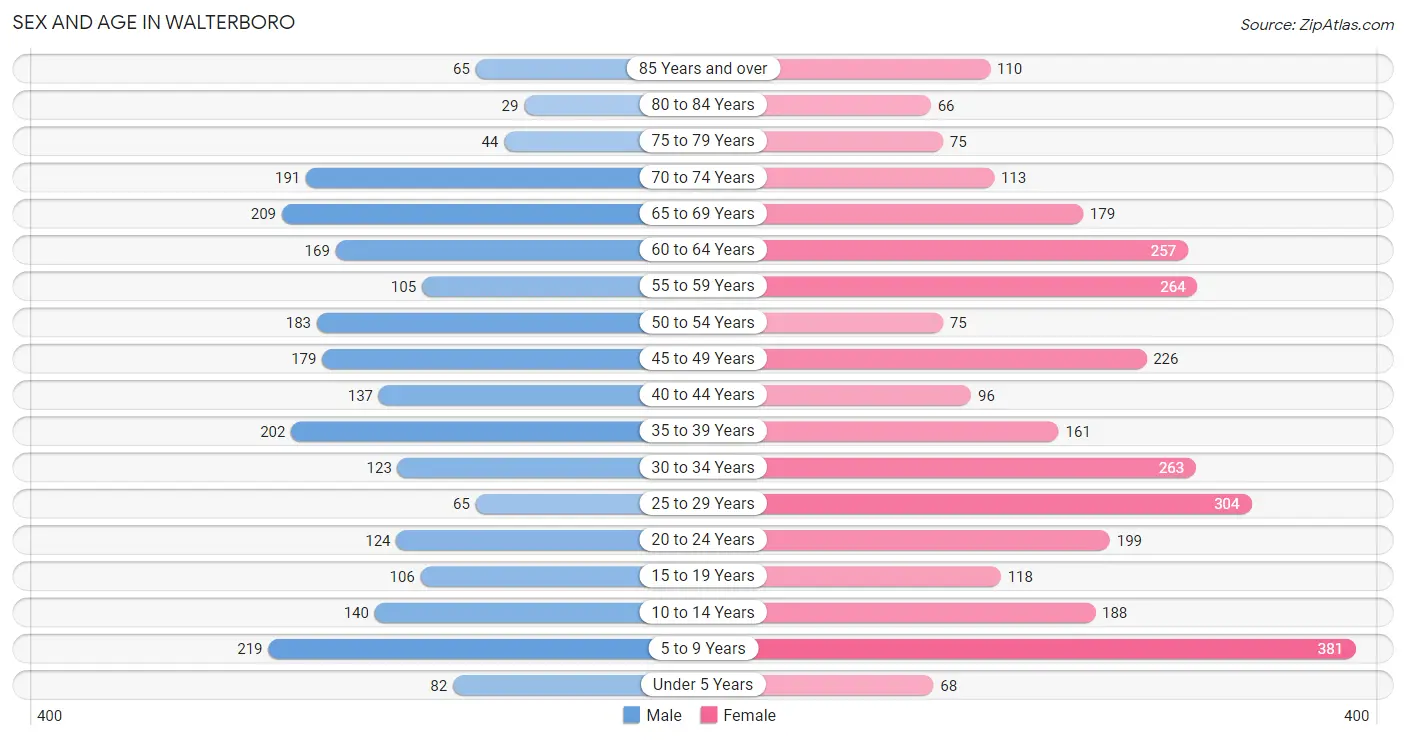
| Age Bracket | Male | Female |
| Under 5 Years | 82 (3.5%) | 68 (2.2%) |
| 5 to 9 Years | 219 (9.2%) | 381 (12.1%) |
| 10 to 14 Years | 140 (5.9%) | 188 (6.0%) |
| 15 to 19 Years | 106 (4.5%) | 118 (3.7%) |
| 20 to 24 Years | 124 (5.2%) | 199 (6.3%) |
| 25 to 29 Years | 65 (2.7%) | 304 (9.7%) |
| 30 to 34 Years | 123 (5.2%) | 263 (8.4%) |
| 35 to 39 Years | 202 (8.5%) | 161 (5.1%) |
| 40 to 44 Years | 137 (5.8%) | 96 (3.0%) |
| 45 to 49 Years | 179 (7.5%) | 226 (7.2%) |
| 50 to 54 Years | 183 (7.7%) | 75 (2.4%) |
| 55 to 59 Years | 105 (4.4%) | 264 (8.4%) |
| 60 to 64 Years | 169 (7.1%) | 257 (8.2%) |
| 65 to 69 Years | 209 (8.8%) | 179 (5.7%) |
| 70 to 74 Years | 191 (8.1%) | 113 (3.6%) |
| 75 to 79 Years | 44 (1.8%) | 75 (2.4%) |
| 80 to 84 Years | 29 (1.2%) | 66 (2.1%) |
| 85 Years and over | 65 (2.7%) | 110 (3.5%) |
| Total | 2,372 (100.0%) | 3,143 (100.0%) |
Families and Households in Walterboro
Median Family Size in Walterboro
The median family size in Walterboro is 2.66 persons per family, with married-couple families (886 | 59.0%) accounting for the largest median family size of 2.83 persons per family. On the other hand, single female/mother families (518 | 34.5%) represent the smallest median family size with 2.41 persons per family.
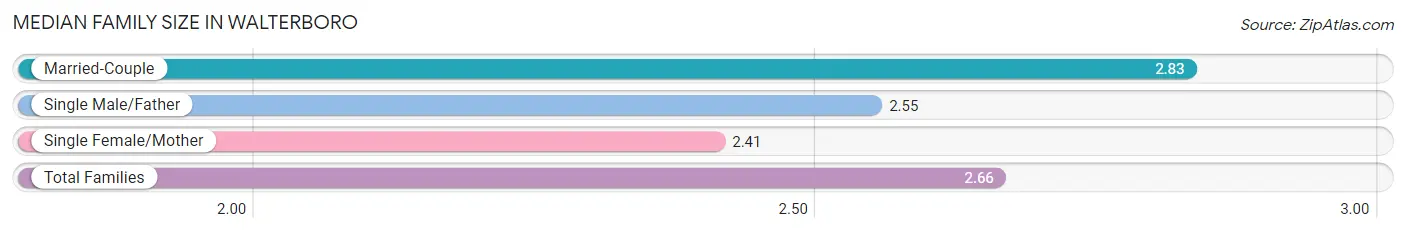
| Family Type | # Families | Family Size |
| Married-Couple | 886 (59.0%) | 2.83 |
| Single Male/Father | 97 (6.5%) | 2.55 |
| Single Female/Mother | 518 (34.5%) | 2.41 |
| Total Families | 1,501 (100.0%) | 2.66 |
Median Household Size in Walterboro
The median household size in Walterboro is 2.35 persons per household, with single male/father households (97 | 4.3%) accounting for the largest median household size of 4.05 persons per household. non-family households (774 | 34.0%) represent the smallest median household size with 1.56 persons per household.
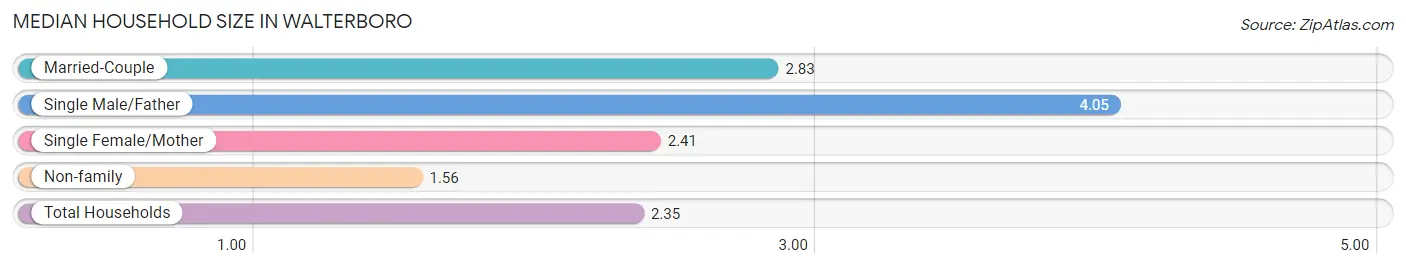
| Household Type | # Households | Household Size |
| Married-Couple | 886 (39.0%) | 2.83 |
| Single Male/Father | 97 (4.3%) | 4.05 |
| Single Female/Mother | 518 (22.8%) | 2.41 |
| Non-family | 774 (34.0%) | 1.56 |
| Total Households | 2,275 (100.0%) | 2.35 |
Household Size by Marriage Status in Walterboro
Out of a total of 2,275 households in Walterboro, 1,501 (66.0%) are family households, while 774 (34.0%) are nonfamily households. The most numerous type of family households are 2-person households, comprising 772, and the most common type of nonfamily households are 1-person households, comprising 559.
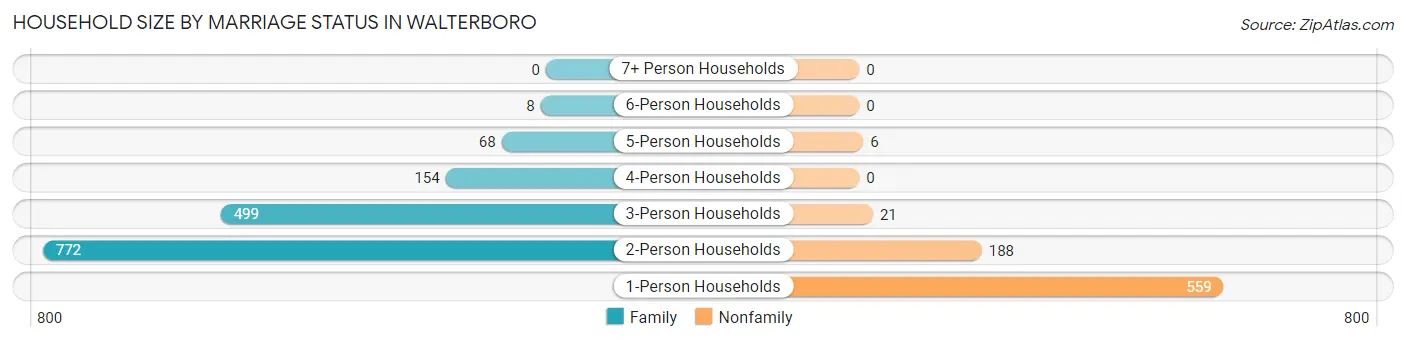
| Household Size | Family Households | Nonfamily Households |
| 1-Person Households | - | 559 (24.6%) |
| 2-Person Households | 772 (33.9%) | 188 (8.3%) |
| 3-Person Households | 499 (21.9%) | 21 (0.9%) |
| 4-Person Households | 154 (6.8%) | 0 (0.0%) |
| 5-Person Households | 68 (3.0%) | 6 (0.3%) |
| 6-Person Households | 8 (0.4%) | 0 (0.0%) |
| 7+ Person Households | 0 (0.0%) | 0 (0.0%) |
| Total | 1,501 (66.0%) | 774 (34.0%) |
Female Fertility in Walterboro
Fertility by Age in Walterboro
| Age Bracket | Women with Births | Births / 1,000 Women |
| 15 to 19 years | 0 (0.0%) | 0.0 |
| 20 to 34 years | 0 (0.0%) | 0.0 |
| 35 to 50 years | 0 (0.0%) | 0.0 |
| Total | 0 (0.0%) | 0.0 |
Fertility by Age by Marriage Status in Walterboro
| Age Bracket | Married | Unmarried |
| 15 to 19 years | 0 (0.0%) | 0 (0.0%) |
| 20 to 34 years | 0 (0.0%) | 0 (0.0%) |
| 35 to 50 years | 0 (0.0%) | 0 (0.0%) |
| Total | 0 (0.0%) | 0 (0.0%) |
Fertility by Education in Walterboro
| Educational Attainment | Women with Births | Births / 1,000 Women |
| Less than High School | 0 (0.0%) | 0.0 |
| High School Diploma | 0 (0.0%) | 0.0 |
| College or Associate's Degree | 0 (0.0%) | 0.0 |
| Bachelor's Degree | 0 (0.0%) | 0.0 |
| Graduate Degree | 0 (0.0%) | 0.0 |
| Total | 0 (0.0%) | 0.0 |
Fertility by Education by Marriage Status in Walterboro
| Educational Attainment | Married | Unmarried |
| Less than High School | 0 (0.0%) | 0 (0.0%) |
| High School Diploma | 0 (0.0%) | 0 (0.0%) |
| College or Associate's Degree | 0 (0.0%) | 0 (0.0%) |
| Bachelor's Degree | 0 (0.0%) | 0 (0.0%) |
| Graduate Degree | 0 (0.0%) | 0 (0.0%) |
| Total | 0 (0.0%) | 0 (0.0%) |
Employment Characteristics in Walterboro
Employment by Class of Employer in Walterboro
Among the 2,440 employed individuals in Walterboro, private company employees (1,605 | 65.8%), local government employees (378 | 15.5%), and self-employed (not incorporated) (148 | 6.1%) make up the most common classes of employment.
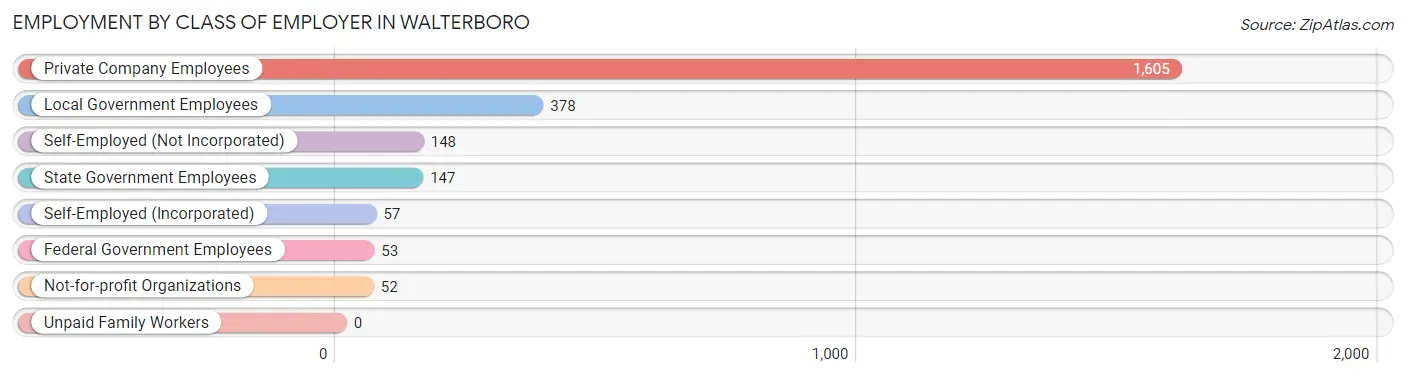
| Employer Class | # Employees | % Employees |
| Private Company Employees | 1,605 | 65.8% |
| Self-Employed (Incorporated) | 57 | 2.3% |
| Self-Employed (Not Incorporated) | 148 | 6.1% |
| Not-for-profit Organizations | 52 | 2.1% |
| Local Government Employees | 378 | 15.5% |
| State Government Employees | 147 | 6.0% |
| Federal Government Employees | 53 | 2.2% |
| Unpaid Family Workers | 0 | 0.0% |
| Total | 2,440 | 100.0% |
Employment Status by Age in Walterboro
According to the labor force statistics for Walterboro, out of the total population over 16 years of age (4,437), 56.7% or 2,516 individuals are in the labor force, with 3.1% or 78 of them unemployed. The age group with the highest labor force participation rate is 25 to 29 years, with 98.9% or 365 individuals in the labor force. Within the labor force, the 20 to 24 years age range has the highest percentage of unemployed individuals, with 14.3% or 24 of them being unemployed.
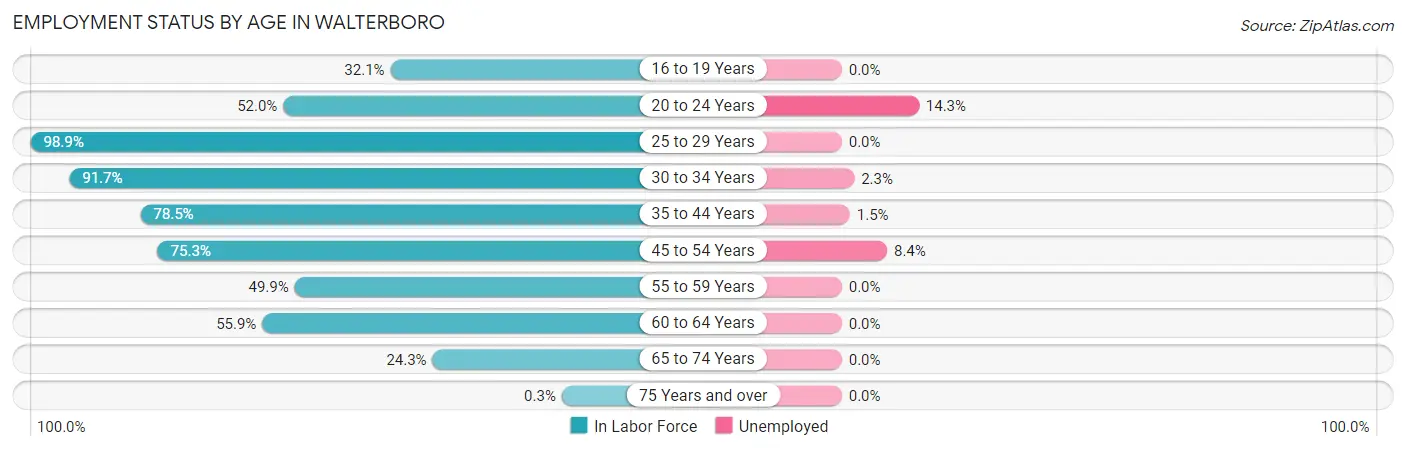
| Age Bracket | In Labor Force | Unemployed |
| 16 to 19 Years | 72 (32.1%) | 0 (0.0%) |
| 20 to 24 Years | 168 (52.0%) | 24 (14.3%) |
| 25 to 29 Years | 365 (98.9%) | 0 (0.0%) |
| 30 to 34 Years | 354 (91.7%) | 8 (2.3%) |
| 35 to 44 Years | 468 (78.5%) | 7 (1.5%) |
| 45 to 54 Years | 499 (75.3%) | 42 (8.4%) |
| 55 to 59 Years | 184 (49.9%) | 0 (0.0%) |
| 60 to 64 Years | 238 (55.9%) | 0 (0.0%) |
| 65 to 74 Years | 168 (24.3%) | 0 (0.0%) |
| 75 Years and over | 1 (0.3%) | 0 (0.0%) |
| Total | 2,516 (56.7%) | 78 (3.1%) |
Employment Status by Educational Attainment in Walterboro
According to labor force statistics for Walterboro, 75.0% of individuals (2,107) out of the total population between 25 and 64 years of age (2,809) are in the labor force, with 2.7% or 57 of them being unemployed. The group with the highest labor force participation rate are those with the educational attainment of college / associate degree, with 79.7% or 663 individuals in the labor force. Within the labor force, individuals with less than high school education have the highest percentage of unemployment, with 10.6% or 42 of them being unemployed.
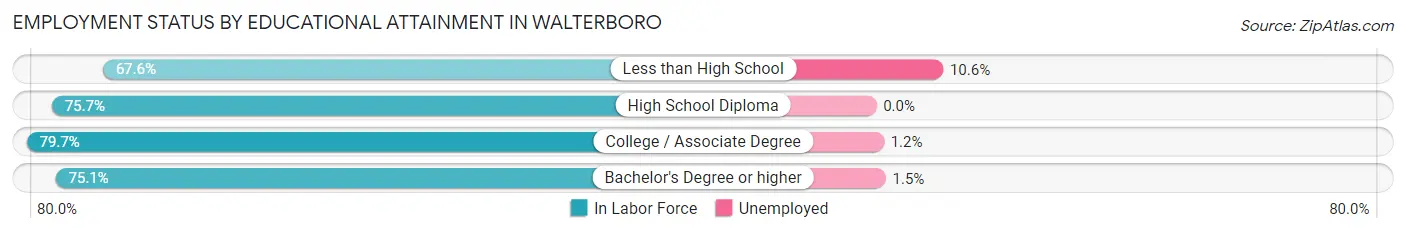
| Educational Attainment | In Labor Force | Unemployed |
| Less than High School | 398 (67.6%) | 62 (10.6%) |
| High School Diploma | 583 (75.7%) | 0 (0.0%) |
| College / Associate Degree | 663 (79.7%) | 10 (1.2%) |
| Bachelor's Degree or higher | 464 (75.1%) | 9 (1.5%) |
| Total | 2,107 (75.0%) | 76 (2.7%) |
Employment Occupations by Sex in Walterboro
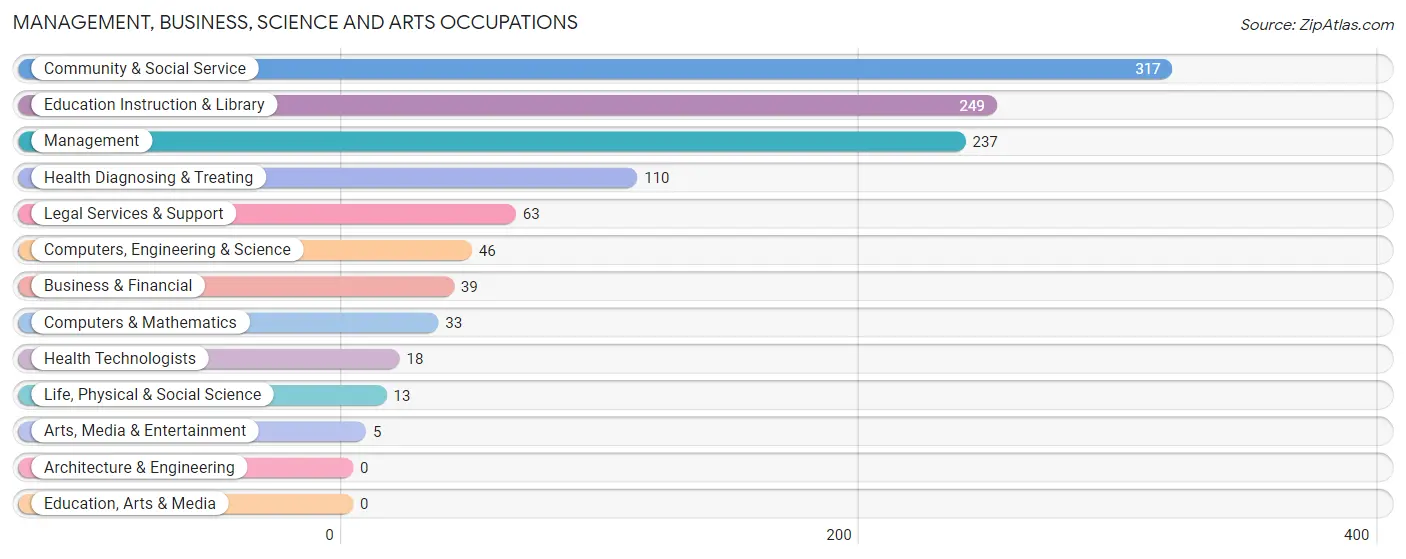
Management, Business, Science and Arts Occupations
The most common Management, Business, Science and Arts occupations in Walterboro are Community & Social Service (317 | 13.2%), Education Instruction & Library (249 | 10.4%), Management (237 | 9.9%), Health Diagnosing & Treating (110 | 4.6%), and Legal Services & Support (63 | 2.6%).
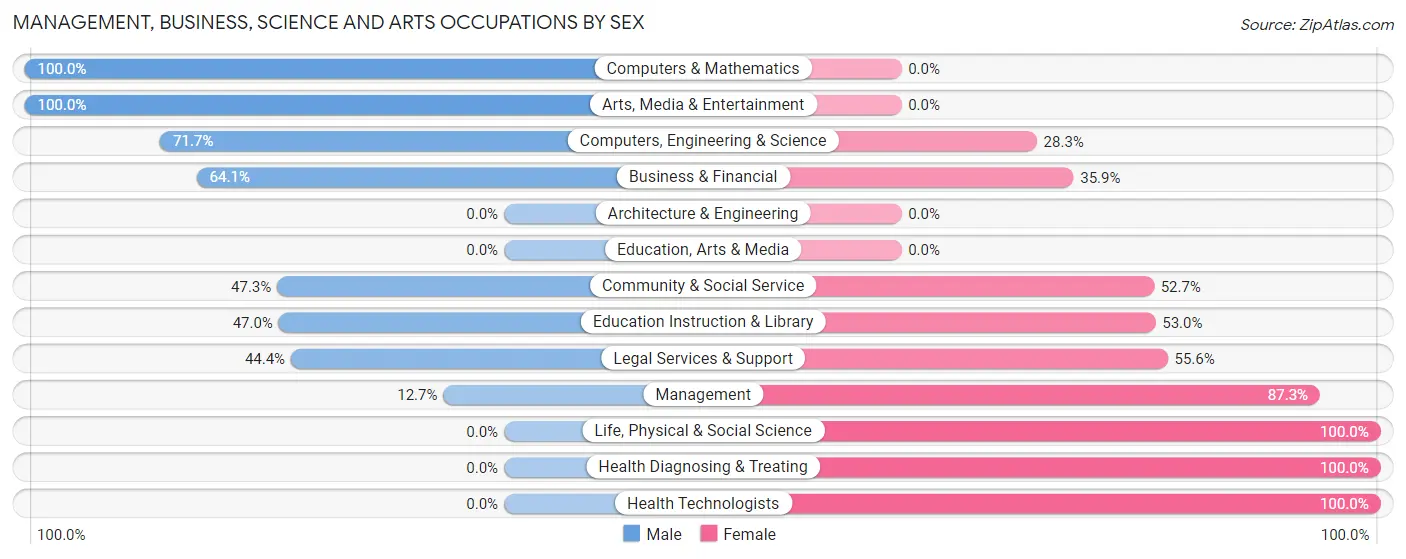
Management, Business, Science and Arts Occupations by Sex
Within the Management, Business, Science and Arts occupations in Walterboro, the most male-oriented occupations are Computers & Mathematics (100.0%), Arts, Media & Entertainment (100.0%), and Computers, Engineering & Science (71.7%), while the most female-oriented occupations are Life, Physical & Social Science (100.0%), Health Diagnosing & Treating (100.0%), and Health Technologists (100.0%).
| Occupation | Male | Female |
| Management | 30 (12.7%) | 207 (87.3%) |
| Business & Financial | 25 (64.1%) | 14 (35.9%) |
| Computers, Engineering & Science | 33 (71.7%) | 13 (28.3%) |
| Computers & Mathematics | 33 (100.0%) | 0 (0.0%) |
| Architecture & Engineering | 0 (0.0%) | 0 (0.0%) |
| Life, Physical & Social Science | 0 (0.0%) | 13 (100.0%) |
| Community & Social Service | 150 (47.3%) | 167 (52.7%) |
| Education, Arts & Media | 0 (0.0%) | 0 (0.0%) |
| Legal Services & Support | 28 (44.4%) | 35 (55.6%) |
| Education Instruction & Library | 117 (47.0%) | 132 (53.0%) |
| Arts, Media & Entertainment | 5 (100.0%) | 0 (0.0%) |
| Health Diagnosing & Treating | 0 (0.0%) | 110 (100.0%) |
| Health Technologists | 0 (0.0%) | 18 (100.0%) |
| Total (Category) | 238 (31.8%) | 511 (68.2%) |
| Total (Overall) | 1,108 (46.2%) | 1,293 (53.8%) |
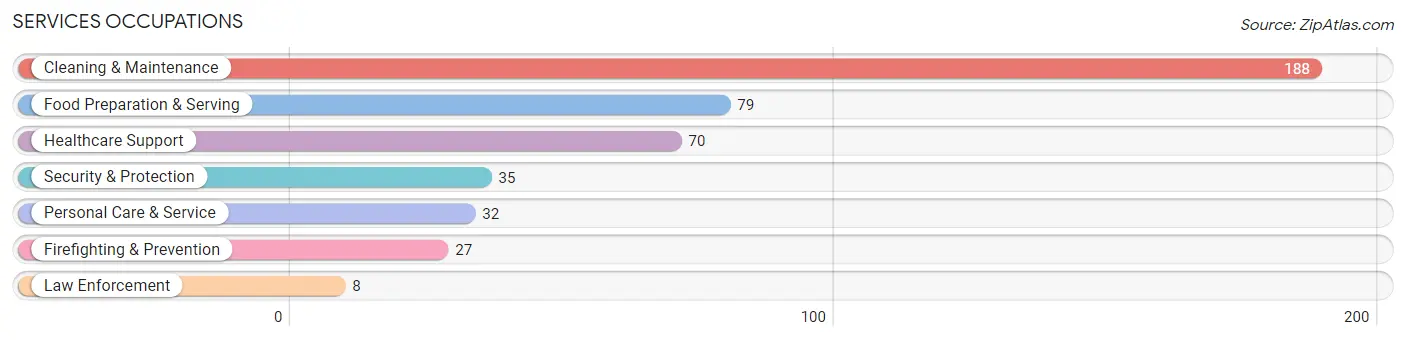
Services Occupations
The most common Services occupations in Walterboro are Cleaning & Maintenance (188 | 7.8%), Food Preparation & Serving (79 | 3.3%), Healthcare Support (70 | 2.9%), Security & Protection (35 | 1.5%), and Personal Care & Service (32 | 1.3%).
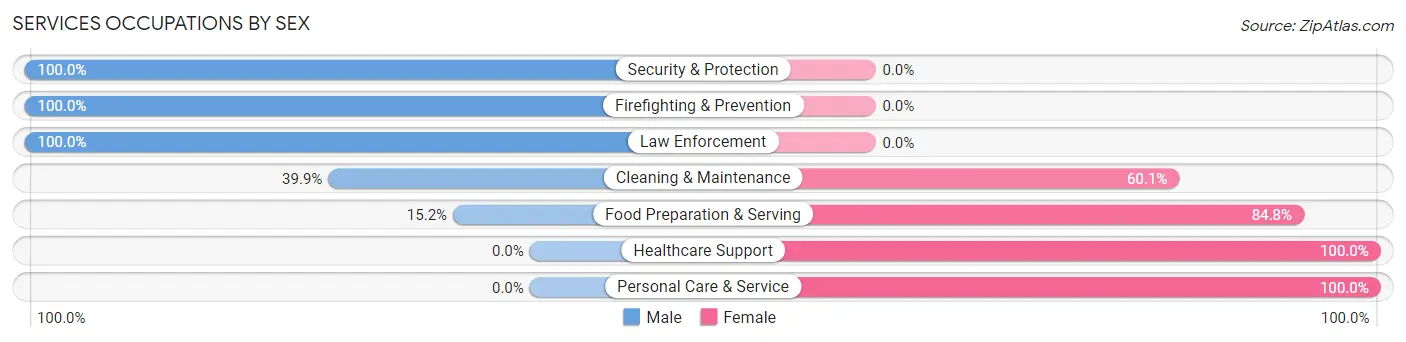
Services Occupations by Sex
Within the Services occupations in Walterboro, the most male-oriented occupations are Security & Protection (100.0%), Firefighting & Prevention (100.0%), and Law Enforcement (100.0%), while the most female-oriented occupations are Healthcare Support (100.0%), Personal Care & Service (100.0%), and Food Preparation & Serving (84.8%).
| Occupation | Male | Female |
| Healthcare Support | 0 (0.0%) | 70 (100.0%) |
| Security & Protection | 35 (100.0%) | 0 (0.0%) |
| Firefighting & Prevention | 27 (100.0%) | 0 (0.0%) |
| Law Enforcement | 8 (100.0%) | 0 (0.0%) |
| Food Preparation & Serving | 12 (15.2%) | 67 (84.8%) |
| Cleaning & Maintenance | 75 (39.9%) | 113 (60.1%) |
| Personal Care & Service | 0 (0.0%) | 32 (100.0%) |
| Total (Category) | 122 (30.2%) | 282 (69.8%) |
| Total (Overall) | 1,108 (46.2%) | 1,293 (53.8%) |
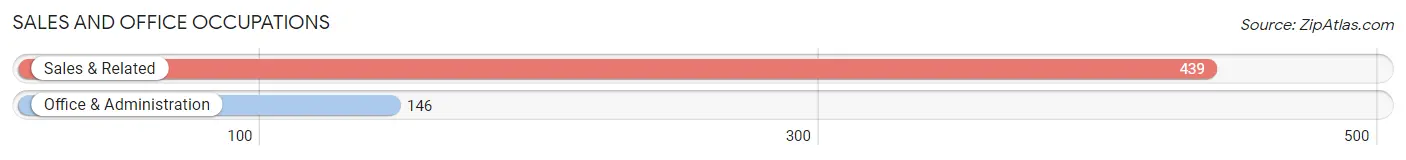
Sales and Office Occupations
The most common Sales and Office occupations in Walterboro are Sales & Related (439 | 18.3%), and Office & Administration (146 | 6.1%).
Sales and Office Occupations by Sex
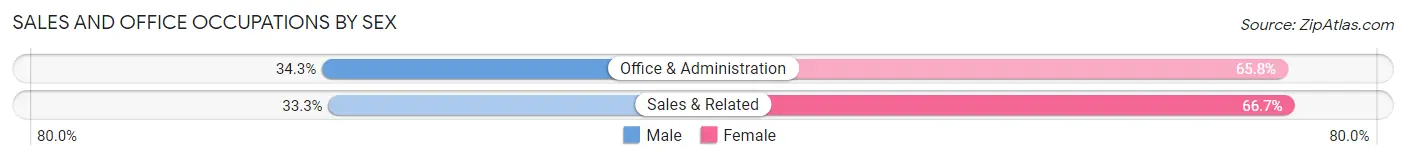
| Occupation | Male | Female |
| Sales & Related | 146 (33.3%) | 293 (66.7%) |
| Office & Administration | 50 (34.3%) | 96 (65.7%) |
| Total (Category) | 196 (33.5%) | 389 (66.5%) |
| Total (Overall) | 1,108 (46.2%) | 1,293 (53.8%) |
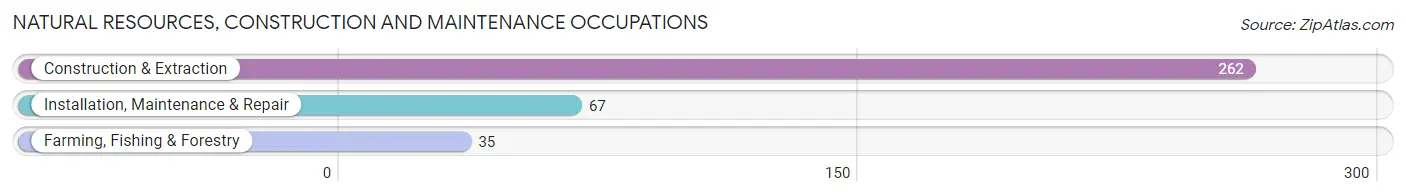
Natural Resources, Construction and Maintenance Occupations
The most common Natural Resources, Construction and Maintenance occupations in Walterboro are Construction & Extraction (262 | 10.9%), Installation, Maintenance & Repair (67 | 2.8%), and Farming, Fishing & Forestry (35 | 1.5%).
Natural Resources, Construction and Maintenance Occupations by Sex
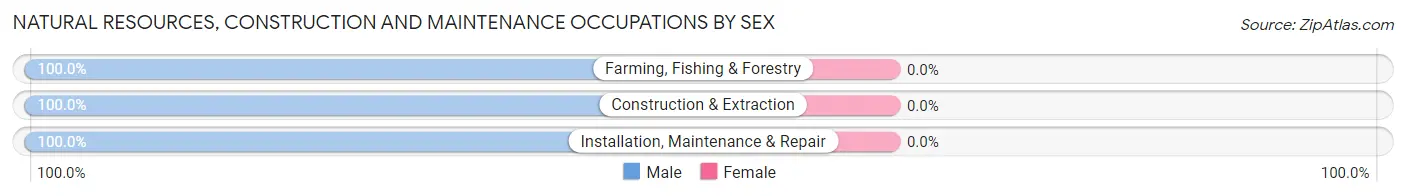
| Occupation | Male | Female |
| Farming, Fishing & Forestry | 35 (100.0%) | 0 (0.0%) |
| Construction & Extraction | 262 (100.0%) | 0 (0.0%) |
| Installation, Maintenance & Repair | 67 (100.0%) | 0 (0.0%) |
| Total (Category) | 364 (100.0%) | 0 (0.0%) |
| Total (Overall) | 1,108 (46.2%) | 1,293 (53.8%) |
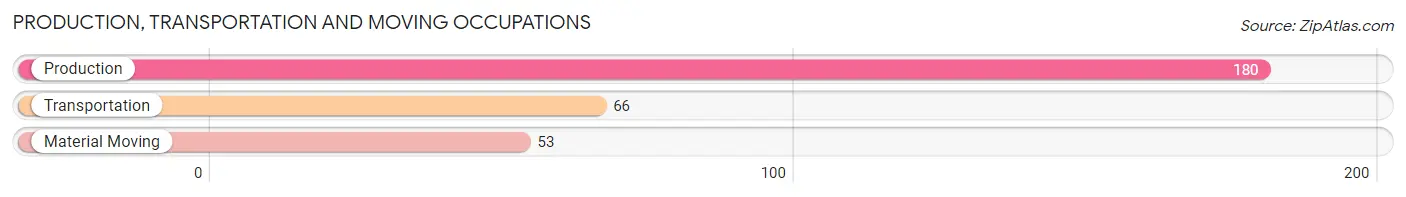
Production, Transportation and Moving Occupations
The most common Production, Transportation and Moving occupations in Walterboro are Production (180 | 7.5%), Transportation (66 | 2.8%), and Material Moving (53 | 2.2%).
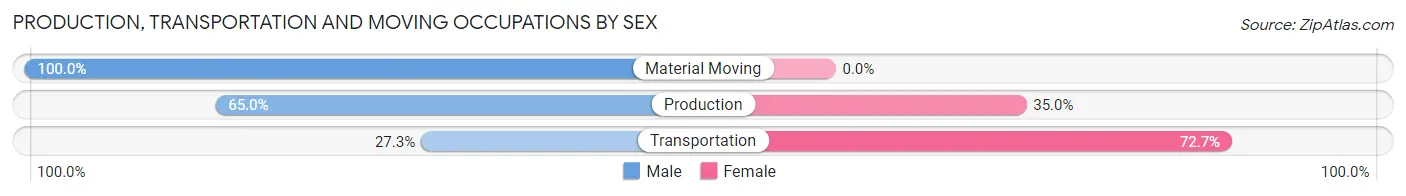
Production, Transportation and Moving Occupations by Sex
| Occupation | Male | Female |
| Production | 117 (65.0%) | 63 (35.0%) |
| Transportation | 18 (27.3%) | 48 (72.7%) |
| Material Moving | 53 (100.0%) | 0 (0.0%) |
| Total (Category) | 188 (62.9%) | 111 (37.1%) |
| Total (Overall) | 1,108 (46.2%) | 1,293 (53.8%) |
Employment Industries by Sex in Walterboro
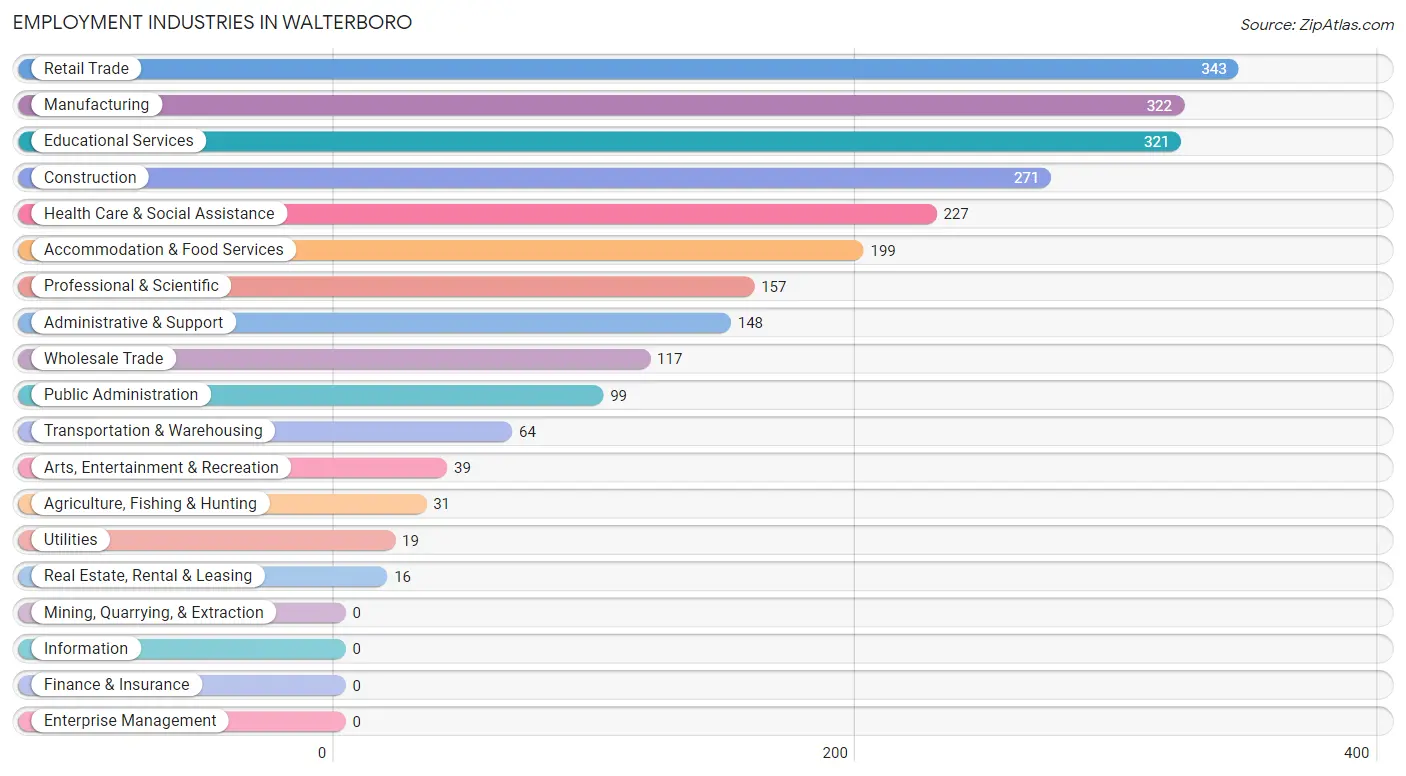
Employment Industries in Walterboro
The major employment industries in Walterboro include Retail Trade (343 | 14.3%), Manufacturing (322 | 13.4%), Educational Services (321 | 13.4%), Construction (271 | 11.3%), and Health Care & Social Assistance (227 | 9.5%).
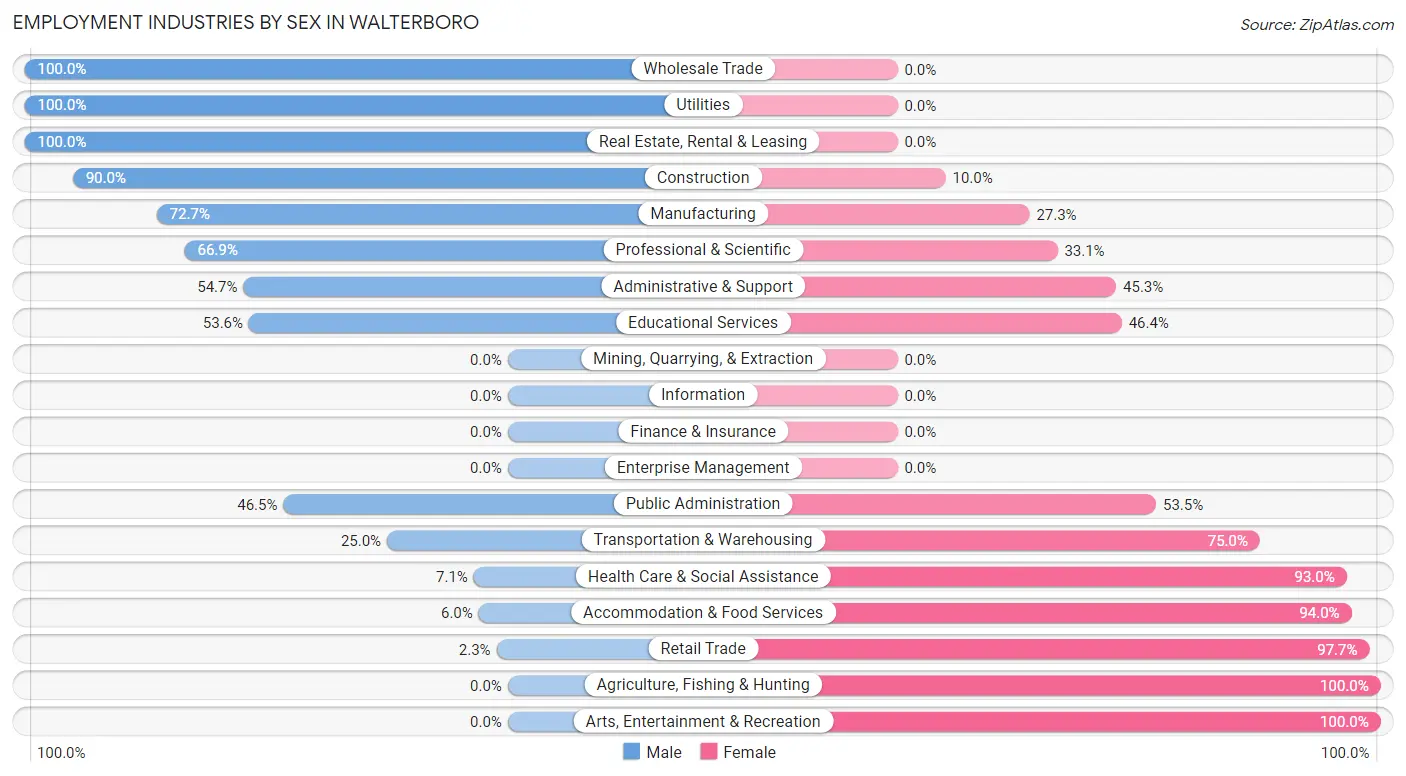
Employment Industries by Sex in Walterboro
The Walterboro industries that see more men than women are Wholesale Trade (100.0%), Utilities (100.0%), and Real Estate, Rental & Leasing (100.0%), whereas the industries that tend to have a higher number of women are Agriculture, Fishing & Hunting (100.0%), Arts, Entertainment & Recreation (100.0%), and Retail Trade (97.7%).
| Industry | Male | Female |
| Agriculture, Fishing & Hunting | 0 (0.0%) | 31 (100.0%) |
| Mining, Quarrying, & Extraction | 0 (0.0%) | 0 (0.0%) |
| Construction | 244 (90.0%) | 27 (10.0%) |
| Manufacturing | 234 (72.7%) | 88 (27.3%) |
| Wholesale Trade | 117 (100.0%) | 0 (0.0%) |
| Retail Trade | 8 (2.3%) | 335 (97.7%) |
| Transportation & Warehousing | 16 (25.0%) | 48 (75.0%) |
| Utilities | 19 (100.0%) | 0 (0.0%) |
| Information | 0 (0.0%) | 0 (0.0%) |
| Finance & Insurance | 0 (0.0%) | 0 (0.0%) |
| Real Estate, Rental & Leasing | 16 (100.0%) | 0 (0.0%) |
| Professional & Scientific | 105 (66.9%) | 52 (33.1%) |
| Enterprise Management | 0 (0.0%) | 0 (0.0%) |
| Administrative & Support | 81 (54.7%) | 67 (45.3%) |
| Educational Services | 172 (53.6%) | 149 (46.4%) |
| Health Care & Social Assistance | 16 (7.0%) | 211 (92.9%) |
| Arts, Entertainment & Recreation | 0 (0.0%) | 39 (100.0%) |
| Accommodation & Food Services | 12 (6.0%) | 187 (94.0%) |
| Public Administration | 46 (46.5%) | 53 (53.5%) |
| Total | 1,108 (46.2%) | 1,293 (53.8%) |
Education in Walterboro
School Enrollment in Walterboro
The most common levels of schooling among the 1,178 students in Walterboro are elementary school (518 | 44.0%), college / undergraduate (163 | 13.8%), and high school (158 | 13.4%).
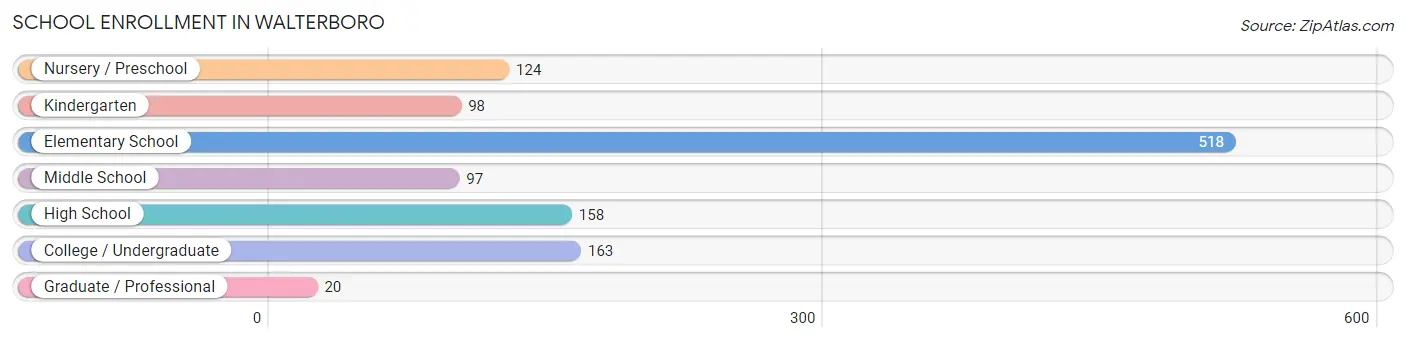
| School Level | # Students | % Students |
| Nursery / Preschool | 124 | 10.5% |
| Kindergarten | 98 | 8.3% |
| Elementary School | 518 | 44.0% |
| Middle School | 97 | 8.2% |
| High School | 158 | 13.4% |
| College / Undergraduate | 163 | 13.8% |
| Graduate / Professional | 20 | 1.7% |
| Total | 1,178 | 100.0% |
School Enrollment by Age by Funding Source in Walterboro
Out of a total of 1,178 students who are enrolled in schools in Walterboro, 40 (3.4%) attend a private institution, while the remaining 1,138 (96.6%) are enrolled in public schools. The age group of 35 years and over has the highest likelihood of being enrolled in private schools, with 20 (90.9% in the age bracket) enrolled. Conversely, the age group of 10 to 14 year olds has the lowest likelihood of being enrolled in a private school, with 245 (100.0% in the age bracket) attending a public institution.
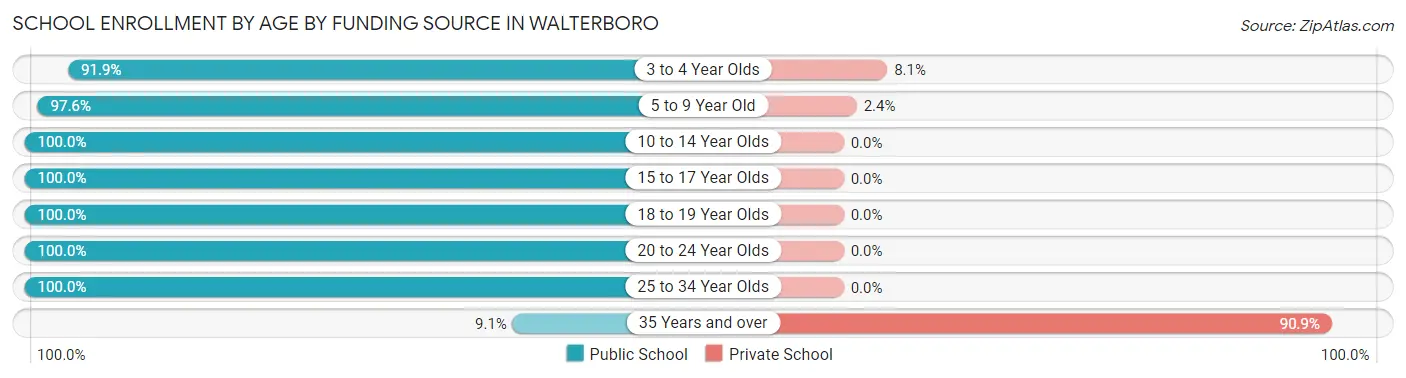
| Age Bracket | Public School | Private School |
| 3 to 4 Year Olds | 68 (91.9%) | 6 (8.1%) |
| 5 to 9 Year Old | 561 (97.6%) | 14 (2.4%) |
| 10 to 14 Year Olds | 245 (100.0%) | 0 (0.0%) |
| 15 to 17 Year Olds | 162 (100.0%) | 0 (0.0%) |
| 18 to 19 Year Olds | 51 (100.0%) | 0 (0.0%) |
| 20 to 24 Year Olds | 40 (100.0%) | 0 (0.0%) |
| 25 to 34 Year Olds | 9 (100.0%) | 0 (0.0%) |
| 35 Years and over | 2 (9.1%) | 20 (90.9%) |
| Total | 1,138 (96.6%) | 40 (3.4%) |
Educational Attainment by Field of Study in Walterboro
Education (374 | 44.2%), business (183 | 21.6%), bio, nature & agricultural (75 | 8.9%), psychology (54 | 6.4%), and social sciences (52 | 6.1%) are the most common fields of study among 846 individuals in Walterboro who have obtained a bachelor's degree or higher.
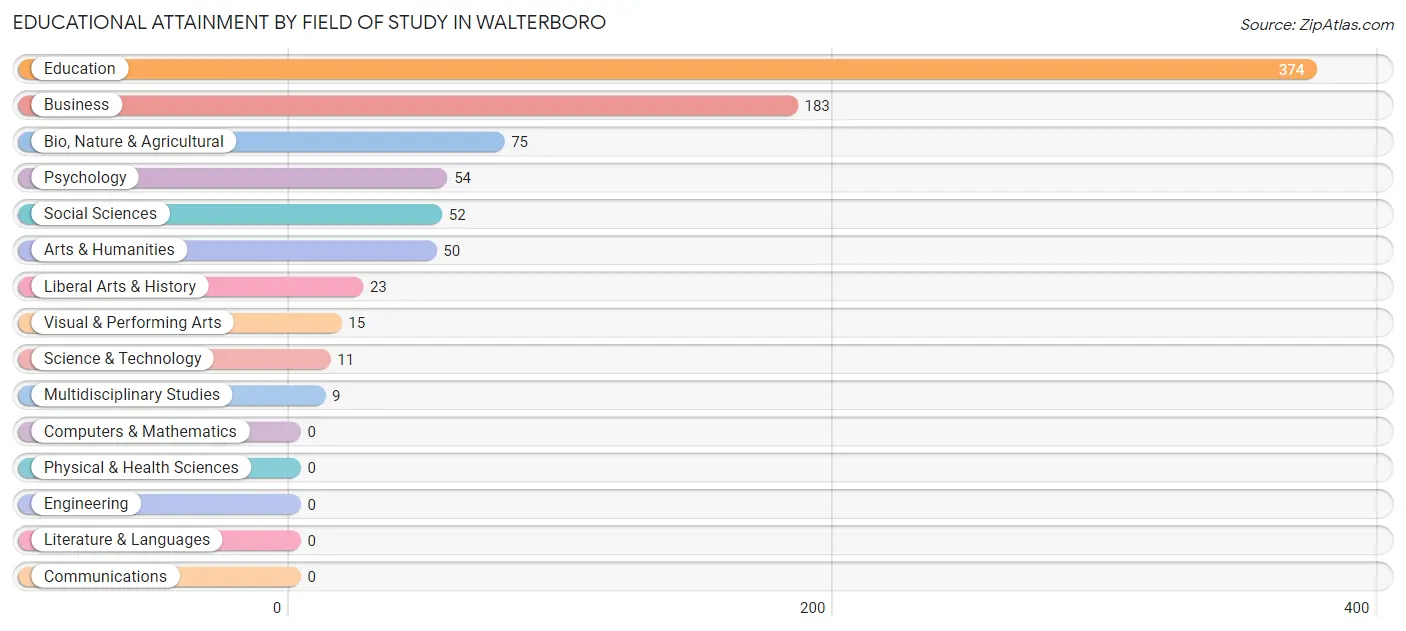
| Field of Study | # Graduates | % Graduates |
| Computers & Mathematics | 0 | 0.0% |
| Bio, Nature & Agricultural | 75 | 8.9% |
| Physical & Health Sciences | 0 | 0.0% |
| Psychology | 54 | 6.4% |
| Social Sciences | 52 | 6.1% |
| Engineering | 0 | 0.0% |
| Multidisciplinary Studies | 9 | 1.1% |
| Science & Technology | 11 | 1.3% |
| Business | 183 | 21.6% |
| Education | 374 | 44.2% |
| Literature & Languages | 0 | 0.0% |
| Liberal Arts & History | 23 | 2.7% |
| Visual & Performing Arts | 15 | 1.8% |
| Communications | 0 | 0.0% |
| Arts & Humanities | 50 | 5.9% |
| Total | 846 | 100.0% |
Transportation & Commute in Walterboro
Vehicle Availability by Sex in Walterboro
The most prevalent vehicle ownership categories in Walterboro are males with 2 vehicles (474, accounting for 43.0%) and females with 2 vehicles (537, making up 35.6%).
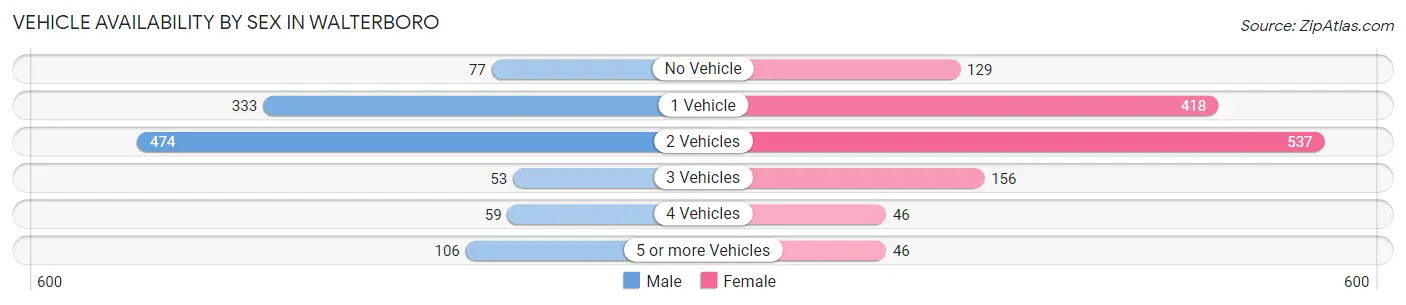
| Vehicles Available | Male | Female |
| No Vehicle | 77 (7.0%) | 129 (9.7%) |
| 1 Vehicle | 333 (30.2%) | 418 (31.4%) |
| 2 Vehicles | 474 (43.0%) | 537 (40.3%) |
| 3 Vehicles | 53 (4.8%) | 156 (11.7%) |
| 4 Vehicles | 59 (5.3%) | 46 (3.5%) |
| 5 or more Vehicles | 106 (9.6%) | 46 (3.5%) |
| Total | 1,102 (100.0%) | 1,332 (100.0%) |
Commute Time in Walterboro
The most frequently occuring commute durations in Walterboro are 30 to 34 minutes (397 commuters, 18.1%), 15 to 19 minutes (308 commuters, 14.0%), and 5 to 9 minutes (299 commuters, 13.6%).
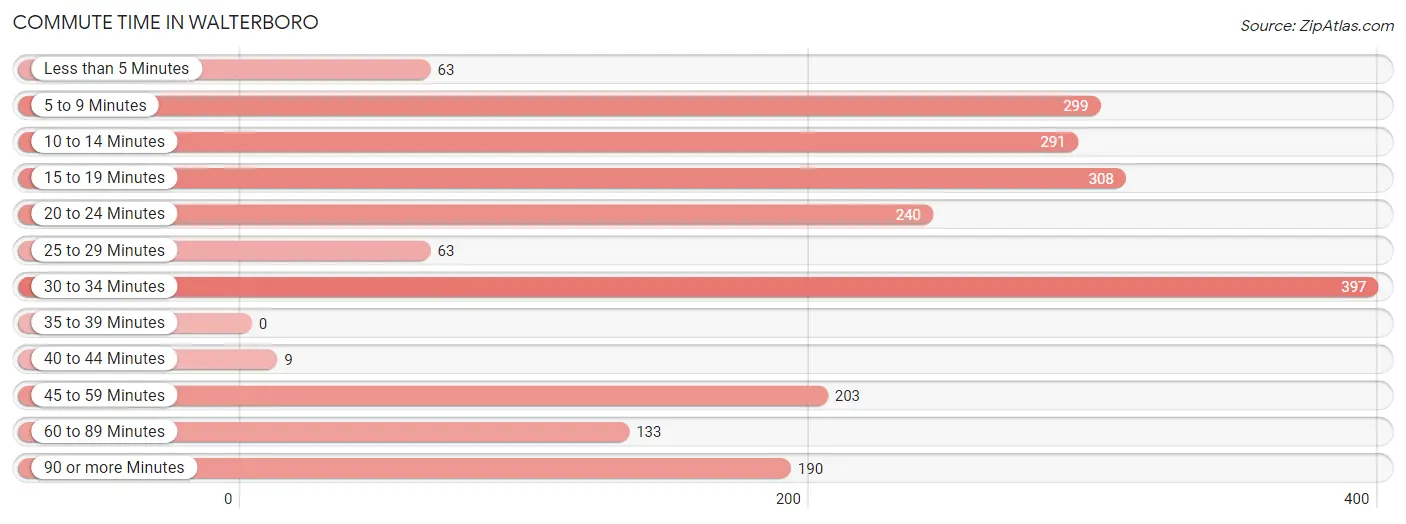
| Commute Time | # Commuters | % Commuters |
| Less than 5 Minutes | 63 | 2.9% |
| 5 to 9 Minutes | 299 | 13.6% |
| 10 to 14 Minutes | 291 | 13.3% |
| 15 to 19 Minutes | 308 | 14.0% |
| 20 to 24 Minutes | 240 | 10.9% |
| 25 to 29 Minutes | 63 | 2.9% |
| 30 to 34 Minutes | 397 | 18.1% |
| 35 to 39 Minutes | 0 | 0.0% |
| 40 to 44 Minutes | 9 | 0.4% |
| 45 to 59 Minutes | 203 | 9.2% |
| 60 to 89 Minutes | 133 | 6.1% |
| 90 or more Minutes | 190 | 8.6% |
Commute Time by Sex in Walterboro
The most common commute times in Walterboro are 15 to 19 minutes (204 commuters, 19.8%) for males and 5 to 9 minutes (274 commuters, 23.5%) for females.
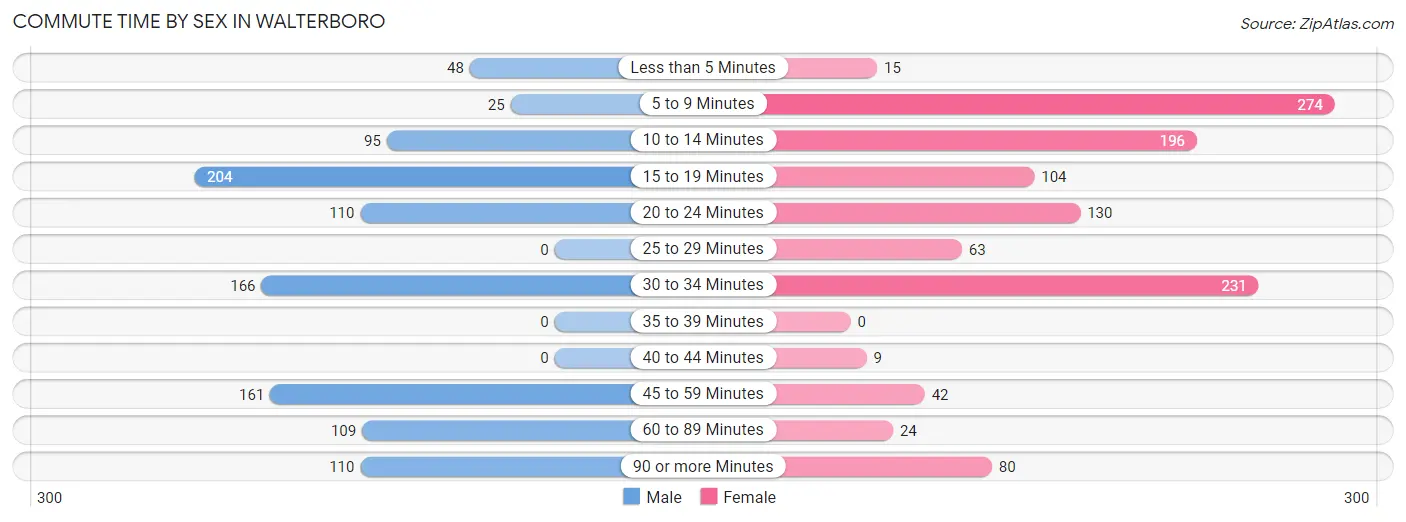
| Commute Time | Male | Female |
| Less than 5 Minutes | 48 (4.7%) | 15 (1.3%) |
| 5 to 9 Minutes | 25 (2.4%) | 274 (23.5%) |
| 10 to 14 Minutes | 95 (9.2%) | 196 (16.8%) |
| 15 to 19 Minutes | 204 (19.8%) | 104 (8.9%) |
| 20 to 24 Minutes | 110 (10.7%) | 130 (11.1%) |
| 25 to 29 Minutes | 0 (0.0%) | 63 (5.4%) |
| 30 to 34 Minutes | 166 (16.2%) | 231 (19.8%) |
| 35 to 39 Minutes | 0 (0.0%) | 0 (0.0%) |
| 40 to 44 Minutes | 0 (0.0%) | 9 (0.8%) |
| 45 to 59 Minutes | 161 (15.7%) | 42 (3.6%) |
| 60 to 89 Minutes | 109 (10.6%) | 24 (2.1%) |
| 90 or more Minutes | 110 (10.7%) | 80 (6.9%) |
Time of Departure to Work by Sex in Walterboro
The most frequent times of departure to work in Walterboro are 7:00 AM to 7:29 AM (266, 25.9%) for males and 7:30 AM to 7:59 AM (298, 25.5%) for females.
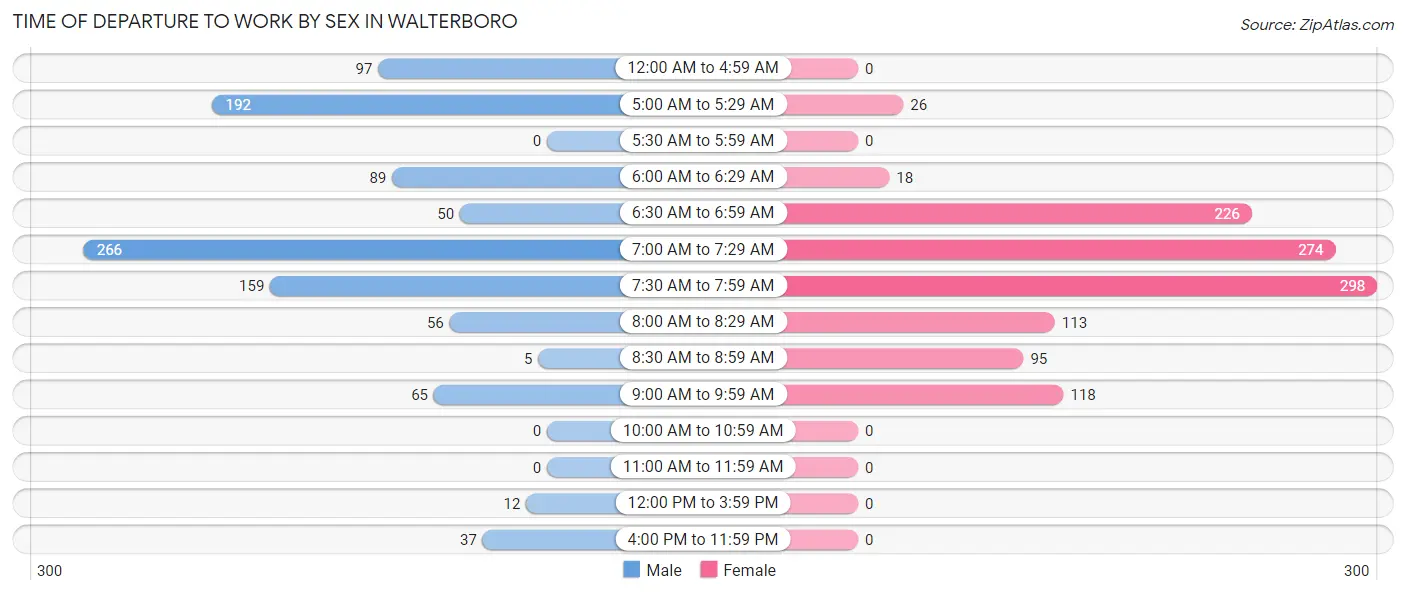
| Time of Departure | Male | Female |
| 12:00 AM to 4:59 AM | 97 (9.4%) | 0 (0.0%) |
| 5:00 AM to 5:29 AM | 192 (18.7%) | 26 (2.2%) |
| 5:30 AM to 5:59 AM | 0 (0.0%) | 0 (0.0%) |
| 6:00 AM to 6:29 AM | 89 (8.7%) | 18 (1.5%) |
| 6:30 AM to 6:59 AM | 50 (4.9%) | 226 (19.4%) |
| 7:00 AM to 7:29 AM | 266 (25.9%) | 274 (23.5%) |
| 7:30 AM to 7:59 AM | 159 (15.5%) | 298 (25.5%) |
| 8:00 AM to 8:29 AM | 56 (5.4%) | 113 (9.7%) |
| 8:30 AM to 8:59 AM | 5 (0.5%) | 95 (8.1%) |
| 9:00 AM to 9:59 AM | 65 (6.3%) | 118 (10.1%) |
| 10:00 AM to 10:59 AM | 0 (0.0%) | 0 (0.0%) |
| 11:00 AM to 11:59 AM | 0 (0.0%) | 0 (0.0%) |
| 12:00 PM to 3:59 PM | 12 (1.2%) | 0 (0.0%) |
| 4:00 PM to 11:59 PM | 37 (3.6%) | 0 (0.0%) |
| Total | 1,028 (100.0%) | 1,168 (100.0%) |
Housing Occupancy in Walterboro
Occupancy by Ownership in Walterboro
Of the total 2,275 dwellings in Walterboro, owner-occupied units account for 1,097 (48.2%), while renter-occupied units make up 1,178 (51.8%).
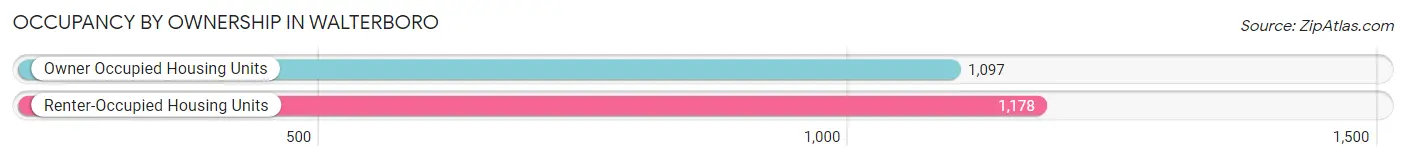
| Occupancy | # Housing Units | % Housing Units |
| Owner Occupied Housing Units | 1,097 | 48.2% |
| Renter-Occupied Housing Units | 1,178 | 51.8% |
| Total Occupied Housing Units | 2,275 | 100.0% |
Occupancy by Household Size in Walterboro
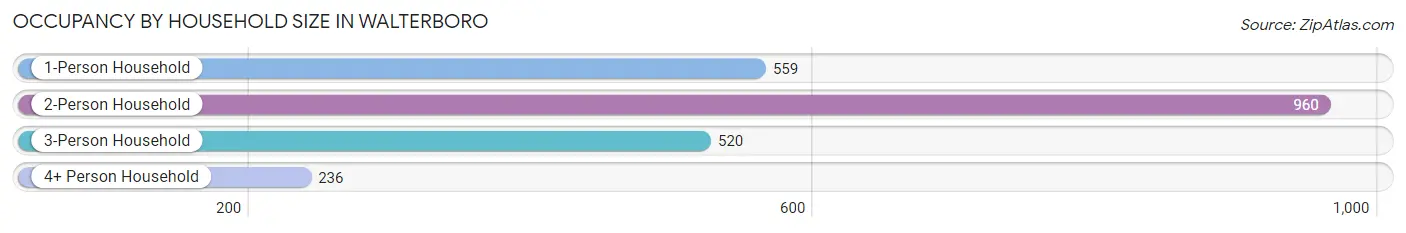
| Household Size | # Housing Units | % Housing Units |
| 1-Person Household | 559 | 24.6% |
| 2-Person Household | 960 | 42.2% |
| 3-Person Household | 520 | 22.9% |
| 4+ Person Household | 236 | 10.4% |
| Total Housing Units | 2,275 | 100.0% |
Occupancy by Ownership by Household Size in Walterboro
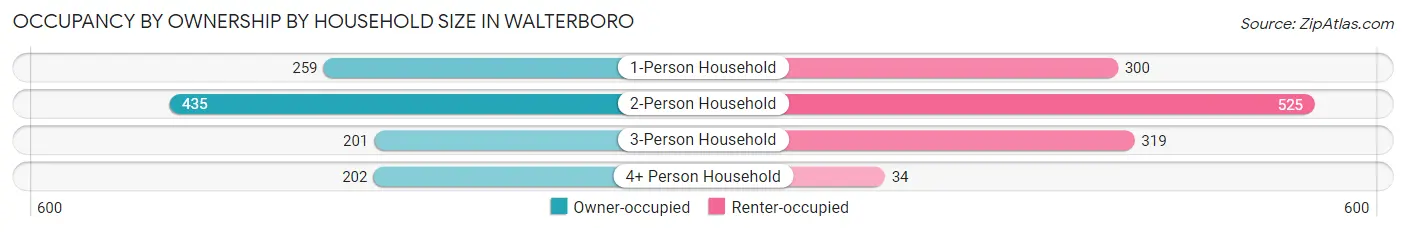
| Household Size | Owner-occupied | Renter-occupied |
| 1-Person Household | 259 (46.3%) | 300 (53.7%) |
| 2-Person Household | 435 (45.3%) | 525 (54.7%) |
| 3-Person Household | 201 (38.7%) | 319 (61.4%) |
| 4+ Person Household | 202 (85.6%) | 34 (14.4%) |
| Total Housing Units | 1,097 (48.2%) | 1,178 (51.8%) |
Occupancy by Educational Attainment in Walterboro
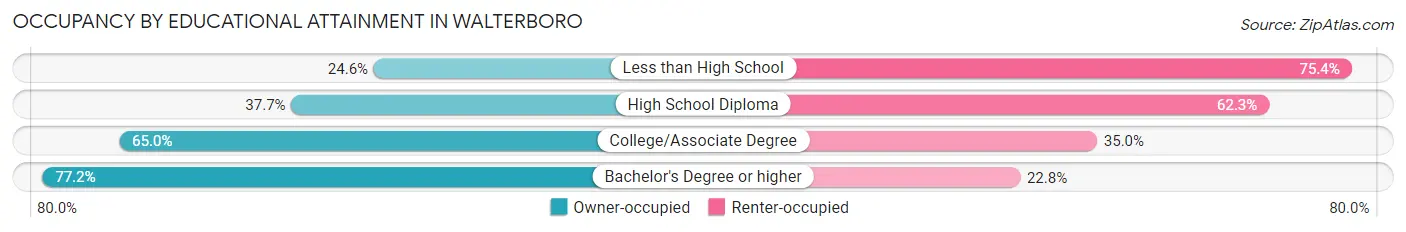
| Household Size | Owner-occupied | Renter-occupied |
| Less than High School | 140 (24.6%) | 429 (75.4%) |
| High School Diploma | 292 (37.7%) | 483 (62.3%) |
| College/Associate Degree | 286 (65.0%) | 154 (35.0%) |
| Bachelor's Degree or higher | 379 (77.2%) | 112 (22.8%) |
Occupancy by Age of Householder in Walterboro
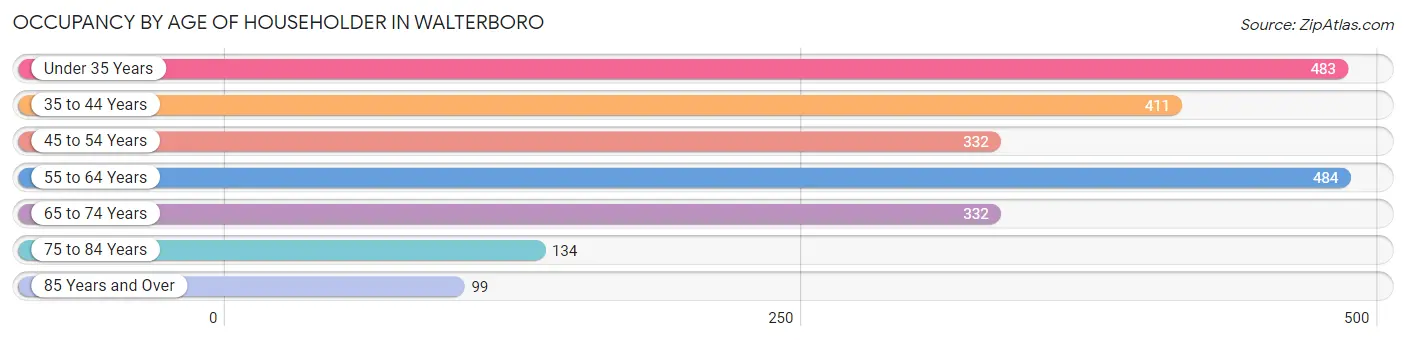
| Age Bracket | # Households | % Households |
| Under 35 Years | 483 | 21.2% |
| 35 to 44 Years | 411 | 18.1% |
| 45 to 54 Years | 332 | 14.6% |
| 55 to 64 Years | 484 | 21.3% |
| 65 to 74 Years | 332 | 14.6% |
| 75 to 84 Years | 134 | 5.9% |
| 85 Years and Over | 99 | 4.3% |
| Total | 2,275 | 100.0% |
Housing Finances in Walterboro
Median Income by Occupancy in Walterboro
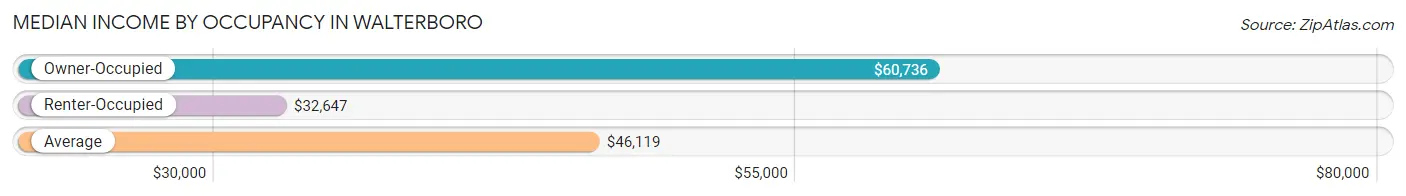
| Occupancy Type | # Households | Median Income |
| Owner-Occupied | 1,097 (48.2%) | $60,736 |
| Renter-Occupied | 1,178 (51.8%) | $32,647 |
| Average | 2,275 (100.0%) | $46,119 |
Occupancy by Householder Income Bracket in Walterboro
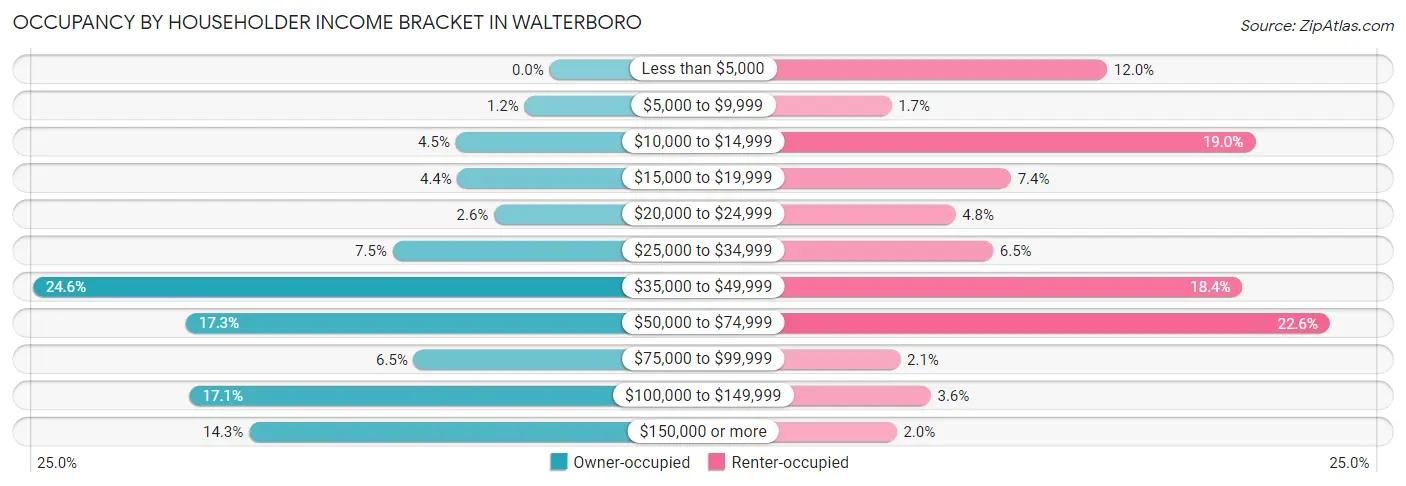
| Income Bracket | Owner-occupied | Renter-occupied |
| Less than $5,000 | 0 (0.0%) | 141 (12.0%) |
| $5,000 to $9,999 | 13 (1.2%) | 20 (1.7%) |
| $10,000 to $14,999 | 49 (4.5%) | 224 (19.0%) |
| $15,000 to $19,999 | 48 (4.4%) | 87 (7.4%) |
| $20,000 to $24,999 | 29 (2.6%) | 56 (4.8%) |
| $25,000 to $34,999 | 82 (7.5%) | 77 (6.5%) |
| $35,000 to $49,999 | 270 (24.6%) | 217 (18.4%) |
| $50,000 to $74,999 | 190 (17.3%) | 266 (22.6%) |
| $75,000 to $99,999 | 71 (6.5%) | 25 (2.1%) |
| $100,000 to $149,999 | 188 (17.1%) | 42 (3.6%) |
| $150,000 or more | 157 (14.3%) | 23 (1.9%) |
| Total | 1,097 (100.0%) | 1,178 (100.0%) |
Monthly Housing Cost Tiers in Walterboro
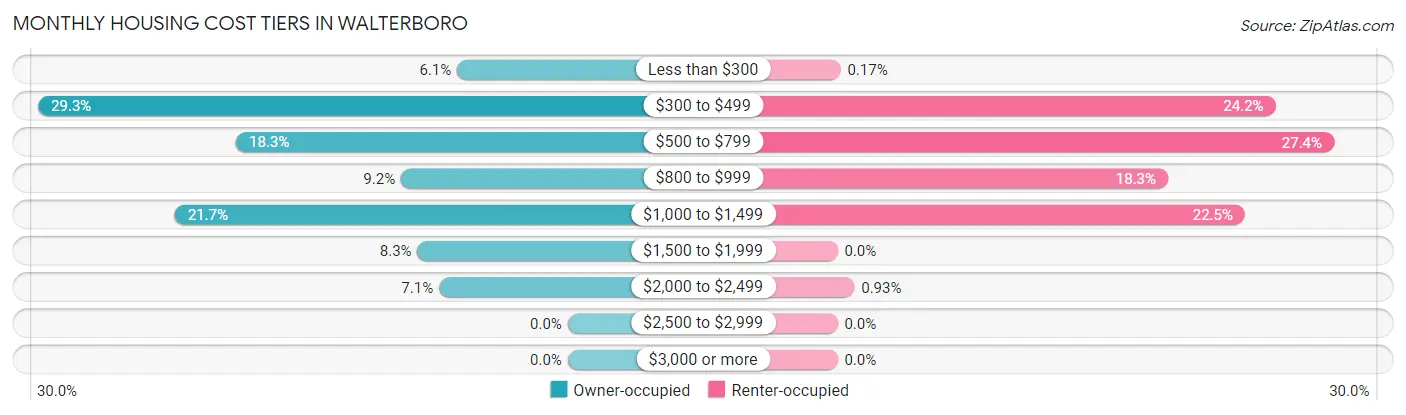
| Monthly Cost | Owner-occupied | Renter-occupied |
| Less than $300 | 67 (6.1%) | 2 (0.2%) |
| $300 to $499 | 321 (29.3%) | 285 (24.2%) |
| $500 to $799 | 201 (18.3%) | 323 (27.4%) |
| $800 to $999 | 101 (9.2%) | 215 (18.2%) |
| $1,000 to $1,499 | 238 (21.7%) | 265 (22.5%) |
| $1,500 to $1,999 | 91 (8.3%) | 0 (0.0%) |
| $2,000 to $2,499 | 78 (7.1%) | 11 (0.9%) |
| $2,500 to $2,999 | 0 (0.0%) | 0 (0.0%) |
| $3,000 or more | 0 (0.0%) | 0 (0.0%) |
| Total | 1,097 (100.0%) | 1,178 (100.0%) |
Physical Housing Characteristics in Walterboro
Housing Structures in Walterboro
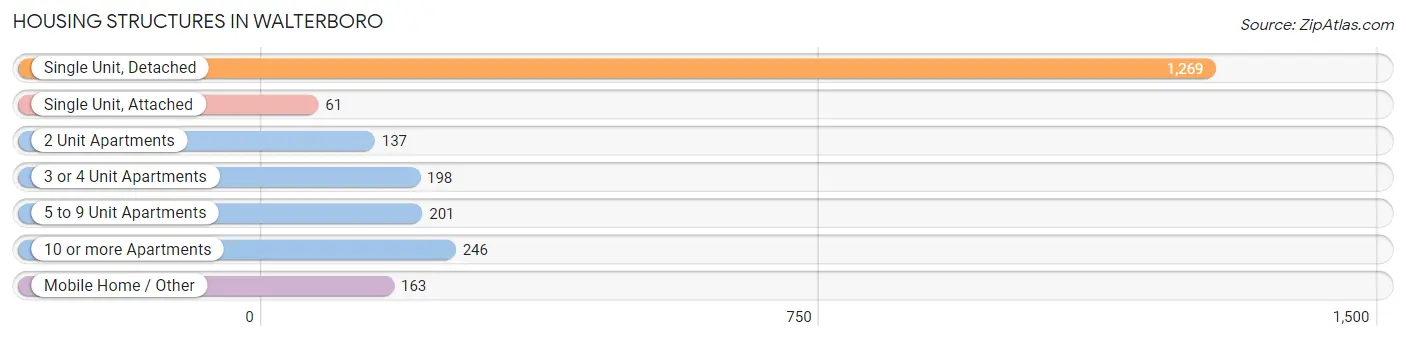
| Structure Type | # Housing Units | % Housing Units |
| Single Unit, Detached | 1,269 | 55.8% |
| Single Unit, Attached | 61 | 2.7% |
| 2 Unit Apartments | 137 | 6.0% |
| 3 or 4 Unit Apartments | 198 | 8.7% |
| 5 to 9 Unit Apartments | 201 | 8.8% |
| 10 or more Apartments | 246 | 10.8% |
| Mobile Home / Other | 163 | 7.2% |
| Total | 2,275 | 100.0% |
Housing Structures by Occupancy in Walterboro
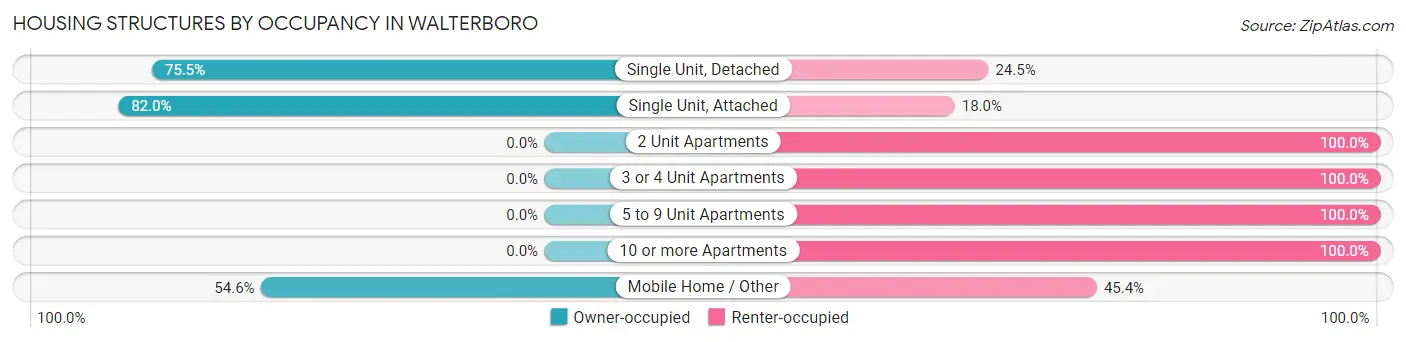
| Structure Type | Owner-occupied | Renter-occupied |
| Single Unit, Detached | 958 (75.5%) | 311 (24.5%) |
| Single Unit, Attached | 50 (82.0%) | 11 (18.0%) |
| 2 Unit Apartments | 0 (0.0%) | 137 (100.0%) |
| 3 or 4 Unit Apartments | 0 (0.0%) | 198 (100.0%) |
| 5 to 9 Unit Apartments | 0 (0.0%) | 201 (100.0%) |
| 10 or more Apartments | 0 (0.0%) | 246 (100.0%) |
| Mobile Home / Other | 89 (54.6%) | 74 (45.4%) |
| Total | 1,097 (48.2%) | 1,178 (51.8%) |
Housing Structures by Number of Rooms in Walterboro
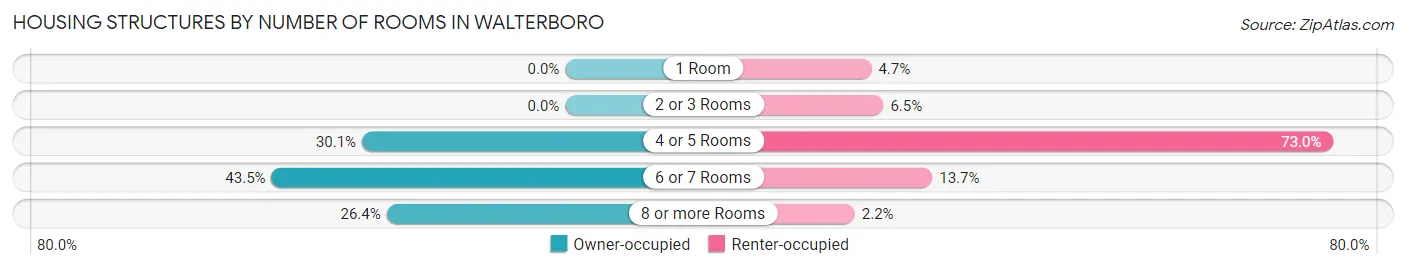
| Number of Rooms | Owner-occupied | Renter-occupied |
| 1 Room | 0 (0.0%) | 55 (4.7%) |
| 2 or 3 Rooms | 0 (0.0%) | 76 (6.5%) |
| 4 or 5 Rooms | 330 (30.1%) | 860 (73.0%) |
| 6 or 7 Rooms | 477 (43.5%) | 161 (13.7%) |
| 8 or more Rooms | 290 (26.4%) | 26 (2.2%) |
| Total | 1,097 (100.0%) | 1,178 (100.0%) |
Housing Structure by Heating Type in Walterboro
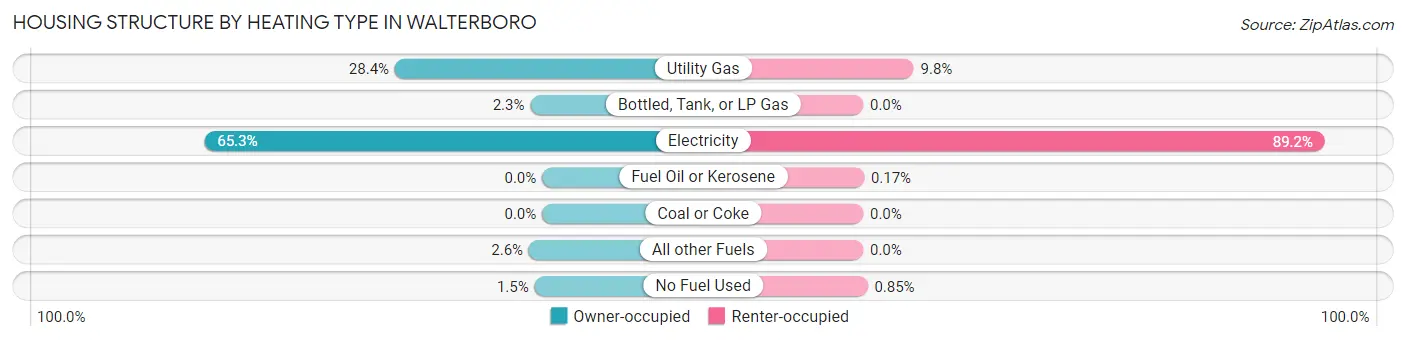
| Heating Type | Owner-occupied | Renter-occupied |
| Utility Gas | 312 (28.4%) | 115 (9.8%) |
| Bottled, Tank, or LP Gas | 25 (2.3%) | 0 (0.0%) |
| Electricity | 716 (65.3%) | 1,051 (89.2%) |
| Fuel Oil or Kerosene | 0 (0.0%) | 2 (0.2%) |
| Coal or Coke | 0 (0.0%) | 0 (0.0%) |
| All other Fuels | 28 (2.5%) | 0 (0.0%) |
| No Fuel Used | 16 (1.5%) | 10 (0.9%) |
| Total | 1,097 (100.0%) | 1,178 (100.0%) |
Household Vehicle Usage in Walterboro
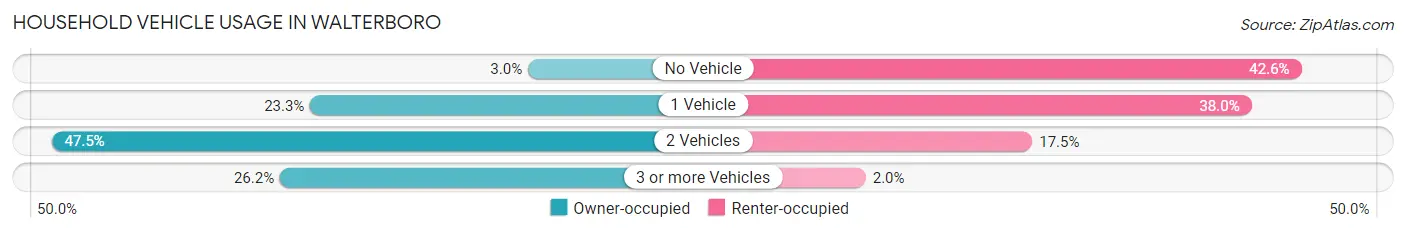
| Vehicles per Household | Owner-occupied | Renter-occupied |
| No Vehicle | 33 (3.0%) | 502 (42.6%) |
| 1 Vehicle | 256 (23.3%) | 447 (38.0%) |
| 2 Vehicles | 521 (47.5%) | 206 (17.5%) |
| 3 or more Vehicles | 287 (26.2%) | 23 (1.9%) |
| Total | 1,097 (100.0%) | 1,178 (100.0%) |
Real Estate & Mortgages in Walterboro
Real Estate and Mortgage Overview in Walterboro
| Characteristic | Without Mortgage | With Mortgage |
| Housing Units | 562 | 535 |
| Median Property Value | $143,400 | $162,300 |
| Median Household Income | $45,571 | $126 |
| Monthly Housing Costs | $443 | $0 |
| Real Estate Taxes | $1,036 | $0 |
Property Value by Mortgage Status in Walterboro
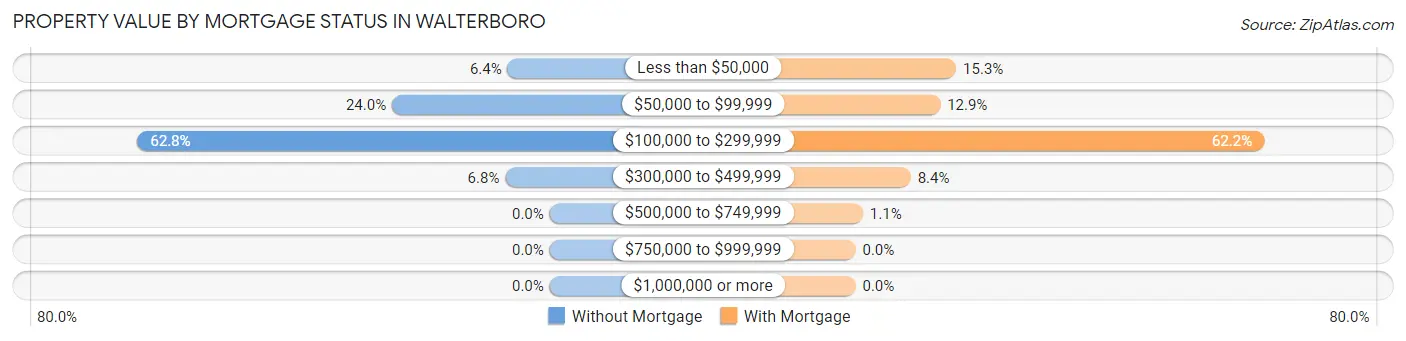
| Property Value | Without Mortgage | With Mortgage |
| Less than $50,000 | 36 (6.4%) | 82 (15.3%) |
| $50,000 to $99,999 | 135 (24.0%) | 69 (12.9%) |
| $100,000 to $299,999 | 353 (62.8%) | 333 (62.2%) |
| $300,000 to $499,999 | 38 (6.8%) | 45 (8.4%) |
| $500,000 to $749,999 | 0 (0.0%) | 6 (1.1%) |
| $750,000 to $999,999 | 0 (0.0%) | 0 (0.0%) |
| $1,000,000 or more | 0 (0.0%) | 0 (0.0%) |
| Total | 562 (100.0%) | 535 (100.0%) |
Household Income by Mortgage Status in Walterboro
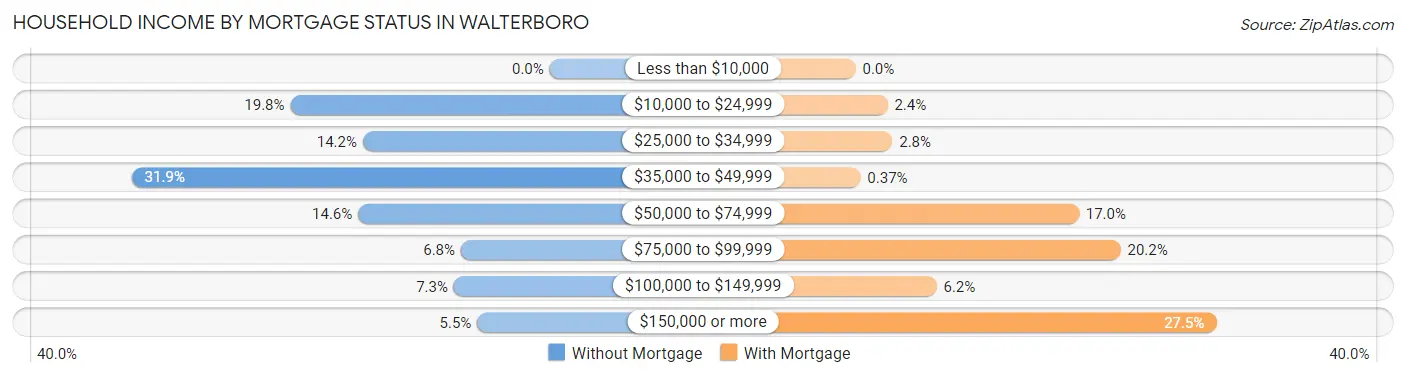
| Household Income | Without Mortgage | With Mortgage |
| Less than $10,000 | 0 (0.0%) | 0 (0.0%) |
| $10,000 to $24,999 | 111 (19.8%) | 13 (2.4%) |
| $25,000 to $34,999 | 80 (14.2%) | 15 (2.8%) |
| $35,000 to $49,999 | 179 (31.9%) | 2 (0.4%) |
| $50,000 to $74,999 | 82 (14.6%) | 91 (17.0%) |
| $75,000 to $99,999 | 38 (6.8%) | 108 (20.2%) |
| $100,000 to $149,999 | 41 (7.3%) | 33 (6.2%) |
| $150,000 or more | 31 (5.5%) | 147 (27.5%) |
| Total | 562 (100.0%) | 535 (100.0%) |
Property Value to Household Income Ratio in Walterboro
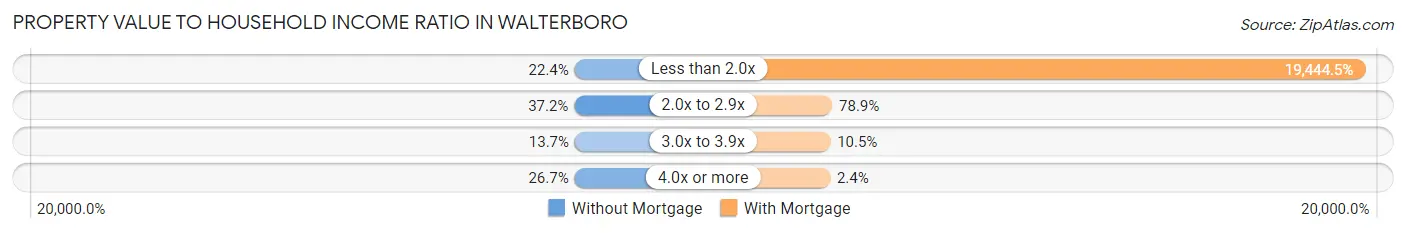
| Value-to-Income Ratio | Without Mortgage | With Mortgage |
| Less than 2.0x | 126 (22.4%) | 104,028 (19,444.5%) |
| 2.0x to 2.9x | 209 (37.2%) | 422 (78.9%) |
| 3.0x to 3.9x | 77 (13.7%) | 56 (10.5%) |
| 4.0x or more | 150 (26.7%) | 13 (2.4%) |
| Total | 562 (100.0%) | 535 (100.0%) |
Real Estate Taxes by Mortgage Status in Walterboro
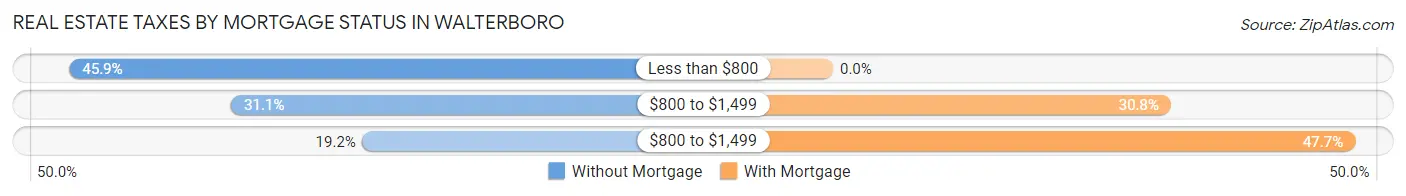
| Property Taxes | Without Mortgage | With Mortgage |
| Less than $800 | 258 (45.9%) | 0 (0.0%) |
| $800 to $1,499 | 175 (31.1%) | 165 (30.8%) |
| $800 to $1,499 | 108 (19.2%) | 255 (47.7%) |
| Total | 562 (100.0%) | 535 (100.0%) |
Health & Disability in Walterboro
Health Insurance Coverage by Age in Walterboro
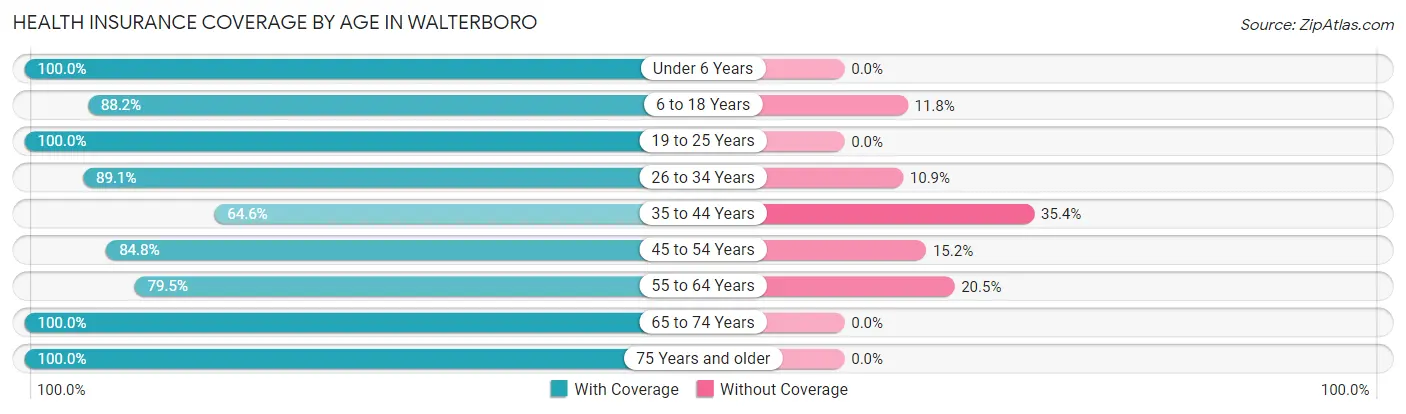
| Age Bracket | With Coverage | Without Coverage |
| Under 6 Years | 253 (100.0%) | 0 (0.0%) |
| 6 to 18 Years | 904 (88.2%) | 121 (11.8%) |
| 19 to 25 Years | 312 (100.0%) | 0 (0.0%) |
| 26 to 34 Years | 669 (89.1%) | 82 (10.9%) |
| 35 to 44 Years | 385 (64.6%) | 211 (35.4%) |
| 45 to 54 Years | 562 (84.8%) | 101 (15.2%) |
| 55 to 64 Years | 632 (79.5%) | 163 (20.5%) |
| 65 to 74 Years | 641 (100.0%) | 0 (0.0%) |
| 75 Years and older | 299 (100.0%) | 0 (0.0%) |
| Total | 4,657 (87.3%) | 678 (12.7%) |
Health Insurance Coverage by Citizenship Status in Walterboro

| Citizenship Status | With Coverage | Without Coverage |
| Native Born | 253 (100.0%) | 0 (0.0%) |
| Foreign Born, Citizen | 904 (88.2%) | 121 (11.8%) |
| Foreign Born, not a Citizen | 312 (100.0%) | 0 (0.0%) |
Health Insurance Coverage by Household Income in Walterboro
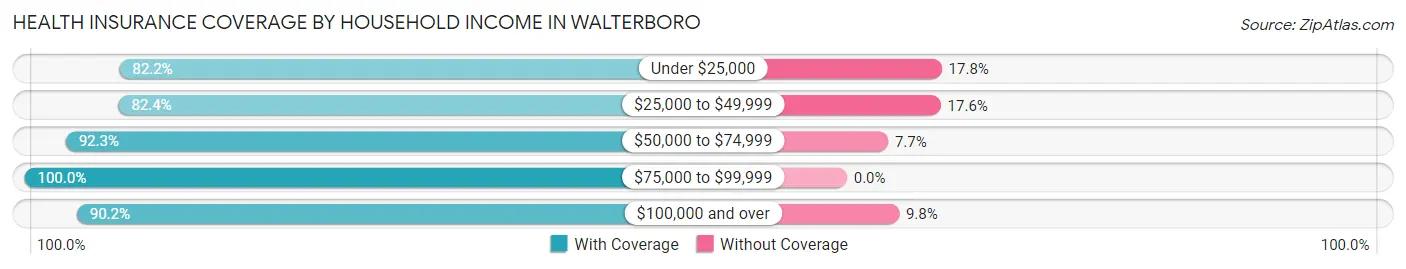
| Household Income | With Coverage | Without Coverage |
| Under $25,000 | 1,023 (82.2%) | 221 (17.8%) |
| $25,000 to $49,999 | 1,087 (82.4%) | 232 (17.6%) |
| $50,000 to $74,999 | 1,078 (92.3%) | 90 (7.7%) |
| $75,000 to $99,999 | 202 (100.0%) | 0 (0.0%) |
| $100,000 and over | 1,245 (90.2%) | 135 (9.8%) |
Public vs Private Health Insurance Coverage by Age in Walterboro
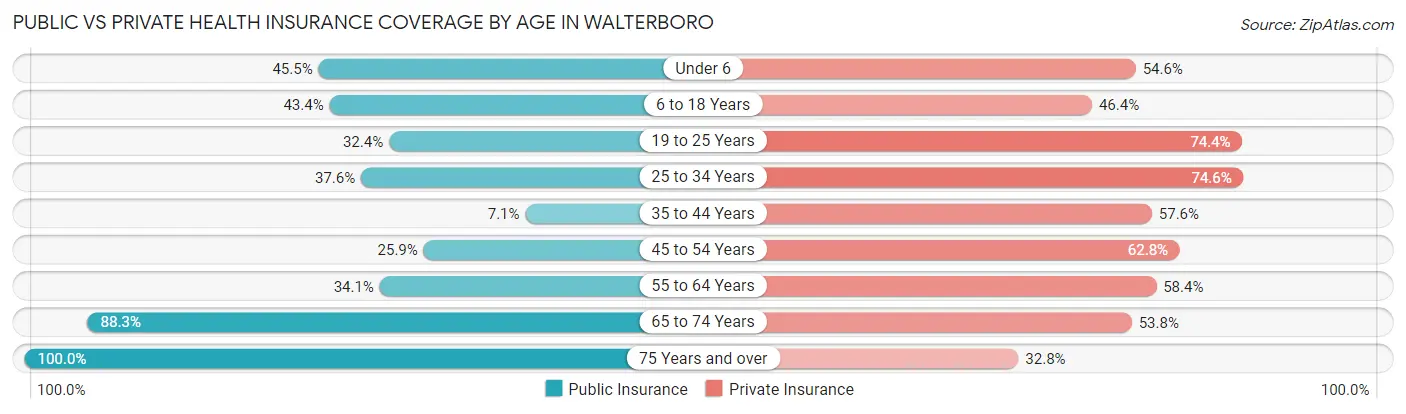
| Age Bracket | Public Insurance | Private Insurance |
| Under 6 | 115 (45.5%) | 138 (54.5%) |
| 6 to 18 Years | 445 (43.4%) | 476 (46.4%) |
| 19 to 25 Years | 101 (32.4%) | 232 (74.4%) |
| 25 to 34 Years | 282 (37.6%) | 560 (74.6%) |
| 35 to 44 Years | 42 (7.0%) | 343 (57.6%) |
| 45 to 54 Years | 172 (25.9%) | 416 (62.7%) |
| 55 to 64 Years | 271 (34.1%) | 464 (58.4%) |
| 65 to 74 Years | 566 (88.3%) | 345 (53.8%) |
| 75 Years and over | 299 (100.0%) | 98 (32.8%) |
| Total | 2,293 (43.0%) | 3,072 (57.6%) |
Disability Status by Sex by Age in Walterboro
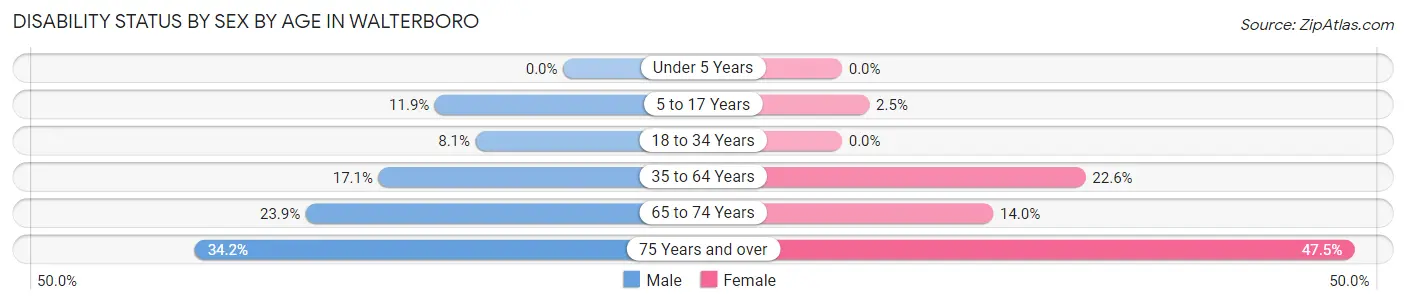
| Age Bracket | Male | Female |
| Under 5 Years | 0 (0.0%) | 0 (0.0%) |
| 5 to 17 Years | 50 (11.9%) | 17 (2.5%) |
| 18 to 34 Years | 29 (8.1%) | 0 (0.0%) |
| 35 to 64 Years | 167 (17.1%) | 244 (22.6%) |
| 65 to 74 Years | 85 (23.9%) | 40 (14.0%) |
| 75 Years and over | 26 (34.2%) | 106 (47.5%) |
Disability Class by Sex by Age in Walterboro
Disability Class: Hearing Difficulty
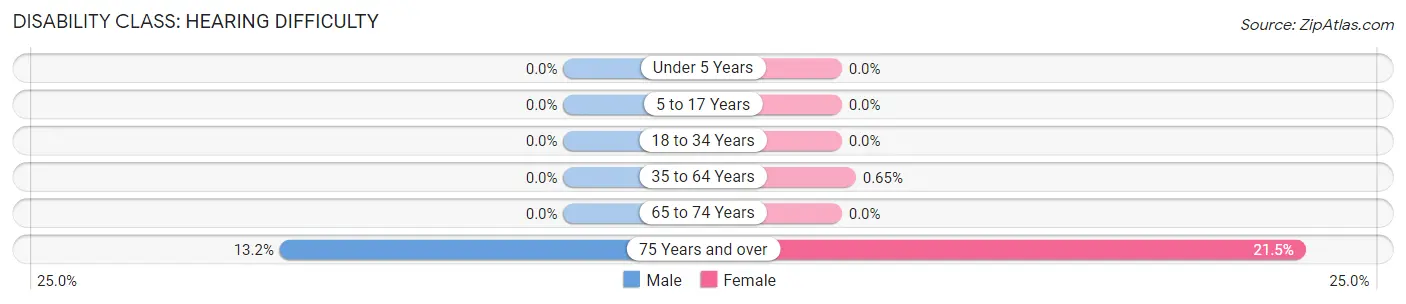
| Age Bracket | Male | Female |
| Under 5 Years | 0 (0.0%) | 0 (0.0%) |
| 5 to 17 Years | 0 (0.0%) | 0 (0.0%) |
| 18 to 34 Years | 0 (0.0%) | 0 (0.0%) |
| 35 to 64 Years | 0 (0.0%) | 7 (0.6%) |
| 65 to 74 Years | 0 (0.0%) | 0 (0.0%) |
| 75 Years and over | 10 (13.2%) | 48 (21.5%) |
Disability Class: Vision Difficulty
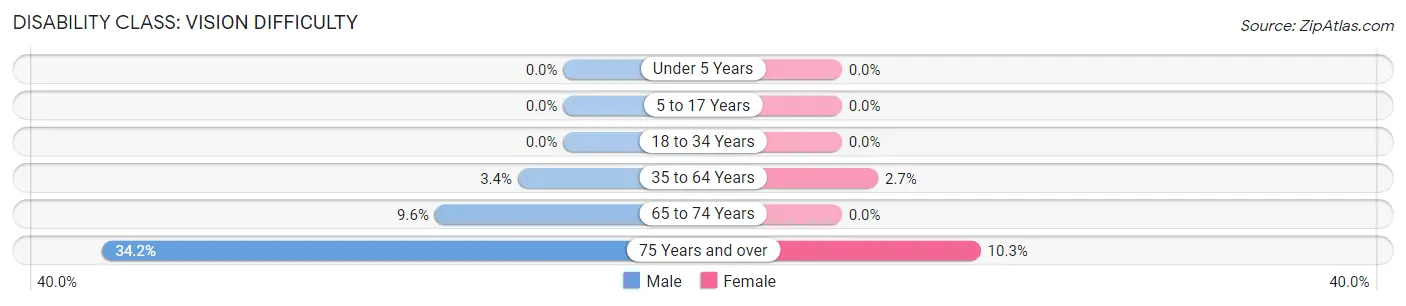
| Age Bracket | Male | Female |
| Under 5 Years | 0 (0.0%) | 0 (0.0%) |
| 5 to 17 Years | 0 (0.0%) | 0 (0.0%) |
| 18 to 34 Years | 0 (0.0%) | 0 (0.0%) |
| 35 to 64 Years | 33 (3.4%) | 29 (2.7%) |
| 65 to 74 Years | 34 (9.6%) | 0 (0.0%) |
| 75 Years and over | 26 (34.2%) | 23 (10.3%) |
Disability Class: Cognitive Difficulty
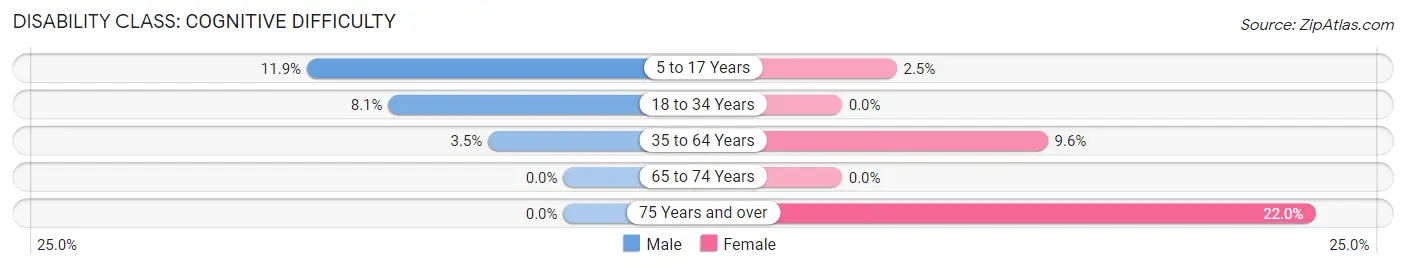
| Age Bracket | Male | Female |
| 5 to 17 Years | 50 (11.9%) | 17 (2.5%) |
| 18 to 34 Years | 29 (8.1%) | 0 (0.0%) |
| 35 to 64 Years | 34 (3.5%) | 103 (9.6%) |
| 65 to 74 Years | 0 (0.0%) | 0 (0.0%) |
| 75 Years and over | 0 (0.0%) | 49 (22.0%) |
Disability Class: Ambulatory Difficulty
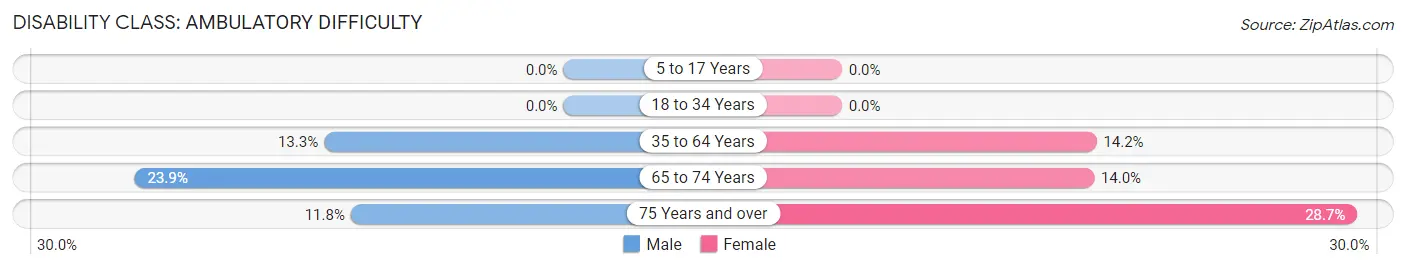
| Age Bracket | Male | Female |
| 5 to 17 Years | 0 (0.0%) | 0 (0.0%) |
| 18 to 34 Years | 0 (0.0%) | 0 (0.0%) |
| 35 to 64 Years | 130 (13.3%) | 153 (14.2%) |
| 65 to 74 Years | 85 (23.9%) | 40 (14.0%) |
| 75 Years and over | 9 (11.8%) | 64 (28.7%) |
Disability Class: Self-Care Difficulty
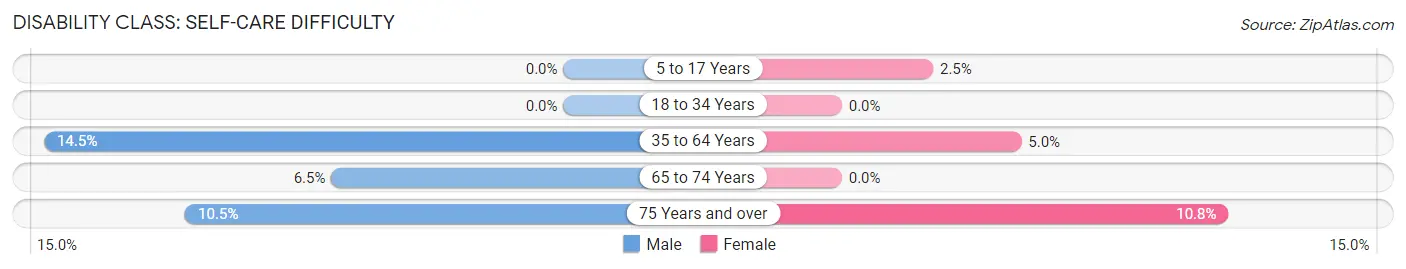
| Age Bracket | Male | Female |
| 5 to 17 Years | 0 (0.0%) | 17 (2.5%) |
| 18 to 34 Years | 0 (0.0%) | 0 (0.0%) |
| 35 to 64 Years | 141 (14.5%) | 54 (5.0%) |
| 65 to 74 Years | 23 (6.5%) | 0 (0.0%) |
| 75 Years and over | 8 (10.5%) | 24 (10.8%) |
Technology Access in Walterboro
Computing Device Access in Walterboro
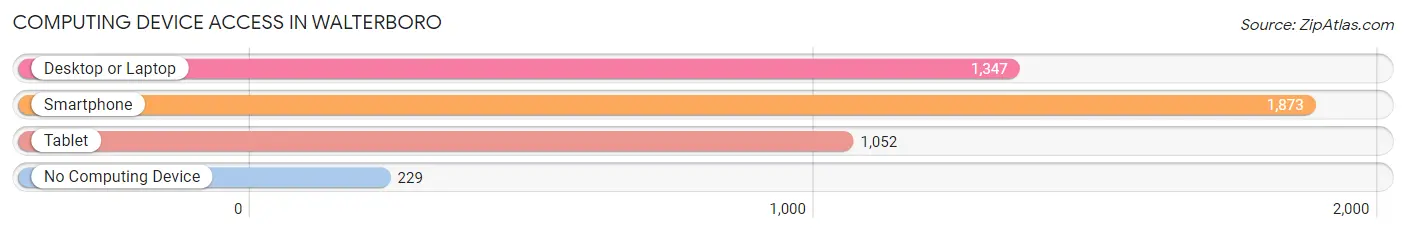
| Device Type | # Households | % Households |
| Desktop or Laptop | 1,347 | 59.2% |
| Smartphone | 1,873 | 82.3% |
| Tablet | 1,052 | 46.2% |
| No Computing Device | 229 | 10.1% |
| Total | 2,275 | 100.0% |
Internet Access in Walterboro
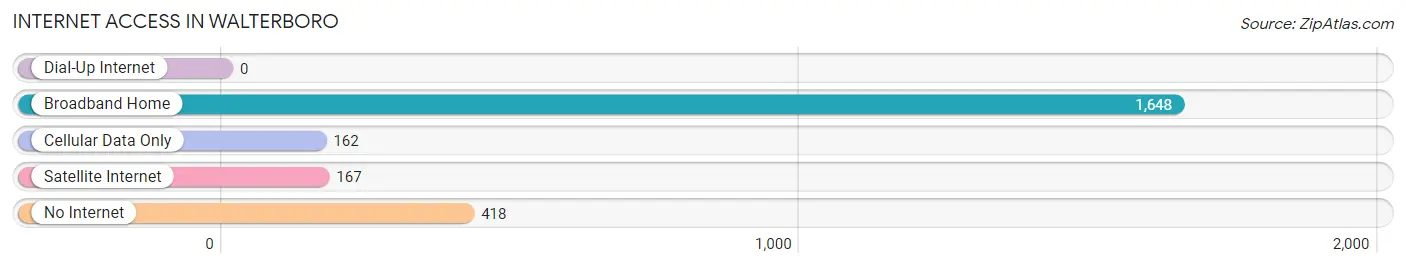
| Internet Type | # Households | % Households |
| Dial-Up Internet | 0 | 0.0% |
| Broadband Home | 1,648 | 72.4% |
| Cellular Data Only | 162 | 7.1% |
| Satellite Internet | 167 | 7.3% |
| No Internet | 418 | 18.4% |
| Total | 2,275 | 100.0% |
Walterboro Summary
Walterboro is a city located in Colleton County, South Carolina, United States. It is the county seat of Colleton County and is located in the Lowcountry region of the state. The population was 5,398 at the 2010 census.
History
Walterboro was founded in 1783 by Colonel Alexander Walter, a Revolutionary War veteran. The town was named after him and was incorporated in 1826. The town was a major trading center for the surrounding area and was known for its cotton and rice plantations.
During the Civil War, Walterboro was the site of several battles, including the Battle of Rivers Bridge in February 1865. The town was occupied by Union forces in 1865 and was the site of a Freedmen's Bureau office.
Geography
Walterboro is located in the Lowcountry region of South Carolina, about 50 miles west of Charleston. The city is situated on the banks of the Edisto River and is surrounded by the Francis Marion National Forest. The city has a total area of 8.2 square miles, of which 8.1 square miles is land and 0.1 square miles is water.
Economy
Walterboro is a major agricultural center for the region, with a large number of farms and plantations in the area. The city is also home to several manufacturing and industrial businesses, including a paper mill, a lumber mill, and a plastics plant.
The city is also home to several tourist attractions, including the Colleton County Museum, the Walterboro Wildlife Refuge, and the South Carolina Artisans Center.
Demographics
As of the 2010 census, there were 5,398 people, 2,072 households, and 1,323 families residing in the city. The population density was 664.2 people per square mile. There were 2,307 housing units at an average density of 284.7 per square mile. The racial makeup of the city was 57.2% White, 39.3% African American, 0.4% Native American, 0.7% Asian, 0.1% Pacific Islander, 1.2% from other races, and 1.1% from two or more races. Hispanic or Latino of any race were 2.7% of the population.
The median income for a household in the city was $30,917, and the median income for a family was $37,917. The per capita income for the city was $16,845. About 22.2% of families and 25.3% of the population were below the poverty line, including 36.2% of those under age 18 and 16.2% of those age 65 or over.
Common Questions
What is Per Capita Income in Walterboro?
Per Capita income in Walterboro is $25,507.
What is the Median Family Income in Walterboro?
Median Family Income in Walterboro is $52,069.
What is the Median Household income in Walterboro?
Median Household Income in Walterboro is $46,119.
What is Income or Wage Gap in Walterboro?
Income or Wage Gap in Walterboro is 43.0%.
Women in Walterboro earn 57.0 cents for every dollar earned by a man.
What is Inequality or Gini Index in Walterboro?
Inequality or Gini Index in Walterboro is 0.47.
What is the Total Population of Walterboro?
Total Population of Walterboro is 5,515.
What is the Total Male Population of Walterboro?
Total Male Population of Walterboro is 2,372.
What is the Total Female Population of Walterboro?
Total Female Population of Walterboro is 3,143.
What is the Ratio of Males per 100 Females in Walterboro?
There are 75.47 Males per 100 Females in Walterboro.
What is the Ratio of Females per 100 Males in Walterboro?
There are 132.50 Females per 100 Males in Walterboro.
What is the Median Population Age in Walterboro?
Median Population Age in Walterboro is 40.4 Years.
What is the Average Family Size in Walterboro
Average Family Size in Walterboro is 2.7 People.
What is the Average Household Size in Walterboro
Average Household Size in Walterboro is 2.4 People.
How Large is the Labor Force in Walterboro?
There are 2,516 People in the Labor Forcein in Walterboro.
What is the Percentage of People in the Labor Force in Walterboro?
56.7% of People are in the Labor Force in Walterboro.
What is the Unemployment Rate in Walterboro?
Unemployment Rate in Walterboro is 3.1%.