Pinopolis, SC Map & Demographics
Pinopolis Map
Pinopolis Overview
$61,326
PER CAPITA INCOME
$116,204
AVG FAMILY INCOME
$108,611
AVG HOUSEHOLD INCOME
0.8%
WAGE / INCOME GAP [ % ]
99.2¢/ $1
WAGE / INCOME GAP [ $ ]
0.38
INEQUALITY / GINI INDEX
933
TOTAL POPULATION
581
MALE POPULATION
352
FEMALE POPULATION
165.06
MALES / 100 FEMALES
60.59
FEMALES / 100 MALES
61.5
MEDIAN AGE
2.2
AVG FAMILY SIZE
2.0
AVG HOUSEHOLD SIZE
385
LABOR FORCE [ PEOPLE ]
41.3%
PERCENT IN LABOR FORCE
Pinopolis Zip Codes
Pinopolis Area Codes
Income in Pinopolis
Income Overview in Pinopolis
Per Capita Income in Pinopolis is $61,326, while median incomes of families and households are $116,204 and $108,611 respectively.
| Characteristic | Number | Measure |
| Per Capita Income | 933 | $61,326 |
| Median Family Income | 380 | $116,204 |
| Mean Family Income | 380 | $139,061 |
| Median Household Income | 462 | $108,611 |
| Mean Household Income | 462 | $122,165 |
| Income Deficit | 380 | $0 |
| Wage / Income Gap (%) | 933 | 0.77% |
| Wage / Income Gap ($) | 933 | 99.23¢ per $1 |
| Gini / Inequality Index | 933 | 0.38 |
Earnings by Sex in Pinopolis
Average Earnings in Pinopolis are $72,125, $72,560 for men and $72,000 for women, a difference of 0.8%.
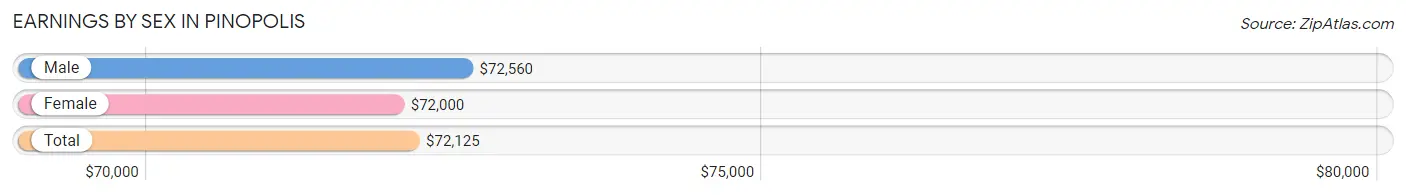
| Sex | Number | Average Earnings |
| Male | 285 (66.4%) | $72,560 |
| Female | 144 (33.6%) | $72,000 |
| Total | 429 (100.0%) | $72,125 |
Earnings by Sex by Income Bracket in Pinopolis
The most common earnings brackets in Pinopolis are $75,000 to $99,999 for men (68 | 23.9%) and $75,000 to $99,999 for women (59 | 41.0%).
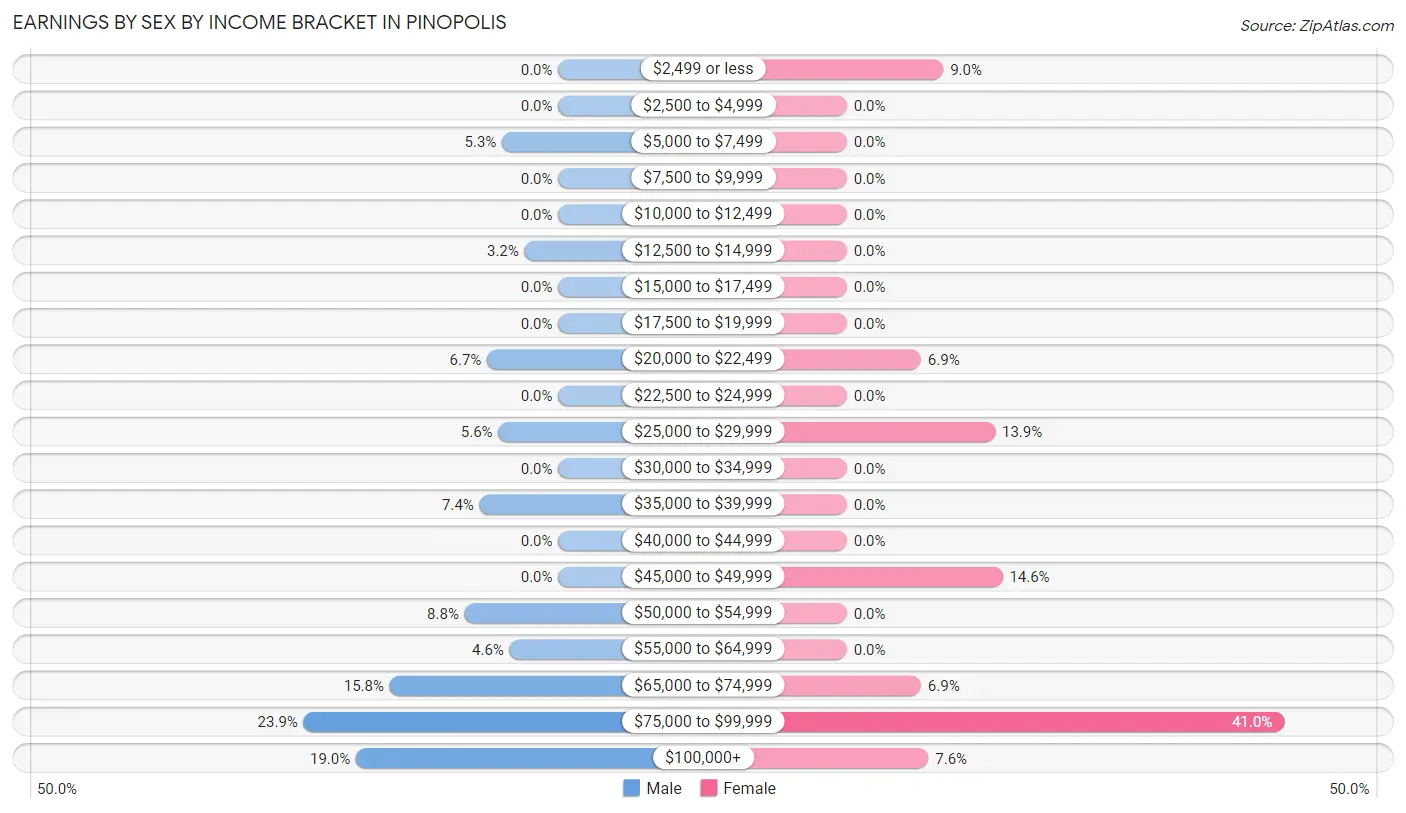
| Income | Male | Female |
| $2,499 or less | 0 (0.0%) | 13 (9.0%) |
| $2,500 to $4,999 | 0 (0.0%) | 0 (0.0%) |
| $5,000 to $7,499 | 15 (5.3%) | 0 (0.0%) |
| $7,500 to $9,999 | 0 (0.0%) | 0 (0.0%) |
| $10,000 to $12,499 | 0 (0.0%) | 0 (0.0%) |
| $12,500 to $14,999 | 9 (3.2%) | 0 (0.0%) |
| $15,000 to $17,499 | 0 (0.0%) | 0 (0.0%) |
| $17,500 to $19,999 | 0 (0.0%) | 0 (0.0%) |
| $20,000 to $22,499 | 19 (6.7%) | 10 (6.9%) |
| $22,500 to $24,999 | 0 (0.0%) | 0 (0.0%) |
| $25,000 to $29,999 | 16 (5.6%) | 20 (13.9%) |
| $30,000 to $34,999 | 0 (0.0%) | 0 (0.0%) |
| $35,000 to $39,999 | 21 (7.4%) | 0 (0.0%) |
| $40,000 to $44,999 | 0 (0.0%) | 0 (0.0%) |
| $45,000 to $49,999 | 0 (0.0%) | 21 (14.6%) |
| $50,000 to $54,999 | 25 (8.8%) | 0 (0.0%) |
| $55,000 to $64,999 | 13 (4.6%) | 0 (0.0%) |
| $65,000 to $74,999 | 45 (15.8%) | 10 (6.9%) |
| $75,000 to $99,999 | 68 (23.9%) | 59 (41.0%) |
| $100,000+ | 54 (19.0%) | 11 (7.6%) |
| Total | 285 (100.0%) | 144 (100.0%) |
Earnings by Sex by Educational Attainment in Pinopolis
Average earnings in Pinopolis are $73,452 for men and $72,000 for women, a difference of 2.0%. Men with an educational attainment of college or associate's degree enjoy the highest average annual earnings of $73,690, while those with college or associate's degree education earn the least with $73,690. Women with an educational attainment of graduate degree earn the most with the average annual earnings of $82,670, while those with graduate degree education have the smallest earnings of $82,670.
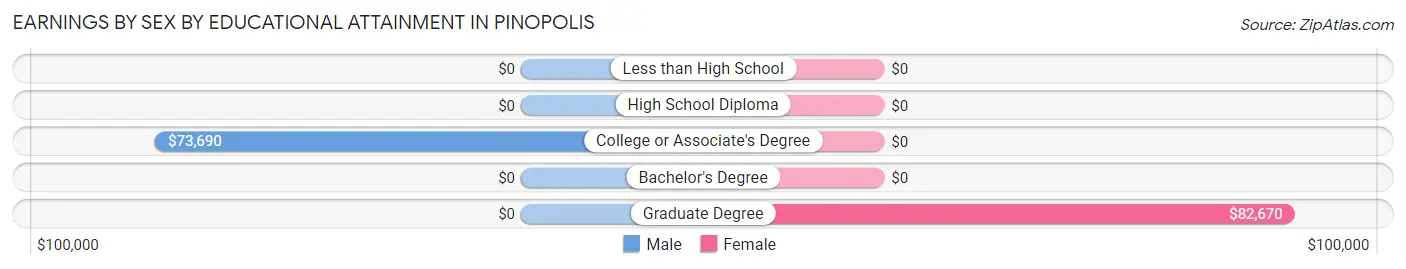
| Educational Attainment | Male Income | Female Income |
| Less than High School | - | - |
| High School Diploma | - | - |
| College or Associate's Degree | $73,690 | $0 |
| Bachelor's Degree | - | - |
| Graduate Degree | - | - |
| Total | $73,452 | $72,000 |
Family Income in Pinopolis
Family Income Brackets in Pinopolis
According to the Pinopolis family income data, there are 142 families falling into the $100,000 to $149,999 income range, which is the most common income bracket and makes up 37.4% of all families.
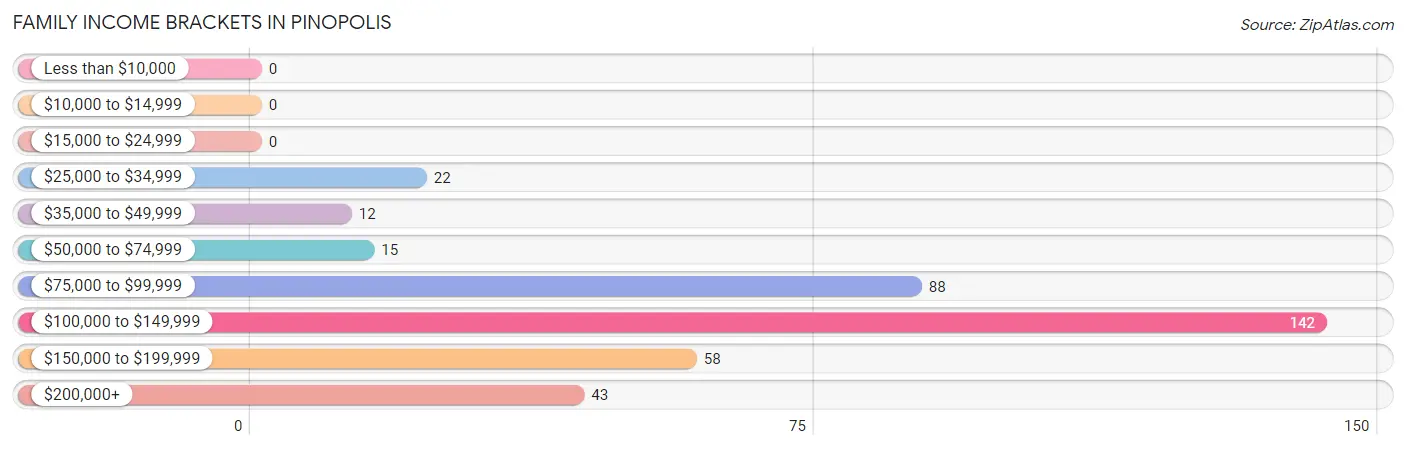
| Income Bracket | # Families | % Families |
| Less than $10,000 | 0 | 0.0% |
| $10,000 to $14,999 | 0 | 0.0% |
| $15,000 to $24,999 | 0 | 0.0% |
| $25,000 to $34,999 | 22 | 5.8% |
| $35,000 to $49,999 | 12 | 3.2% |
| $50,000 to $74,999 | 15 | 3.9% |
| $75,000 to $99,999 | 88 | 23.2% |
| $100,000 to $149,999 | 142 | 37.4% |
| $150,000 to $199,999 | 58 | 15.3% |
| $200,000+ | 43 | 11.3% |
Family Income by Famaliy Size in Pinopolis
2-person families (257 | 67.6%) account for the highest median family income in Pinopolis with $135,072 per family, while 2-person families (257 | 67.6%) have the highest median income of $67,536 per family member.
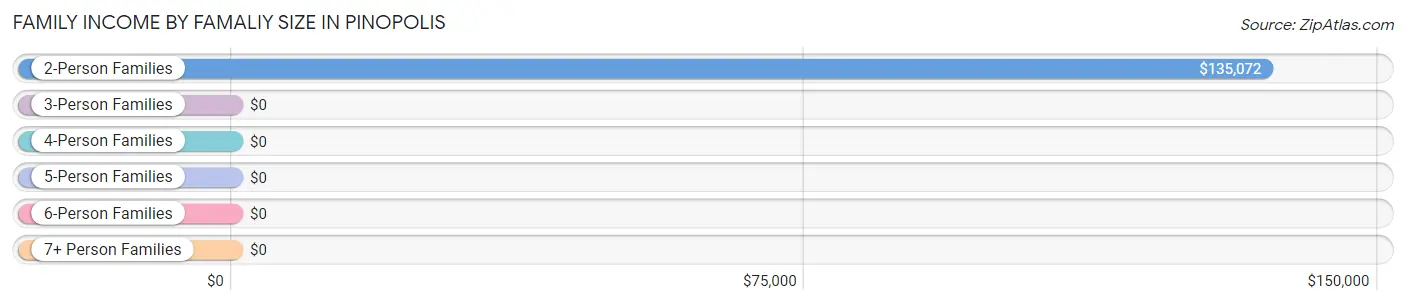
| Income Bracket | # Families | Median Income |
| 2-Person Families | 257 (67.6%) | $135,072 |
| 3-Person Families | 99 (26.1%) | $0 |
| 4-Person Families | 24 (6.3%) | $0 |
| 5-Person Families | 0 (0.0%) | $0 |
| 6-Person Families | 0 (0.0%) | $0 |
| 7+ Person Families | 0 (0.0%) | $0 |
| Total | 380 (100.0%) | $116,204 |
Family Income by Number of Earners in Pinopolis
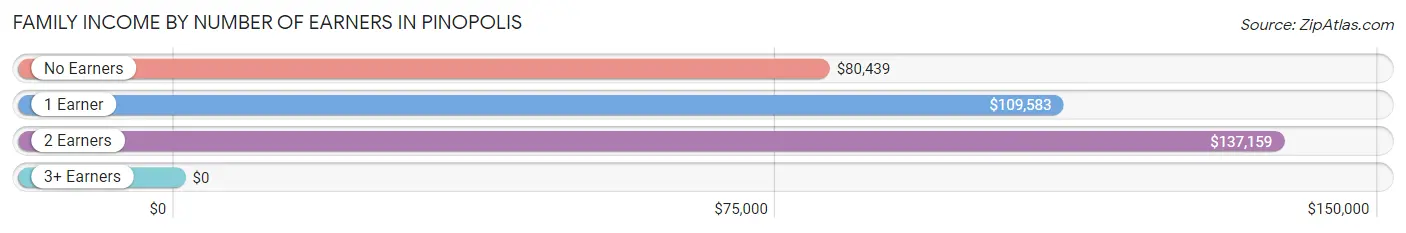
| Number of Earners | # Families | Median Income |
| No Earners | 154 (40.5%) | $80,439 |
| 1 Earner | 71 (18.7%) | $109,583 |
| 2 Earners | 142 (37.4%) | $137,159 |
| 3+ Earners | 13 (3.4%) | $0 |
| Total | 380 (100.0%) | $116,204 |
Household Income in Pinopolis
Household Income Brackets in Pinopolis
With 142 households falling in the category, the $100,000 to $149,999 income range is the most frequent in Pinopolis, accounting for 30.7% of all households.
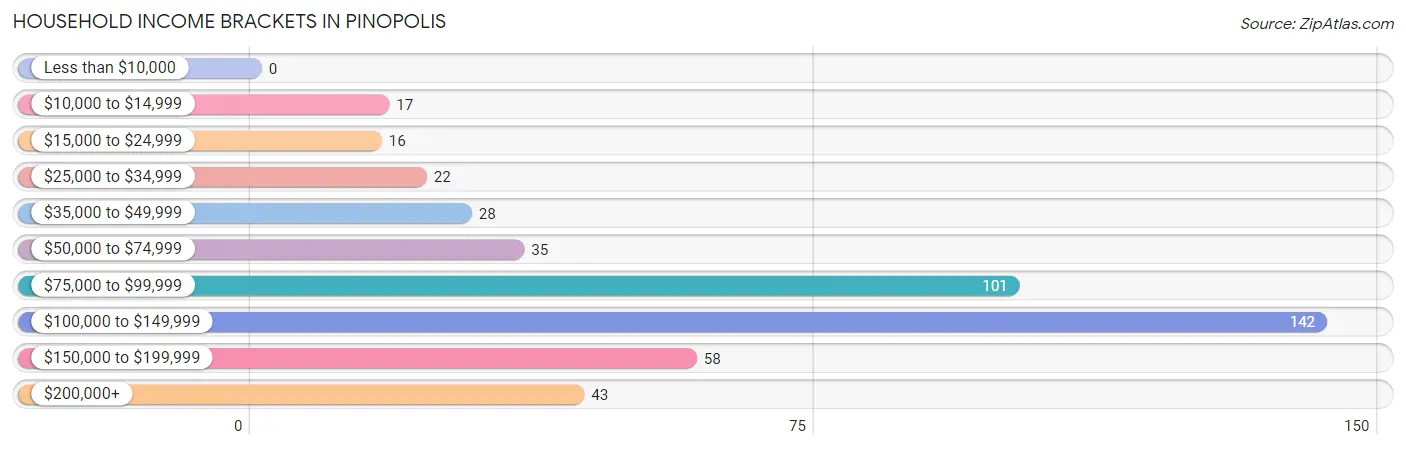
| Income Bracket | # Households | % Households |
| Less than $10,000 | 0 | 0.0% |
| $10,000 to $14,999 | 17 | 3.7% |
| $15,000 to $24,999 | 16 | 3.5% |
| $25,000 to $34,999 | 22 | 4.8% |
| $35,000 to $49,999 | 28 | 6.1% |
| $50,000 to $74,999 | 35 | 7.6% |
| $75,000 to $99,999 | 101 | 21.9% |
| $100,000 to $149,999 | 142 | 30.7% |
| $150,000 to $199,999 | 58 | 12.6% |
| $200,000+ | 43 | 9.3% |
Household Income by Householder Age in Pinopolis
The median household income in Pinopolis is $108,611, with the highest median household income of $121,667 found in the 45 to 64 years age bracket for the primary householder. A total of 212 households (45.9%) fall into this category.
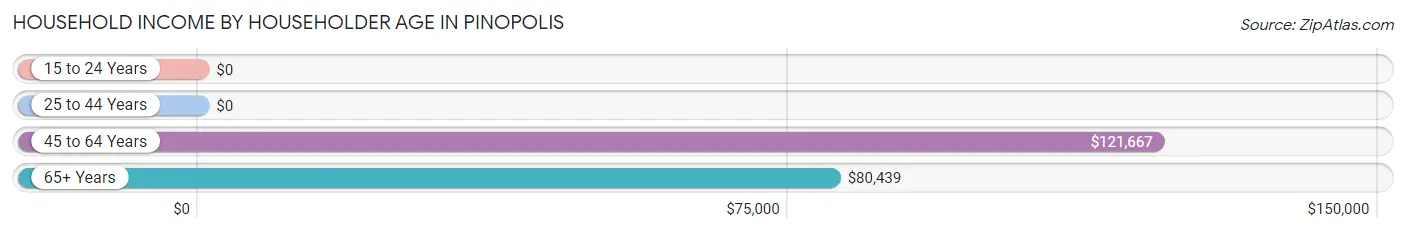
| Income Bracket | # Households | Median Income |
| 15 to 24 Years | 0 (0.0%) | $0 |
| 25 to 44 Years | 24 (5.2%) | $0 |
| 45 to 64 Years | 212 (45.9%) | $121,667 |
| 65+ Years | 226 (48.9%) | $80,439 |
| Total | 462 (100.0%) | $108,611 |
Poverty in Pinopolis
Income Below Poverty by Sex and Age in Pinopolis
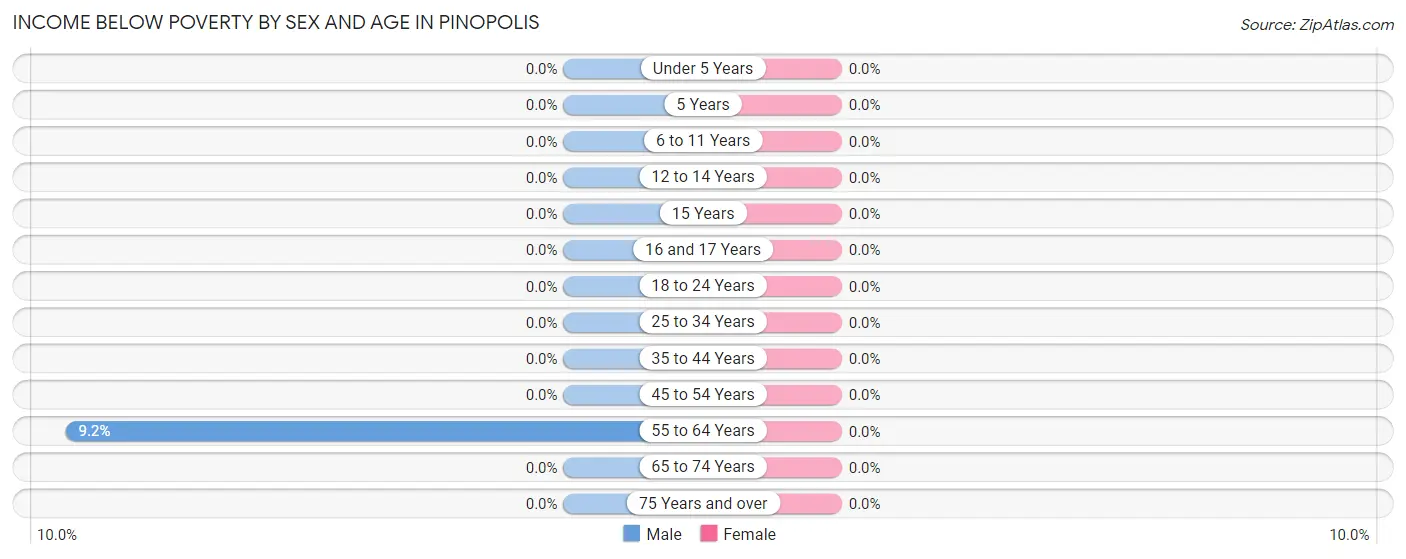
| Age Bracket | Male | Female |
| Under 5 Years | 0 (0.0%) | 0 (0.0%) |
| 5 Years | 0 (0.0%) | 0 (0.0%) |
| 6 to 11 Years | 0 (0.0%) | 0 (0.0%) |
| 12 to 14 Years | 0 (0.0%) | 0 (0.0%) |
| 15 Years | 0 (0.0%) | 0 (0.0%) |
| 16 and 17 Years | 0 (0.0%) | 0 (0.0%) |
| 18 to 24 Years | 0 (0.0%) | 0 (0.0%) |
| 25 to 34 Years | 0 (0.0%) | 0 (0.0%) |
| 35 to 44 Years | 0 (0.0%) | 0 (0.0%) |
| 45 to 54 Years | 0 (0.0%) | 0 (0.0%) |
| 55 to 64 Years | 17 (9.2%) | 0 (0.0%) |
| 65 to 74 Years | 0 (0.0%) | 0 (0.0%) |
| 75 Years and over | 0 (0.0%) | 0 (0.0%) |
| Total | 17 (2.9%) | 0 (0.0%) |
Income Above Poverty by Sex and Age in Pinopolis
According to the poverty statistics in Pinopolis, males aged 16 and 17 years and females aged 16 and 17 years are the age groups that are most secure financially, with 100.0% of males and 100.0% of females in these age groups living above the poverty line.
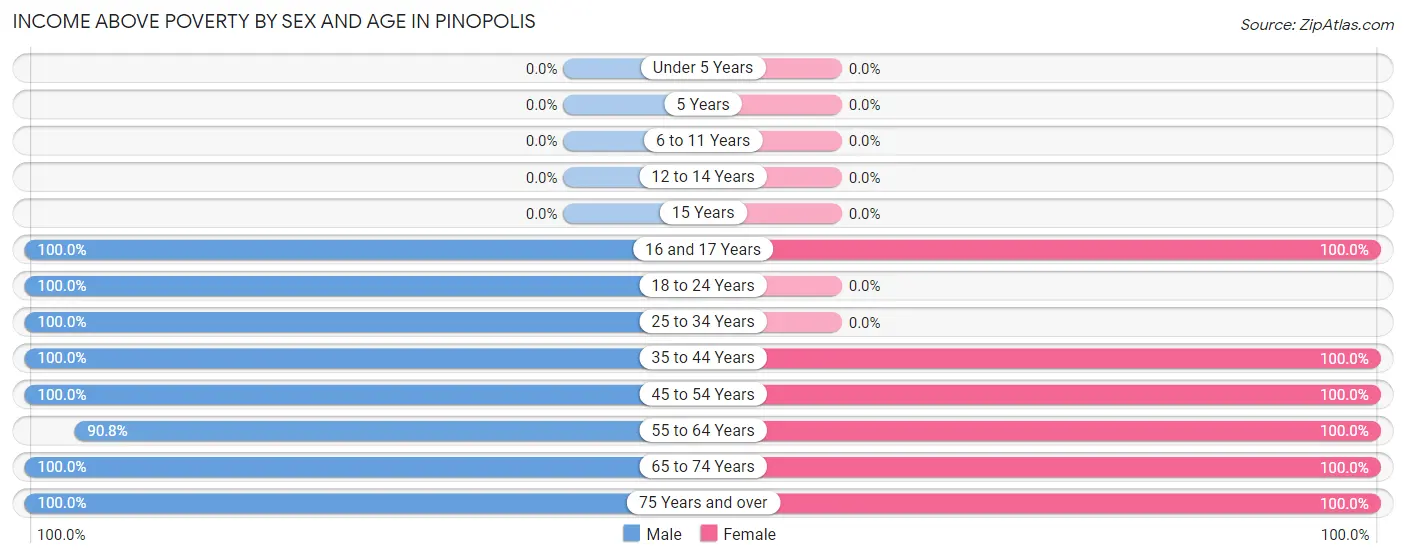
| Age Bracket | Male | Female |
| Under 5 Years | 0 (0.0%) | 0 (0.0%) |
| 5 Years | 0 (0.0%) | 0 (0.0%) |
| 6 to 11 Years | 0 (0.0%) | 0 (0.0%) |
| 12 to 14 Years | 0 (0.0%) | 0 (0.0%) |
| 15 Years | 0 (0.0%) | 0 (0.0%) |
| 16 and 17 Years | 25 (100.0%) | 12 (100.0%) |
| 18 to 24 Years | 36 (100.0%) | 0 (0.0%) |
| 25 to 34 Years | 21 (100.0%) | 0 (0.0%) |
| 35 to 44 Years | 24 (100.0%) | 21 (100.0%) |
| 45 to 54 Years | 37 (100.0%) | 23 (100.0%) |
| 55 to 64 Years | 167 (90.8%) | 158 (100.0%) |
| 65 to 74 Years | 68 (100.0%) | 53 (100.0%) |
| 75 Years and over | 186 (100.0%) | 85 (100.0%) |
| Total | 564 (97.1%) | 352 (100.0%) |
Income Below Poverty Among Married-Couple Families in Pinopolis
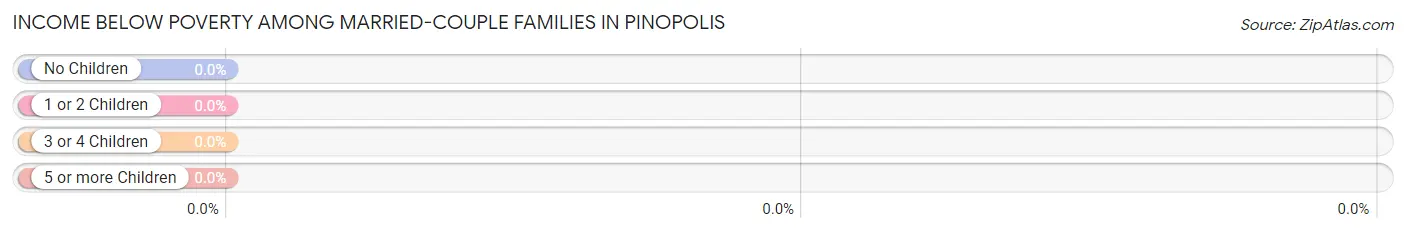
| Children | Above Poverty | Below Poverty |
| No Children | 346 (100.0%) | 0 (0.0%) |
| 1 or 2 Children | 34 (100.0%) | 0 (0.0%) |
| 3 or 4 Children | 0 (0.0%) | 0 (0.0%) |
| 5 or more Children | 0 (0.0%) | 0 (0.0%) |
| Total | 380 (100.0%) | 0 (0.0%) |
Income Below Poverty Among Single-Parent Households in Pinopolis
| Children | Single Father | Single Mother |
| No Children | 0 (0.0%) | 0 (0.0%) |
| 1 or 2 Children | 0 (0.0%) | 0 (0.0%) |
| 3 or 4 Children | 0 (0.0%) | 0 (0.0%) |
| 5 or more Children | 0 (0.0%) | 0 (0.0%) |
| Total | 0 (0.0%) | 0 (0.0%) |
Income Below Poverty Among Married-Couple vs Single-Parent Households in Pinopolis
| Children | Married-Couple Families | Single-Parent Households |
| No Children | 0 (0.0%) | 0 (0.0%) |
| 1 or 2 Children | 0 (0.0%) | 0 (0.0%) |
| 3 or 4 Children | 0 (0.0%) | 0 (0.0%) |
| 5 or more Children | 0 (0.0%) | 0 (0.0%) |
| Total | 0 (0.0%) | 0 (0.0%) |
Race in Pinopolis
The most populous races in Pinopolis are , and White / Caucasian (933 | 100.0%).
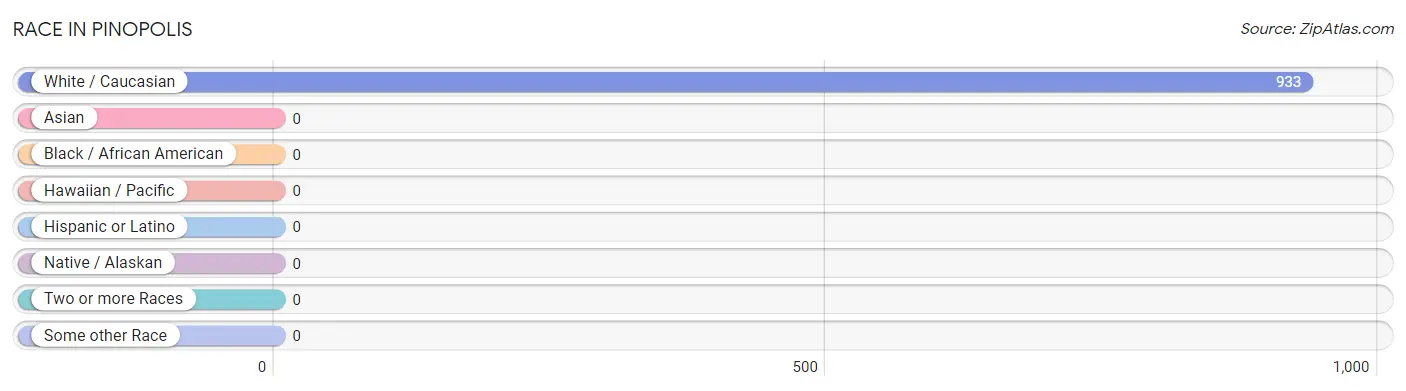
| Race | # Population | % Population |
| Asian | 0 | 0.0% |
| Black / African American | 0 | 0.0% |
| Hawaiian / Pacific | 0 | 0.0% |
| Hispanic or Latino | 0 | 0.0% |
| Native / Alaskan | 0 | 0.0% |
| White / Caucasian | 933 | 100.0% |
| Two or more Races | 0 | 0.0% |
| Some other Race | 0 | 0.0% |
| Total | 933 | 100.0% |
Ancestry in Pinopolis
The most populous ancestries reported in Pinopolis are American (257 | 27.6%), English (194 | 20.8%), German (85 | 9.1%), Scottish (48 | 5.1%), and European (46 | 4.9%), together accounting for 67.5% of all Pinopolis residents.
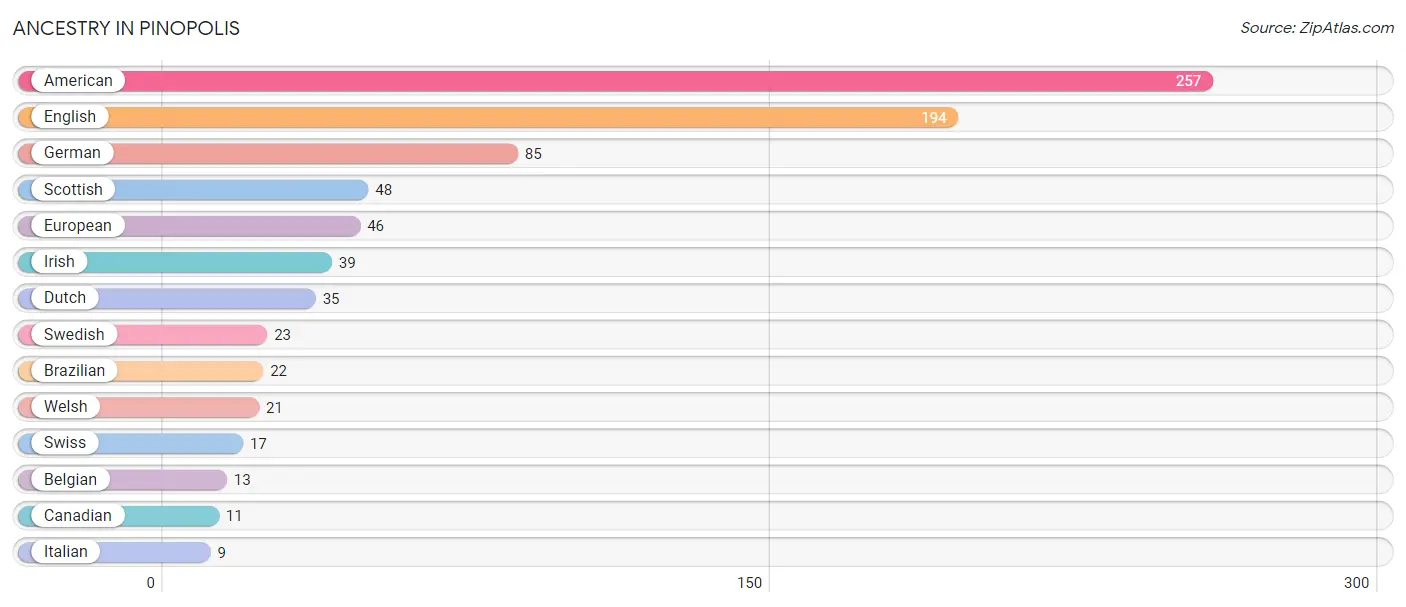
| Ancestry | # Population | % Population |
| American | 257 | 27.6% |
| Belgian | 13 | 1.4% |
| Brazilian | 22 | 2.4% |
| Canadian | 11 | 1.2% |
| Dutch | 35 | 3.7% |
| English | 194 | 20.8% |
| European | 46 | 4.9% |
| German | 85 | 9.1% |
| Irish | 39 | 4.2% |
| Italian | 9 | 1.0% |
| Scottish | 48 | 5.1% |
| Swedish | 23 | 2.5% |
| Swiss | 17 | 1.8% |
| Welsh | 21 | 2.2% | View All 14 Rows |
Immigrants in Pinopolis
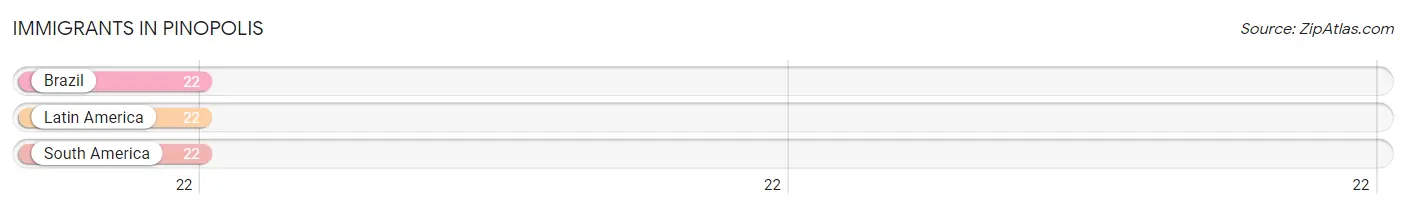
The most numerous immigrant groups reported in Pinopolis came from Brazil (22 | 2.4%), Latin America (22 | 2.4%), and South America (22 | 2.4%), together accounting for 7.1% of all Pinopolis residents.
| Immigration Origin | # Population | % Population |
| Brazil | 22 | 2.4% |
| Latin America | 22 | 2.4% |
| South America | 22 | 2.4% | View All 3 Rows |
Sex and Age in Pinopolis
Sex and Age in Pinopolis
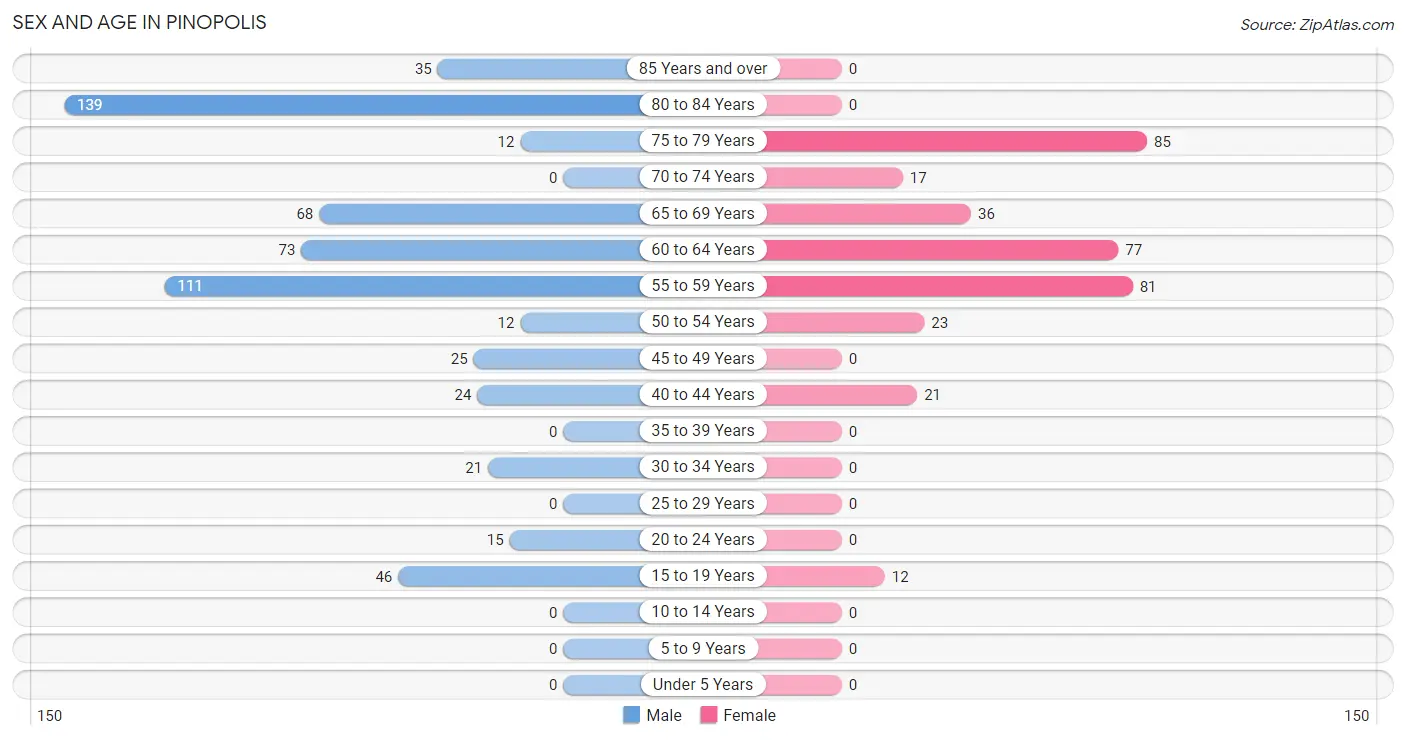
The most populous age groups in Pinopolis are 80 to 84 Years (139 | 23.9%) for men and 75 to 79 Years (85 | 24.1%) for women.
| Age Bracket | Male | Female |
| Under 5 Years | 0 (0.0%) | 0 (0.0%) |
| 5 to 9 Years | 0 (0.0%) | 0 (0.0%) |
| 10 to 14 Years | 0 (0.0%) | 0 (0.0%) |
| 15 to 19 Years | 46 (7.9%) | 12 (3.4%) |
| 20 to 24 Years | 15 (2.6%) | 0 (0.0%) |
| 25 to 29 Years | 0 (0.0%) | 0 (0.0%) |
| 30 to 34 Years | 21 (3.6%) | 0 (0.0%) |
| 35 to 39 Years | 0 (0.0%) | 0 (0.0%) |
| 40 to 44 Years | 24 (4.1%) | 21 (6.0%) |
| 45 to 49 Years | 25 (4.3%) | 0 (0.0%) |
| 50 to 54 Years | 12 (2.1%) | 23 (6.5%) |
| 55 to 59 Years | 111 (19.1%) | 81 (23.0%) |
| 60 to 64 Years | 73 (12.6%) | 77 (21.9%) |
| 65 to 69 Years | 68 (11.7%) | 36 (10.2%) |
| 70 to 74 Years | 0 (0.0%) | 17 (4.8%) |
| 75 to 79 Years | 12 (2.1%) | 85 (24.1%) |
| 80 to 84 Years | 139 (23.9%) | 0 (0.0%) |
| 85 Years and over | 35 (6.0%) | 0 (0.0%) |
| Total | 581 (100.0%) | 352 (100.0%) |
Families and Households in Pinopolis
Median Family Size in Pinopolis
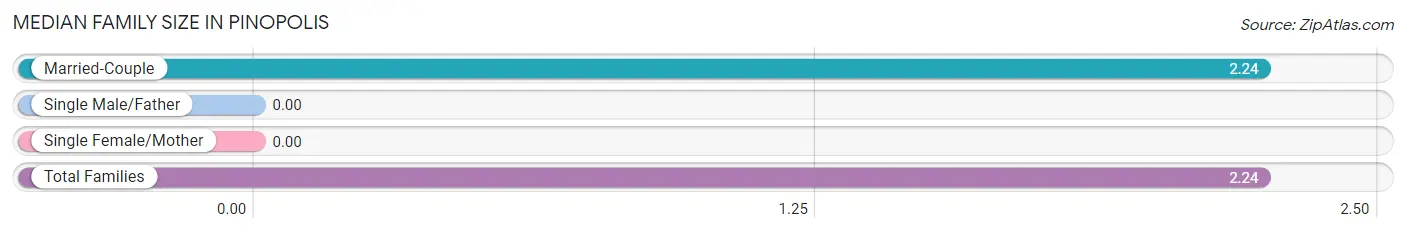
| Family Type | # Families | Family Size |
| Married-Couple | 380 (100.0%) | 2.24 |
| Single Male/Father | 0 (0.0%) | - |
| Single Female/Mother | 0 (0.0%) | - |
| Total Families | 380 (100.0%) | 2.24 |
Median Household Size in Pinopolis
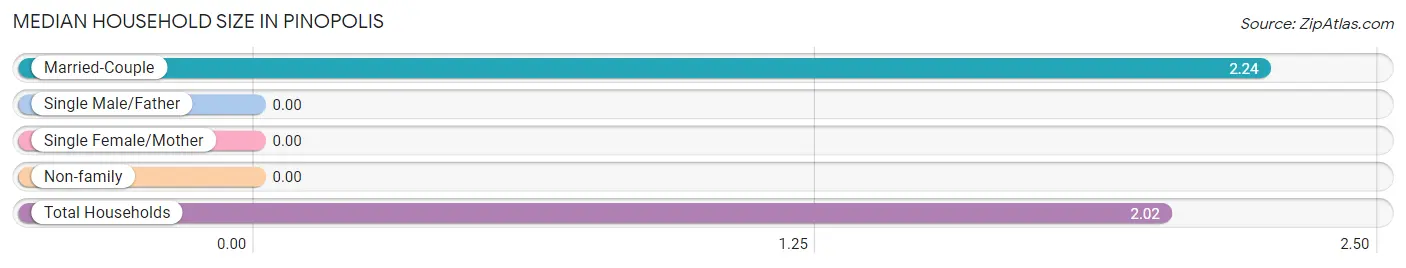
| Household Type | # Households | Household Size |
| Married-Couple | 380 (82.3%) | 2.24 |
| Single Male/Father | 0 (0.0%) | - |
| Single Female/Mother | 0 (0.0%) | - |
| Non-family | 82 (17.7%) | - |
| Total Households | 462 (100.0%) | 2.02 |
Household Size by Marriage Status in Pinopolis
Out of a total of 462 households in Pinopolis, 380 (82.3%) are family households, while 82 (17.7%) are nonfamily households. The most numerous type of family households are 2-person households, comprising 257, and the most common type of nonfamily households are 1-person households, comprising 82.
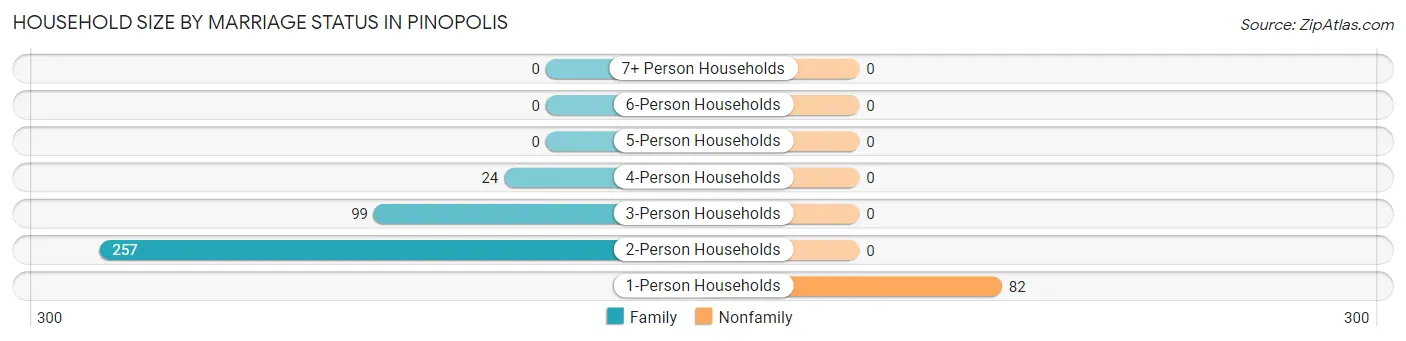
| Household Size | Family Households | Nonfamily Households |
| 1-Person Households | - | 82 (17.7%) |
| 2-Person Households | 257 (55.6%) | 0 (0.0%) |
| 3-Person Households | 99 (21.4%) | 0 (0.0%) |
| 4-Person Households | 24 (5.2%) | 0 (0.0%) |
| 5-Person Households | 0 (0.0%) | 0 (0.0%) |
| 6-Person Households | 0 (0.0%) | 0 (0.0%) |
| 7+ Person Households | 0 (0.0%) | 0 (0.0%) |
| Total | 380 (82.3%) | 82 (17.7%) |
Female Fertility in Pinopolis
Fertility by Age in Pinopolis
| Age Bracket | Women with Births | Births / 1,000 Women |
| 15 to 19 years | 0 (0.0%) | 0.0 |
| 20 to 34 years | 0 (0.0%) | 0.0 |
| 35 to 50 years | 0 (0.0%) | 0.0 |
| Total | 0 (0.0%) | 0.0 |
Fertility by Age by Marriage Status in Pinopolis
| Age Bracket | Married | Unmarried |
| 15 to 19 years | 0 (0.0%) | 0 (0.0%) |
| 20 to 34 years | 0 (0.0%) | 0 (0.0%) |
| 35 to 50 years | 0 (0.0%) | 0 (0.0%) |
| Total | 0 (0.0%) | 0 (0.0%) |
Fertility by Education in Pinopolis
| Educational Attainment | Women with Births | Births / 1,000 Women |
| Less than High School | 0 (0.0%) | 0.0 |
| High School Diploma | 0 (0.0%) | 0.0 |
| College or Associate's Degree | 0 (0.0%) | 0.0 |
| Bachelor's Degree | 0 (0.0%) | 0.0 |
| Graduate Degree | 0 (0.0%) | 0.0 |
| Total | 0 (0.0%) | 0.0 |
Fertility by Education by Marriage Status in Pinopolis
| Educational Attainment | Married | Unmarried |
| Less than High School | 0 (0.0%) | 0 (0.0%) |
| High School Diploma | 0 (0.0%) | 0 (0.0%) |
| College or Associate's Degree | 0 (0.0%) | 0 (0.0%) |
| Bachelor's Degree | 0 (0.0%) | 0 (0.0%) |
| Graduate Degree | 0 (0.0%) | 0 (0.0%) |
| Total | 0 (0.0%) | 0 (0.0%) |
Employment Characteristics in Pinopolis
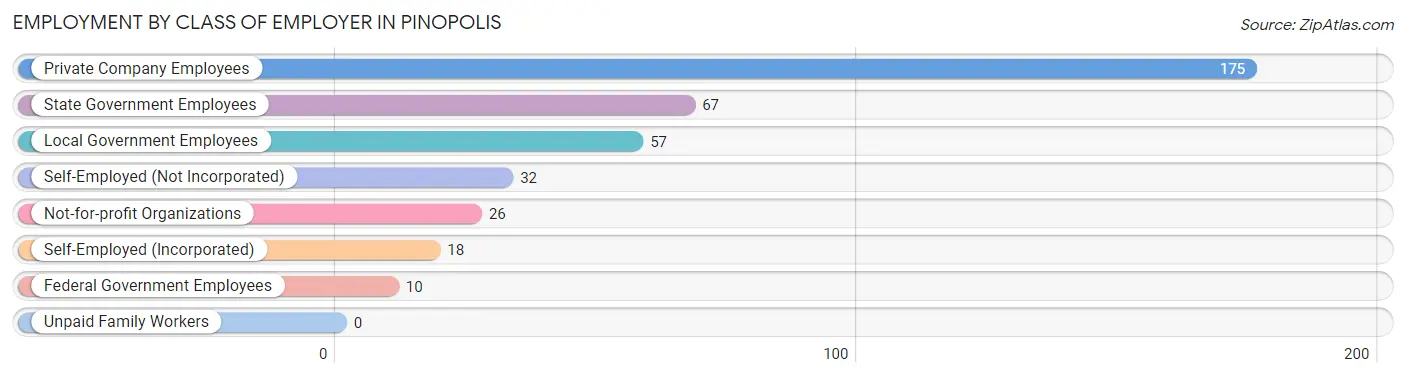
Employment by Class of Employer in Pinopolis
Among the 385 employed individuals in Pinopolis, private company employees (175 | 45.5%), state government employees (67 | 17.4%), and local government employees (57 | 14.8%) make up the most common classes of employment.
| Employer Class | # Employees | % Employees |
| Private Company Employees | 175 | 45.5% |
| Self-Employed (Incorporated) | 18 | 4.7% |
| Self-Employed (Not Incorporated) | 32 | 8.3% |
| Not-for-profit Organizations | 26 | 6.8% |
| Local Government Employees | 57 | 14.8% |
| State Government Employees | 67 | 17.4% |
| Federal Government Employees | 10 | 2.6% |
| Unpaid Family Workers | 0 | 0.0% |
| Total | 385 | 100.0% |
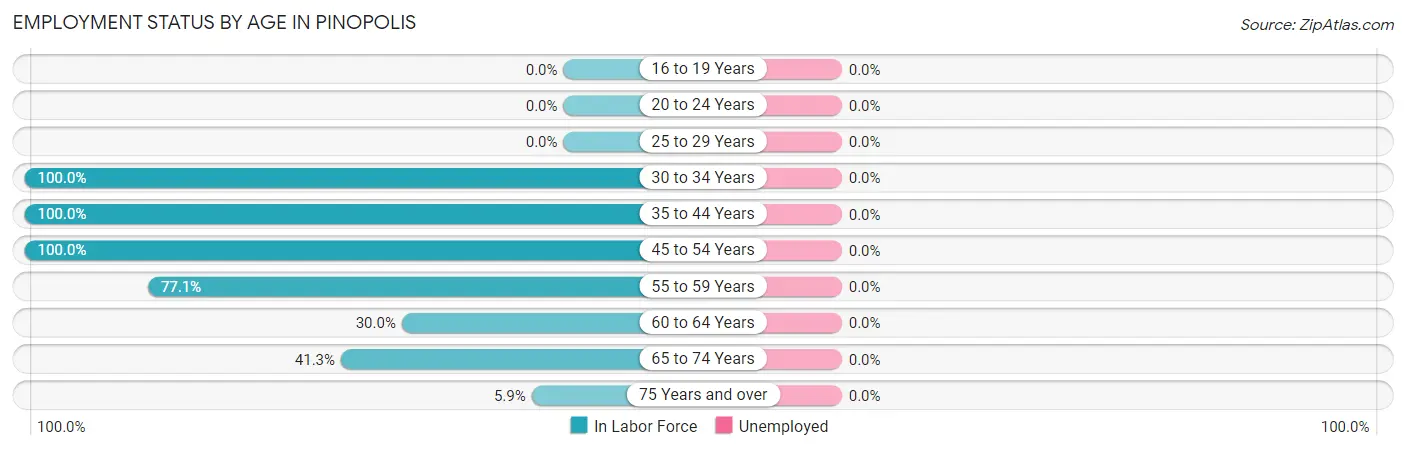
Employment Status by Age in Pinopolis
| Age Bracket | In Labor Force | Unemployed |
| 16 to 19 Years | 0 (0.0%) | 0 (0.0%) |
| 20 to 24 Years | 0 (0.0%) | 0 (0.0%) |
| 25 to 29 Years | 0 (0.0%) | 0 (0.0%) |
| 30 to 34 Years | 21 (100.0%) | 0 (0.0%) |
| 35 to 44 Years | 45 (100.0%) | 0 (0.0%) |
| 45 to 54 Years | 60 (100.0%) | 0 (0.0%) |
| 55 to 59 Years | 148 (77.1%) | 0 (0.0%) |
| 60 to 64 Years | 45 (30.0%) | 0 (0.0%) |
| 65 to 74 Years | 50 (41.3%) | 0 (0.0%) |
| 75 Years and over | 16 (5.9%) | 0 (0.0%) |
| Total | 385 (41.3%) | 0 (0.0%) |
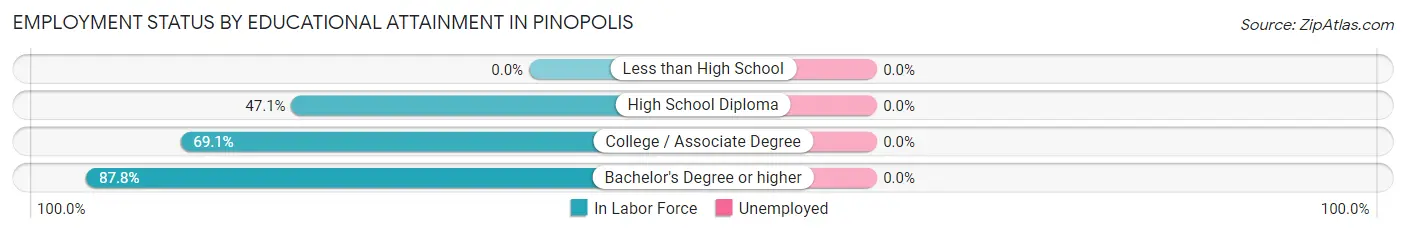
Employment Status by Educational Attainment in Pinopolis
| Educational Attainment | In Labor Force | Unemployed |
| Less than High School | 0 (0.0%) | 0 (0.0%) |
| High School Diploma | 65 (47.1%) | 0 (0.0%) |
| College / Associate Degree | 132 (69.1%) | 0 (0.0%) |
| Bachelor's Degree or higher | 122 (87.8%) | 0 (0.0%) |
| Total | 319 (68.2%) | 0 (0.0%) |
Employment Occupations by Sex in Pinopolis
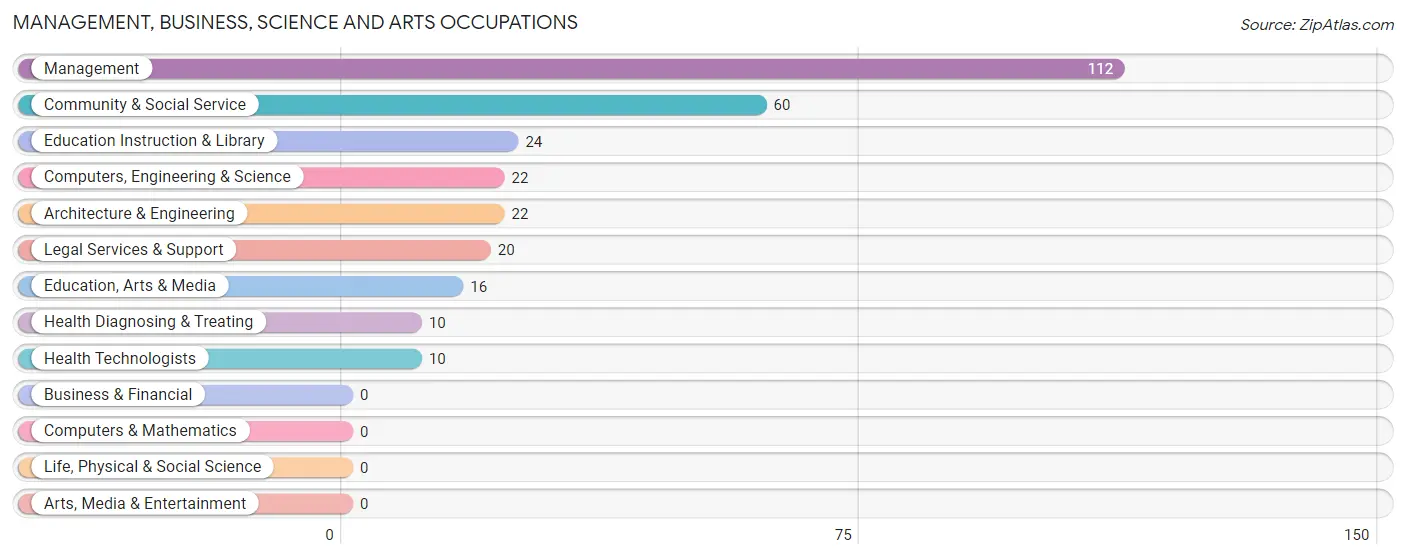
Management, Business, Science and Arts Occupations
The most common Management, Business, Science and Arts occupations in Pinopolis are Management (112 | 29.9%), Community & Social Service (60 | 16.0%), Education Instruction & Library (24 | 6.4%), Computers, Engineering & Science (22 | 5.9%), and Architecture & Engineering (22 | 5.9%).
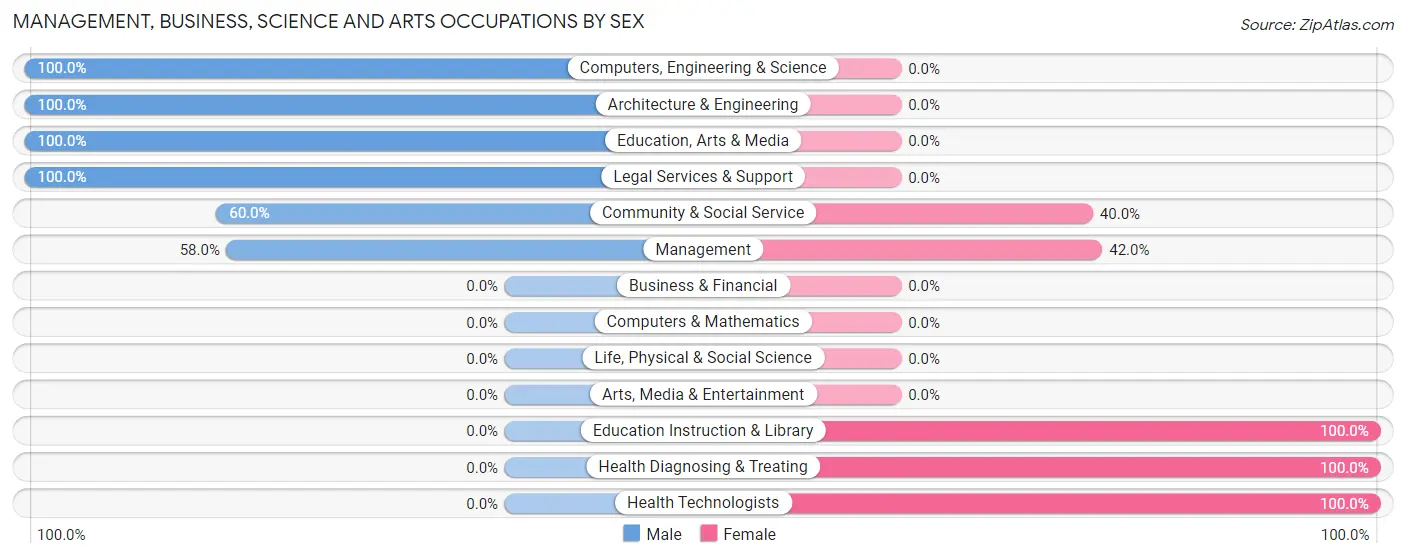
Management, Business, Science and Arts Occupations by Sex
Within the Management, Business, Science and Arts occupations in Pinopolis, the most male-oriented occupations are Computers, Engineering & Science (100.0%), Architecture & Engineering (100.0%), and Education, Arts & Media (100.0%), while the most female-oriented occupations are Education Instruction & Library (100.0%), Health Diagnosing & Treating (100.0%), and Health Technologists (100.0%).
| Occupation | Male | Female |
| Management | 65 (58.0%) | 47 (42.0%) |
| Business & Financial | 0 (0.0%) | 0 (0.0%) |
| Computers, Engineering & Science | 22 (100.0%) | 0 (0.0%) |
| Computers & Mathematics | 0 (0.0%) | 0 (0.0%) |
| Architecture & Engineering | 22 (100.0%) | 0 (0.0%) |
| Life, Physical & Social Science | 0 (0.0%) | 0 (0.0%) |
| Community & Social Service | 36 (60.0%) | 24 (40.0%) |
| Education, Arts & Media | 16 (100.0%) | 0 (0.0%) |
| Legal Services & Support | 20 (100.0%) | 0 (0.0%) |
| Education Instruction & Library | 0 (0.0%) | 24 (100.0%) |
| Arts, Media & Entertainment | 0 (0.0%) | 0 (0.0%) |
| Health Diagnosing & Treating | 0 (0.0%) | 10 (100.0%) |
| Health Technologists | 0 (0.0%) | 10 (100.0%) |
| Total (Category) | 123 (60.3%) | 81 (39.7%) |
| Total (Overall) | 251 (66.9%) | 124 (33.1%) |
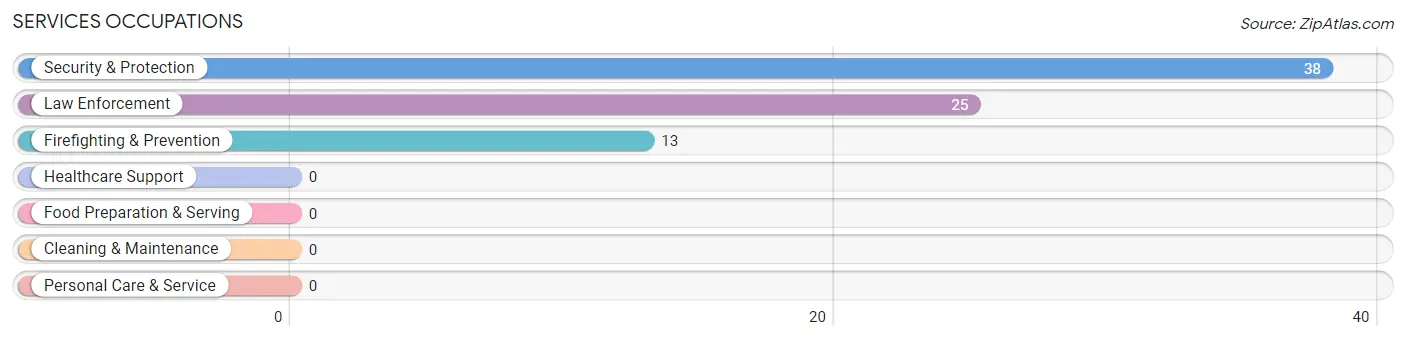
Services Occupations
The most common Services occupations in Pinopolis are Security & Protection (38 | 10.1%), Law Enforcement (25 | 6.7%), and Firefighting & Prevention (13 | 3.5%).
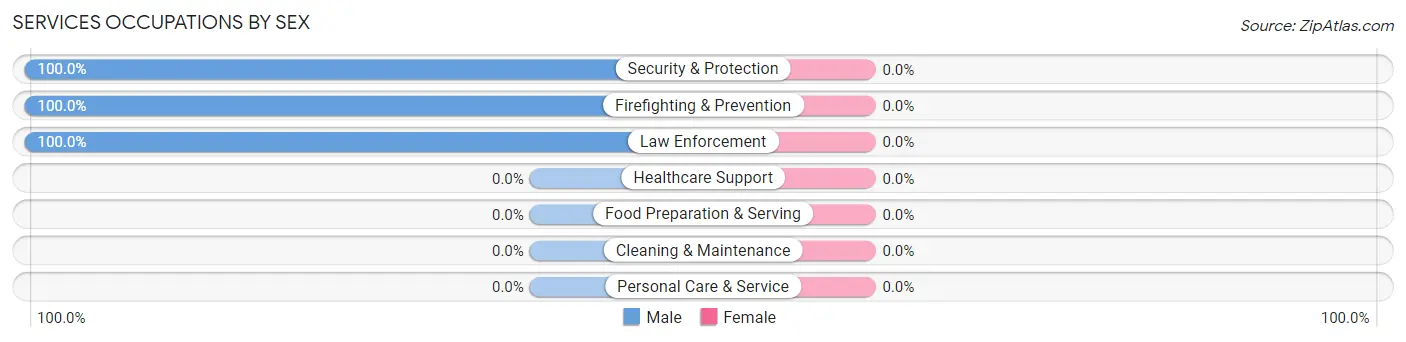
Services Occupations by Sex
| Occupation | Male | Female |
| Healthcare Support | 0 (0.0%) | 0 (0.0%) |
| Security & Protection | 38 (100.0%) | 0 (0.0%) |
| Firefighting & Prevention | 13 (100.0%) | 0 (0.0%) |
| Law Enforcement | 25 (100.0%) | 0 (0.0%) |
| Food Preparation & Serving | 0 (0.0%) | 0 (0.0%) |
| Cleaning & Maintenance | 0 (0.0%) | 0 (0.0%) |
| Personal Care & Service | 0 (0.0%) | 0 (0.0%) |
| Total (Category) | 38 (100.0%) | 0 (0.0%) |
| Total (Overall) | 251 (66.9%) | 124 (33.1%) |
Sales and Office Occupations
The most common Sales and Office occupations in Pinopolis are Office & Administration (64 | 17.1%), and Sales & Related (12 | 3.2%).

Sales and Office Occupations by Sex

| Occupation | Male | Female |
| Sales & Related | 12 (100.0%) | 0 (0.0%) |
| Office & Administration | 21 (32.8%) | 43 (67.2%) |
| Total (Category) | 33 (43.4%) | 43 (56.6%) |
| Total (Overall) | 251 (66.9%) | 124 (33.1%) |
Natural Resources, Construction and Maintenance Occupations
The most common Natural Resources, Construction and Maintenance occupations in Pinopolis are , and Construction & Extraction (33 | 8.8%).
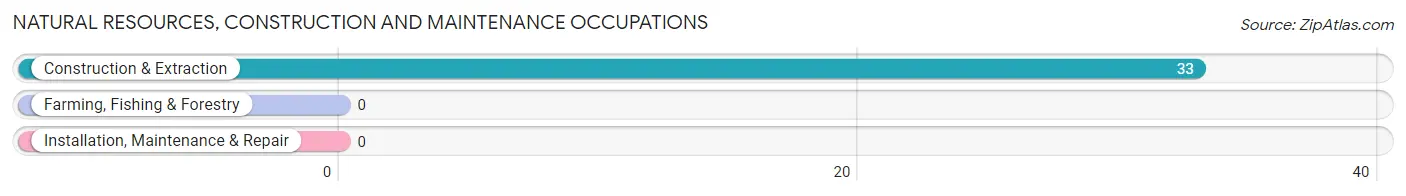
Natural Resources, Construction and Maintenance Occupations by Sex
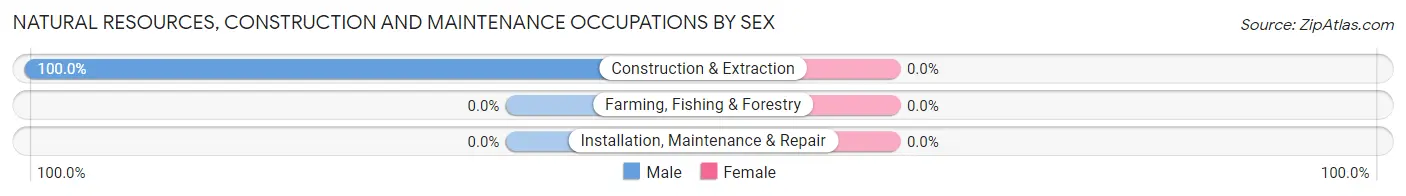
| Occupation | Male | Female |
| Farming, Fishing & Forestry | 0 (0.0%) | 0 (0.0%) |
| Construction & Extraction | 33 (100.0%) | 0 (0.0%) |
| Installation, Maintenance & Repair | 0 (0.0%) | 0 (0.0%) |
| Total (Category) | 33 (100.0%) | 0 (0.0%) |
| Total (Overall) | 251 (66.9%) | 124 (33.1%) |
Production, Transportation and Moving Occupations
The most common Production, Transportation and Moving occupations in Pinopolis are , and Production (24 | 6.4%).
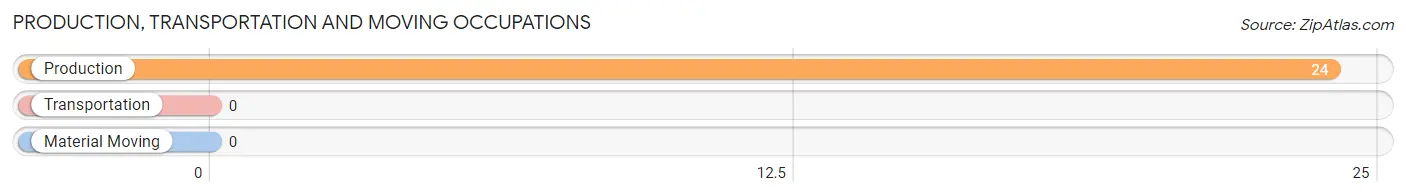
Production, Transportation and Moving Occupations by Sex
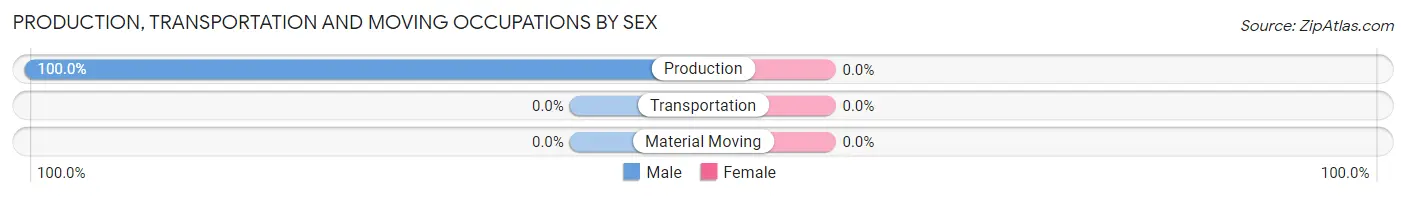
| Occupation | Male | Female |
| Production | 24 (100.0%) | 0 (0.0%) |
| Transportation | 0 (0.0%) | 0 (0.0%) |
| Material Moving | 0 (0.0%) | 0 (0.0%) |
| Total (Category) | 24 (100.0%) | 0 (0.0%) |
| Total (Overall) | 251 (66.9%) | 124 (33.1%) |
Employment Industries by Sex in Pinopolis
Employment Industries in Pinopolis
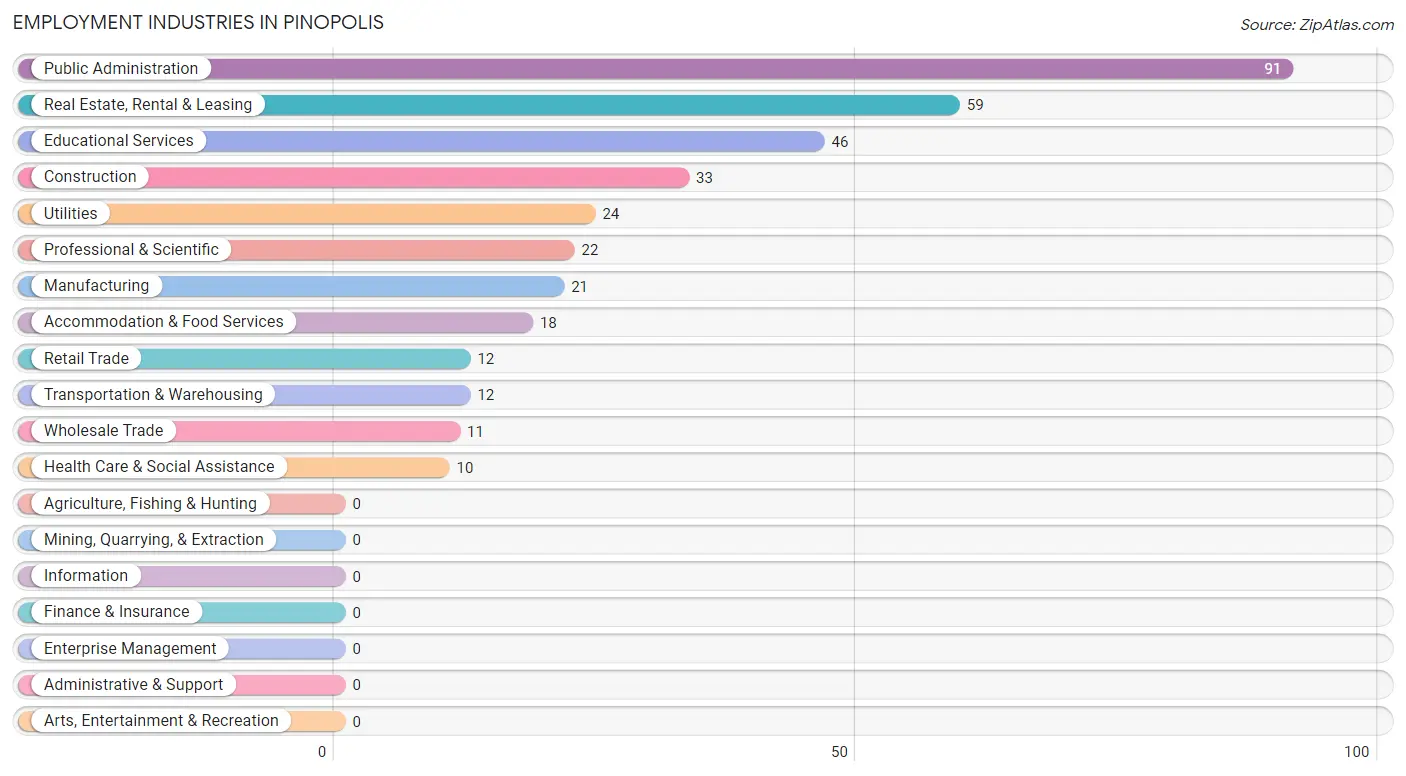
The major employment industries in Pinopolis include Public Administration (91 | 24.3%), Real Estate, Rental & Leasing (59 | 15.7%), Educational Services (46 | 12.3%), Construction (33 | 8.8%), and Utilities (24 | 6.4%).
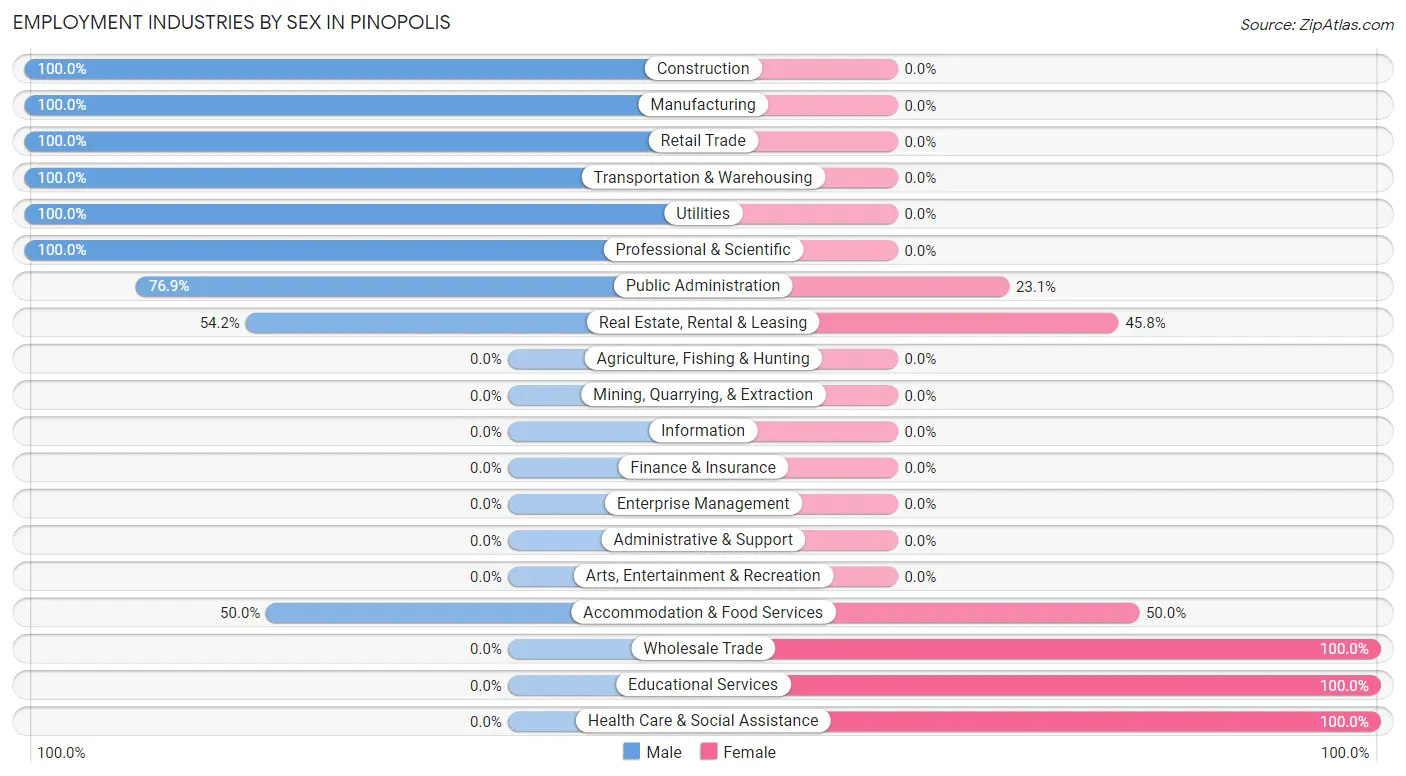
Employment Industries by Sex in Pinopolis
The Pinopolis industries that see more men than women are Construction (100.0%), Manufacturing (100.0%), and Retail Trade (100.0%), whereas the industries that tend to have a higher number of women are Wholesale Trade (100.0%), Educational Services (100.0%), and Health Care & Social Assistance (100.0%).
| Industry | Male | Female |
| Agriculture, Fishing & Hunting | 0 (0.0%) | 0 (0.0%) |
| Mining, Quarrying, & Extraction | 0 (0.0%) | 0 (0.0%) |
| Construction | 33 (100.0%) | 0 (0.0%) |
| Manufacturing | 21 (100.0%) | 0 (0.0%) |
| Wholesale Trade | 0 (0.0%) | 11 (100.0%) |
| Retail Trade | 12 (100.0%) | 0 (0.0%) |
| Transportation & Warehousing | 12 (100.0%) | 0 (0.0%) |
| Utilities | 24 (100.0%) | 0 (0.0%) |
| Information | 0 (0.0%) | 0 (0.0%) |
| Finance & Insurance | 0 (0.0%) | 0 (0.0%) |
| Real Estate, Rental & Leasing | 32 (54.2%) | 27 (45.8%) |
| Professional & Scientific | 22 (100.0%) | 0 (0.0%) |
| Enterprise Management | 0 (0.0%) | 0 (0.0%) |
| Administrative & Support | 0 (0.0%) | 0 (0.0%) |
| Educational Services | 0 (0.0%) | 46 (100.0%) |
| Health Care & Social Assistance | 0 (0.0%) | 10 (100.0%) |
| Arts, Entertainment & Recreation | 0 (0.0%) | 0 (0.0%) |
| Accommodation & Food Services | 9 (50.0%) | 9 (50.0%) |
| Public Administration | 70 (76.9%) | 21 (23.1%) |
| Total | 251 (66.9%) | 124 (33.1%) |
Education in Pinopolis
School Enrollment in Pinopolis
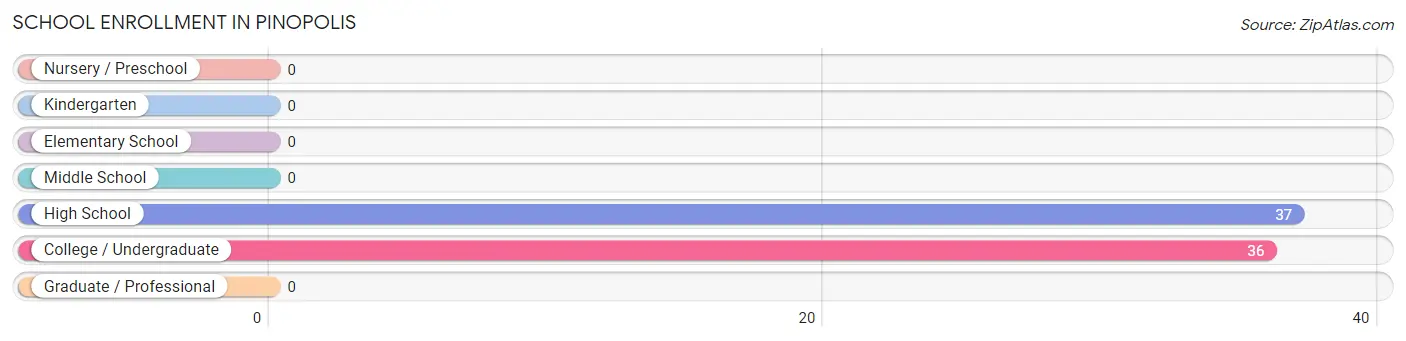
The most common levels of schooling among the 73 students in Pinopolis are high school (37 | 50.7%), and college / undergraduate (36 | 49.3%).
| School Level | # Students | % Students |
| Nursery / Preschool | 0 | 0.0% |
| Kindergarten | 0 | 0.0% |
| Elementary School | 0 | 0.0% |
| Middle School | 0 | 0.0% |
| High School | 37 | 50.7% |
| College / Undergraduate | 36 | 49.3% |
| Graduate / Professional | 0 | 0.0% |
| Total | 73 | 100.0% |
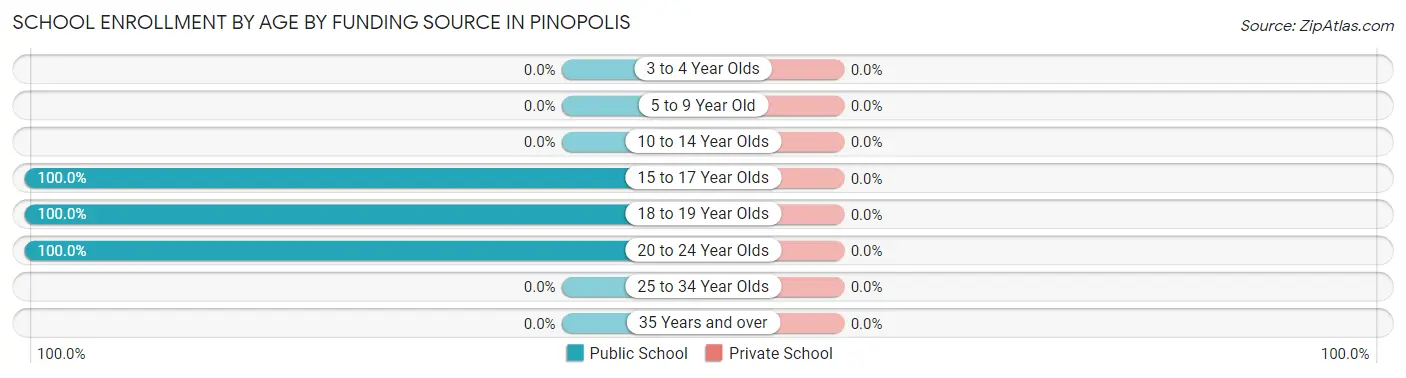
School Enrollment by Age by Funding Source in Pinopolis
| Age Bracket | Public School | Private School |
| 3 to 4 Year Olds | 0 (0.0%) | 0 (0.0%) |
| 5 to 9 Year Old | 0 (0.0%) | 0 (0.0%) |
| 10 to 14 Year Olds | 0 (0.0%) | 0 (0.0%) |
| 15 to 17 Year Olds | 37 (100.0%) | 0 (0.0%) |
| 18 to 19 Year Olds | 21 (100.0%) | 0 (0.0%) |
| 20 to 24 Year Olds | 15 (100.0%) | 0 (0.0%) |
| 25 to 34 Year Olds | 0 (0.0%) | 0 (0.0%) |
| 35 Years and over | 0 (0.0%) | 0 (0.0%) |
| Total | 73 (100.0%) | 0 (0.0%) |
Educational Attainment by Field of Study in Pinopolis
Business (105 | 37.6%), education (35 | 12.5%), psychology (30 | 10.7%), science & technology (29 | 10.4%), and arts & humanities (25 | 9.0%) are the most common fields of study among 279 individuals in Pinopolis who have obtained a bachelor's degree or higher.
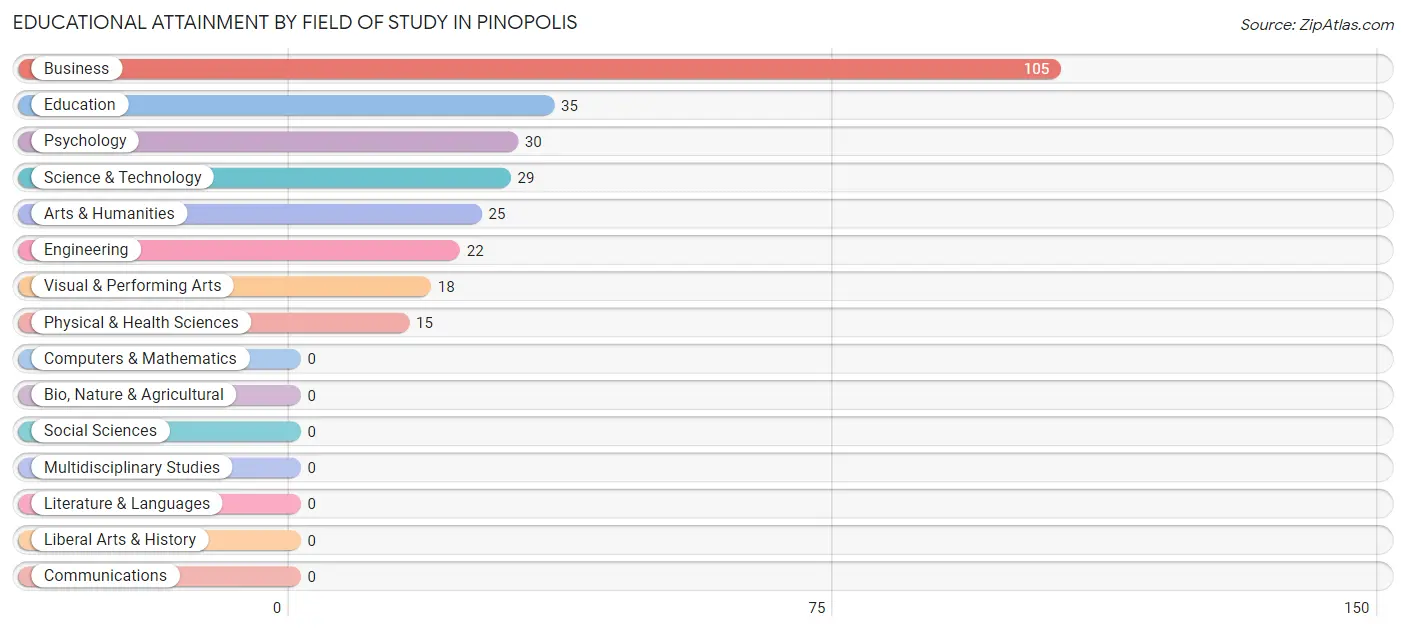
| Field of Study | # Graduates | % Graduates |
| Computers & Mathematics | 0 | 0.0% |
| Bio, Nature & Agricultural | 0 | 0.0% |
| Physical & Health Sciences | 15 | 5.4% |
| Psychology | 30 | 10.7% |
| Social Sciences | 0 | 0.0% |
| Engineering | 22 | 7.9% |
| Multidisciplinary Studies | 0 | 0.0% |
| Science & Technology | 29 | 10.4% |
| Business | 105 | 37.6% |
| Education | 35 | 12.5% |
| Literature & Languages | 0 | 0.0% |
| Liberal Arts & History | 0 | 0.0% |
| Visual & Performing Arts | 18 | 6.5% |
| Communications | 0 | 0.0% |
| Arts & Humanities | 25 | 9.0% |
| Total | 279 | 100.0% |
Transportation & Commute in Pinopolis
Vehicle Availability by Sex in Pinopolis
The most prevalent vehicle ownership categories in Pinopolis are males with 4 vehicles (82, accounting for 32.7%) and females with 4 vehicles (56, making up 61.2%).
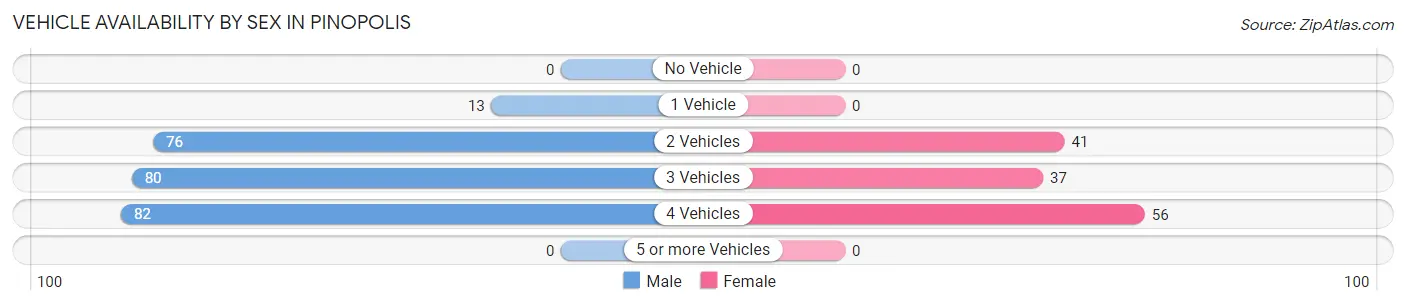
| Vehicles Available | Male | Female |
| No Vehicle | 0 (0.0%) | 0 (0.0%) |
| 1 Vehicle | 13 (5.2%) | 0 (0.0%) |
| 2 Vehicles | 76 (30.3%) | 41 (30.6%) |
| 3 Vehicles | 80 (31.9%) | 37 (27.6%) |
| 4 Vehicles | 82 (32.7%) | 56 (41.8%) |
| 5 or more Vehicles | 0 (0.0%) | 0 (0.0%) |
| Total | 251 (100.0%) | 134 (100.0%) |
Commute Time in Pinopolis
The most frequently occuring commute durations in Pinopolis are 10 to 14 minutes (111 commuters, 29.6%), 30 to 34 minutes (86 commuters, 22.9%), and 15 to 19 minutes (46 commuters, 12.3%).
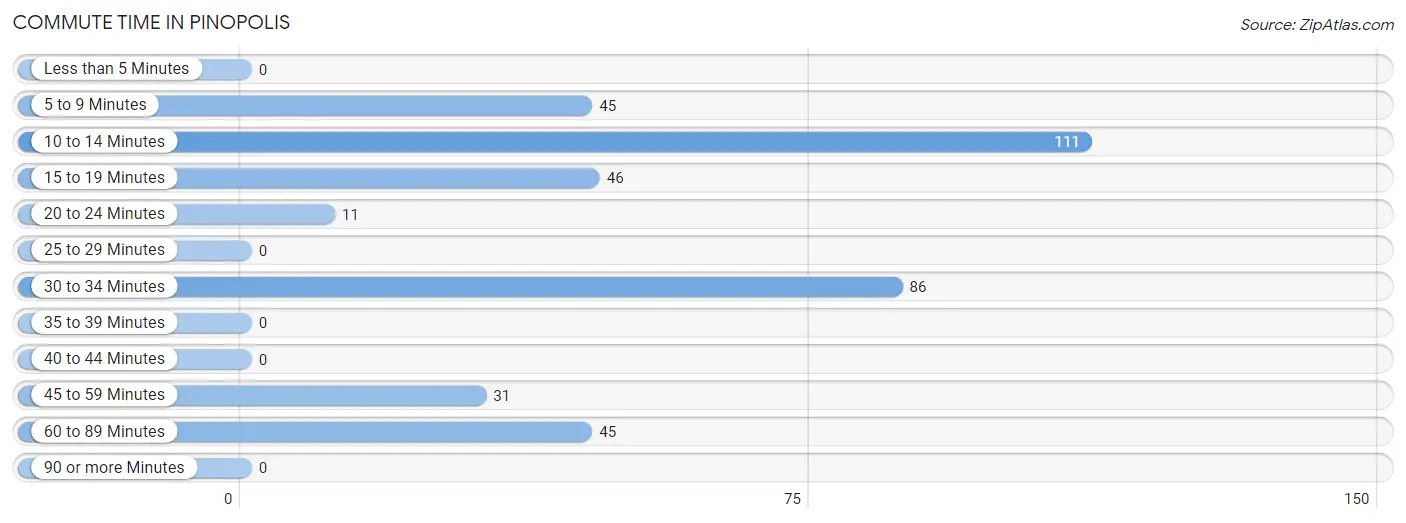
| Commute Time | # Commuters | % Commuters |
| Less than 5 Minutes | 0 | 0.0% |
| 5 to 9 Minutes | 45 | 12.0% |
| 10 to 14 Minutes | 111 | 29.6% |
| 15 to 19 Minutes | 46 | 12.3% |
| 20 to 24 Minutes | 11 | 2.9% |
| 25 to 29 Minutes | 0 | 0.0% |
| 30 to 34 Minutes | 86 | 22.9% |
| 35 to 39 Minutes | 0 | 0.0% |
| 40 to 44 Minutes | 0 | 0.0% |
| 45 to 59 Minutes | 31 | 8.3% |
| 60 to 89 Minutes | 45 | 12.0% |
| 90 or more Minutes | 0 | 0.0% |
Commute Time by Sex in Pinopolis
The most common commute times in Pinopolis are 10 to 14 minutes (84 commuters, 34.8%) for males and 30 to 34 minutes (53 commuters, 39.6%) for females.
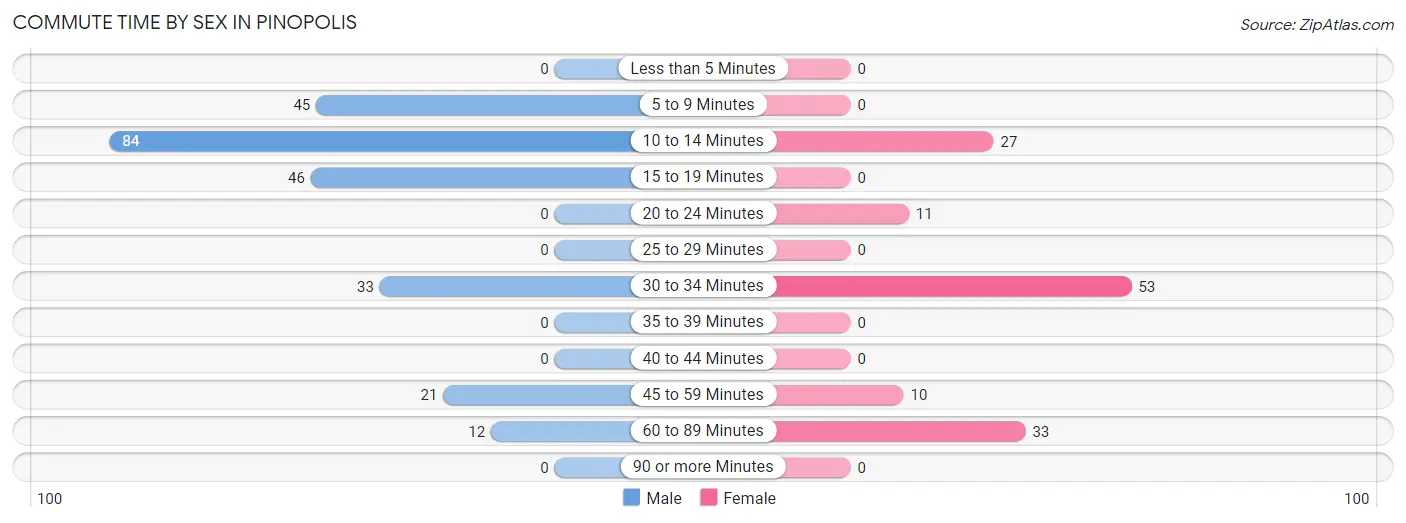
| Commute Time | Male | Female |
| Less than 5 Minutes | 0 (0.0%) | 0 (0.0%) |
| 5 to 9 Minutes | 45 (18.7%) | 0 (0.0%) |
| 10 to 14 Minutes | 84 (34.8%) | 27 (20.2%) |
| 15 to 19 Minutes | 46 (19.1%) | 0 (0.0%) |
| 20 to 24 Minutes | 0 (0.0%) | 11 (8.2%) |
| 25 to 29 Minutes | 0 (0.0%) | 0 (0.0%) |
| 30 to 34 Minutes | 33 (13.7%) | 53 (39.6%) |
| 35 to 39 Minutes | 0 (0.0%) | 0 (0.0%) |
| 40 to 44 Minutes | 0 (0.0%) | 0 (0.0%) |
| 45 to 59 Minutes | 21 (8.7%) | 10 (7.5%) |
| 60 to 89 Minutes | 12 (5.0%) | 33 (24.6%) |
| 90 or more Minutes | 0 (0.0%) | 0 (0.0%) |
Time of Departure to Work by Sex in Pinopolis
The most frequent times of departure to work in Pinopolis are 6:30 AM to 6:59 AM (57, 23.6%) for males and 6:00 AM to 6:29 AM (40, 29.8%) for females.
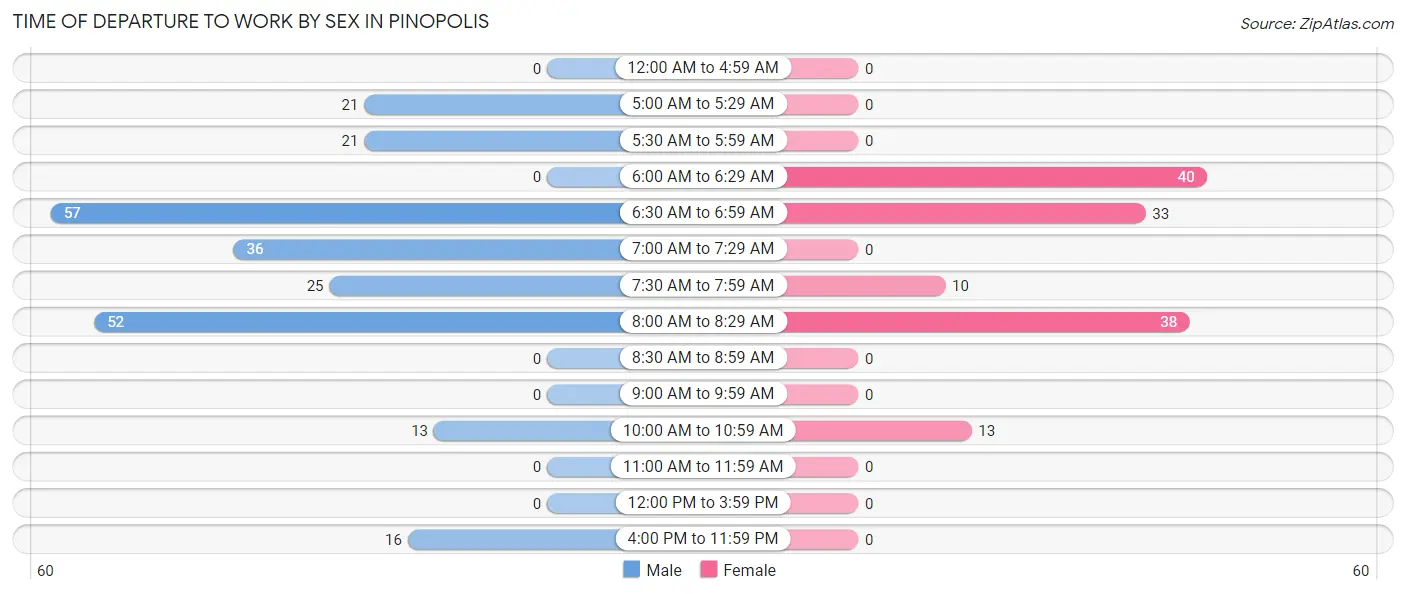
| Time of Departure | Male | Female |
| 12:00 AM to 4:59 AM | 0 (0.0%) | 0 (0.0%) |
| 5:00 AM to 5:29 AM | 21 (8.7%) | 0 (0.0%) |
| 5:30 AM to 5:59 AM | 21 (8.7%) | 0 (0.0%) |
| 6:00 AM to 6:29 AM | 0 (0.0%) | 40 (29.8%) |
| 6:30 AM to 6:59 AM | 57 (23.6%) | 33 (24.6%) |
| 7:00 AM to 7:29 AM | 36 (14.9%) | 0 (0.0%) |
| 7:30 AM to 7:59 AM | 25 (10.4%) | 10 (7.5%) |
| 8:00 AM to 8:29 AM | 52 (21.6%) | 38 (28.4%) |
| 8:30 AM to 8:59 AM | 0 (0.0%) | 0 (0.0%) |
| 9:00 AM to 9:59 AM | 0 (0.0%) | 0 (0.0%) |
| 10:00 AM to 10:59 AM | 13 (5.4%) | 13 (9.7%) |
| 11:00 AM to 11:59 AM | 0 (0.0%) | 0 (0.0%) |
| 12:00 PM to 3:59 PM | 0 (0.0%) | 0 (0.0%) |
| 4:00 PM to 11:59 PM | 16 (6.6%) | 0 (0.0%) |
| Total | 241 (100.0%) | 134 (100.0%) |
Housing Occupancy in Pinopolis
Occupancy by Ownership in Pinopolis
Of the total 462 dwellings in Pinopolis, owner-occupied units account for 446 (96.5%), while renter-occupied units make up 16 (3.5%).
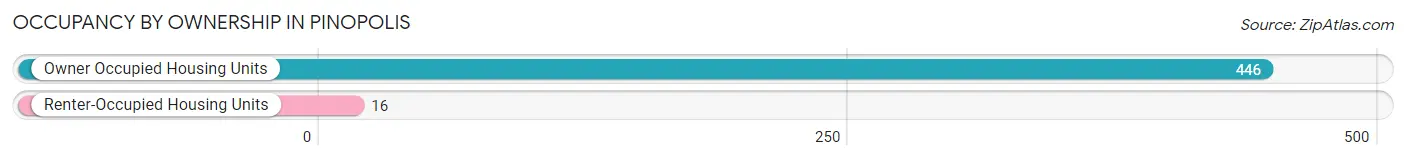
| Occupancy | # Housing Units | % Housing Units |
| Owner Occupied Housing Units | 446 | 96.5% |
| Renter-Occupied Housing Units | 16 | 3.5% |
| Total Occupied Housing Units | 462 | 100.0% |
Occupancy by Household Size in Pinopolis
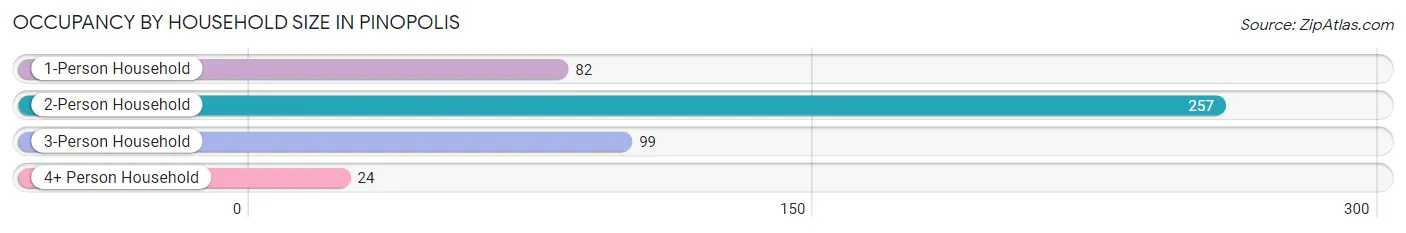
| Household Size | # Housing Units | % Housing Units |
| 1-Person Household | 82 | 17.7% |
| 2-Person Household | 257 | 55.6% |
| 3-Person Household | 99 | 21.4% |
| 4+ Person Household | 24 | 5.2% |
| Total Housing Units | 462 | 100.0% |
Occupancy by Ownership by Household Size in Pinopolis
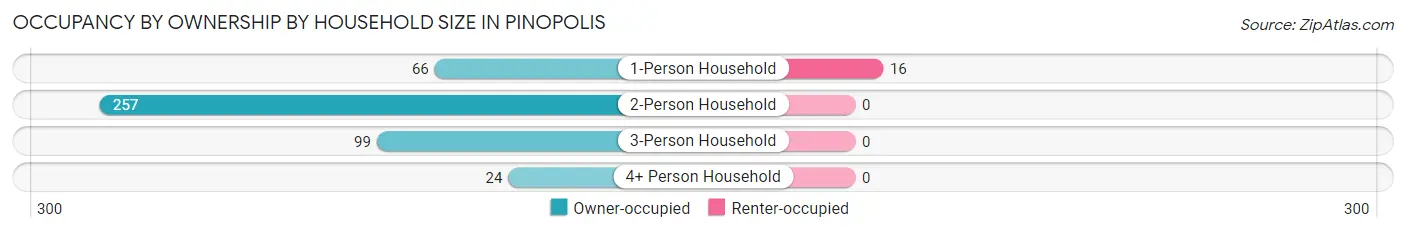
| Household Size | Owner-occupied | Renter-occupied |
| 1-Person Household | 66 (80.5%) | 16 (19.5%) |
| 2-Person Household | 257 (100.0%) | 0 (0.0%) |
| 3-Person Household | 99 (100.0%) | 0 (0.0%) |
| 4+ Person Household | 24 (100.0%) | 0 (0.0%) |
| Total Housing Units | 446 (96.5%) | 16 (3.5%) |
Occupancy by Educational Attainment in Pinopolis
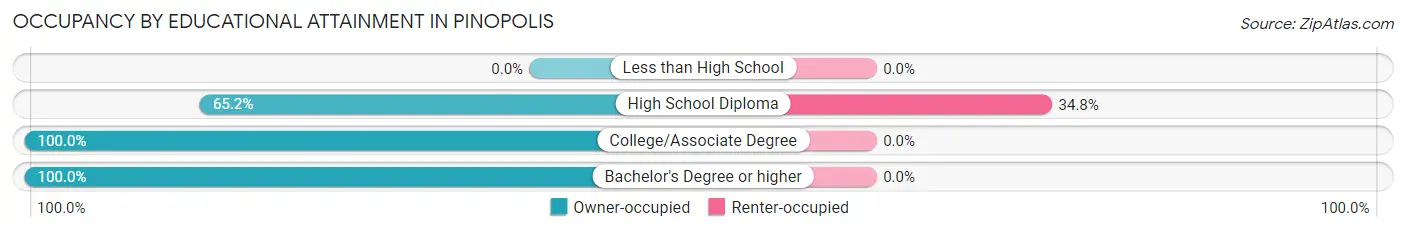
| Household Size | Owner-occupied | Renter-occupied |
| Less than High School | 0 (0.0%) | 0 (0.0%) |
| High School Diploma | 30 (65.2%) | 16 (34.8%) |
| College/Associate Degree | 193 (100.0%) | 0 (0.0%) |
| Bachelor's Degree or higher | 223 (100.0%) | 0 (0.0%) |
Occupancy by Age of Householder in Pinopolis
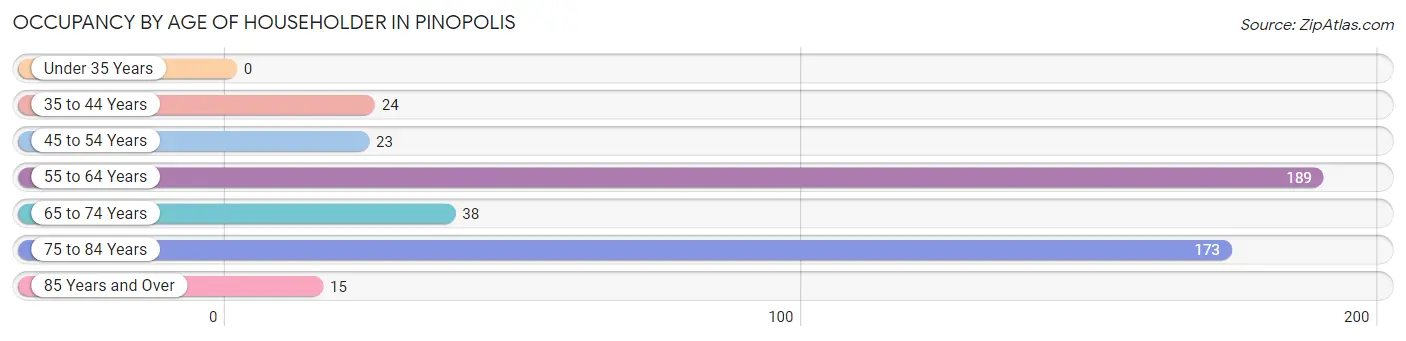
| Age Bracket | # Households | % Households |
| Under 35 Years | 0 | 0.0% |
| 35 to 44 Years | 24 | 5.2% |
| 45 to 54 Years | 23 | 5.0% |
| 55 to 64 Years | 189 | 40.9% |
| 65 to 74 Years | 38 | 8.2% |
| 75 to 84 Years | 173 | 37.4% |
| 85 Years and Over | 15 | 3.3% |
| Total | 462 | 100.0% |
Housing Finances in Pinopolis
Median Income by Occupancy in Pinopolis
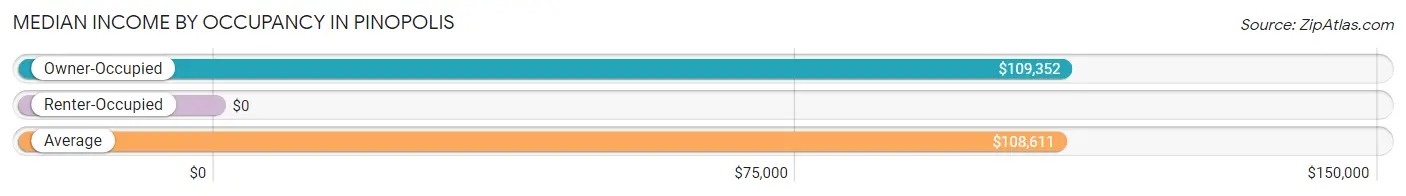
| Occupancy Type | # Households | Median Income |
| Owner-Occupied | 446 (96.5%) | $109,352 |
| Renter-Occupied | 16 (3.5%) | $0 |
| Average | 462 (100.0%) | $108,611 |
Occupancy by Householder Income Bracket in Pinopolis
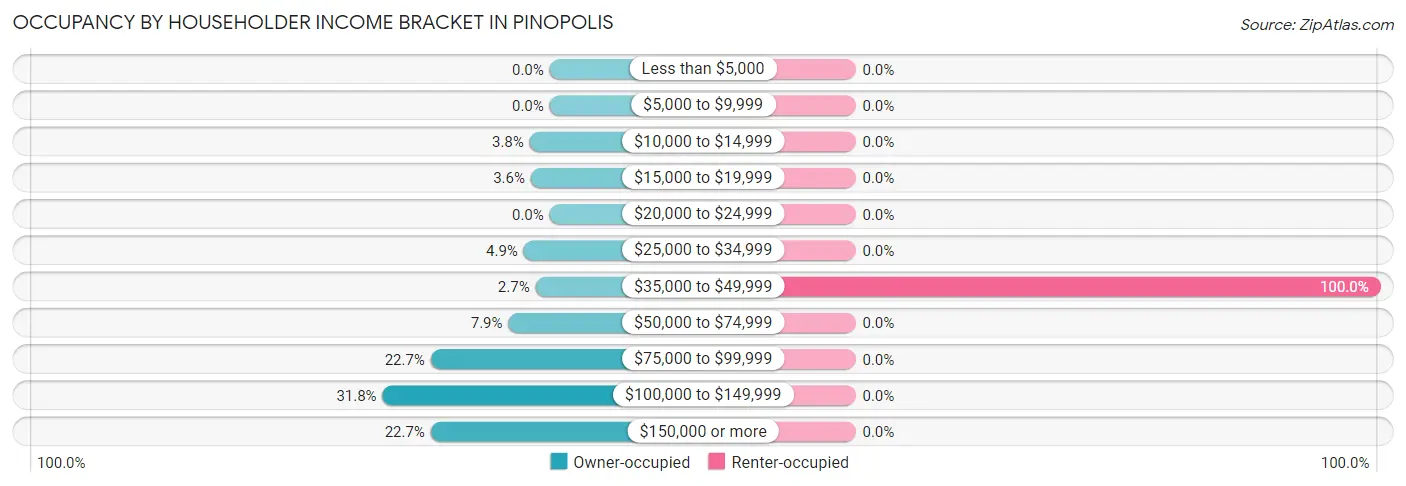
| Income Bracket | Owner-occupied | Renter-occupied |
| Less than $5,000 | 0 (0.0%) | 0 (0.0%) |
| $5,000 to $9,999 | 0 (0.0%) | 0 (0.0%) |
| $10,000 to $14,999 | 17 (3.8%) | 0 (0.0%) |
| $15,000 to $19,999 | 16 (3.6%) | 0 (0.0%) |
| $20,000 to $24,999 | 0 (0.0%) | 0 (0.0%) |
| $25,000 to $34,999 | 22 (4.9%) | 0 (0.0%) |
| $35,000 to $49,999 | 12 (2.7%) | 16 (100.0%) |
| $50,000 to $74,999 | 35 (7.9%) | 0 (0.0%) |
| $75,000 to $99,999 | 101 (22.7%) | 0 (0.0%) |
| $100,000 to $149,999 | 142 (31.8%) | 0 (0.0%) |
| $150,000 or more | 101 (22.7%) | 0 (0.0%) |
| Total | 446 (100.0%) | 16 (100.0%) |
Monthly Housing Cost Tiers in Pinopolis
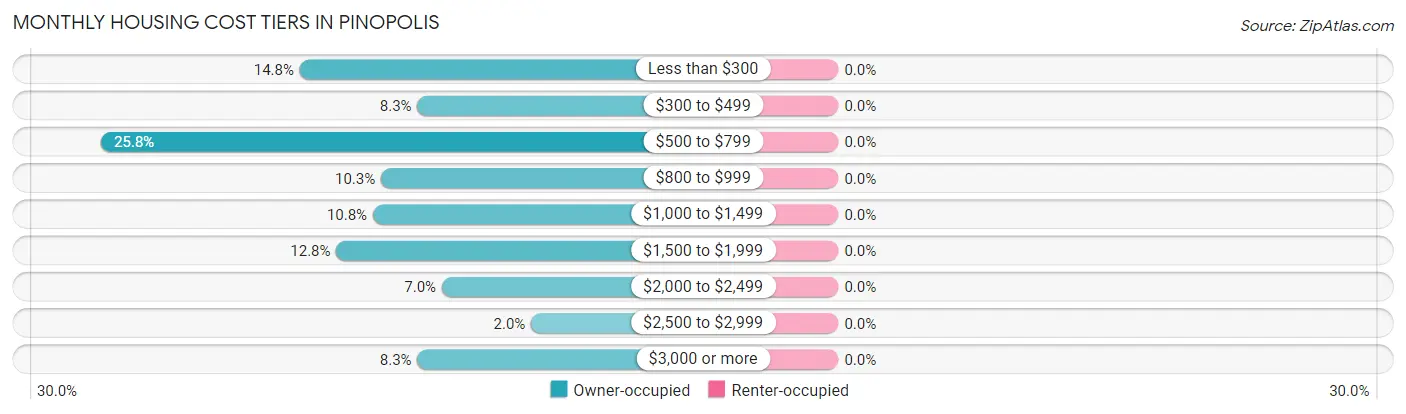
| Monthly Cost | Owner-occupied | Renter-occupied |
| Less than $300 | 66 (14.8%) | 0 (0.0%) |
| $300 to $499 | 37 (8.3%) | 0 (0.0%) |
| $500 to $799 | 115 (25.8%) | 0 (0.0%) |
| $800 to $999 | 46 (10.3%) | 0 (0.0%) |
| $1,000 to $1,499 | 48 (10.8%) | 0 (0.0%) |
| $1,500 to $1,999 | 57 (12.8%) | 0 (0.0%) |
| $2,000 to $2,499 | 31 (7.0%) | 0 (0.0%) |
| $2,500 to $2,999 | 9 (2.0%) | 0 (0.0%) |
| $3,000 or more | 37 (8.3%) | 0 (0.0%) |
| Total | 446 (100.0%) | 16 (100.0%) |
Physical Housing Characteristics in Pinopolis
Housing Structures in Pinopolis
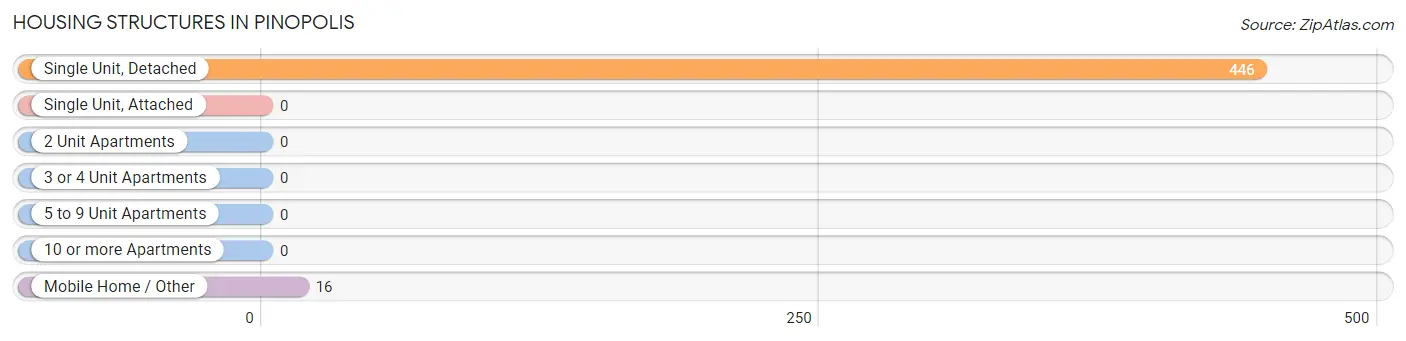
| Structure Type | # Housing Units | % Housing Units |
| Single Unit, Detached | 446 | 96.5% |
| Single Unit, Attached | 0 | 0.0% |
| 2 Unit Apartments | 0 | 0.0% |
| 3 or 4 Unit Apartments | 0 | 0.0% |
| 5 to 9 Unit Apartments | 0 | 0.0% |
| 10 or more Apartments | 0 | 0.0% |
| Mobile Home / Other | 16 | 3.5% |
| Total | 462 | 100.0% |
Housing Structures by Occupancy in Pinopolis
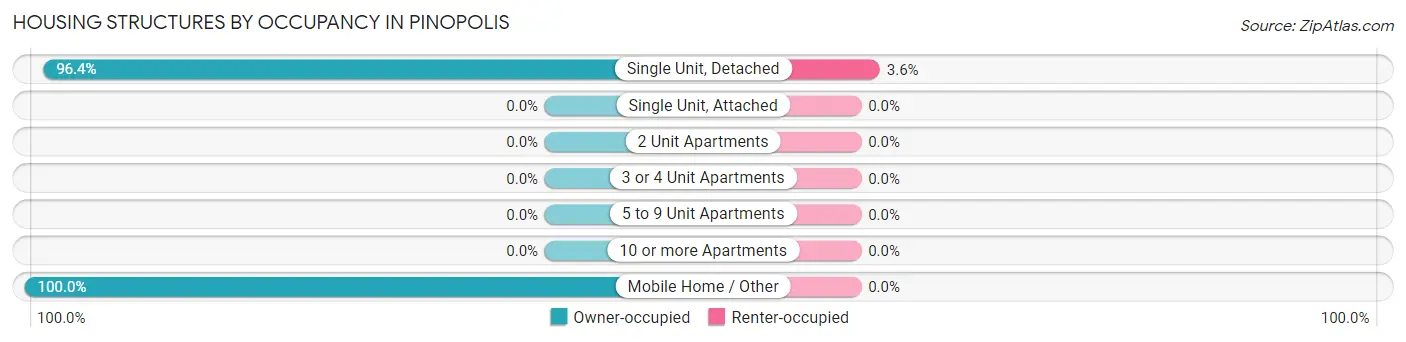
| Structure Type | Owner-occupied | Renter-occupied |
| Single Unit, Detached | 430 (96.4%) | 16 (3.6%) |
| Single Unit, Attached | 0 (0.0%) | 0 (0.0%) |
| 2 Unit Apartments | 0 (0.0%) | 0 (0.0%) |
| 3 or 4 Unit Apartments | 0 (0.0%) | 0 (0.0%) |
| 5 to 9 Unit Apartments | 0 (0.0%) | 0 (0.0%) |
| 10 or more Apartments | 0 (0.0%) | 0 (0.0%) |
| Mobile Home / Other | 16 (100.0%) | 0 (0.0%) |
| Total | 446 (96.5%) | 16 (3.5%) |
Housing Structures by Number of Rooms in Pinopolis
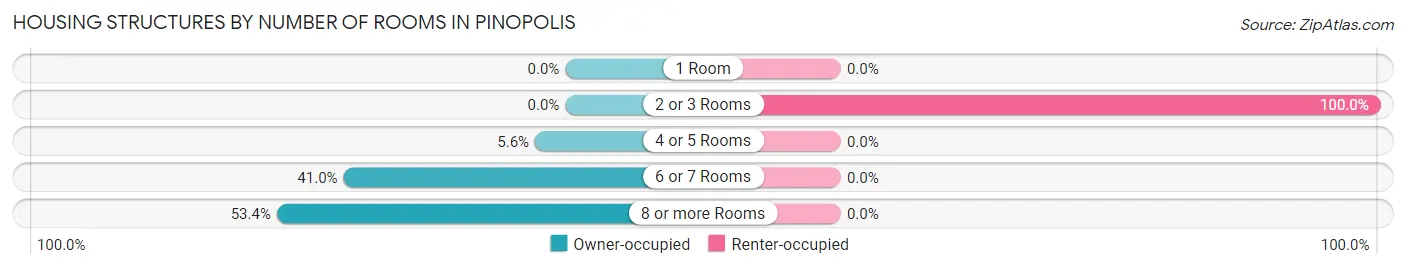
| Number of Rooms | Owner-occupied | Renter-occupied |
| 1 Room | 0 (0.0%) | 0 (0.0%) |
| 2 or 3 Rooms | 0 (0.0%) | 16 (100.0%) |
| 4 or 5 Rooms | 25 (5.6%) | 0 (0.0%) |
| 6 or 7 Rooms | 183 (41.0%) | 0 (0.0%) |
| 8 or more Rooms | 238 (53.4%) | 0 (0.0%) |
| Total | 446 (100.0%) | 16 (100.0%) |
Housing Structure by Heating Type in Pinopolis
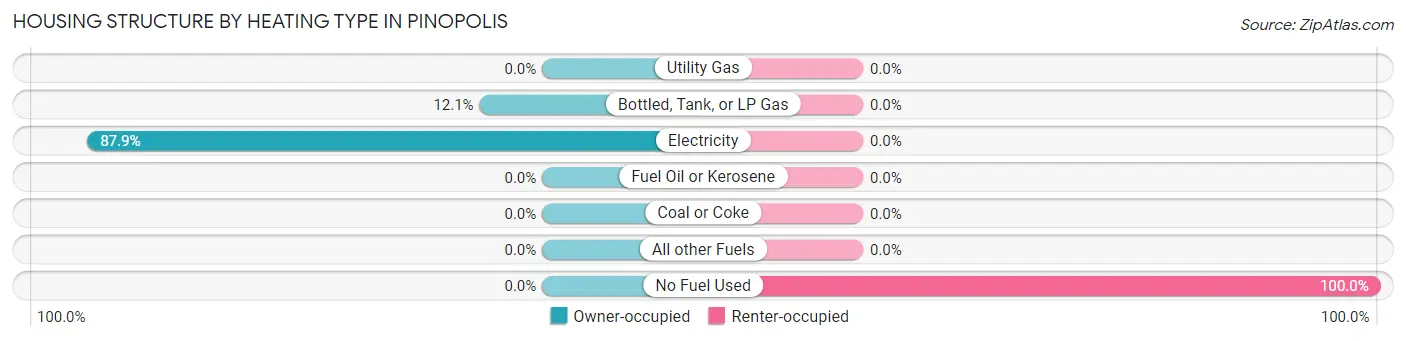
| Heating Type | Owner-occupied | Renter-occupied |
| Utility Gas | 0 (0.0%) | 0 (0.0%) |
| Bottled, Tank, or LP Gas | 54 (12.1%) | 0 (0.0%) |
| Electricity | 392 (87.9%) | 0 (0.0%) |
| Fuel Oil or Kerosene | 0 (0.0%) | 0 (0.0%) |
| Coal or Coke | 0 (0.0%) | 0 (0.0%) |
| All other Fuels | 0 (0.0%) | 0 (0.0%) |
| No Fuel Used | 0 (0.0%) | 16 (100.0%) |
| Total | 446 (100.0%) | 16 (100.0%) |
Household Vehicle Usage in Pinopolis
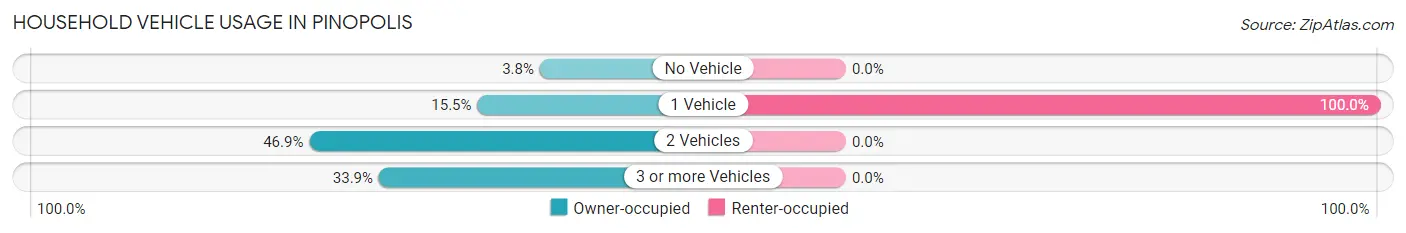
| Vehicles per Household | Owner-occupied | Renter-occupied |
| No Vehicle | 17 (3.8%) | 0 (0.0%) |
| 1 Vehicle | 69 (15.5%) | 16 (100.0%) |
| 2 Vehicles | 209 (46.9%) | 0 (0.0%) |
| 3 or more Vehicles | 151 (33.9%) | 0 (0.0%) |
| Total | 446 (100.0%) | 16 (100.0%) |
Real Estate & Mortgages in Pinopolis
Real Estate and Mortgage Overview in Pinopolis
| Characteristic | Without Mortgage | With Mortgage |
| Housing Units | 251 | 195 |
| Median Property Value | $316,200 | $359,300 |
| Median Household Income | $81,031 | $68 |
| Monthly Housing Costs | $533 | $37 |
| Real Estate Taxes | $1,852 | $0 |
Property Value by Mortgage Status in Pinopolis
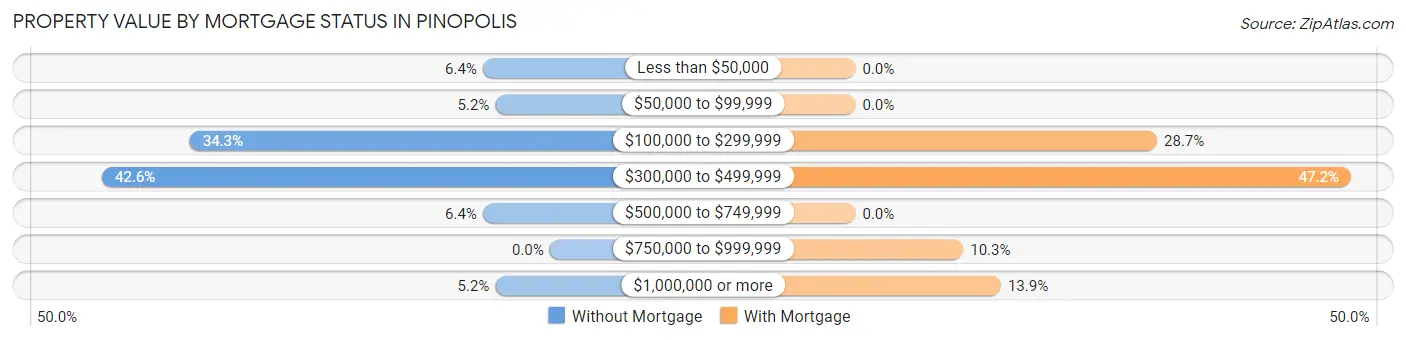
| Property Value | Without Mortgage | With Mortgage |
| Less than $50,000 | 16 (6.4%) | 0 (0.0%) |
| $50,000 to $99,999 | 13 (5.2%) | 0 (0.0%) |
| $100,000 to $299,999 | 86 (34.3%) | 56 (28.7%) |
| $300,000 to $499,999 | 107 (42.6%) | 92 (47.2%) |
| $500,000 to $749,999 | 16 (6.4%) | 0 (0.0%) |
| $750,000 to $999,999 | 0 (0.0%) | 20 (10.3%) |
| $1,000,000 or more | 13 (5.2%) | 27 (13.9%) |
| Total | 251 (100.0%) | 195 (100.0%) |
Household Income by Mortgage Status in Pinopolis
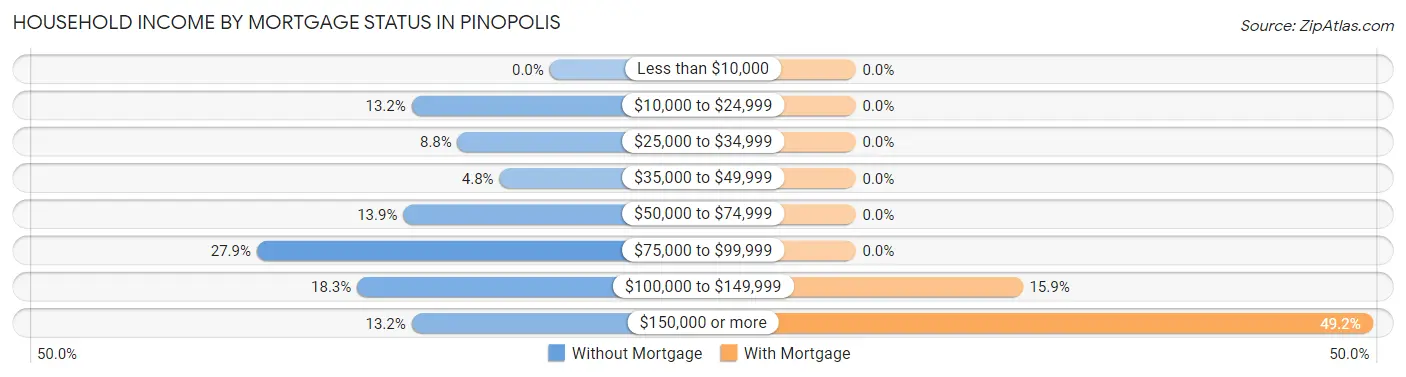
| Household Income | Without Mortgage | With Mortgage |
| Less than $10,000 | 0 (0.0%) | 0 (0.0%) |
| $10,000 to $24,999 | 33 (13.2%) | 0 (0.0%) |
| $25,000 to $34,999 | 22 (8.8%) | 0 (0.0%) |
| $35,000 to $49,999 | 12 (4.8%) | 0 (0.0%) |
| $50,000 to $74,999 | 35 (13.9%) | 0 (0.0%) |
| $75,000 to $99,999 | 70 (27.9%) | 0 (0.0%) |
| $100,000 to $149,999 | 46 (18.3%) | 31 (15.9%) |
| $150,000 or more | 33 (13.2%) | 96 (49.2%) |
| Total | 251 (100.0%) | 195 (100.0%) |
Property Value to Household Income Ratio in Pinopolis
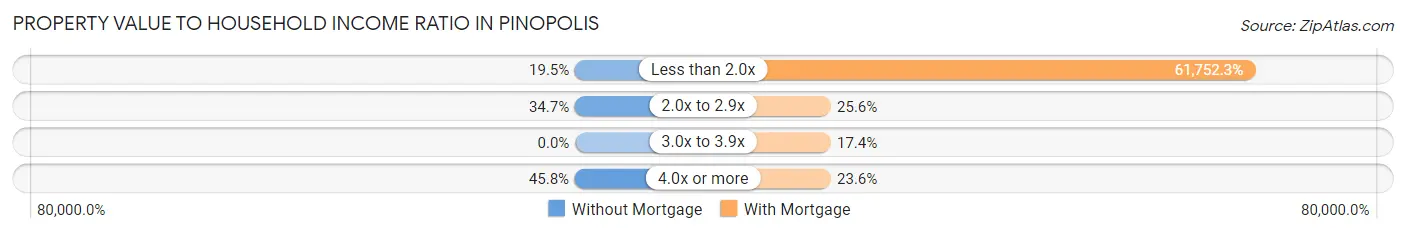
| Value-to-Income Ratio | Without Mortgage | With Mortgage |
| Less than 2.0x | 49 (19.5%) | 120,417 (61,752.3%) |
| 2.0x to 2.9x | 87 (34.7%) | 50 (25.6%) |
| 3.0x to 3.9x | 0 (0.0%) | 34 (17.4%) |
| 4.0x or more | 115 (45.8%) | 46 (23.6%) |
| Total | 251 (100.0%) | 195 (100.0%) |
Real Estate Taxes by Mortgage Status in Pinopolis
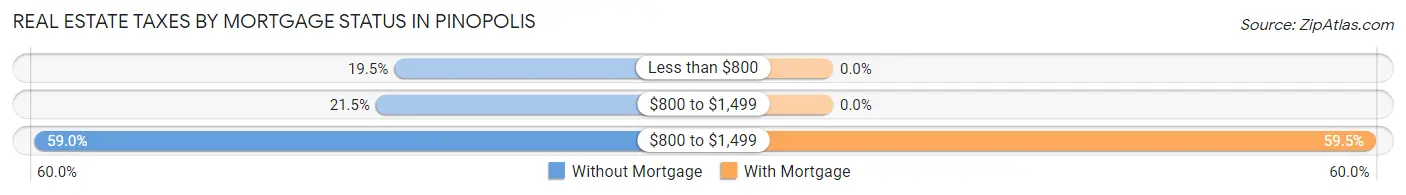
| Property Taxes | Without Mortgage | With Mortgage |
| Less than $800 | 49 (19.5%) | 0 (0.0%) |
| $800 to $1,499 | 54 (21.5%) | 0 (0.0%) |
| $800 to $1,499 | 148 (59.0%) | 116 (59.5%) |
| Total | 251 (100.0%) | 195 (100.0%) |
Health & Disability in Pinopolis
Health Insurance Coverage by Age in Pinopolis
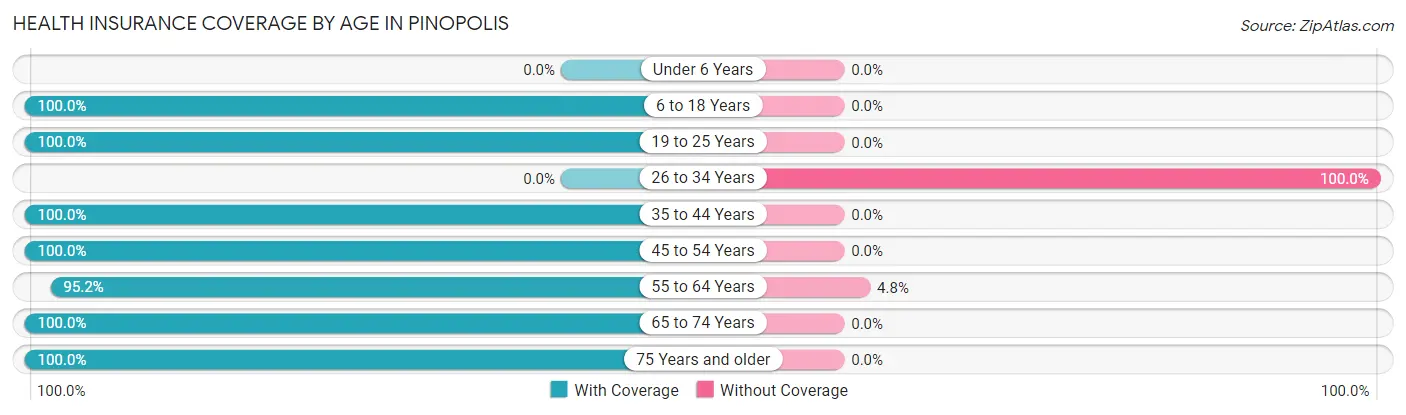
| Age Bracket | With Coverage | Without Coverage |
| Under 6 Years | 0 (0.0%) | 0 (0.0%) |
| 6 to 18 Years | 37 (100.0%) | 0 (0.0%) |
| 19 to 25 Years | 36 (100.0%) | 0 (0.0%) |
| 26 to 34 Years | 0 (0.0%) | 21 (100.0%) |
| 35 to 44 Years | 45 (100.0%) | 0 (0.0%) |
| 45 to 54 Years | 60 (100.0%) | 0 (0.0%) |
| 55 to 64 Years | 316 (95.2%) | 16 (4.8%) |
| 65 to 74 Years | 121 (100.0%) | 0 (0.0%) |
| 75 Years and older | 271 (100.0%) | 0 (0.0%) |
| Total | 886 (96.0%) | 37 (4.0%) |
Health Insurance Coverage by Citizenship Status in Pinopolis
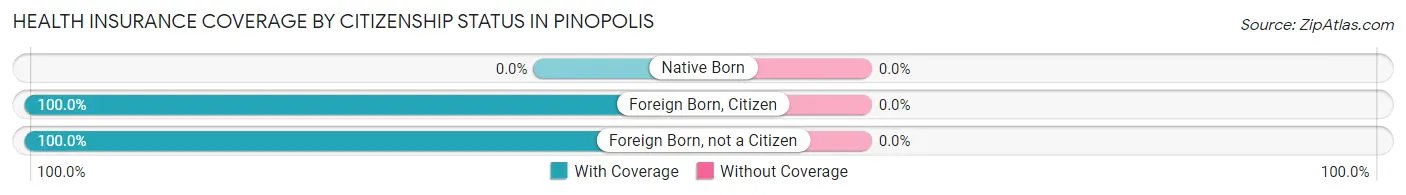
| Citizenship Status | With Coverage | Without Coverage |
| Native Born | 0 (0.0%) | 0 (0.0%) |
| Foreign Born, Citizen | 37 (100.0%) | 0 (0.0%) |
| Foreign Born, not a Citizen | 36 (100.0%) | 0 (0.0%) |
Health Insurance Coverage by Household Income in Pinopolis
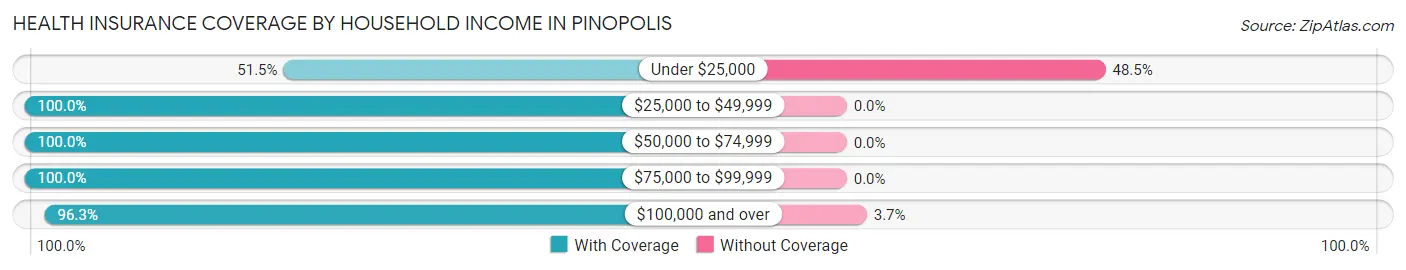
| Household Income | With Coverage | Without Coverage |
| Under $25,000 | 17 (51.5%) | 16 (48.5%) |
| $25,000 to $49,999 | 82 (100.0%) | 0 (0.0%) |
| $50,000 to $74,999 | 52 (100.0%) | 0 (0.0%) |
| $75,000 to $99,999 | 194 (100.0%) | 0 (0.0%) |
| $100,000 and over | 541 (96.3%) | 21 (3.7%) |
Public vs Private Health Insurance Coverage by Age in Pinopolis
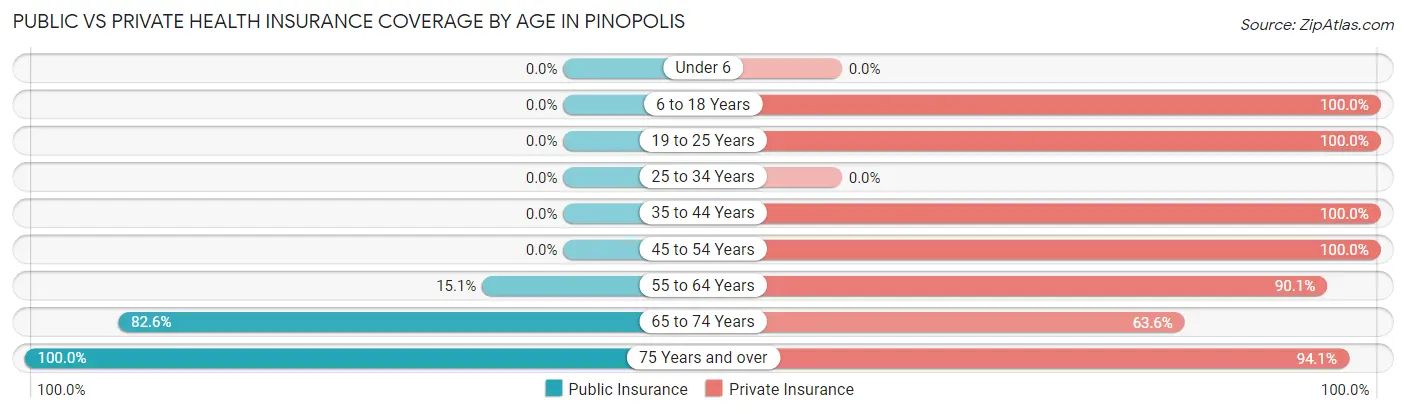
| Age Bracket | Public Insurance | Private Insurance |
| Under 6 | 0 (0.0%) | 0 (0.0%) |
| 6 to 18 Years | 0 (0.0%) | 37 (100.0%) |
| 19 to 25 Years | 0 (0.0%) | 36 (100.0%) |
| 25 to 34 Years | 0 (0.0%) | 0 (0.0%) |
| 35 to 44 Years | 0 (0.0%) | 45 (100.0%) |
| 45 to 54 Years | 0 (0.0%) | 60 (100.0%) |
| 55 to 64 Years | 50 (15.1%) | 299 (90.1%) |
| 65 to 74 Years | 100 (82.6%) | 77 (63.6%) |
| 75 Years and over | 271 (100.0%) | 255 (94.1%) |
| Total | 421 (45.6%) | 809 (87.6%) |
Disability Status by Sex by Age in Pinopolis
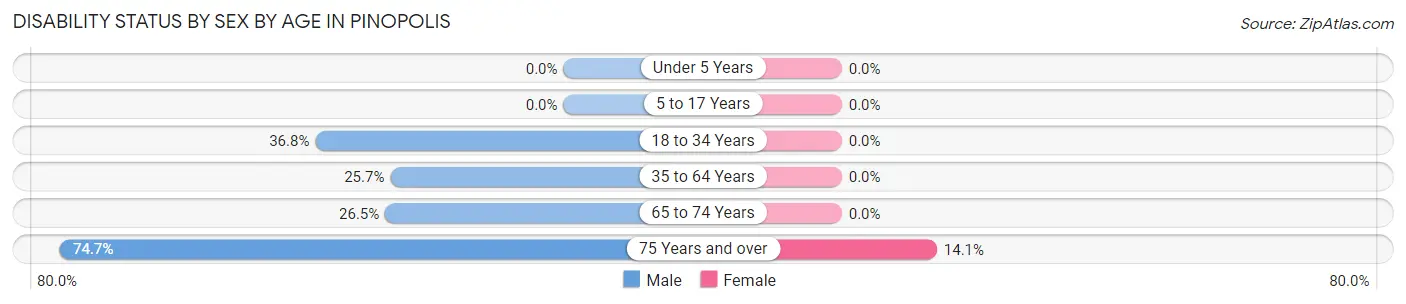
| Age Bracket | Male | Female |
| Under 5 Years | 0 (0.0%) | 0 (0.0%) |
| 5 to 17 Years | 0 (0.0%) | 0 (0.0%) |
| 18 to 34 Years | 21 (36.8%) | 0 (0.0%) |
| 35 to 64 Years | 63 (25.7%) | 0 (0.0%) |
| 65 to 74 Years | 18 (26.5%) | 0 (0.0%) |
| 75 Years and over | 139 (74.7%) | 12 (14.1%) |
Disability Class by Sex by Age in Pinopolis
Disability Class: Hearing Difficulty
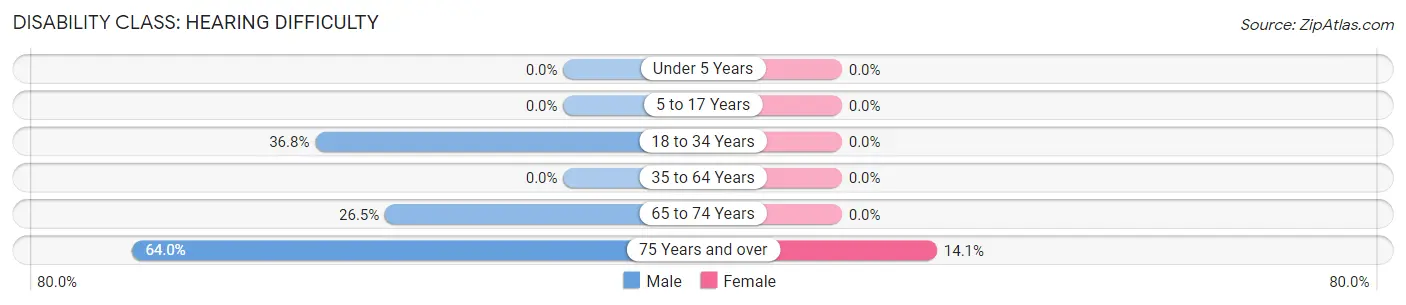
| Age Bracket | Male | Female |
| Under 5 Years | 0 (0.0%) | 0 (0.0%) |
| 5 to 17 Years | 0 (0.0%) | 0 (0.0%) |
| 18 to 34 Years | 21 (36.8%) | 0 (0.0%) |
| 35 to 64 Years | 0 (0.0%) | 0 (0.0%) |
| 65 to 74 Years | 18 (26.5%) | 0 (0.0%) |
| 75 Years and over | 119 (64.0%) | 12 (14.1%) |
Disability Class: Vision Difficulty
| Age Bracket | Male | Female |
| Under 5 Years | 0 (0.0%) | 0 (0.0%) |
| 5 to 17 Years | 0 (0.0%) | 0 (0.0%) |
| 18 to 34 Years | 0 (0.0%) | 0 (0.0%) |
| 35 to 64 Years | 0 (0.0%) | 0 (0.0%) |
| 65 to 74 Years | 0 (0.0%) | 0 (0.0%) |
| 75 Years and over | 0 (0.0%) | 0 (0.0%) |
Disability Class: Cognitive Difficulty
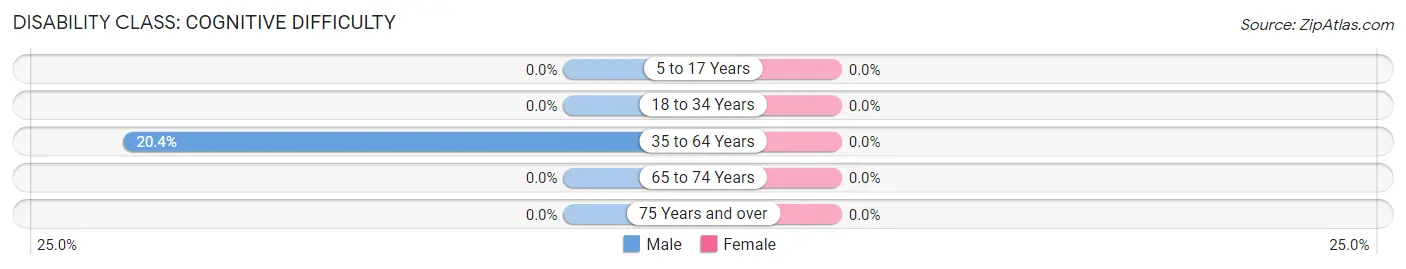
| Age Bracket | Male | Female |
| 5 to 17 Years | 0 (0.0%) | 0 (0.0%) |
| 18 to 34 Years | 0 (0.0%) | 0 (0.0%) |
| 35 to 64 Years | 50 (20.4%) | 0 (0.0%) |
| 65 to 74 Years | 0 (0.0%) | 0 (0.0%) |
| 75 Years and over | 0 (0.0%) | 0 (0.0%) |
Disability Class: Ambulatory Difficulty
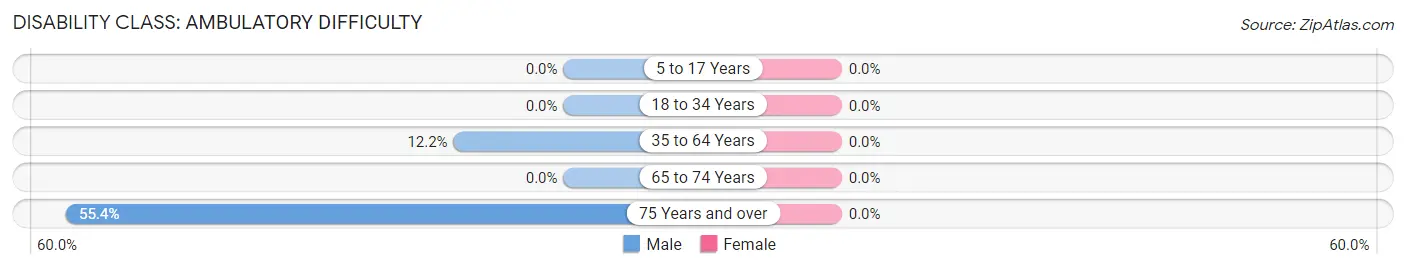
| Age Bracket | Male | Female |
| 5 to 17 Years | 0 (0.0%) | 0 (0.0%) |
| 18 to 34 Years | 0 (0.0%) | 0 (0.0%) |
| 35 to 64 Years | 30 (12.2%) | 0 (0.0%) |
| 65 to 74 Years | 0 (0.0%) | 0 (0.0%) |
| 75 Years and over | 103 (55.4%) | 0 (0.0%) |
Disability Class: Self-Care Difficulty
| Age Bracket | Male | Female |
| 5 to 17 Years | 0 (0.0%) | 0 (0.0%) |
| 18 to 34 Years | 0 (0.0%) | 0 (0.0%) |
| 35 to 64 Years | 0 (0.0%) | 0 (0.0%) |
| 65 to 74 Years | 0 (0.0%) | 0 (0.0%) |
| 75 Years and over | 0 (0.0%) | 0 (0.0%) |
Technology Access in Pinopolis
Computing Device Access in Pinopolis
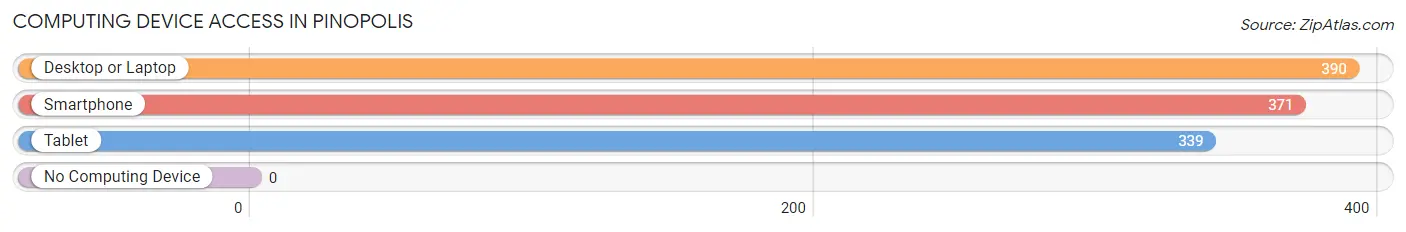
| Device Type | # Households | % Households |
| Desktop or Laptop | 390 | 84.4% |
| Smartphone | 371 | 80.3% |
| Tablet | 339 | 73.4% |
| No Computing Device | 0 | 0.0% |
| Total | 462 | 100.0% |
Internet Access in Pinopolis
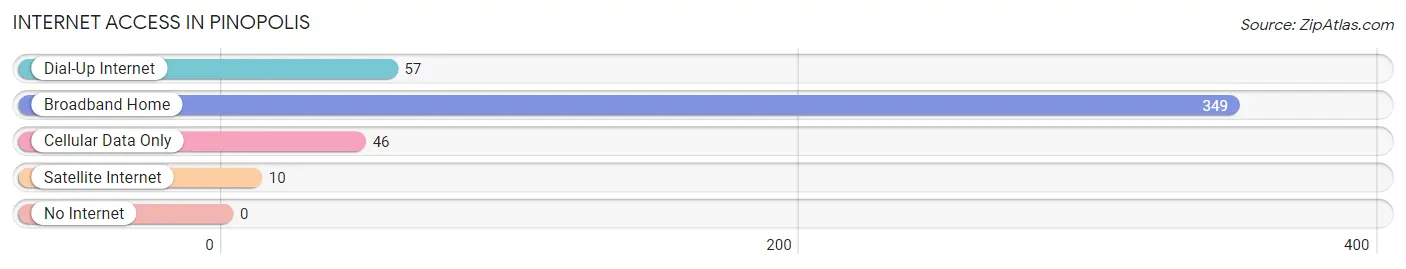
| Internet Type | # Households | % Households |
| Dial-Up Internet | 57 | 12.3% |
| Broadband Home | 349 | 75.5% |
| Cellular Data Only | 46 | 10.0% |
| Satellite Internet | 10 | 2.2% |
| No Internet | 0 | 0.0% |
| Total | 462 | 100.0% |
Pinopolis Summary
History
Pinopolis is a small town located in Berkeley County, South Carolina. It is situated on the banks of the Cooper River, and is part of the Charleston metropolitan area. The town was founded in 1732 by French Huguenots, who named it after the pine trees that grew in the area. The town was originally known as Pinopolis-on-the-Cooper, and was a thriving port town in the early 19th century. The town was home to a number of plantations, and was a major producer of rice and indigo.
In the late 19th century, Pinopolis began to decline as the plantations were abandoned and the port was no longer used. The town was eventually incorporated in 1891, and the population began to grow again. The town was home to a number of businesses, including a sawmill, a gristmill, and a cotton gin.
In the early 20th century, Pinopolis was a popular tourist destination, and the town was home to a number of resorts and hotels. The town was also home to a number of churches, and was a popular destination for religious retreats.
In the late 20th century, Pinopolis began to decline again, as the population began to move away from the area. The town was eventually annexed by the City of Moncks Corner in 2000, and is now part of the larger metropolitan area.
Geography
Pinopolis is located in Berkeley County, South Carolina, and is situated on the banks of the Cooper River. The town is located approximately 25 miles north of Charleston, and is part of the Charleston metropolitan area. The town is located in a rural area, and is surrounded by forests and wetlands. The town is located at an elevation of approximately 20 feet above sea level.
The climate in Pinopolis is humid subtropical, with hot, humid summers and mild winters. The average annual temperature is around 70 degrees Fahrenheit, and the average annual precipitation is around 50 inches.
Economy
The economy of Pinopolis is largely based on tourism and agriculture. The town is home to a number of resorts and hotels, and is a popular destination for religious retreats. The town is also home to a number of farms, and is a major producer of rice and indigo.
The town is also home to a number of businesses, including a sawmill, a gristmill, and a cotton gin. The town is also home to a number of retail stores, restaurants, and other businesses.
Demographics
As of the 2010 census, the population of Pinopolis was 1,845. The racial makeup of the town was 79.3% White, 17.2% African American, 0.7% Native American, 0.3% Asian, 0.1% Pacific Islander, and 2.4% from other races. The median household income was $37,917, and the median family income was $45,625. The per capita income was $19,945.
The town is home to a number of churches, and is a popular destination for religious retreats. The town is also home to a number of schools, including Pinopolis Elementary School, Pinopolis Middle School, and Pinopolis High School.
Common Questions
What is Per Capita Income in Pinopolis?
Per Capita income in Pinopolis is $61,326.
What is the Median Family Income in Pinopolis?
Median Family Income in Pinopolis is $116,204.
What is the Median Household income in Pinopolis?
Median Household Income in Pinopolis is $108,611.
What is Income or Wage Gap in Pinopolis?
Income or Wage Gap in Pinopolis is 0.8%.
Women in Pinopolis earn 99.2 cents for every dollar earned by a man.
What is Inequality or Gini Index in Pinopolis?
Inequality or Gini Index in Pinopolis is 0.38.
What is the Total Population of Pinopolis?
Total Population of Pinopolis is 933.
What is the Total Male Population of Pinopolis?
Total Male Population of Pinopolis is 581.
What is the Total Female Population of Pinopolis?
Total Female Population of Pinopolis is 352.
What is the Ratio of Males per 100 Females in Pinopolis?
There are 165.06 Males per 100 Females in Pinopolis.
What is the Ratio of Females per 100 Males in Pinopolis?
There are 60.59 Females per 100 Males in Pinopolis.
What is the Median Population Age in Pinopolis?
Median Population Age in Pinopolis is 61.5 Years.
What is the Average Family Size in Pinopolis
Average Family Size in Pinopolis is 2.2 People.
What is the Average Household Size in Pinopolis
Average Household Size in Pinopolis is 2.0 People.
How Large is the Labor Force in Pinopolis?
There are 385 People in the Labor Forcein in Pinopolis.
What is the Percentage of People in the Labor Force in Pinopolis?
41.3% of People are in the Labor Force in Pinopolis.