Zip Codes with the Highest Percentage of Population Employed in Legal Services & Support in Darlington, SC
RELATED REPORTS & OPTIONS
Legal Services & Support
Darlington
Compare Zip Codes
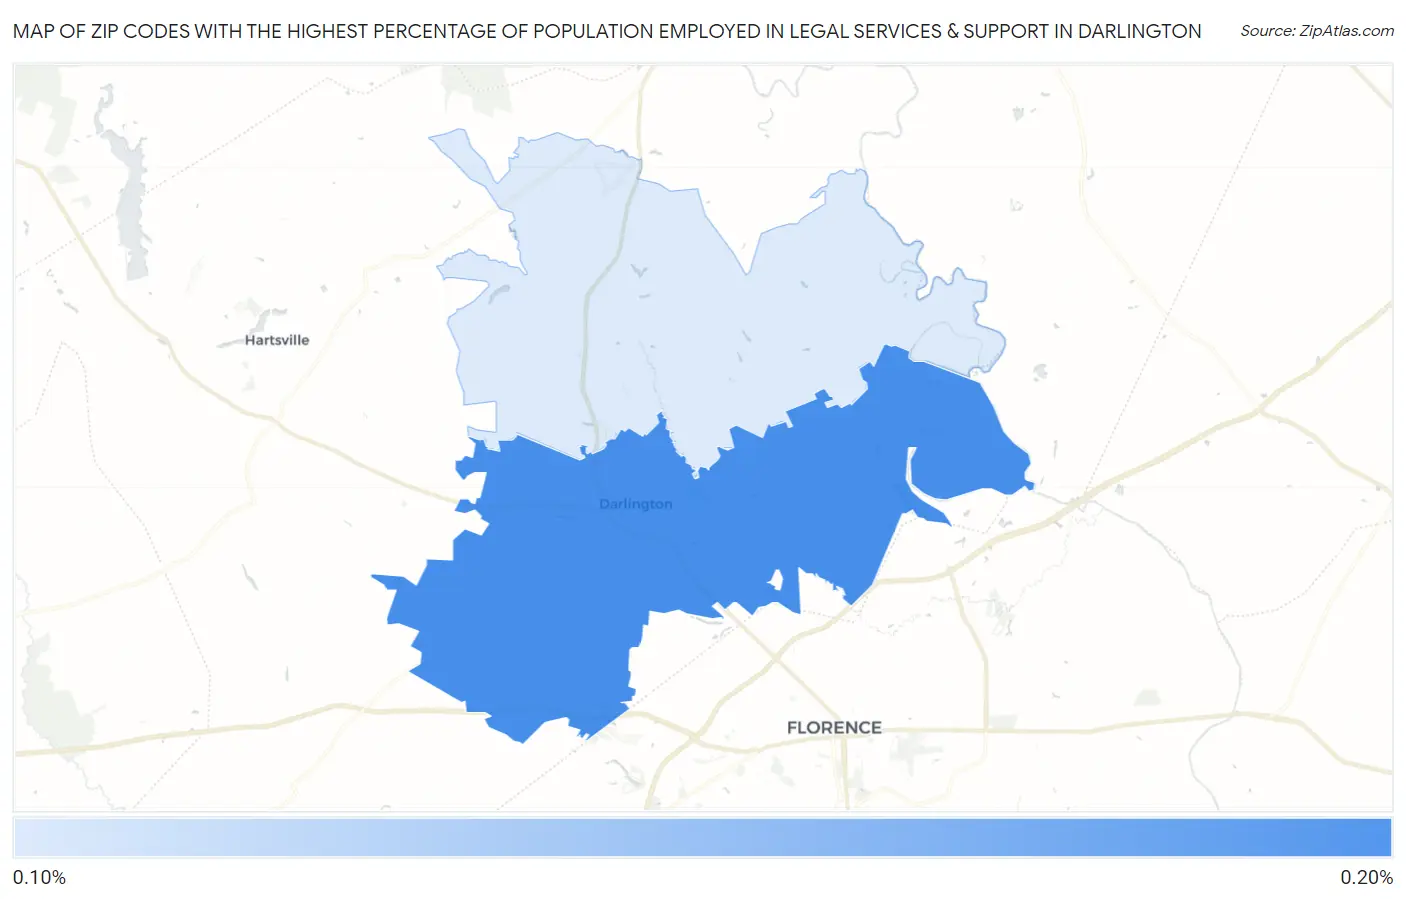
Map of Zip Codes with the Highest Percentage of Population Employed in Legal Services & Support in Darlington
0.12%
0.19%
Zip Codes with the Highest Percentage of Population Employed in Legal Services & Support in Darlington, SC
| Zip Code | % Employed | vs State | vs National | |
| 1. | 29532 | 0.19% | 0.97%(-0.784)#215 | 1.2%(-0.993)#16,297 |
| 2. | 29540 | 0.12% | 0.97%(-0.850)#223 | 1.2%(-1.06)#16,918 |
1
Common Questions
What are the Top Zip Codes with the Highest Percentage of Population Employed in Legal Services & Support in Darlington, SC?
Top Zip Codes with the Highest Percentage of Population Employed in Legal Services & Support in Darlington, SC are:
What zip code has the Highest Percentage of Population Employed in Legal Services & Support in Darlington, SC?
29532 has the Highest Percentage of Population Employed in Legal Services & Support in Darlington, SC with 0.19%.
What is the Percentage of Population Employed in Legal Services & Support in Darlington, SC?
Percentage of Population Employed in Legal Services & Support in Darlington is 0.14%.
What is the Percentage of Population Employed in Legal Services & Support in South Carolina?
Percentage of Population Employed in Legal Services & Support in South Carolina is 0.97%.
What is the Percentage of Population Employed in Legal Services & Support in the United States?
Percentage of Population Employed in Legal Services & Support in the United States is 1.2%.