Zip Codes with the Highest Percentage of Population Employed in Legal Services & Support in Simpsonville, SC
RELATED REPORTS & OPTIONS
Legal Services & Support
Simpsonville
Compare Zip Codes
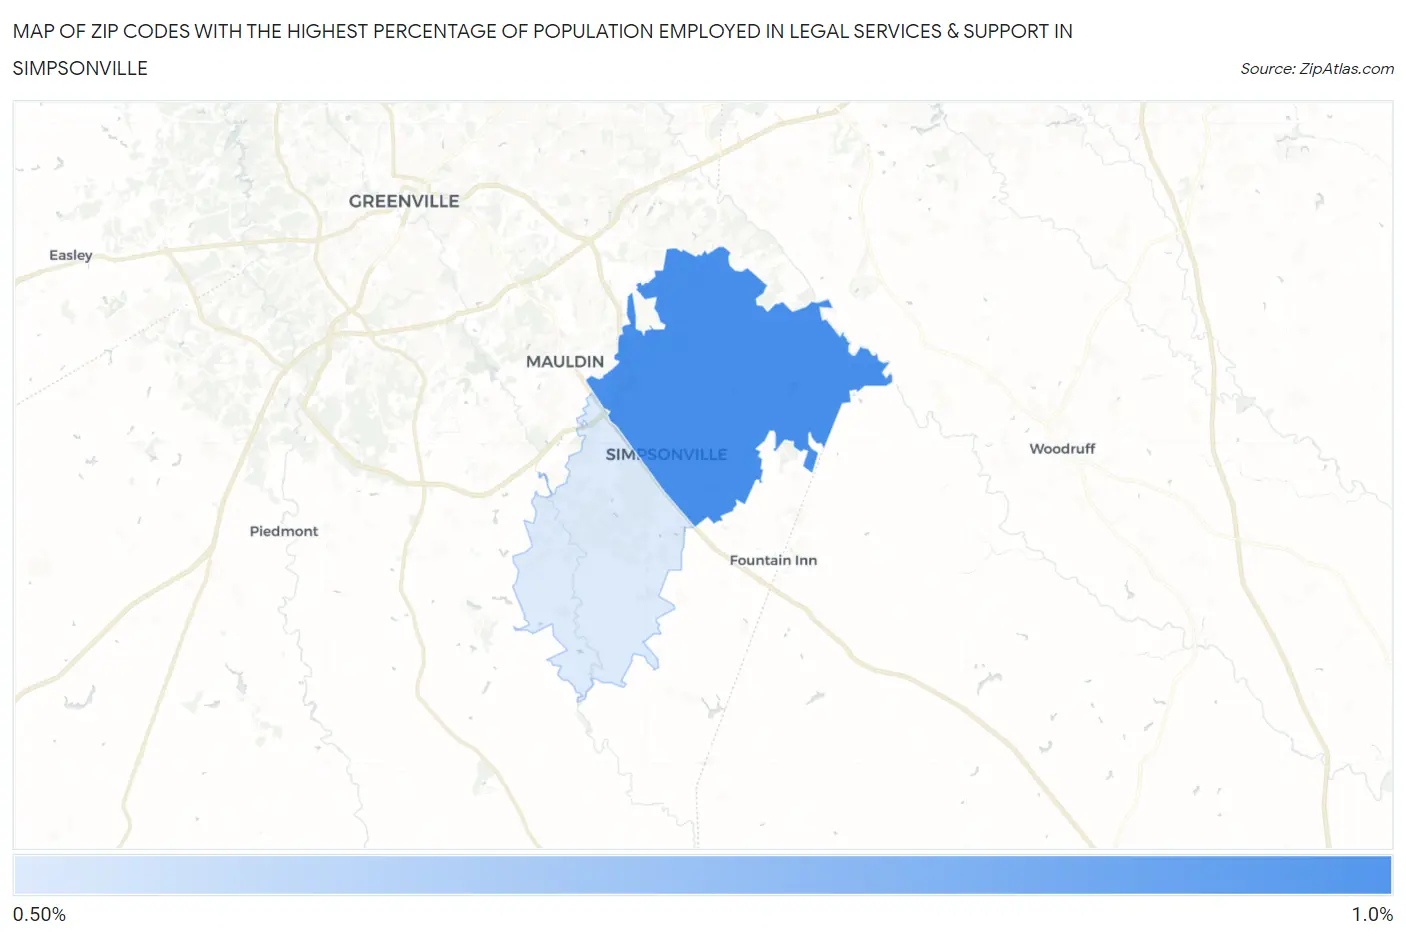
Map of Zip Codes with the Highest Percentage of Population Employed in Legal Services & Support in Simpsonville
0.53%
0.94%
Zip Codes with the Highest Percentage of Population Employed in Legal Services & Support in Simpsonville, SC
| Zip Code | % Employed | vs State | vs National | |
| 1. | 29681 | 0.94% | 0.97%(-0.034)#96 | 1.2%(-0.243)#8,270 |
| 2. | 29680 | 0.53% | 0.97%(-0.442)#146 | 1.2%(-0.652)#12,236 |
1
Common Questions
What are the Top Zip Codes with the Highest Percentage of Population Employed in Legal Services & Support in Simpsonville, SC?
Top Zip Codes with the Highest Percentage of Population Employed in Legal Services & Support in Simpsonville, SC are:
What zip code has the Highest Percentage of Population Employed in Legal Services & Support in Simpsonville, SC?
29681 has the Highest Percentage of Population Employed in Legal Services & Support in Simpsonville, SC with 0.94%.
What is the Percentage of Population Employed in Legal Services & Support in Simpsonville, SC?
Percentage of Population Employed in Legal Services & Support in Simpsonville is 0.71%.
What is the Percentage of Population Employed in Legal Services & Support in South Carolina?
Percentage of Population Employed in Legal Services & Support in South Carolina is 0.97%.
What is the Percentage of Population Employed in Legal Services & Support in the United States?
Percentage of Population Employed in Legal Services & Support in the United States is 1.2%.