Walhalla, SC Map & Demographics
Walhalla Map
Walhalla Overview
$18,566
PER CAPITA INCOME
$45,083
AVG FAMILY INCOME
$40,176
AVG HOUSEHOLD INCOME
44.7%
WAGE / INCOME GAP [ % ]
55.3¢/ $1
WAGE / INCOME GAP [ $ ]
$7,034
FAMILY INCOME DEFICIT
0.41
INEQUALITY / GINI INDEX
4,102
TOTAL POPULATION
2,074
MALE POPULATION
2,028
FEMALE POPULATION
102.27
MALES / 100 FEMALES
97.78
FEMALES / 100 MALES
44.0
MEDIAN AGE
3.0
AVG FAMILY SIZE
2.5
AVG HOUSEHOLD SIZE
1,629
LABOR FORCE [ PEOPLE ]
46.2%
PERCENT IN LABOR FORCE
9.3%
UNEMPLOYMENT RATE
Walhalla Zip Codes
Walhalla Area Codes
Income in Walhalla
Income Overview in Walhalla
Per Capita Income in Walhalla is $18,566, while median incomes of families and households are $45,083 and $40,176 respectively.
| Characteristic | Number | Measure |
| Per Capita Income | 4,102 | $18,566 |
| Median Family Income | 1,155 | $45,083 |
| Mean Family Income | 1,155 | $55,075 |
| Median Household Income | 1,572 | $40,176 |
| Mean Household Income | 1,572 | $46,235 |
| Income Deficit | 1,155 | $7,034 |
| Wage / Income Gap (%) | 4,102 | 44.67% |
| Wage / Income Gap ($) | 4,102 | 55.33¢ per $1 |
| Gini / Inequality Index | 4,102 | 0.41 |
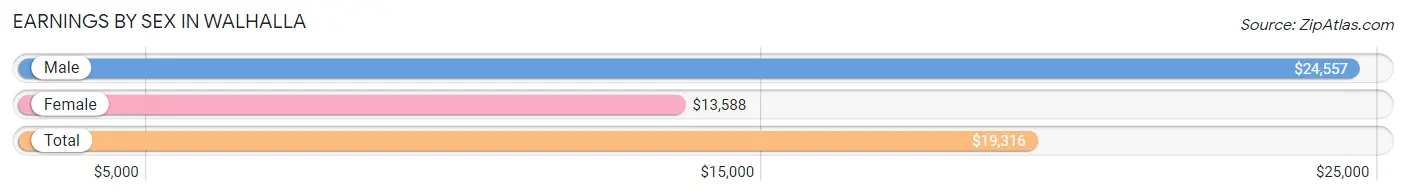
Earnings by Sex in Walhalla
Average Earnings in Walhalla are $19,316, $24,557 for men and $13,588 for women, a difference of 44.7%.
| Sex | Number | Average Earnings |
| Male | 994 (54.0%) | $24,557 |
| Female | 847 (46.0%) | $13,588 |
| Total | 1,841 (100.0%) | $19,316 |
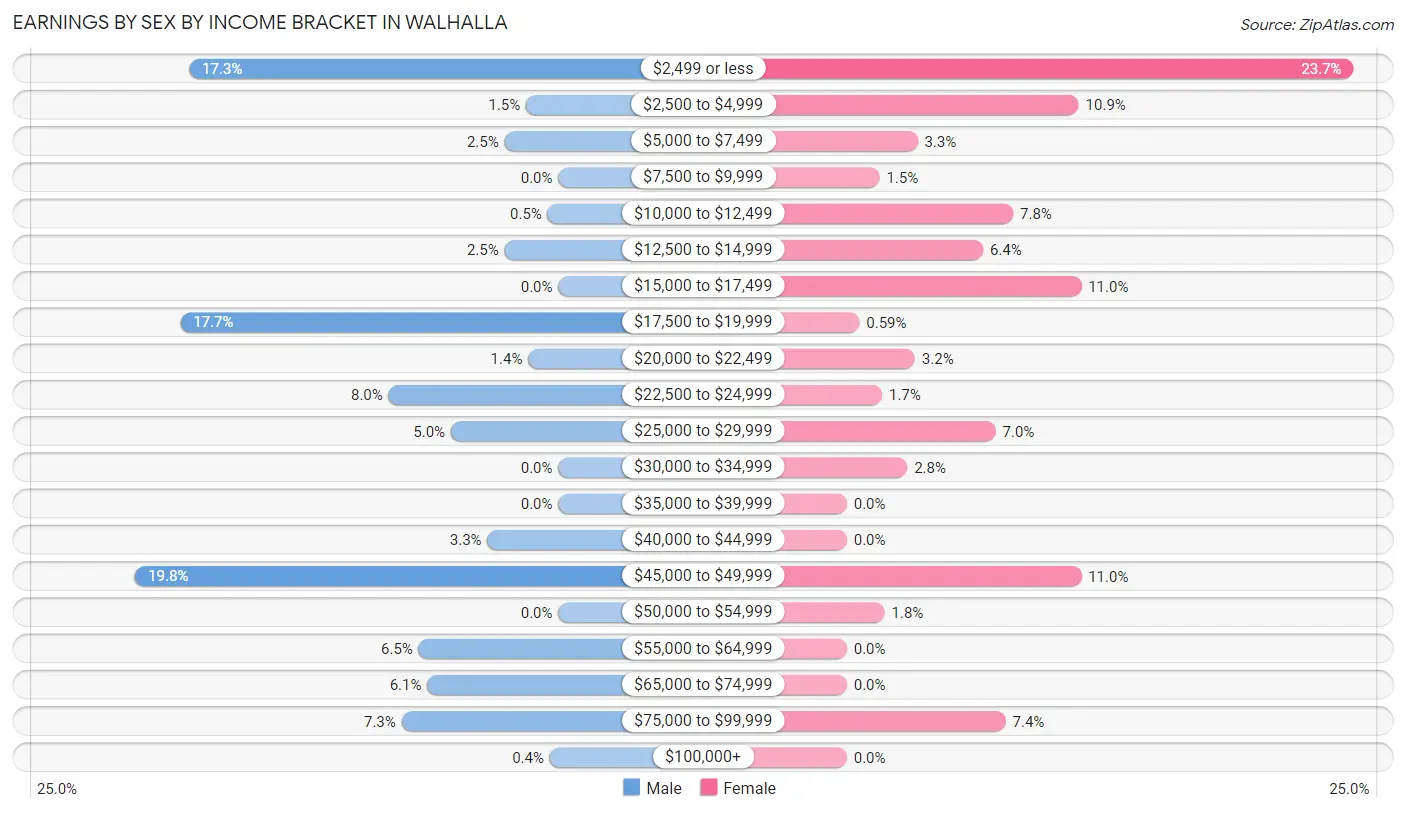
Earnings by Sex by Income Bracket in Walhalla
The most common earnings brackets in Walhalla are $45,000 to $49,999 for men (197 | 19.8%) and $2,499 or less for women (201 | 23.7%).
| Income | Male | Female |
| $2,499 or less | 172 (17.3%) | 201 (23.7%) |
| $2,500 to $4,999 | 15 (1.5%) | 92 (10.9%) |
| $5,000 to $7,499 | 25 (2.5%) | 28 (3.3%) |
| $7,500 to $9,999 | 0 (0.0%) | 13 (1.5%) |
| $10,000 to $12,499 | 5 (0.5%) | 66 (7.8%) |
| $12,500 to $14,999 | 25 (2.5%) | 54 (6.4%) |
| $15,000 to $17,499 | 0 (0.0%) | 93 (11.0%) |
| $17,500 to $19,999 | 176 (17.7%) | 5 (0.6%) |
| $20,000 to $22,499 | 14 (1.4%) | 27 (3.2%) |
| $22,500 to $24,999 | 79 (8.0%) | 14 (1.7%) |
| $25,000 to $29,999 | 50 (5.0%) | 59 (7.0%) |
| $30,000 to $34,999 | 0 (0.0%) | 24 (2.8%) |
| $35,000 to $39,999 | 0 (0.0%) | 0 (0.0%) |
| $40,000 to $44,999 | 33 (3.3%) | 0 (0.0%) |
| $45,000 to $49,999 | 197 (19.8%) | 93 (11.0%) |
| $50,000 to $54,999 | 0 (0.0%) | 15 (1.8%) |
| $55,000 to $64,999 | 65 (6.5%) | 0 (0.0%) |
| $65,000 to $74,999 | 61 (6.1%) | 0 (0.0%) |
| $75,000 to $99,999 | 73 (7.3%) | 63 (7.4%) |
| $100,000+ | 4 (0.4%) | 0 (0.0%) |
| Total | 994 (100.0%) | 847 (100.0%) |
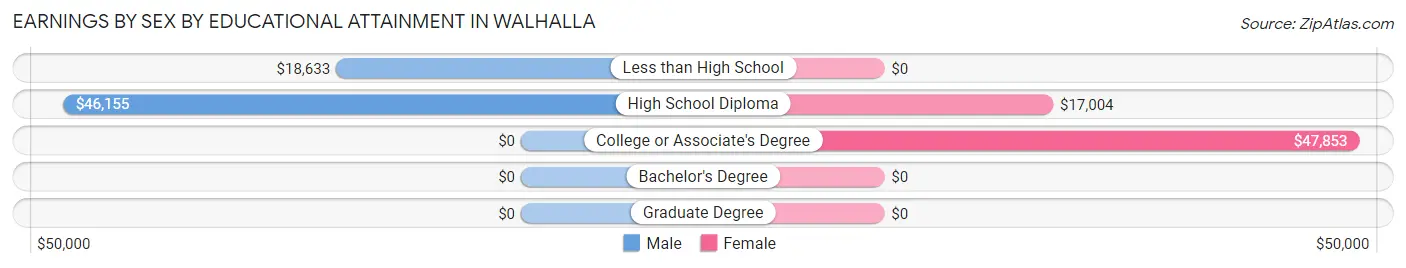
Earnings by Sex by Educational Attainment in Walhalla
Average earnings in Walhalla are $40,606 for men and $15,833 for women, a difference of 61.0%. Men with an educational attainment of high school diploma enjoy the highest average annual earnings of $46,155, while those with less than high school education earn the least with $18,633. Women with an educational attainment of college or associate's degree earn the most with the average annual earnings of $47,853, while those with high school diploma education have the smallest earnings of $17,004.
| Educational Attainment | Male Income | Female Income |
| Less than High School | $18,633 | $0 |
| High School Diploma | $46,155 | $17,004 |
| College or Associate's Degree | - | - |
| Bachelor's Degree | - | - |
| Graduate Degree | - | - |
| Total | $40,606 | $15,833 |
Family Income in Walhalla
Family Income Brackets in Walhalla
According to the Walhalla family income data, there are 293 families falling into the $35,000 to $49,999 income range, which is the most common income bracket and makes up 25.4% of all families.
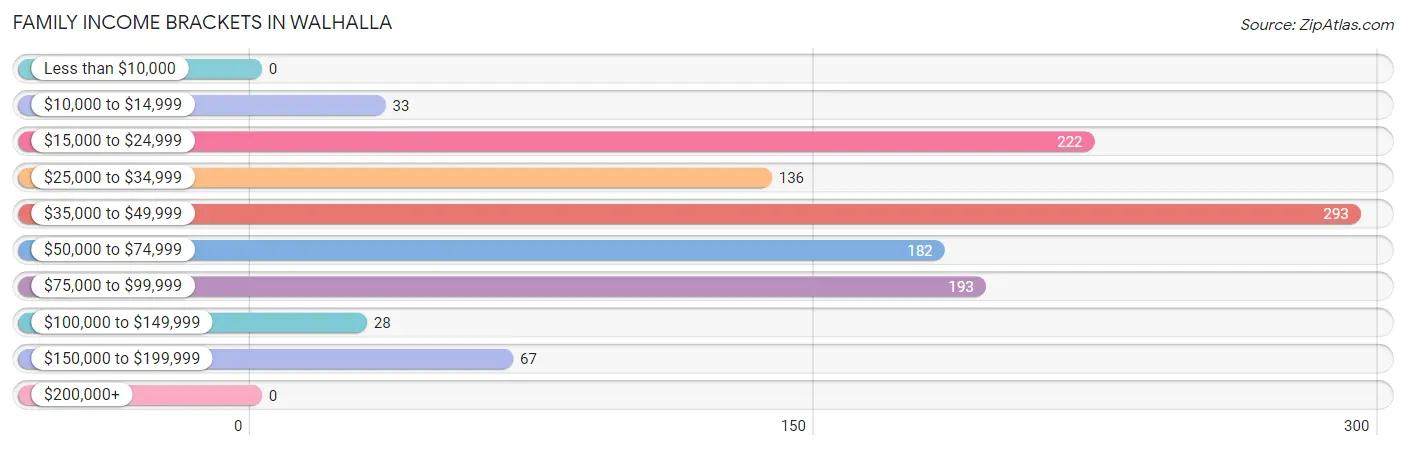
| Income Bracket | # Families | % Families |
| Less than $10,000 | 0 | 0.0% |
| $10,000 to $14,999 | 33 | 2.9% |
| $15,000 to $24,999 | 222 | 19.2% |
| $25,000 to $34,999 | 136 | 11.8% |
| $35,000 to $49,999 | 293 | 25.4% |
| $50,000 to $74,999 | 182 | 15.8% |
| $75,000 to $99,999 | 193 | 16.7% |
| $100,000 to $149,999 | 28 | 2.4% |
| $150,000 to $199,999 | 67 | 5.8% |
| $200,000+ | 0 | 0.0% |
Family Income by Famaliy Size in Walhalla
2-person families (676 | 58.5%) account for the highest median family income in Walhalla with $46,500 per family, while 2-person families (676 | 58.5%) have the highest median income of $23,250 per family member.
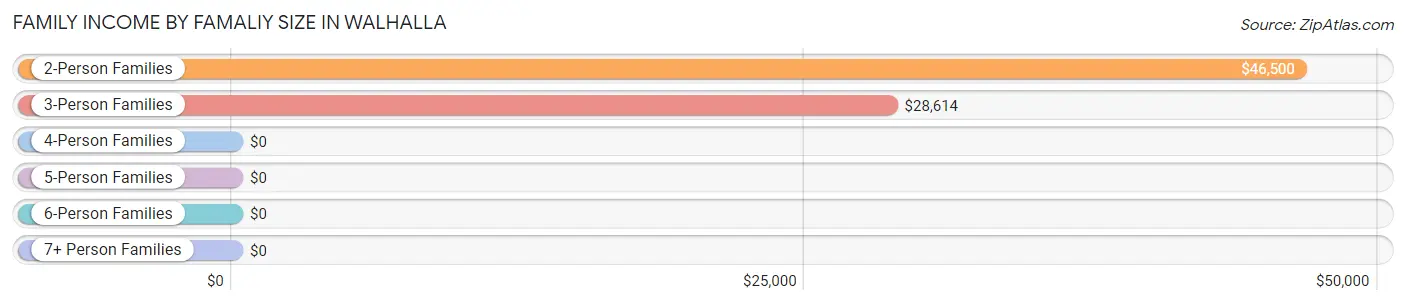
| Income Bracket | # Families | Median Income |
| 2-Person Families | 676 (58.5%) | $46,500 |
| 3-Person Families | 185 (16.0%) | $28,614 |
| 4-Person Families | 232 (20.1%) | $0 |
| 5-Person Families | 62 (5.4%) | $0 |
| 6-Person Families | 0 (0.0%) | $0 |
| 7+ Person Families | 0 (0.0%) | $0 |
| Total | 1,155 (100.0%) | $45,083 |
Family Income by Number of Earners in Walhalla
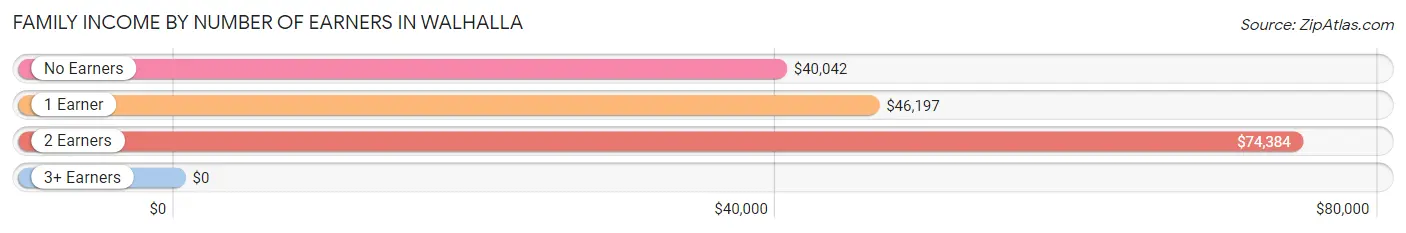
| Number of Earners | # Families | Median Income |
| No Earners | 354 (30.6%) | $40,042 |
| 1 Earner | 255 (22.1%) | $46,197 |
| 2 Earners | 447 (38.7%) | $74,384 |
| 3+ Earners | 99 (8.6%) | $0 |
| Total | 1,155 (100.0%) | $45,083 |
Household Income in Walhalla
Household Income Brackets in Walhalla
With 311 households falling in the category, the $15,000 to $24,999 income range is the most frequent in Walhalla, accounting for 19.8% of all households.
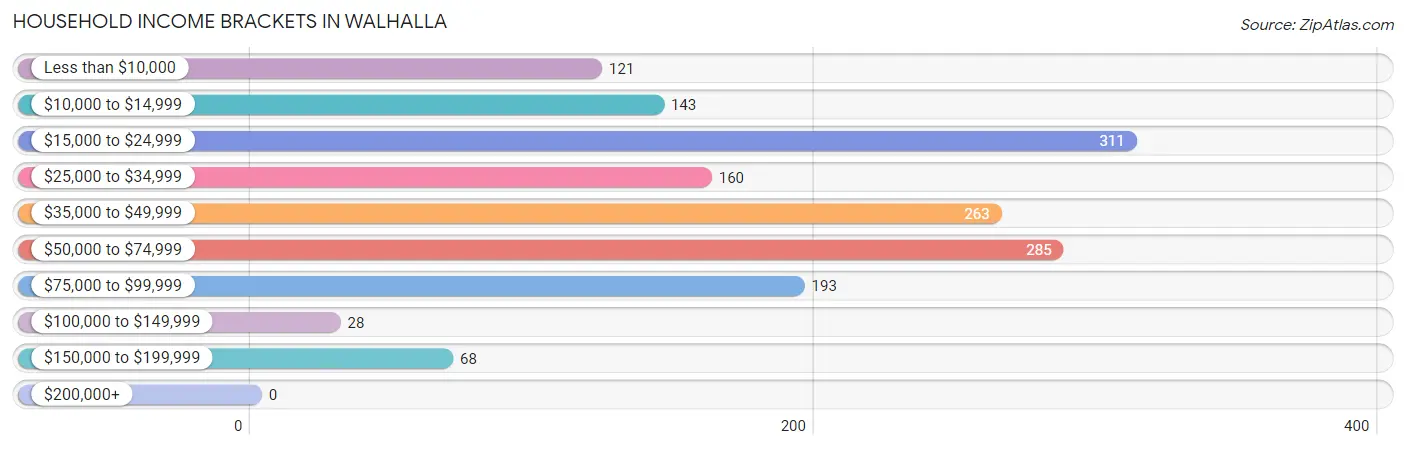
| Income Bracket | # Households | % Households |
| Less than $10,000 | 121 | 7.7% |
| $10,000 to $14,999 | 143 | 9.1% |
| $15,000 to $24,999 | 311 | 19.8% |
| $25,000 to $34,999 | 160 | 10.2% |
| $35,000 to $49,999 | 263 | 16.7% |
| $50,000 to $74,999 | 285 | 18.1% |
| $75,000 to $99,999 | 193 | 12.3% |
| $100,000 to $149,999 | 28 | 1.8% |
| $150,000 to $199,999 | 68 | 4.3% |
| $200,000+ | 0 | 0.0% |
Household Income by Householder Age in Walhalla
The median household income in Walhalla is $40,176, with the highest median household income of $78,571 found in the 25 to 44 years age bracket for the primary householder. A total of 458 households (29.1%) fall into this category. Meanwhile, the 15 to 24 years age bracket for the primary householder has the lowest median household income of $0, with 94 households (6.0%) in this group.
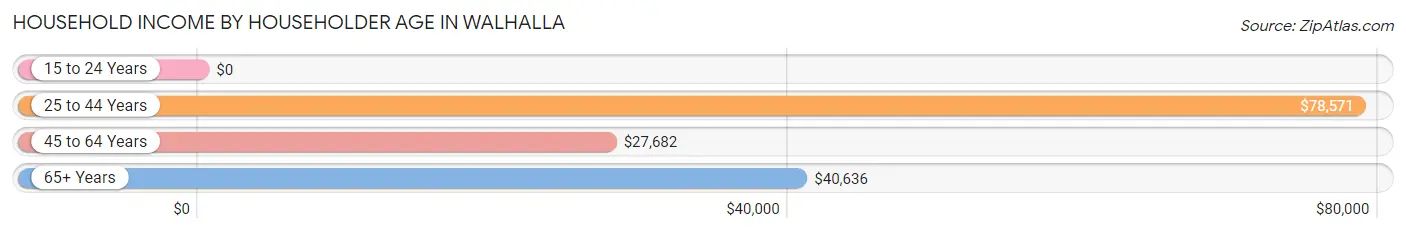
| Income Bracket | # Households | Median Income |
| 15 to 24 Years | 94 (6.0%) | $0 |
| 25 to 44 Years | 458 (29.1%) | $78,571 |
| 45 to 64 Years | 490 (31.2%) | $27,682 |
| 65+ Years | 530 (33.7%) | $40,636 |
| Total | 1,572 (100.0%) | $40,176 |
Poverty in Walhalla
Income Below Poverty by Sex and Age in Walhalla
With 30.2% poverty level for males and 36.7% for females among the residents of Walhalla, 12 to 14 year old males and 6 to 11 year old females are the most vulnerable to poverty, with 146 males (100.0%) and 39 females (100.0%) in their respective age groups living below the poverty level.
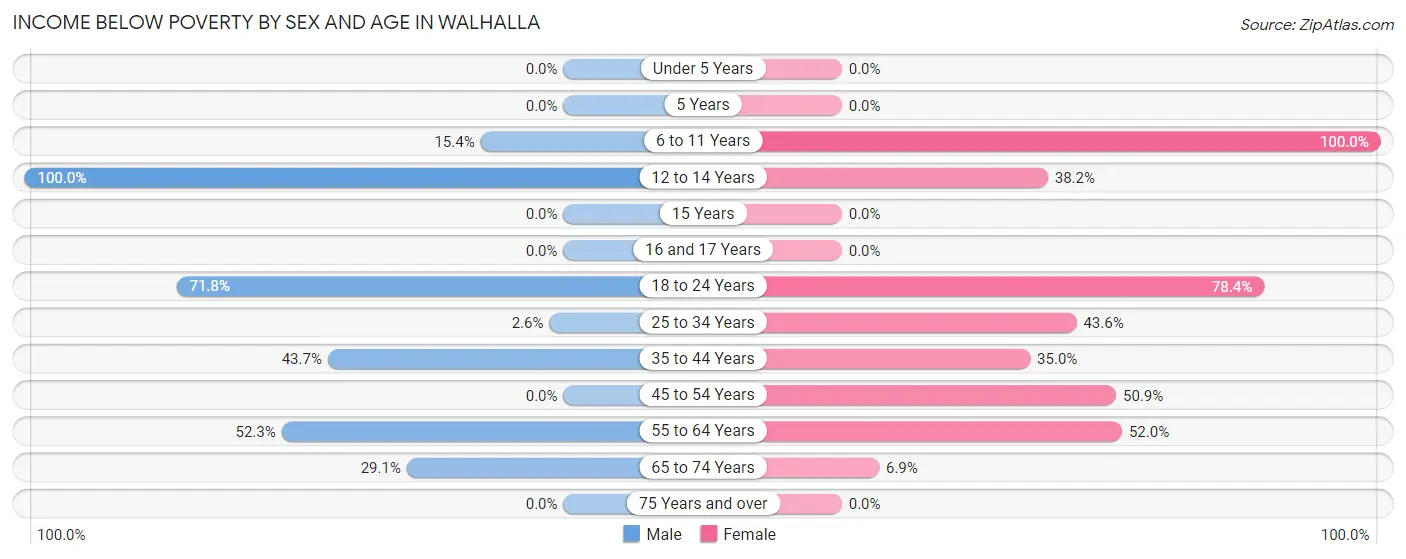
| Age Bracket | Male | Female |
| Under 5 Years | 0 (0.0%) | 0 (0.0%) |
| 5 Years | 0 (0.0%) | 0 (0.0%) |
| 6 to 11 Years | 20 (15.4%) | 39 (100.0%) |
| 12 to 14 Years | 146 (100.0%) | 39 (38.2%) |
| 15 Years | 0 (0.0%) | 0 (0.0%) |
| 16 and 17 Years | 0 (0.0%) | 0 (0.0%) |
| 18 to 24 Years | 112 (71.8%) | 134 (78.4%) |
| 25 to 34 Years | 10 (2.6%) | 88 (43.6%) |
| 35 to 44 Years | 171 (43.7%) | 86 (35.0%) |
| 45 to 54 Years | 0 (0.0%) | 170 (50.9%) |
| 55 to 64 Years | 34 (52.3%) | 168 (52.0%) |
| 65 to 74 Years | 91 (29.1%) | 17 (6.9%) |
| 75 Years and over | 0 (0.0%) | 0 (0.0%) |
| Total | 584 (30.2%) | 741 (36.7%) |
Income Above Poverty by Sex and Age in Walhalla
According to the poverty statistics in Walhalla, males aged 15 years and females aged under 5 years are the age groups that are most secure financially, with 100.0% of males and 100.0% of females in these age groups living above the poverty line.
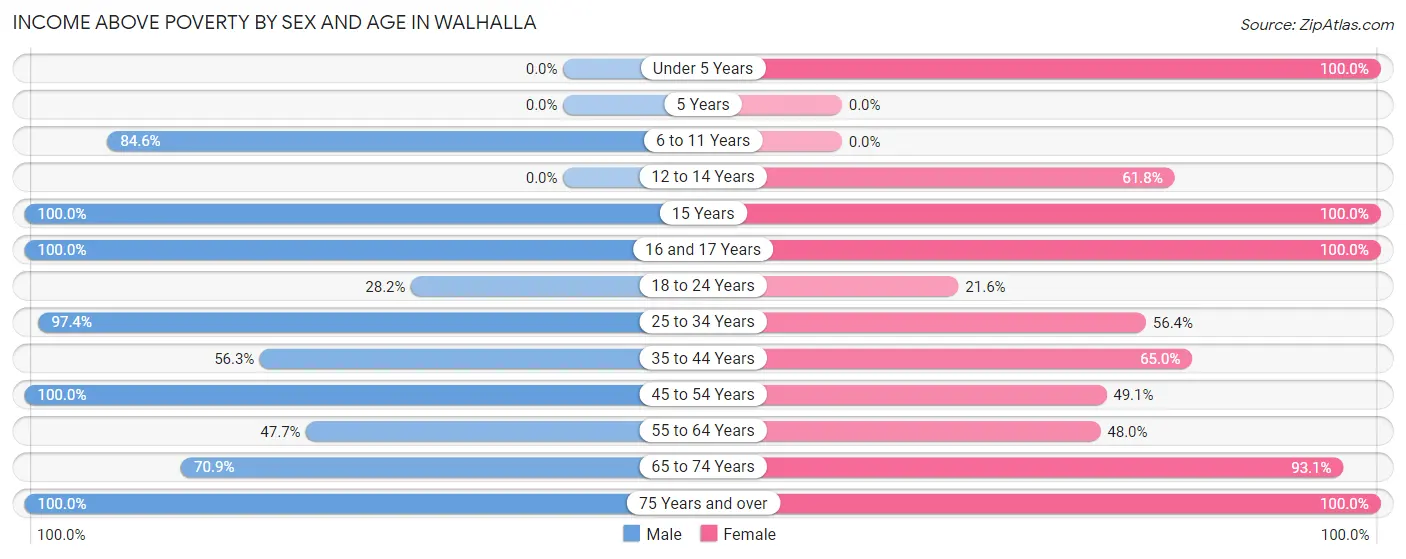
| Age Bracket | Male | Female |
| Under 5 Years | 0 (0.0%) | 88 (100.0%) |
| 5 Years | 0 (0.0%) | 0 (0.0%) |
| 6 to 11 Years | 110 (84.6%) | 0 (0.0%) |
| 12 to 14 Years | 0 (0.0%) | 63 (61.8%) |
| 15 Years | 13 (100.0%) | 59 (100.0%) |
| 16 and 17 Years | 92 (100.0%) | 34 (100.0%) |
| 18 to 24 Years | 44 (28.2%) | 37 (21.6%) |
| 25 to 34 Years | 373 (97.4%) | 114 (56.4%) |
| 35 to 44 Years | 220 (56.3%) | 160 (65.0%) |
| 45 to 54 Years | 80 (100.0%) | 164 (49.1%) |
| 55 to 64 Years | 31 (47.7%) | 155 (48.0%) |
| 65 to 74 Years | 222 (70.9%) | 229 (93.1%) |
| 75 Years and over | 165 (100.0%) | 175 (100.0%) |
| Total | 1,350 (69.8%) | 1,278 (63.3%) |
Income Below Poverty Among Married-Couple Families in Walhalla
The poverty statistics for married-couple families in Walhalla show that 14.8% or 119 of the total 805 families live below the poverty line. Families with 1 or 2 children have the highest poverty rate of 28.8%, comprising of 86 families. On the other hand, families with no children have the lowest poverty rate of 6.5%, which includes 33 families.
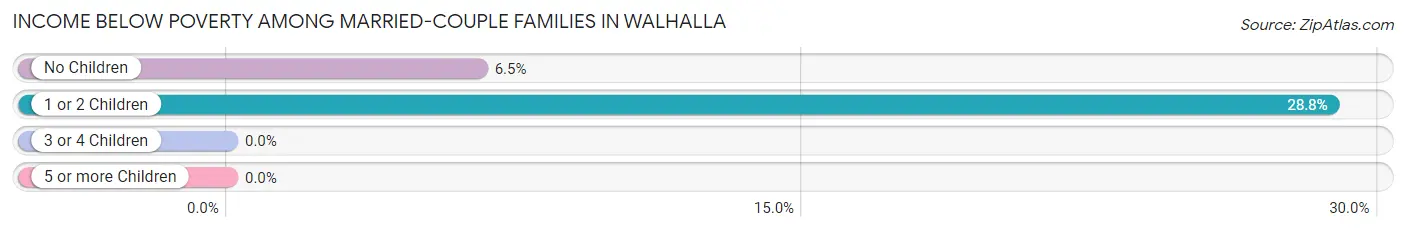
| Children | Above Poverty | Below Poverty |
| No Children | 473 (93.5%) | 33 (6.5%) |
| 1 or 2 Children | 213 (71.2%) | 86 (28.8%) |
| 3 or 4 Children | 0 (0.0%) | 0 (0.0%) |
| 5 or more Children | 0 (0.0%) | 0 (0.0%) |
| Total | 686 (85.2%) | 119 (14.8%) |
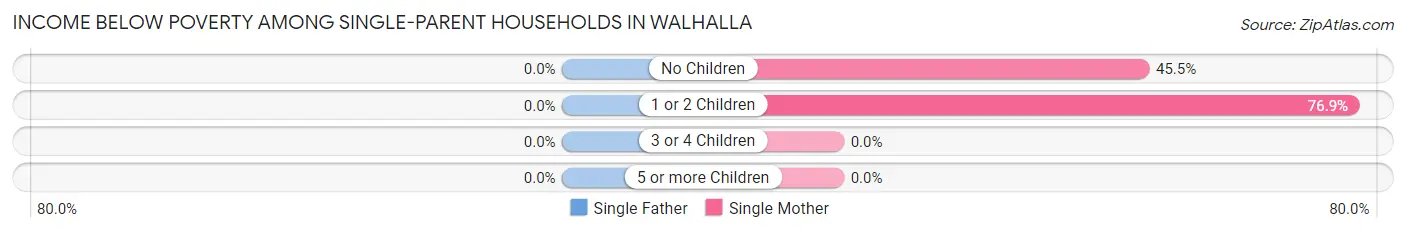
Income Below Poverty Among Single-Parent Households in Walhalla
| Children | Single Father | Single Mother |
| No Children | 0 (0.0%) | 86 (45.5%) |
| 1 or 2 Children | 0 (0.0%) | 50 (76.9%) |
| 3 or 4 Children | 0 (0.0%) | 0 (0.0%) |
| 5 or more Children | 0 (0.0%) | 0 (0.0%) |
| Total | 0 (0.0%) | 136 (53.5%) |
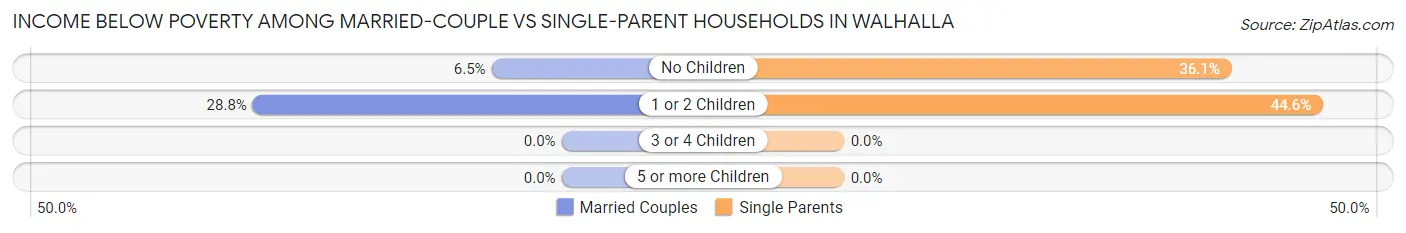
Income Below Poverty Among Married-Couple vs Single-Parent Households in Walhalla
The poverty data for Walhalla shows that 119 of the married-couple family households (14.8%) and 136 of the single-parent households (38.9%) are living below the poverty level. Within the married-couple family households, those with 1 or 2 children have the highest poverty rate, with 86 households (28.8%) falling below the poverty line. Among the single-parent households, those with 1 or 2 children have the highest poverty rate, with 50 household (44.6%) living below poverty.
| Children | Married-Couple Families | Single-Parent Households |
| No Children | 33 (6.5%) | 86 (36.1%) |
| 1 or 2 Children | 86 (28.8%) | 50 (44.6%) |
| 3 or 4 Children | 0 (0.0%) | 0 (0.0%) |
| 5 or more Children | 0 (0.0%) | 0 (0.0%) |
| Total | 119 (14.8%) | 136 (38.9%) |
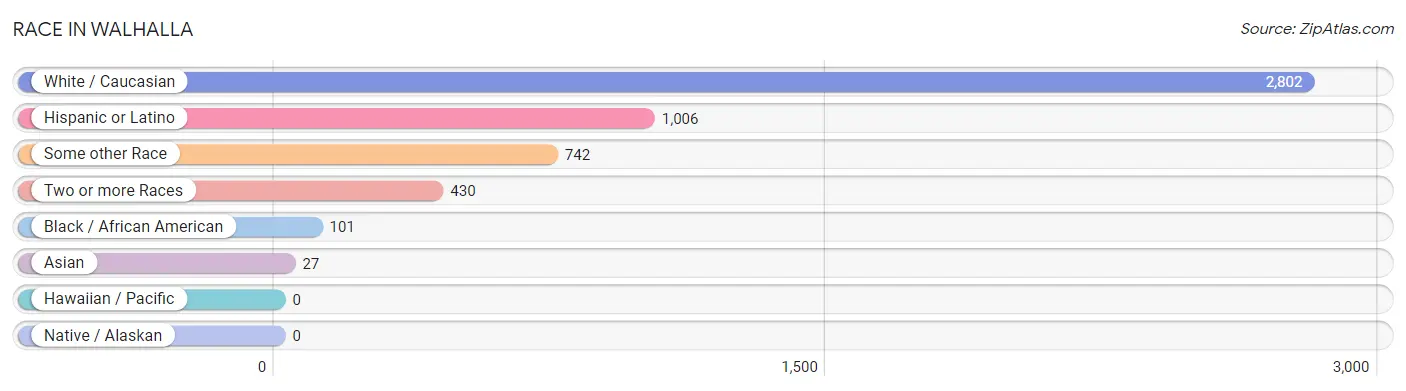
Race in Walhalla
The most populous races in Walhalla are White / Caucasian (2,802 | 68.3%), Hispanic or Latino (1,006 | 24.5%), and Some other Race (742 | 18.1%).
| Race | # Population | % Population |
| Asian | 27 | 0.7% |
| Black / African American | 101 | 2.5% |
| Hawaiian / Pacific | 0 | 0.0% |
| Hispanic or Latino | 1,006 | 24.5% |
| Native / Alaskan | 0 | 0.0% |
| White / Caucasian | 2,802 | 68.3% |
| Two or more Races | 430 | 10.5% |
| Some other Race | 742 | 18.1% |
| Total | 4,102 | 100.0% |
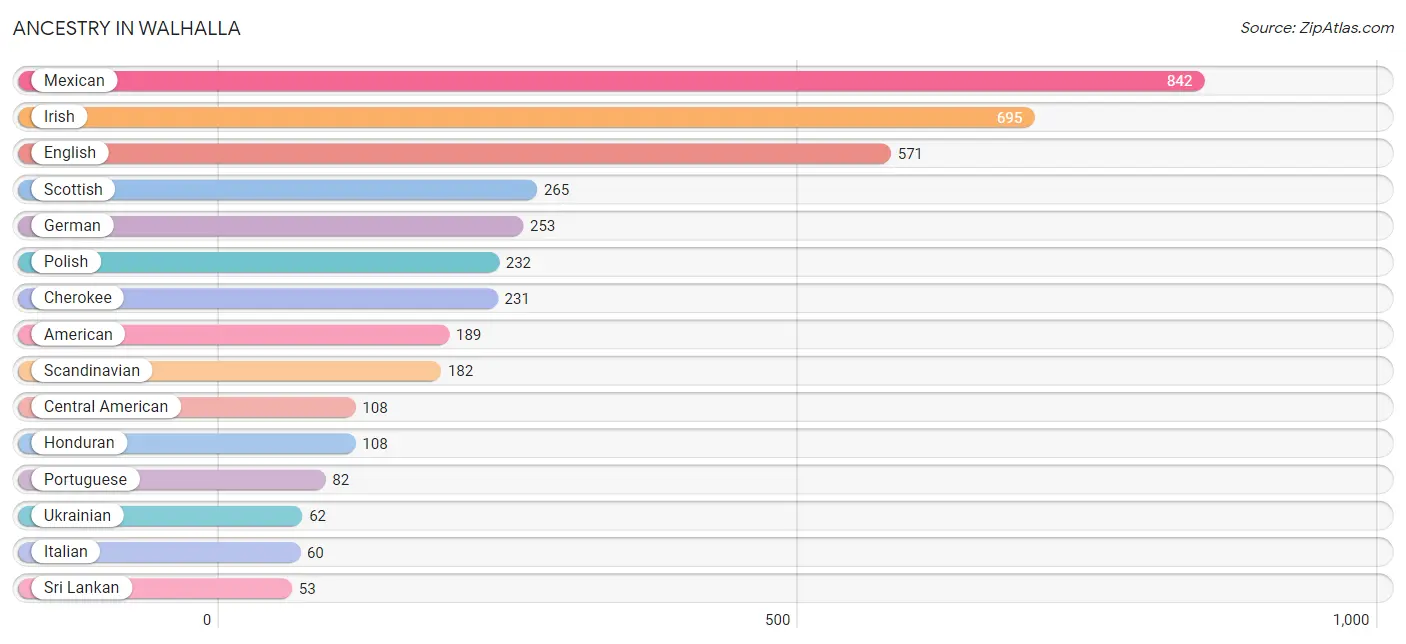
Ancestry in Walhalla
The most populous ancestries reported in Walhalla are Mexican (842 | 20.5%), Irish (695 | 16.9%), English (571 | 13.9%), Scottish (265 | 6.5%), and German (253 | 6.2%), together accounting for 64.0% of all Walhalla residents.
| Ancestry | # Population | % Population |
| American | 189 | 4.6% |
| Central American | 108 | 2.6% |
| Cherokee | 231 | 5.6% |
| English | 571 | 13.9% |
| European | 37 | 0.9% |
| French | 15 | 0.4% |
| German | 253 | 6.2% |
| Honduran | 108 | 2.6% |
| Irish | 695 | 16.9% |
| Iroquois | 4 | 0.1% |
| Italian | 60 | 1.5% |
| Mexican | 842 | 20.5% |
| Norwegian | 18 | 0.4% |
| Polish | 232 | 5.7% |
| Portuguese | 82 | 2.0% |
| Puerto Rican | 9 | 0.2% |
| Scandinavian | 182 | 4.4% |
| Scotch-Irish | 14 | 0.3% |
| Scottish | 265 | 6.5% |
| Sri Lankan | 53 | 1.3% |
| Swiss | 15 | 0.4% |
| Ukrainian | 62 | 1.5% | View All 22 Rows |
Immigrants in Walhalla
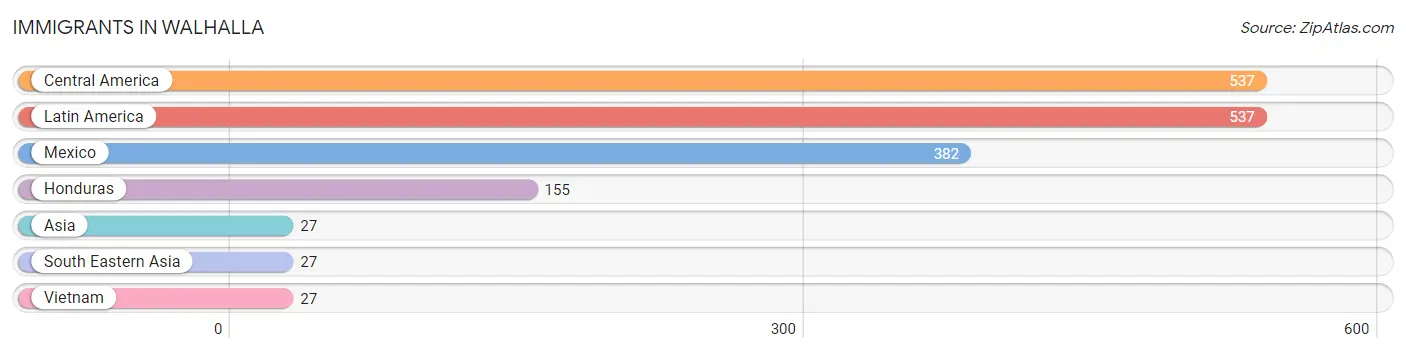
The most numerous immigrant groups reported in Walhalla came from Central America (537 | 13.1%), Latin America (537 | 13.1%), Mexico (382 | 9.3%), Honduras (155 | 3.8%), and Asia (27 | 0.7%), together accounting for 39.9% of all Walhalla residents.
| Immigration Origin | # Population | % Population |
| Asia | 27 | 0.7% |
| Central America | 537 | 13.1% |
| Honduras | 155 | 3.8% |
| Latin America | 537 | 13.1% |
| Mexico | 382 | 9.3% |
| South Eastern Asia | 27 | 0.7% |
| Vietnam | 27 | 0.7% | View All 7 Rows |
Sex and Age in Walhalla
Sex and Age in Walhalla
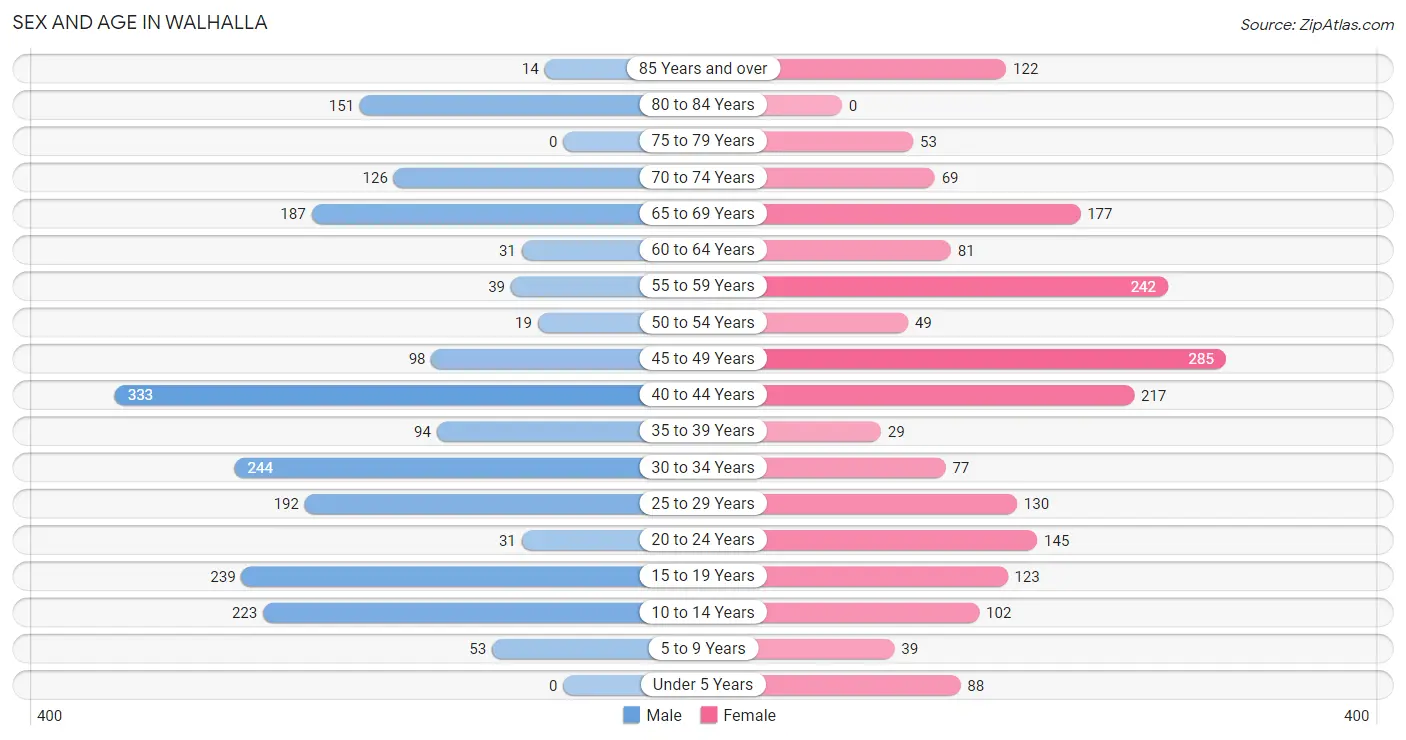
The most populous age groups in Walhalla are 40 to 44 Years (333 | 16.1%) for men and 45 to 49 Years (285 | 14.1%) for women.
| Age Bracket | Male | Female |
| Under 5 Years | 0 (0.0%) | 88 (4.3%) |
| 5 to 9 Years | 53 (2.6%) | 39 (1.9%) |
| 10 to 14 Years | 223 (10.7%) | 102 (5.0%) |
| 15 to 19 Years | 239 (11.5%) | 123 (6.1%) |
| 20 to 24 Years | 31 (1.5%) | 145 (7.1%) |
| 25 to 29 Years | 192 (9.3%) | 130 (6.4%) |
| 30 to 34 Years | 244 (11.8%) | 77 (3.8%) |
| 35 to 39 Years | 94 (4.5%) | 29 (1.4%) |
| 40 to 44 Years | 333 (16.1%) | 217 (10.7%) |
| 45 to 49 Years | 98 (4.7%) | 285 (14.1%) |
| 50 to 54 Years | 19 (0.9%) | 49 (2.4%) |
| 55 to 59 Years | 39 (1.9%) | 242 (11.9%) |
| 60 to 64 Years | 31 (1.5%) | 81 (4.0%) |
| 65 to 69 Years | 187 (9.0%) | 177 (8.7%) |
| 70 to 74 Years | 126 (6.1%) | 69 (3.4%) |
| 75 to 79 Years | 0 (0.0%) | 53 (2.6%) |
| 80 to 84 Years | 151 (7.3%) | 0 (0.0%) |
| 85 Years and over | 14 (0.7%) | 122 (6.0%) |
| Total | 2,074 (100.0%) | 2,028 (100.0%) |
Families and Households in Walhalla
Median Family Size in Walhalla
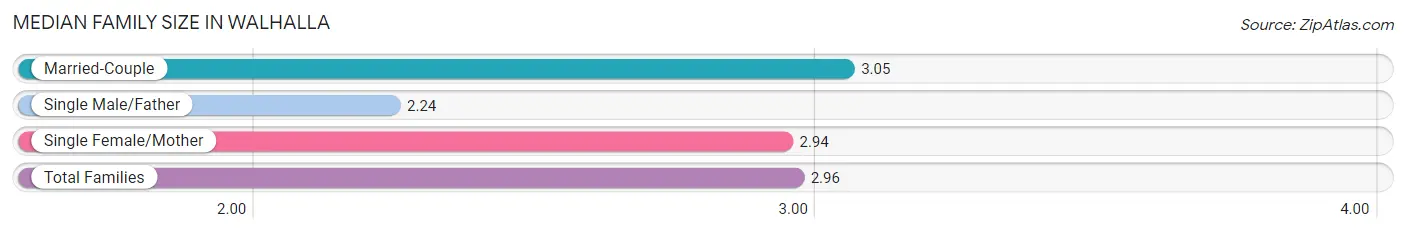
The median family size in Walhalla is 2.96 persons per family, with married-couple families (805 | 69.7%) accounting for the largest median family size of 3.05 persons per family. On the other hand, single male/father families (96 | 8.3%) represent the smallest median family size with 2.24 persons per family.
| Family Type | # Families | Family Size |
| Married-Couple | 805 (69.7%) | 3.05 |
| Single Male/Father | 96 (8.3%) | 2.24 |
| Single Female/Mother | 254 (22.0%) | 2.94 |
| Total Families | 1,155 (100.0%) | 2.96 |
Median Household Size in Walhalla
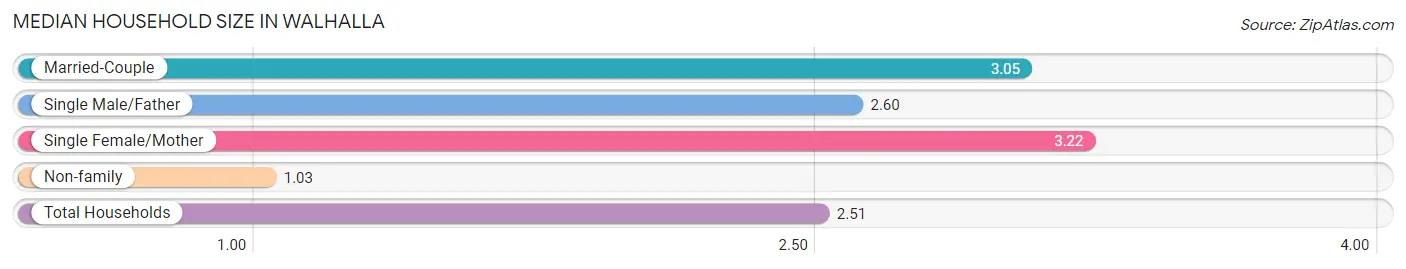
The median household size in Walhalla is 2.51 persons per household, with single female/mother households (254 | 16.2%) accounting for the largest median household size of 3.22 persons per household. non-family households (417 | 26.5%) represent the smallest median household size with 1.03 persons per household.
| Household Type | # Households | Household Size |
| Married-Couple | 805 (51.2%) | 3.05 |
| Single Male/Father | 96 (6.1%) | 2.60 |
| Single Female/Mother | 254 (16.2%) | 3.22 |
| Non-family | 417 (26.5%) | 1.03 |
| Total Households | 1,572 (100.0%) | 2.51 |
Household Size by Marriage Status in Walhalla
Out of a total of 1,572 households in Walhalla, 1,155 (73.5%) are family households, while 417 (26.5%) are nonfamily households. The most numerous type of family households are 2-person households, comprising 629, and the most common type of nonfamily households are 1-person households, comprising 402.
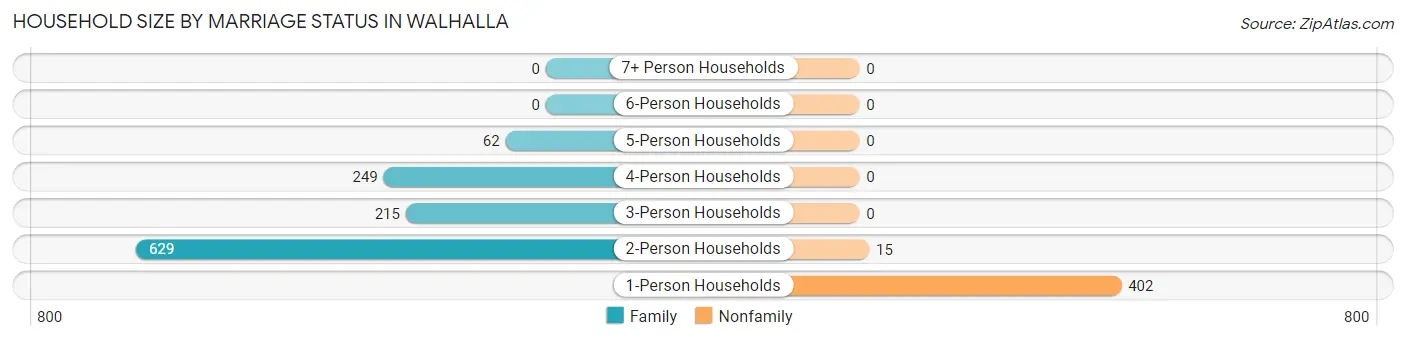
| Household Size | Family Households | Nonfamily Households |
| 1-Person Households | - | 402 (25.6%) |
| 2-Person Households | 629 (40.0%) | 15 (0.9%) |
| 3-Person Households | 215 (13.7%) | 0 (0.0%) |
| 4-Person Households | 249 (15.8%) | 0 (0.0%) |
| 5-Person Households | 62 (3.9%) | 0 (0.0%) |
| 6-Person Households | 0 (0.0%) | 0 (0.0%) |
| 7+ Person Households | 0 (0.0%) | 0 (0.0%) |
| Total | 1,155 (73.5%) | 417 (26.5%) |
Female Fertility in Walhalla
Fertility by Age in Walhalla
| Age Bracket | Women with Births | Births / 1,000 Women |
| 15 to 19 years | 0 (0.0%) | 0.0 |
| 20 to 34 years | 0 (0.0%) | 0.0 |
| 35 to 50 years | 0 (0.0%) | 0.0 |
| Total | 0 (0.0%) | 0.0 |
Fertility by Age by Marriage Status in Walhalla
| Age Bracket | Married | Unmarried |
| 15 to 19 years | 0 (0.0%) | 0 (0.0%) |
| 20 to 34 years | 0 (0.0%) | 0 (0.0%) |
| 35 to 50 years | 0 (0.0%) | 0 (0.0%) |
| Total | 0 (0.0%) | 0 (0.0%) |
Fertility by Education in Walhalla
| Educational Attainment | Women with Births | Births / 1,000 Women |
| Less than High School | 0 (0.0%) | 0.0 |
| High School Diploma | 0 (0.0%) | 0.0 |
| College or Associate's Degree | 0 (0.0%) | 0.0 |
| Bachelor's Degree | 0 (0.0%) | 0.0 |
| Graduate Degree | 0 (0.0%) | 0.0 |
| Total | 0 (0.0%) | 0.0 |
Fertility by Education by Marriage Status in Walhalla
| Educational Attainment | Married | Unmarried |
| Less than High School | 0 (0.0%) | 0 (0.0%) |
| High School Diploma | 0 (0.0%) | 0 (0.0%) |
| College or Associate's Degree | 0 (0.0%) | 0 (0.0%) |
| Bachelor's Degree | 0 (0.0%) | 0 (0.0%) |
| Graduate Degree | 0 (0.0%) | 0 (0.0%) |
| Total | 0 (0.0%) | 0 (0.0%) |
Employment Characteristics in Walhalla
Employment by Class of Employer in Walhalla
Among the 1,464 employed individuals in Walhalla, private company employees (792 | 54.1%), self-employed (not incorporated) (428 | 29.2%), and state government employees (82 | 5.6%) make up the most common classes of employment.
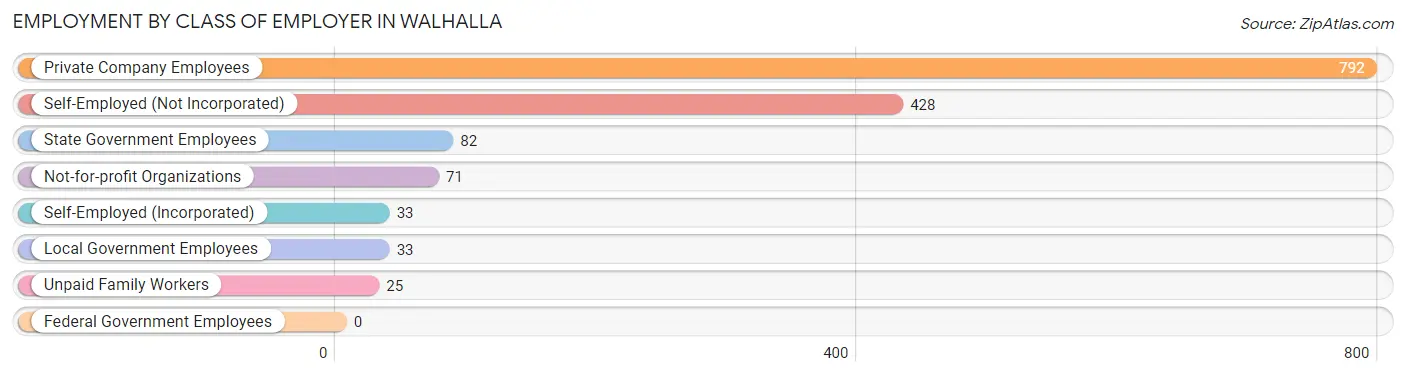
| Employer Class | # Employees | % Employees |
| Private Company Employees | 792 | 54.1% |
| Self-Employed (Incorporated) | 33 | 2.2% |
| Self-Employed (Not Incorporated) | 428 | 29.2% |
| Not-for-profit Organizations | 71 | 4.9% |
| Local Government Employees | 33 | 2.2% |
| State Government Employees | 82 | 5.6% |
| Federal Government Employees | 0 | 0.0% |
| Unpaid Family Workers | 25 | 1.7% |
| Total | 1,464 | 100.0% |
Employment Status by Age in Walhalla
According to the labor force statistics for Walhalla, out of the total population over 16 years of age (3,525), 46.2% or 1,629 individuals are in the labor force, with 9.3% or 151 of them unemployed. The age group with the highest labor force participation rate is 25 to 29 years, with 89.4% or 288 individuals in the labor force. Within the labor force, the 30 to 34 years age range has the highest percentage of unemployed individuals, with 27.3% or 36 of them being unemployed.
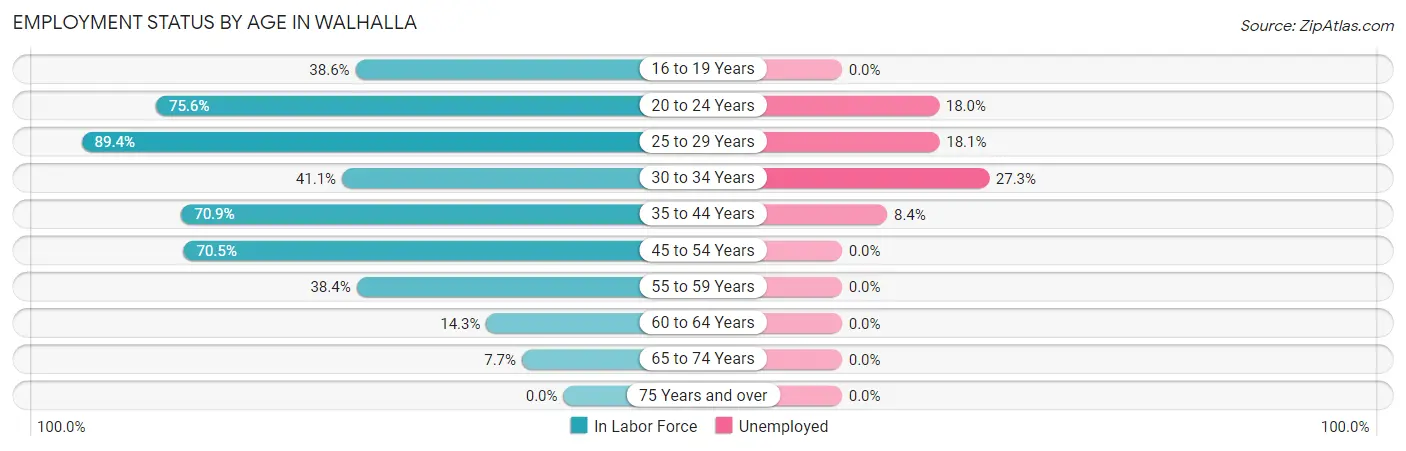
| Age Bracket | In Labor Force | Unemployed |
| 16 to 19 Years | 112 (38.6%) | 0 (0.0%) |
| 20 to 24 Years | 133 (75.6%) | 24 (18.0%) |
| 25 to 29 Years | 288 (89.4%) | 52 (18.1%) |
| 30 to 34 Years | 132 (41.1%) | 36 (27.3%) |
| 35 to 44 Years | 477 (70.9%) | 40 (8.4%) |
| 45 to 54 Years | 318 (70.5%) | 0 (0.0%) |
| 55 to 59 Years | 108 (38.4%) | 0 (0.0%) |
| 60 to 64 Years | 16 (14.3%) | 0 (0.0%) |
| 65 to 74 Years | 43 (7.7%) | 0 (0.0%) |
| 75 Years and over | 0 (0.0%) | 0 (0.0%) |
| Total | 1,629 (46.2%) | 151 (9.3%) |
Employment Status by Educational Attainment in Walhalla
According to labor force statistics for Walhalla, 62.0% of individuals (1,339) out of the total population between 25 and 64 years of age (2,160) are in the labor force, with 9.6% or 129 of them being unemployed. The group with the highest labor force participation rate are those with the educational attainment of college / associate degree, with 88.7% or 414 individuals in the labor force. Within the labor force, individuals with bachelor's degree or higher education have the highest percentage of unemployment, with 45.5% or 40 of them being unemployed.
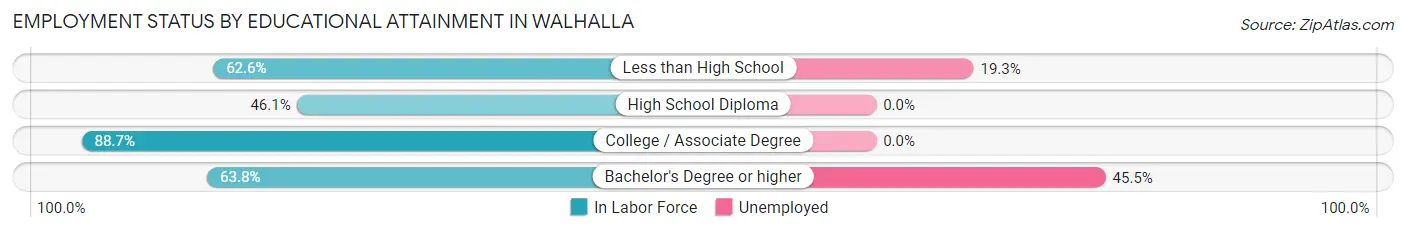
| Educational Attainment | In Labor Force | Unemployed |
| Less than High School | 456 (62.6%) | 141 (19.3%) |
| High School Diploma | 381 (46.1%) | 0 (0.0%) |
| College / Associate Degree | 414 (88.7%) | 0 (0.0%) |
| Bachelor's Degree or higher | 88 (63.8%) | 63 (45.5%) |
| Total | 1,339 (62.0%) | 207 (9.6%) |
Employment Occupations by Sex in Walhalla
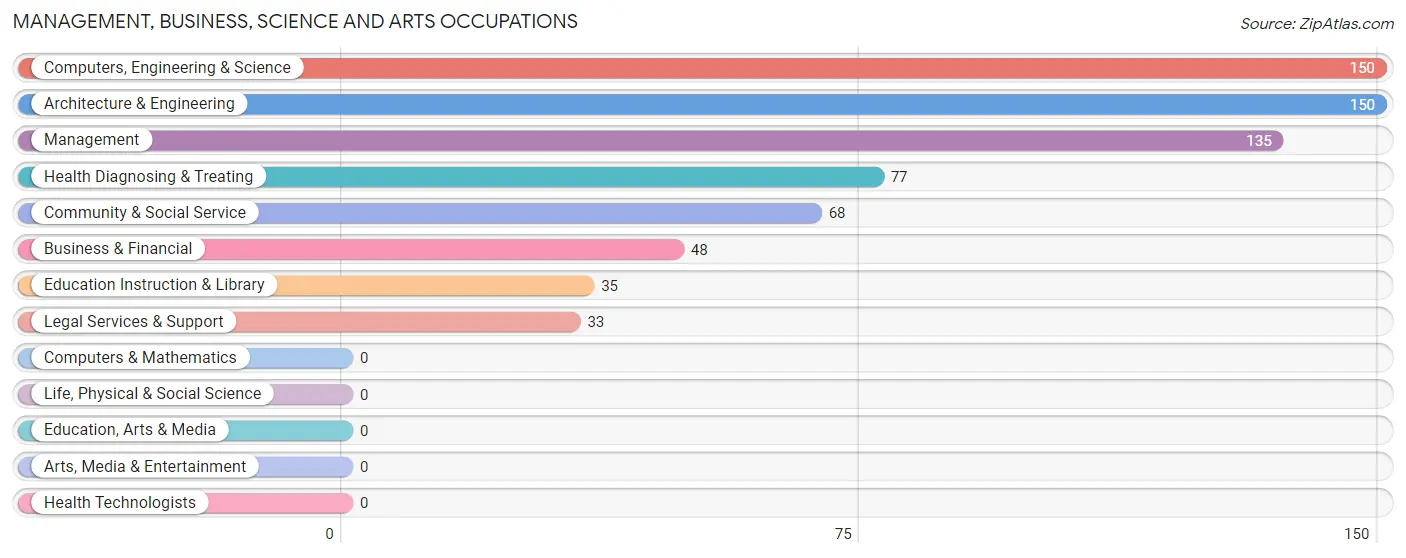
Management, Business, Science and Arts Occupations
The most common Management, Business, Science and Arts occupations in Walhalla are Computers, Engineering & Science (150 | 10.2%), Architecture & Engineering (150 | 10.2%), Management (135 | 9.1%), Health Diagnosing & Treating (77 | 5.2%), and Community & Social Service (68 | 4.6%).
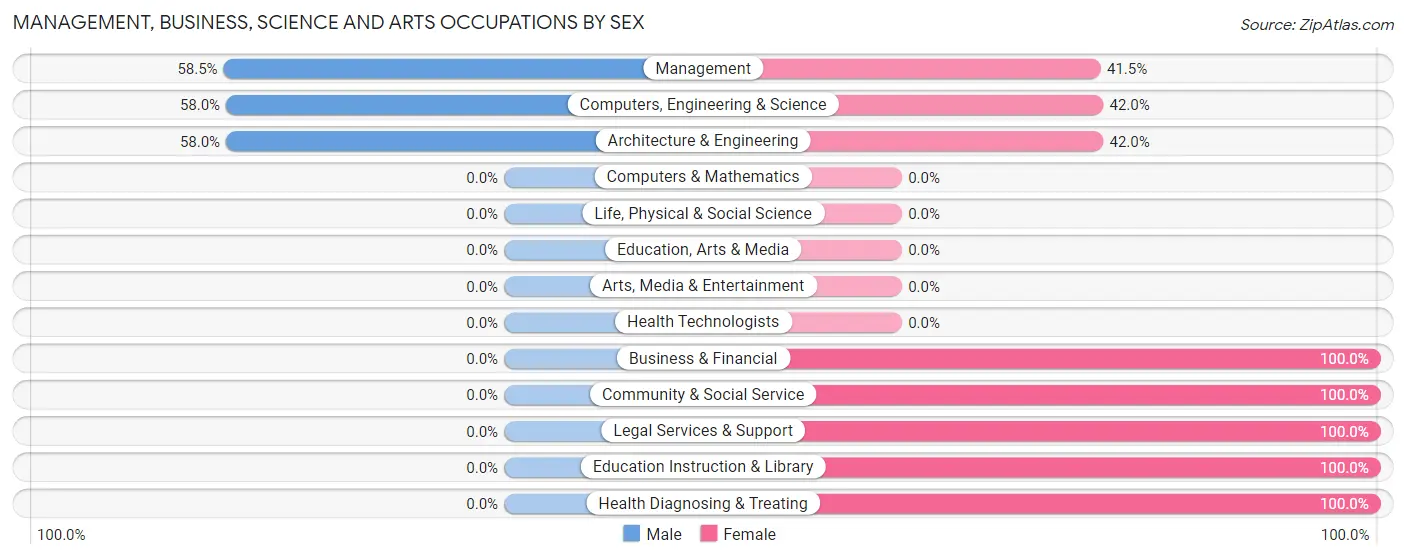
Management, Business, Science and Arts Occupations by Sex
Within the Management, Business, Science and Arts occupations in Walhalla, the most male-oriented occupations are Management (58.5%), Computers, Engineering & Science (58.0%), and Architecture & Engineering (58.0%), while the most female-oriented occupations are Business & Financial (100.0%), Community & Social Service (100.0%), and Legal Services & Support (100.0%).
| Occupation | Male | Female |
| Management | 79 (58.5%) | 56 (41.5%) |
| Business & Financial | 0 (0.0%) | 48 (100.0%) |
| Computers, Engineering & Science | 87 (58.0%) | 63 (42.0%) |
| Computers & Mathematics | 0 (0.0%) | 0 (0.0%) |
| Architecture & Engineering | 87 (58.0%) | 63 (42.0%) |
| Life, Physical & Social Science | 0 (0.0%) | 0 (0.0%) |
| Community & Social Service | 0 (0.0%) | 68 (100.0%) |
| Education, Arts & Media | 0 (0.0%) | 0 (0.0%) |
| Legal Services & Support | 0 (0.0%) | 33 (100.0%) |
| Education Instruction & Library | 0 (0.0%) | 35 (100.0%) |
| Arts, Media & Entertainment | 0 (0.0%) | 0 (0.0%) |
| Health Diagnosing & Treating | 0 (0.0%) | 77 (100.0%) |
| Health Technologists | 0 (0.0%) | 0 (0.0%) |
| Total (Category) | 166 (34.7%) | 312 (65.3%) |
| Total (Overall) | 855 (58.0%) | 620 (42.0%) |
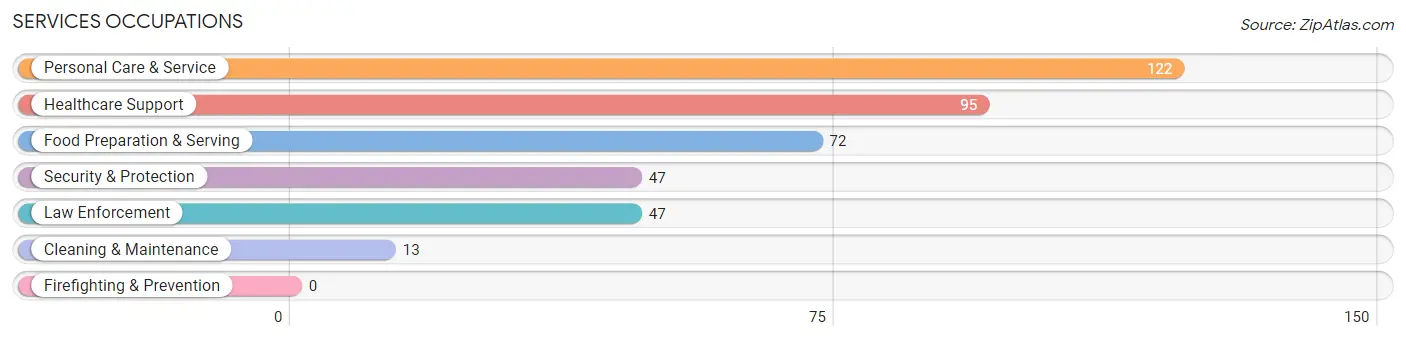
Services Occupations
The most common Services occupations in Walhalla are Personal Care & Service (122 | 8.3%), Healthcare Support (95 | 6.4%), Food Preparation & Serving (72 | 4.9%), Security & Protection (47 | 3.2%), and Law Enforcement (47 | 3.2%).
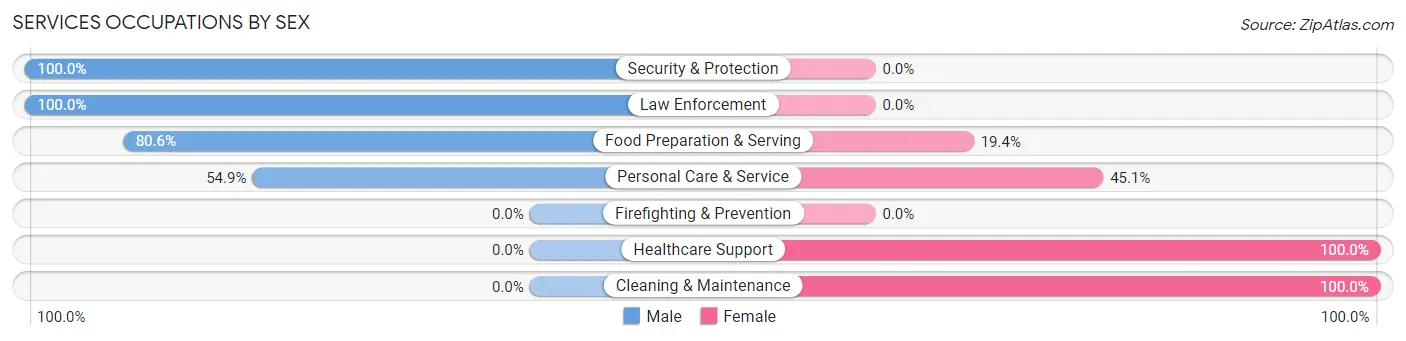
Services Occupations by Sex
Within the Services occupations in Walhalla, the most male-oriented occupations are Security & Protection (100.0%), Law Enforcement (100.0%), and Food Preparation & Serving (80.6%), while the most female-oriented occupations are Healthcare Support (100.0%), Cleaning & Maintenance (100.0%), and Personal Care & Service (45.1%).
| Occupation | Male | Female |
| Healthcare Support | 0 (0.0%) | 95 (100.0%) |
| Security & Protection | 47 (100.0%) | 0 (0.0%) |
| Firefighting & Prevention | 0 (0.0%) | 0 (0.0%) |
| Law Enforcement | 47 (100.0%) | 0 (0.0%) |
| Food Preparation & Serving | 58 (80.6%) | 14 (19.4%) |
| Cleaning & Maintenance | 0 (0.0%) | 13 (100.0%) |
| Personal Care & Service | 67 (54.9%) | 55 (45.1%) |
| Total (Category) | 172 (49.3%) | 177 (50.7%) |
| Total (Overall) | 855 (58.0%) | 620 (42.0%) |
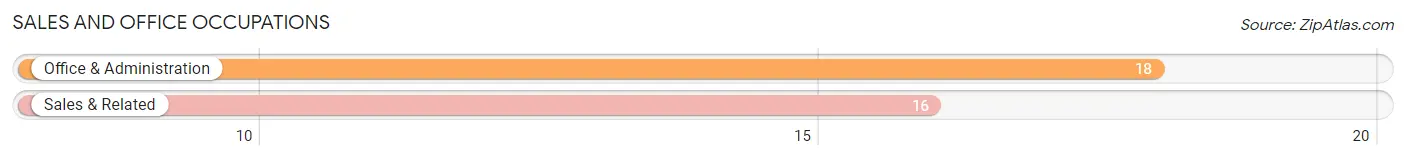
Sales and Office Occupations
The most common Sales and Office occupations in Walhalla are Office & Administration (18 | 1.2%), and Sales & Related (16 | 1.1%).
Sales and Office Occupations by Sex

| Occupation | Male | Female |
| Sales & Related | 16 (100.0%) | 0 (0.0%) |
| Office & Administration | 0 (0.0%) | 18 (100.0%) |
| Total (Category) | 16 (47.1%) | 18 (52.9%) |
| Total (Overall) | 855 (58.0%) | 620 (42.0%) |
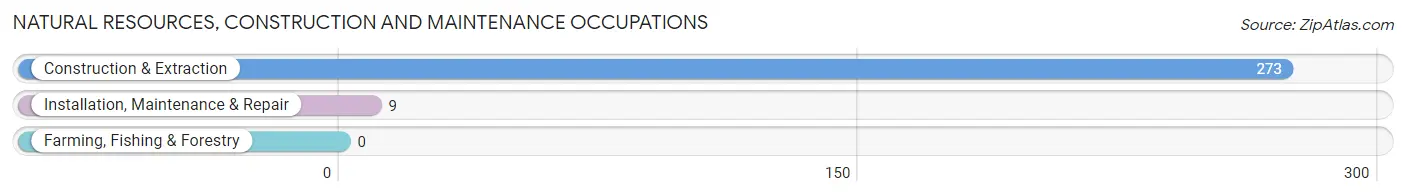
Natural Resources, Construction and Maintenance Occupations
The most common Natural Resources, Construction and Maintenance occupations in Walhalla are Construction & Extraction (273 | 18.5%), and Installation, Maintenance & Repair (9 | 0.6%).
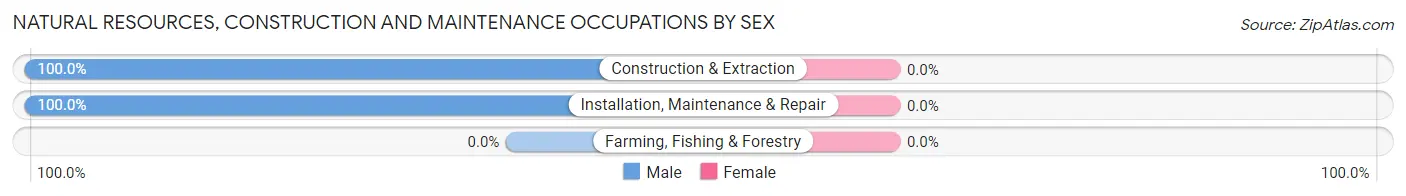
Natural Resources, Construction and Maintenance Occupations by Sex
| Occupation | Male | Female |
| Farming, Fishing & Forestry | 0 (0.0%) | 0 (0.0%) |
| Construction & Extraction | 273 (100.0%) | 0 (0.0%) |
| Installation, Maintenance & Repair | 9 (100.0%) | 0 (0.0%) |
| Total (Category) | 282 (100.0%) | 0 (0.0%) |
| Total (Overall) | 855 (58.0%) | 620 (42.0%) |
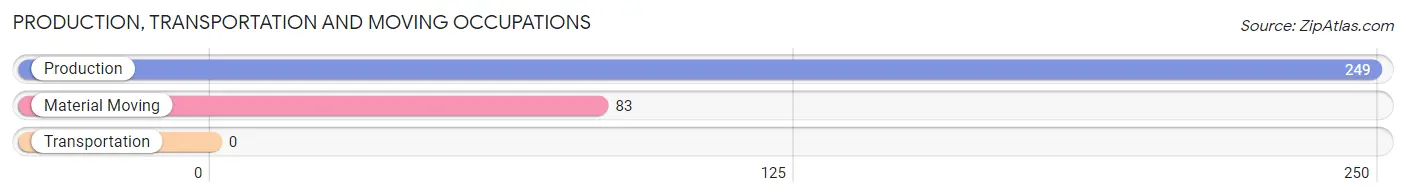
Production, Transportation and Moving Occupations
The most common Production, Transportation and Moving occupations in Walhalla are Production (249 | 16.9%), and Material Moving (83 | 5.6%).
Production, Transportation and Moving Occupations by Sex
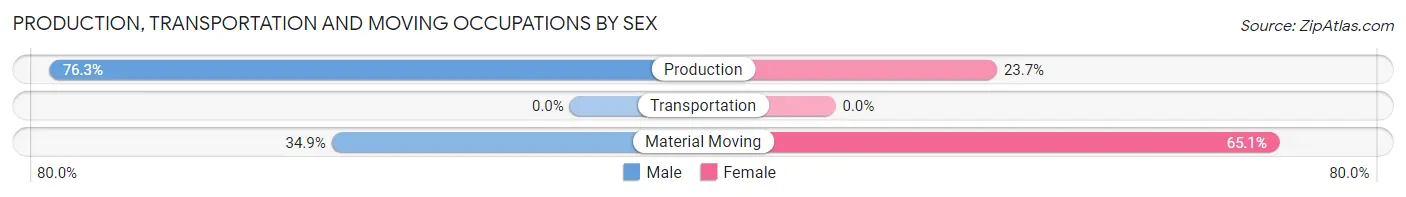
| Occupation | Male | Female |
| Production | 190 (76.3%) | 59 (23.7%) |
| Transportation | 0 (0.0%) | 0 (0.0%) |
| Material Moving | 29 (34.9%) | 54 (65.1%) |
| Total (Category) | 219 (66.0%) | 113 (34.0%) |
| Total (Overall) | 855 (58.0%) | 620 (42.0%) |
Employment Industries by Sex in Walhalla
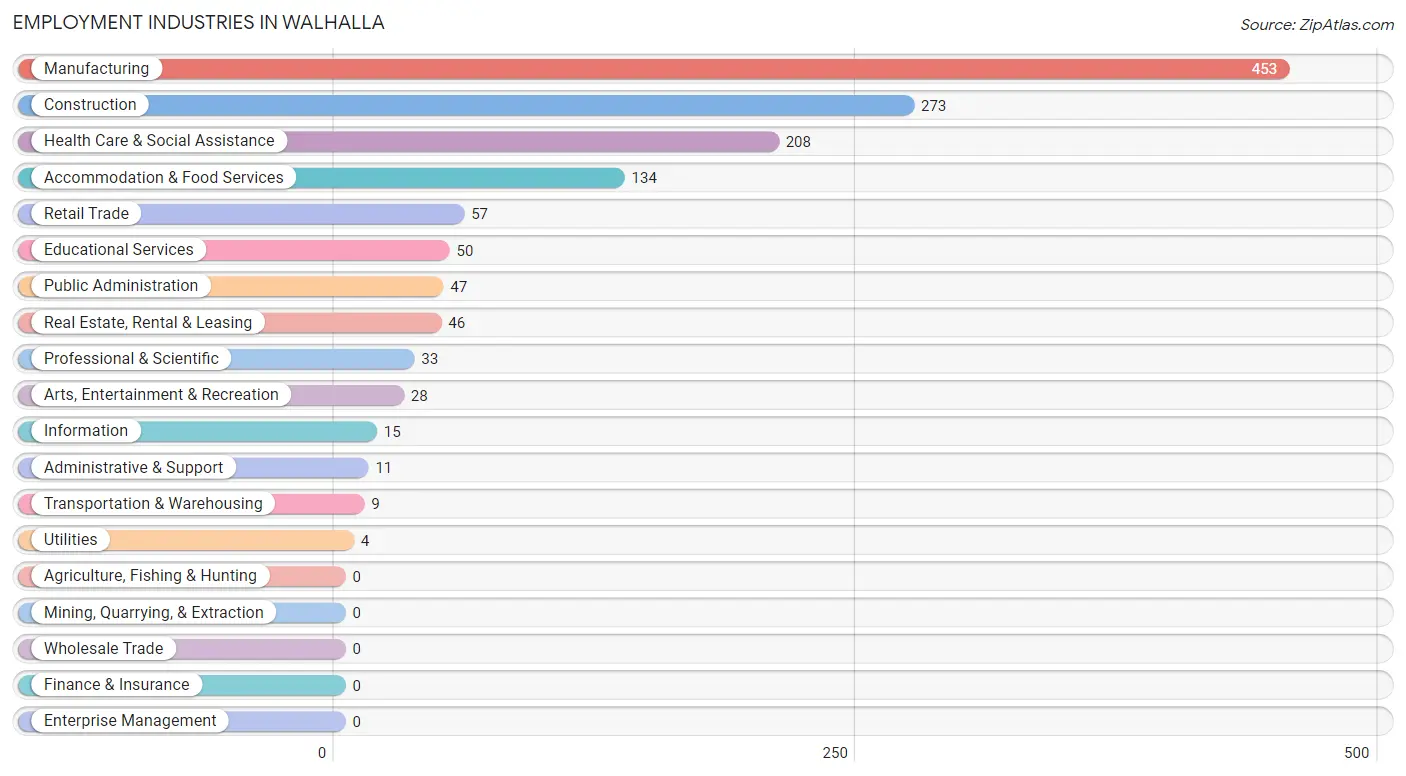
Employment Industries in Walhalla
The major employment industries in Walhalla include Manufacturing (453 | 30.7%), Construction (273 | 18.5%), Health Care & Social Assistance (208 | 14.1%), Accommodation & Food Services (134 | 9.1%), and Retail Trade (57 | 3.9%).
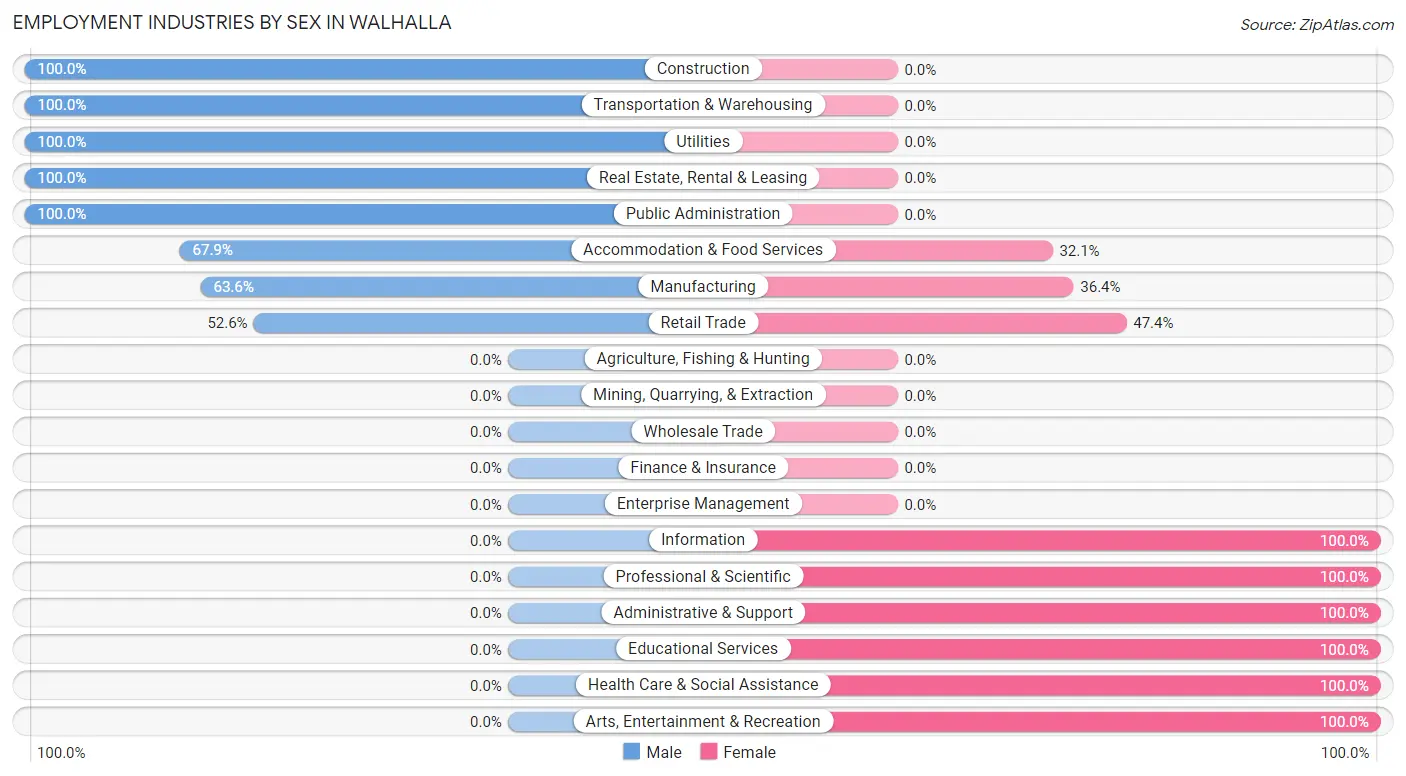
Employment Industries by Sex in Walhalla
The Walhalla industries that see more men than women are Construction (100.0%), Transportation & Warehousing (100.0%), and Utilities (100.0%), whereas the industries that tend to have a higher number of women are Information (100.0%), Professional & Scientific (100.0%), and Administrative & Support (100.0%).
| Industry | Male | Female |
| Agriculture, Fishing & Hunting | 0 (0.0%) | 0 (0.0%) |
| Mining, Quarrying, & Extraction | 0 (0.0%) | 0 (0.0%) |
| Construction | 273 (100.0%) | 0 (0.0%) |
| Manufacturing | 288 (63.6%) | 165 (36.4%) |
| Wholesale Trade | 0 (0.0%) | 0 (0.0%) |
| Retail Trade | 30 (52.6%) | 27 (47.4%) |
| Transportation & Warehousing | 9 (100.0%) | 0 (0.0%) |
| Utilities | 4 (100.0%) | 0 (0.0%) |
| Information | 0 (0.0%) | 15 (100.0%) |
| Finance & Insurance | 0 (0.0%) | 0 (0.0%) |
| Real Estate, Rental & Leasing | 46 (100.0%) | 0 (0.0%) |
| Professional & Scientific | 0 (0.0%) | 33 (100.0%) |
| Enterprise Management | 0 (0.0%) | 0 (0.0%) |
| Administrative & Support | 0 (0.0%) | 11 (100.0%) |
| Educational Services | 0 (0.0%) | 50 (100.0%) |
| Health Care & Social Assistance | 0 (0.0%) | 208 (100.0%) |
| Arts, Entertainment & Recreation | 0 (0.0%) | 28 (100.0%) |
| Accommodation & Food Services | 91 (67.9%) | 43 (32.1%) |
| Public Administration | 47 (100.0%) | 0 (0.0%) |
| Total | 855 (58.0%) | 620 (42.0%) |
Education in Walhalla
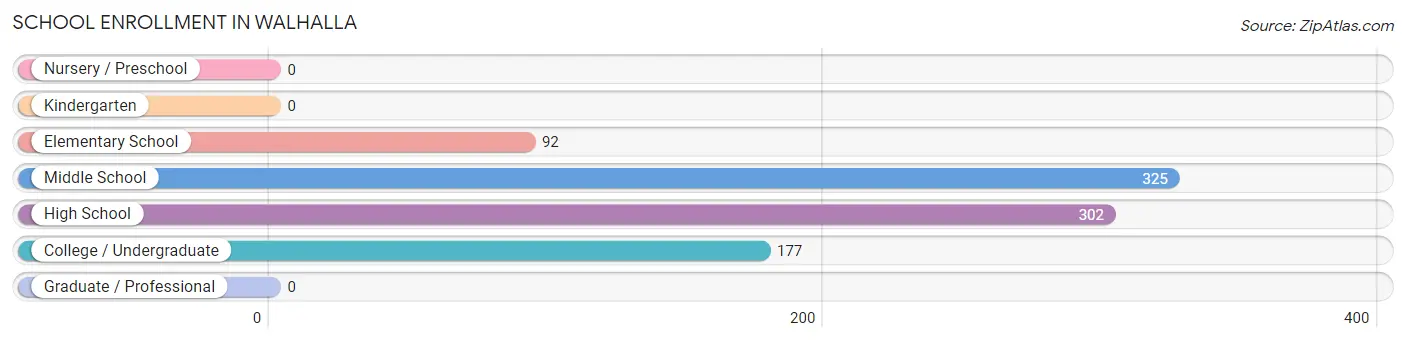
School Enrollment in Walhalla
The most common levels of schooling among the 896 students in Walhalla are middle school (325 | 36.3%), high school (302 | 33.7%), and college / undergraduate (177 | 19.8%).
| School Level | # Students | % Students |
| Nursery / Preschool | 0 | 0.0% |
| Kindergarten | 0 | 0.0% |
| Elementary School | 92 | 10.3% |
| Middle School | 325 | 36.3% |
| High School | 302 | 33.7% |
| College / Undergraduate | 177 | 19.8% |
| Graduate / Professional | 0 | 0.0% |
| Total | 896 | 100.0% |
School Enrollment by Age by Funding Source in Walhalla
Out of a total of 896 students who are enrolled in schools in Walhalla, 88 (9.8%) attend a private institution, while the remaining 808 (90.2%) are enrolled in public schools. The age group of 25 to 34 year olds has the highest likelihood of being enrolled in private schools, with 10 (100.0% in the age bracket) enrolled. Conversely, the age group of 5 to 9 year old has the lowest likelihood of being enrolled in a private school, with 92 (100.0% in the age bracket) attending a public institution.
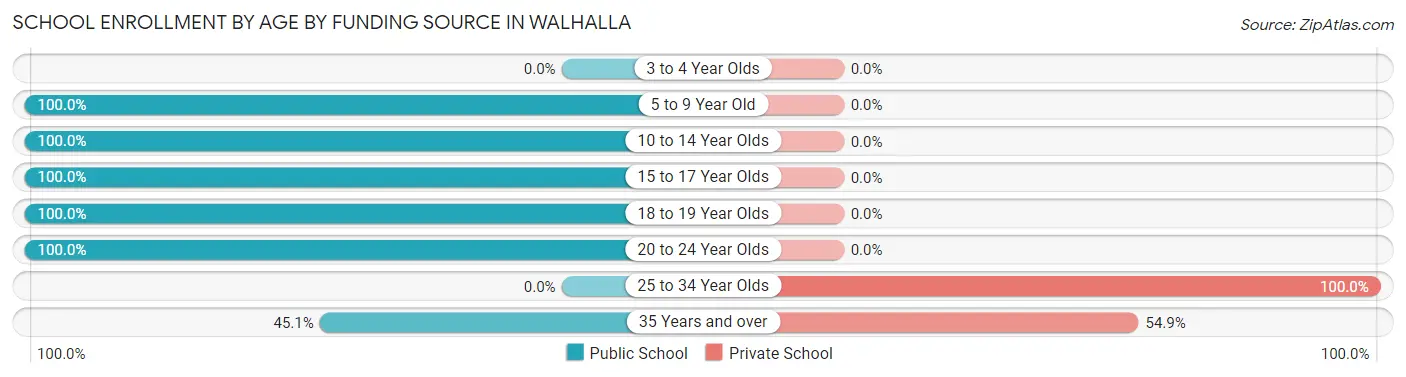
| Age Bracket | Public School | Private School |
| 3 to 4 Year Olds | 0 (0.0%) | 0 (0.0%) |
| 5 to 9 Year Old | 92 (100.0%) | 0 (0.0%) |
| 10 to 14 Year Olds | 325 (100.0%) | 0 (0.0%) |
| 15 to 17 Year Olds | 198 (100.0%) | 0 (0.0%) |
| 18 to 19 Year Olds | 117 (100.0%) | 0 (0.0%) |
| 20 to 24 Year Olds | 12 (100.0%) | 0 (0.0%) |
| 25 to 34 Year Olds | 0 (0.0%) | 10 (100.0%) |
| 35 Years and over | 64 (45.1%) | 78 (54.9%) |
| Total | 808 (90.2%) | 88 (9.8%) |
Educational Attainment by Field of Study in Walhalla
Education (104 | 28.6%), business (71 | 19.6%), computers & mathematics (50 | 13.8%), bio, nature & agricultural (42 | 11.6%), and literature & languages (42 | 11.6%) are the most common fields of study among 363 individuals in Walhalla who have obtained a bachelor's degree or higher.
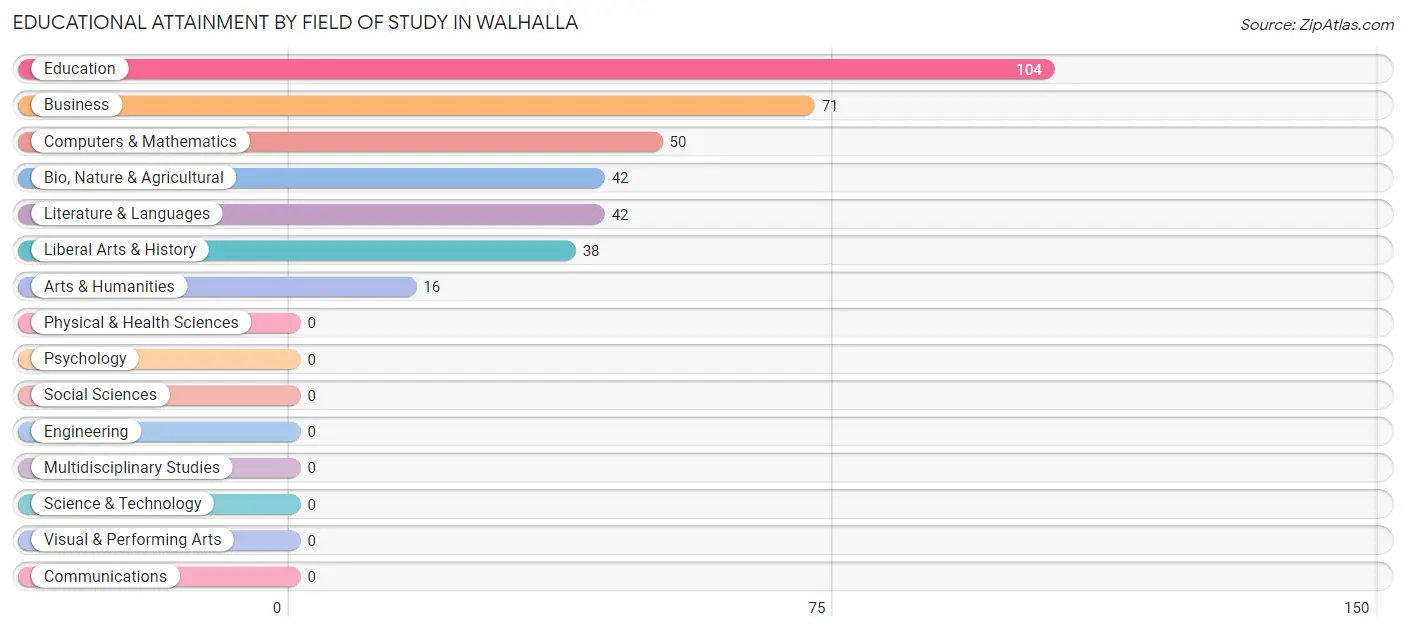
| Field of Study | # Graduates | % Graduates |
| Computers & Mathematics | 50 | 13.8% |
| Bio, Nature & Agricultural | 42 | 11.6% |
| Physical & Health Sciences | 0 | 0.0% |
| Psychology | 0 | 0.0% |
| Social Sciences | 0 | 0.0% |
| Engineering | 0 | 0.0% |
| Multidisciplinary Studies | 0 | 0.0% |
| Science & Technology | 0 | 0.0% |
| Business | 71 | 19.6% |
| Education | 104 | 28.6% |
| Literature & Languages | 42 | 11.6% |
| Liberal Arts & History | 38 | 10.5% |
| Visual & Performing Arts | 0 | 0.0% |
| Communications | 0 | 0.0% |
| Arts & Humanities | 16 | 4.4% |
| Total | 363 | 100.0% |
Transportation & Commute in Walhalla
Vehicle Availability by Sex in Walhalla
The most prevalent vehicle ownership categories in Walhalla are males with 3 vehicles (400, accounting for 46.8%) and females with 3 vehicles (127, making up 65.7%).
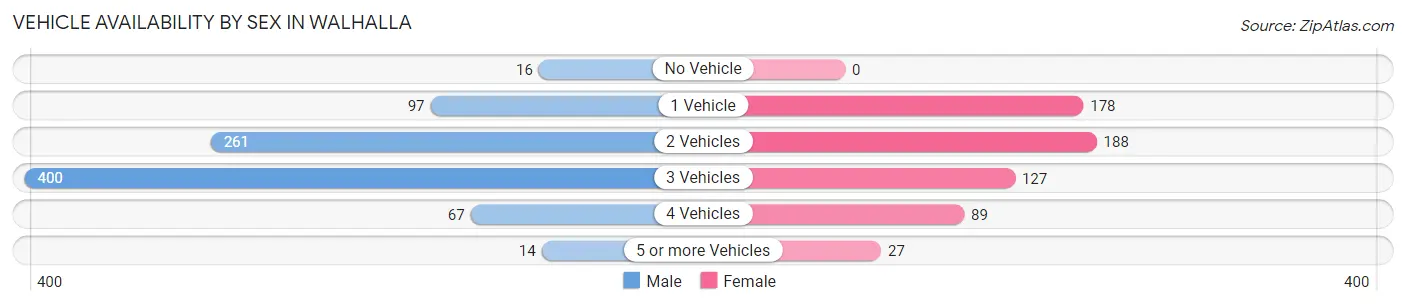
| Vehicles Available | Male | Female |
| No Vehicle | 16 (1.9%) | 0 (0.0%) |
| 1 Vehicle | 97 (11.4%) | 178 (29.2%) |
| 2 Vehicles | 261 (30.5%) | 188 (30.9%) |
| 3 Vehicles | 400 (46.8%) | 127 (20.8%) |
| 4 Vehicles | 67 (7.8%) | 89 (14.6%) |
| 5 or more Vehicles | 14 (1.6%) | 27 (4.4%) |
| Total | 855 (100.0%) | 609 (100.0%) |
Commute Time in Walhalla
The most frequently occuring commute durations in Walhalla are 10 to 14 minutes (269 commuters, 18.4%), 90 or more minutes (258 commuters, 17.6%), and 15 to 19 minutes (232 commuters, 15.9%).
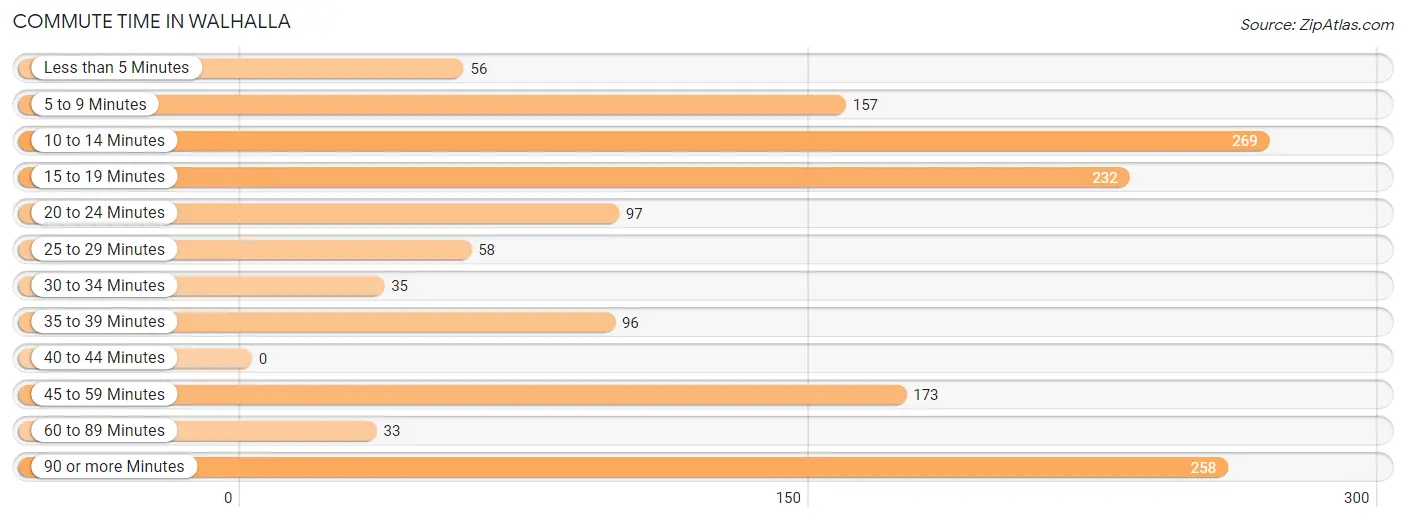
| Commute Time | # Commuters | % Commuters |
| Less than 5 Minutes | 56 | 3.8% |
| 5 to 9 Minutes | 157 | 10.7% |
| 10 to 14 Minutes | 269 | 18.4% |
| 15 to 19 Minutes | 232 | 15.9% |
| 20 to 24 Minutes | 97 | 6.6% |
| 25 to 29 Minutes | 58 | 4.0% |
| 30 to 34 Minutes | 35 | 2.4% |
| 35 to 39 Minutes | 96 | 6.6% |
| 40 to 44 Minutes | 0 | 0.0% |
| 45 to 59 Minutes | 173 | 11.8% |
| 60 to 89 Minutes | 33 | 2.2% |
| 90 or more Minutes | 258 | 17.6% |
Commute Time by Sex in Walhalla
The most common commute times in Walhalla are 90 or more minutes (258 commuters, 30.2%) for males and 45 to 59 minutes (157 commuters, 25.8%) for females.
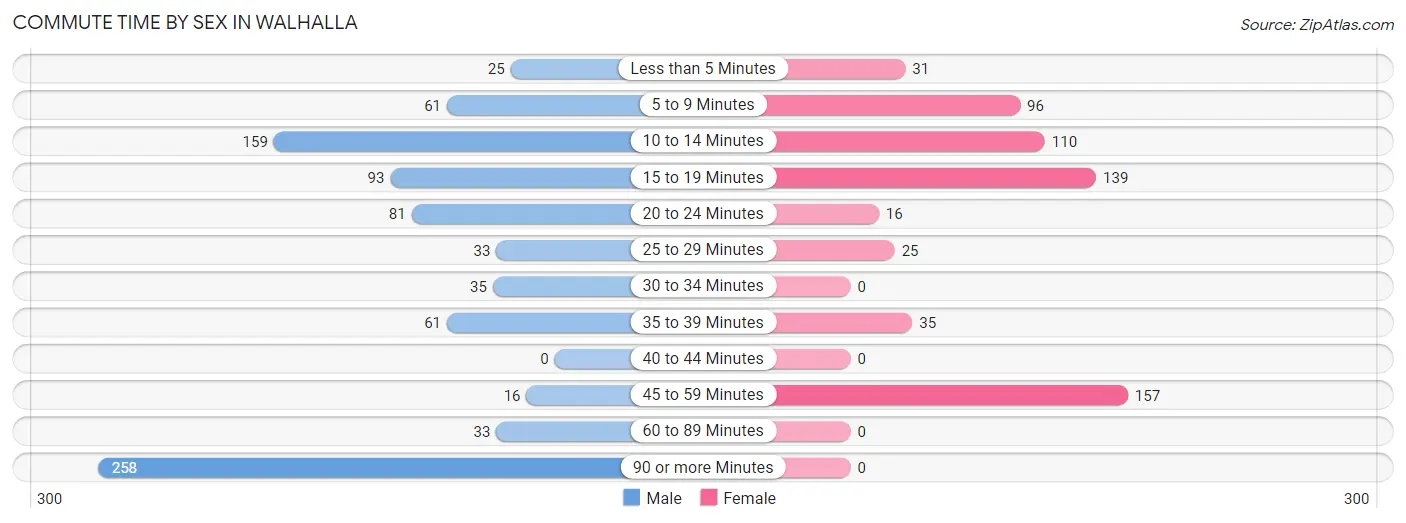
| Commute Time | Male | Female |
| Less than 5 Minutes | 25 (2.9%) | 31 (5.1%) |
| 5 to 9 Minutes | 61 (7.1%) | 96 (15.8%) |
| 10 to 14 Minutes | 159 (18.6%) | 110 (18.1%) |
| 15 to 19 Minutes | 93 (10.9%) | 139 (22.8%) |
| 20 to 24 Minutes | 81 (9.5%) | 16 (2.6%) |
| 25 to 29 Minutes | 33 (3.9%) | 25 (4.1%) |
| 30 to 34 Minutes | 35 (4.1%) | 0 (0.0%) |
| 35 to 39 Minutes | 61 (7.1%) | 35 (5.8%) |
| 40 to 44 Minutes | 0 (0.0%) | 0 (0.0%) |
| 45 to 59 Minutes | 16 (1.9%) | 157 (25.8%) |
| 60 to 89 Minutes | 33 (3.9%) | 0 (0.0%) |
| 90 or more Minutes | 258 (30.2%) | 0 (0.0%) |
Time of Departure to Work by Sex in Walhalla
The most frequent times of departure to work in Walhalla are 6:00 AM to 6:29 AM (321, 37.5%) for males and 7:00 AM to 7:29 AM (217, 35.6%) for females.
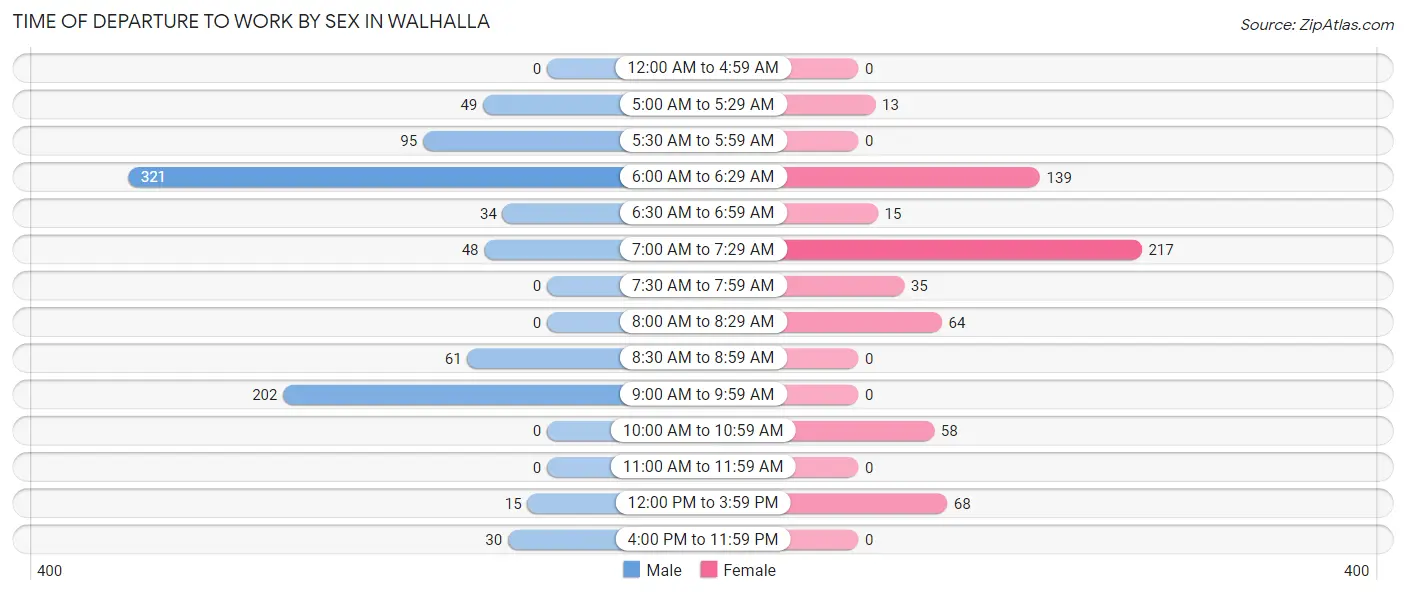
| Time of Departure | Male | Female |
| 12:00 AM to 4:59 AM | 0 (0.0%) | 0 (0.0%) |
| 5:00 AM to 5:29 AM | 49 (5.7%) | 13 (2.1%) |
| 5:30 AM to 5:59 AM | 95 (11.1%) | 0 (0.0%) |
| 6:00 AM to 6:29 AM | 321 (37.5%) | 139 (22.8%) |
| 6:30 AM to 6:59 AM | 34 (4.0%) | 15 (2.5%) |
| 7:00 AM to 7:29 AM | 48 (5.6%) | 217 (35.6%) |
| 7:30 AM to 7:59 AM | 0 (0.0%) | 35 (5.8%) |
| 8:00 AM to 8:29 AM | 0 (0.0%) | 64 (10.5%) |
| 8:30 AM to 8:59 AM | 61 (7.1%) | 0 (0.0%) |
| 9:00 AM to 9:59 AM | 202 (23.6%) | 0 (0.0%) |
| 10:00 AM to 10:59 AM | 0 (0.0%) | 58 (9.5%) |
| 11:00 AM to 11:59 AM | 0 (0.0%) | 0 (0.0%) |
| 12:00 PM to 3:59 PM | 15 (1.8%) | 68 (11.2%) |
| 4:00 PM to 11:59 PM | 30 (3.5%) | 0 (0.0%) |
| Total | 855 (100.0%) | 609 (100.0%) |
Housing Occupancy in Walhalla
Occupancy by Ownership in Walhalla
Of the total 1,572 dwellings in Walhalla, owner-occupied units account for 962 (61.2%), while renter-occupied units make up 610 (38.8%).
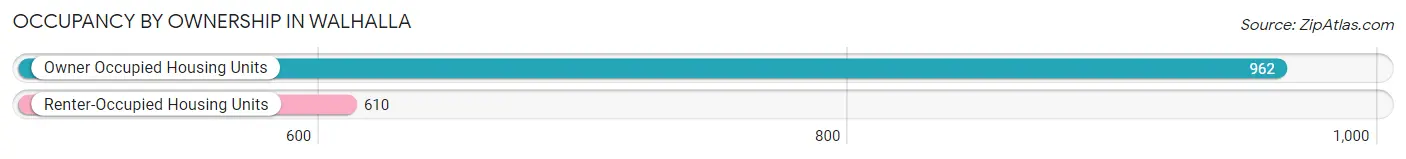
| Occupancy | # Housing Units | % Housing Units |
| Owner Occupied Housing Units | 962 | 61.2% |
| Renter-Occupied Housing Units | 610 | 38.8% |
| Total Occupied Housing Units | 1,572 | 100.0% |
Occupancy by Household Size in Walhalla
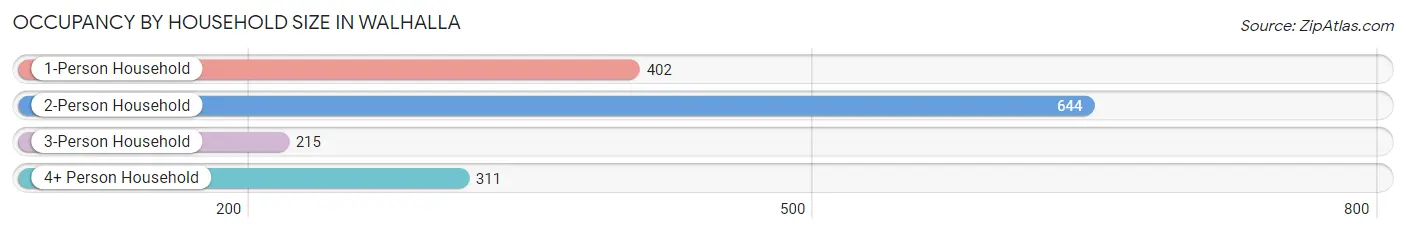
| Household Size | # Housing Units | % Housing Units |
| 1-Person Household | 402 | 25.6% |
| 2-Person Household | 644 | 41.0% |
| 3-Person Household | 215 | 13.7% |
| 4+ Person Household | 311 | 19.8% |
| Total Housing Units | 1,572 | 100.0% |
Occupancy by Ownership by Household Size in Walhalla
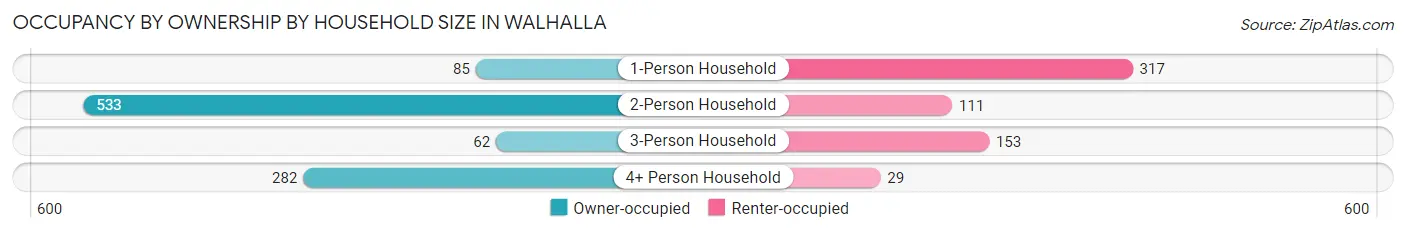
| Household Size | Owner-occupied | Renter-occupied |
| 1-Person Household | 85 (21.1%) | 317 (78.9%) |
| 2-Person Household | 533 (82.8%) | 111 (17.2%) |
| 3-Person Household | 62 (28.8%) | 153 (71.2%) |
| 4+ Person Household | 282 (90.7%) | 29 (9.3%) |
| Total Housing Units | 962 (61.2%) | 610 (38.8%) |
Occupancy by Educational Attainment in Walhalla
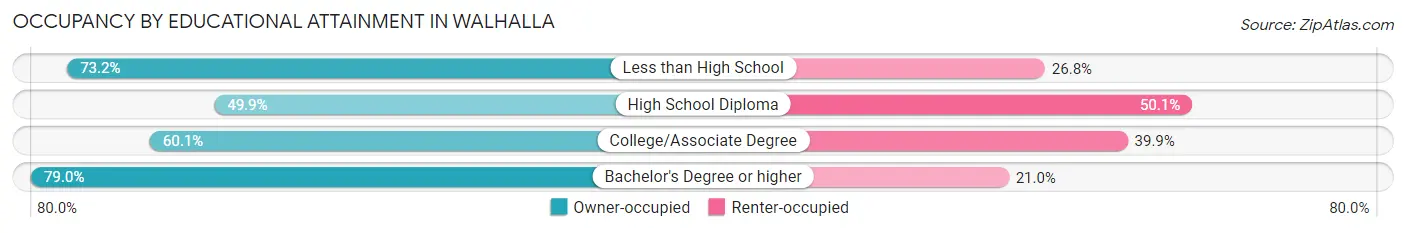
| Household Size | Owner-occupied | Renter-occupied |
| Less than High School | 249 (73.2%) | 91 (26.8%) |
| High School Diploma | 280 (49.9%) | 281 (50.1%) |
| College/Associate Degree | 309 (60.1%) | 205 (39.9%) |
| Bachelor's Degree or higher | 124 (79.0%) | 33 (21.0%) |
Occupancy by Age of Householder in Walhalla
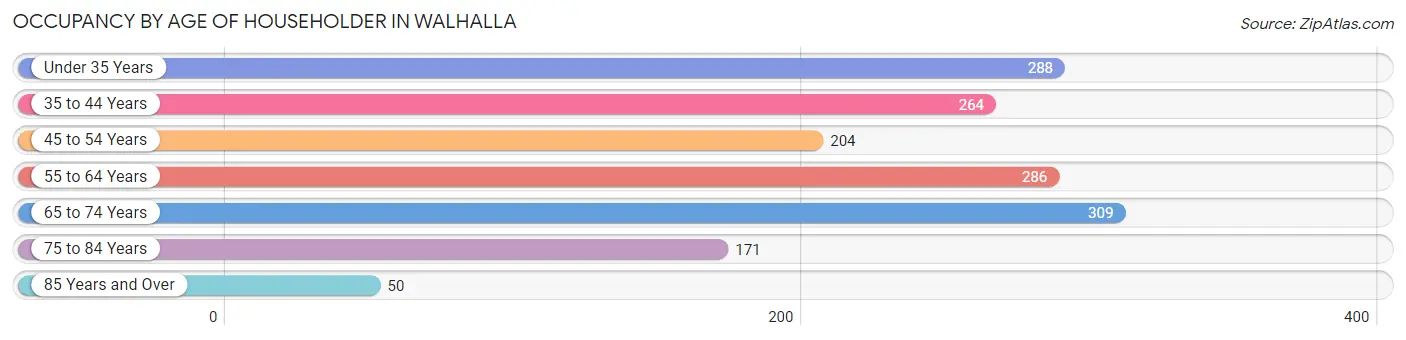
| Age Bracket | # Households | % Households |
| Under 35 Years | 288 | 18.3% |
| 35 to 44 Years | 264 | 16.8% |
| 45 to 54 Years | 204 | 13.0% |
| 55 to 64 Years | 286 | 18.2% |
| 65 to 74 Years | 309 | 19.7% |
| 75 to 84 Years | 171 | 10.9% |
| 85 Years and Over | 50 | 3.2% |
| Total | 1,572 | 100.0% |
Housing Finances in Walhalla
Median Income by Occupancy in Walhalla
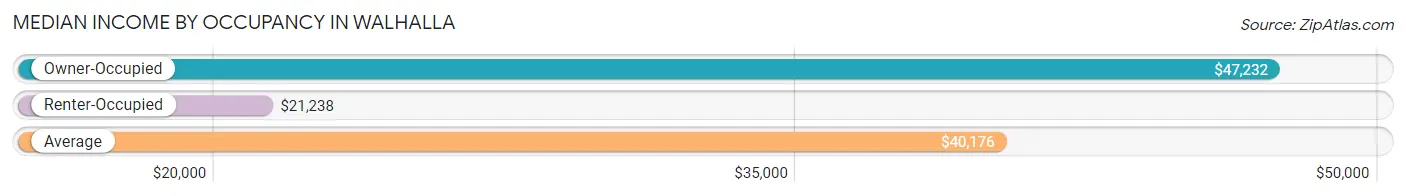
| Occupancy Type | # Households | Median Income |
| Owner-Occupied | 962 (61.2%) | $47,232 |
| Renter-Occupied | 610 (38.8%) | $21,238 |
| Average | 1,572 (100.0%) | $40,176 |
Occupancy by Householder Income Bracket in Walhalla
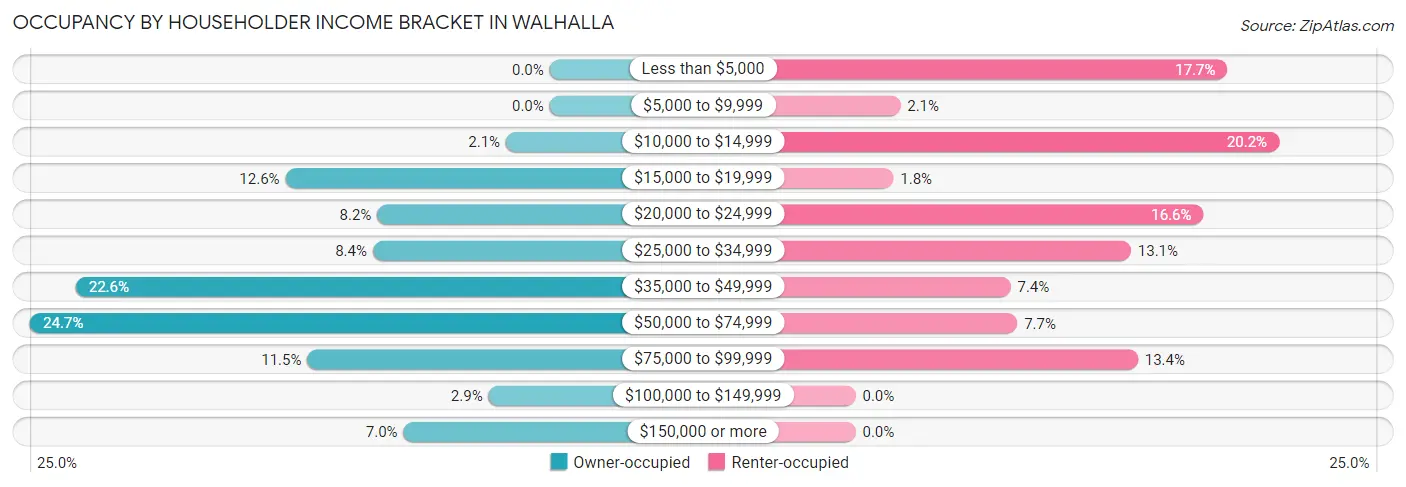
| Income Bracket | Owner-occupied | Renter-occupied |
| Less than $5,000 | 0 (0.0%) | 108 (17.7%) |
| $5,000 to $9,999 | 0 (0.0%) | 13 (2.1%) |
| $10,000 to $14,999 | 20 (2.1%) | 123 (20.2%) |
| $15,000 to $19,999 | 121 (12.6%) | 11 (1.8%) |
| $20,000 to $24,999 | 79 (8.2%) | 101 (16.6%) |
| $25,000 to $34,999 | 81 (8.4%) | 80 (13.1%) |
| $35,000 to $49,999 | 217 (22.6%) | 45 (7.4%) |
| $50,000 to $74,999 | 238 (24.7%) | 47 (7.7%) |
| $75,000 to $99,999 | 111 (11.5%) | 82 (13.4%) |
| $100,000 to $149,999 | 28 (2.9%) | 0 (0.0%) |
| $150,000 or more | 67 (7.0%) | 0 (0.0%) |
| Total | 962 (100.0%) | 610 (100.0%) |
Monthly Housing Cost Tiers in Walhalla
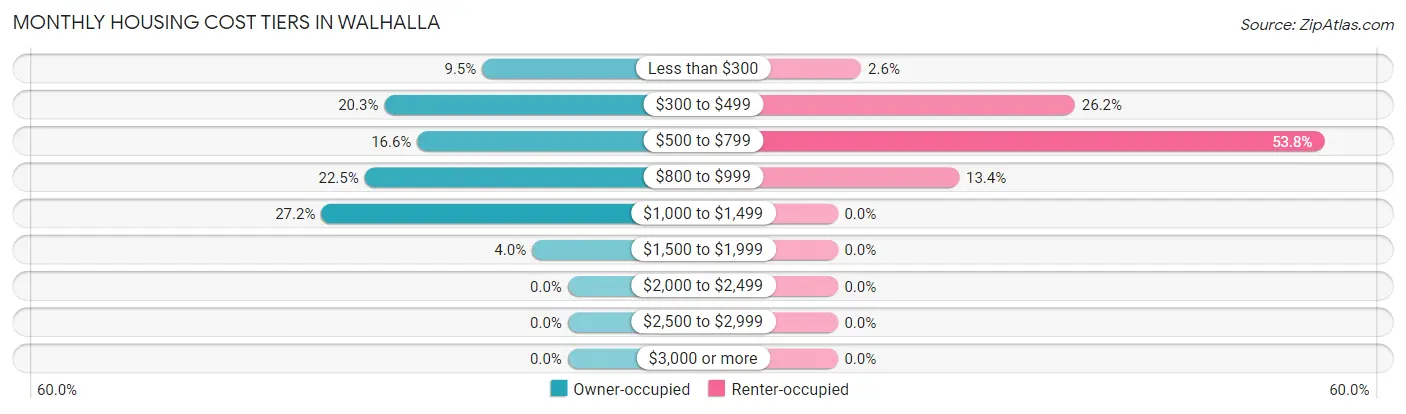
| Monthly Cost | Owner-occupied | Renter-occupied |
| Less than $300 | 91 (9.5%) | 16 (2.6%) |
| $300 to $499 | 195 (20.3%) | 160 (26.2%) |
| $500 to $799 | 160 (16.6%) | 328 (53.8%) |
| $800 to $999 | 216 (22.5%) | 82 (13.4%) |
| $1,000 to $1,499 | 262 (27.2%) | 0 (0.0%) |
| $1,500 to $1,999 | 38 (4.0%) | 0 (0.0%) |
| $2,000 to $2,499 | 0 (0.0%) | 0 (0.0%) |
| $2,500 to $2,999 | 0 (0.0%) | 0 (0.0%) |
| $3,000 or more | 0 (0.0%) | 0 (0.0%) |
| Total | 962 (100.0%) | 610 (100.0%) |
Physical Housing Characteristics in Walhalla
Housing Structures in Walhalla
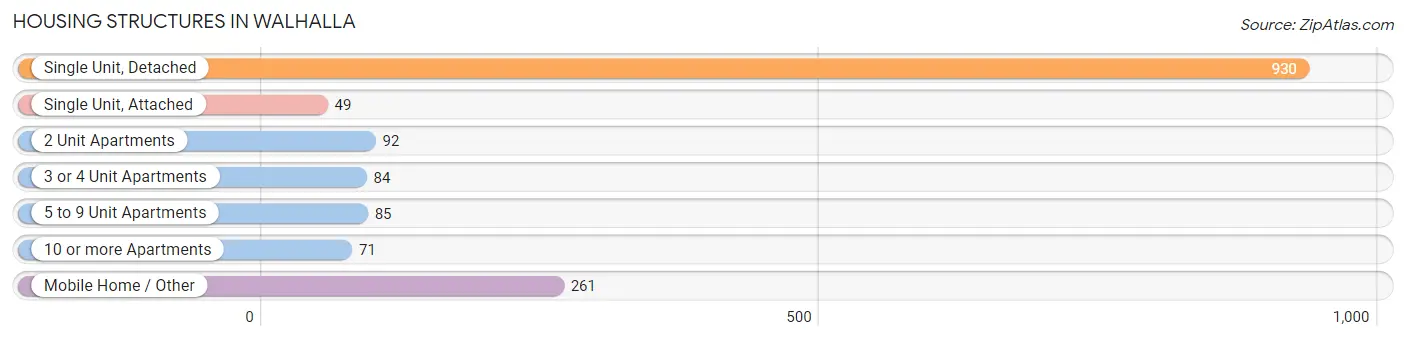
| Structure Type | # Housing Units | % Housing Units |
| Single Unit, Detached | 930 | 59.2% |
| Single Unit, Attached | 49 | 3.1% |
| 2 Unit Apartments | 92 | 5.9% |
| 3 or 4 Unit Apartments | 84 | 5.3% |
| 5 to 9 Unit Apartments | 85 | 5.4% |
| 10 or more Apartments | 71 | 4.5% |
| Mobile Home / Other | 261 | 16.6% |
| Total | 1,572 | 100.0% |
Housing Structures by Occupancy in Walhalla
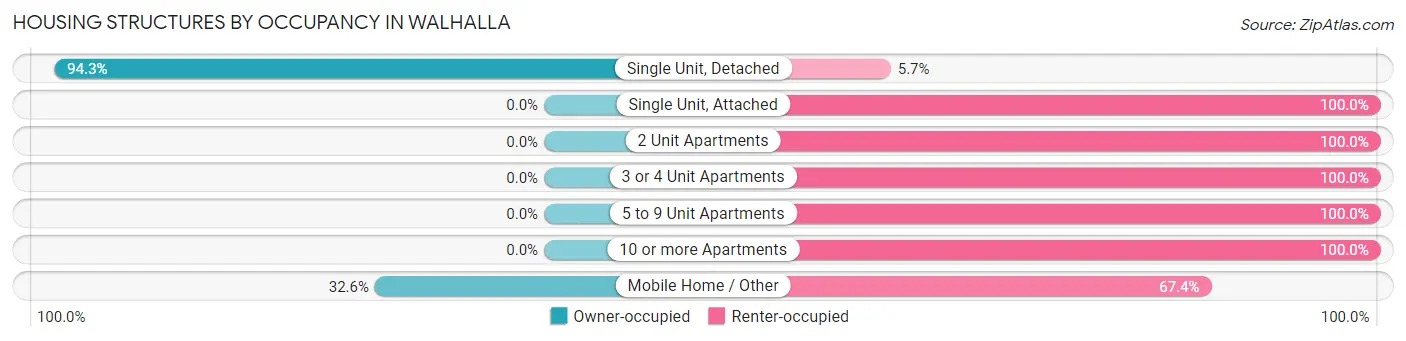
| Structure Type | Owner-occupied | Renter-occupied |
| Single Unit, Detached | 877 (94.3%) | 53 (5.7%) |
| Single Unit, Attached | 0 (0.0%) | 49 (100.0%) |
| 2 Unit Apartments | 0 (0.0%) | 92 (100.0%) |
| 3 or 4 Unit Apartments | 0 (0.0%) | 84 (100.0%) |
| 5 to 9 Unit Apartments | 0 (0.0%) | 85 (100.0%) |
| 10 or more Apartments | 0 (0.0%) | 71 (100.0%) |
| Mobile Home / Other | 85 (32.6%) | 176 (67.4%) |
| Total | 962 (61.2%) | 610 (38.8%) |
Housing Structures by Number of Rooms in Walhalla
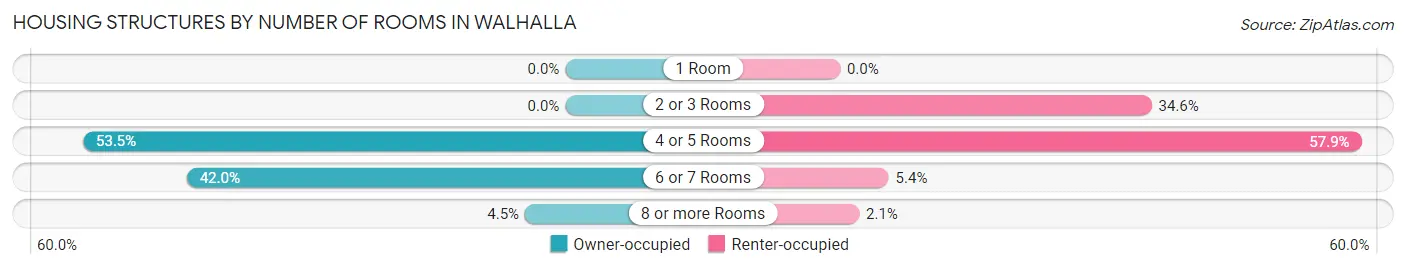
| Number of Rooms | Owner-occupied | Renter-occupied |
| 1 Room | 0 (0.0%) | 0 (0.0%) |
| 2 or 3 Rooms | 0 (0.0%) | 211 (34.6%) |
| 4 or 5 Rooms | 515 (53.5%) | 353 (57.9%) |
| 6 or 7 Rooms | 404 (42.0%) | 33 (5.4%) |
| 8 or more Rooms | 43 (4.5%) | 13 (2.1%) |
| Total | 962 (100.0%) | 610 (100.0%) |
Housing Structure by Heating Type in Walhalla
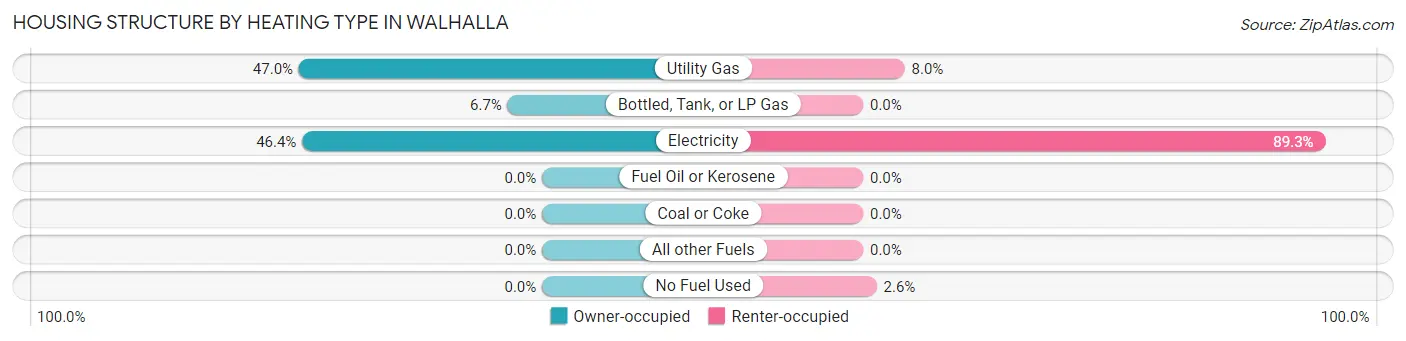
| Heating Type | Owner-occupied | Renter-occupied |
| Utility Gas | 452 (47.0%) | 49 (8.0%) |
| Bottled, Tank, or LP Gas | 64 (6.7%) | 0 (0.0%) |
| Electricity | 446 (46.4%) | 545 (89.3%) |
| Fuel Oil or Kerosene | 0 (0.0%) | 0 (0.0%) |
| Coal or Coke | 0 (0.0%) | 0 (0.0%) |
| All other Fuels | 0 (0.0%) | 0 (0.0%) |
| No Fuel Used | 0 (0.0%) | 16 (2.6%) |
| Total | 962 (100.0%) | 610 (100.0%) |
Household Vehicle Usage in Walhalla
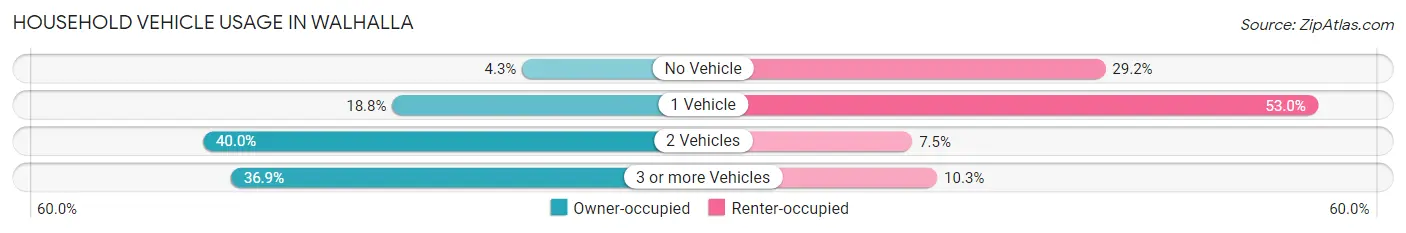
| Vehicles per Household | Owner-occupied | Renter-occupied |
| No Vehicle | 41 (4.3%) | 178 (29.2%) |
| 1 Vehicle | 181 (18.8%) | 323 (52.9%) |
| 2 Vehicles | 385 (40.0%) | 46 (7.5%) |
| 3 or more Vehicles | 355 (36.9%) | 63 (10.3%) |
| Total | 962 (100.0%) | 610 (100.0%) |
Real Estate & Mortgages in Walhalla
Real Estate and Mortgage Overview in Walhalla
| Characteristic | Without Mortgage | With Mortgage |
| Housing Units | 434 | 528 |
| Median Property Value | $160,200 | $158,100 |
| Median Household Income | $46,161 | $4 |
| Monthly Housing Costs | $410 | $0 |
| Real Estate Taxes | $805 | $0 |
Property Value by Mortgage Status in Walhalla
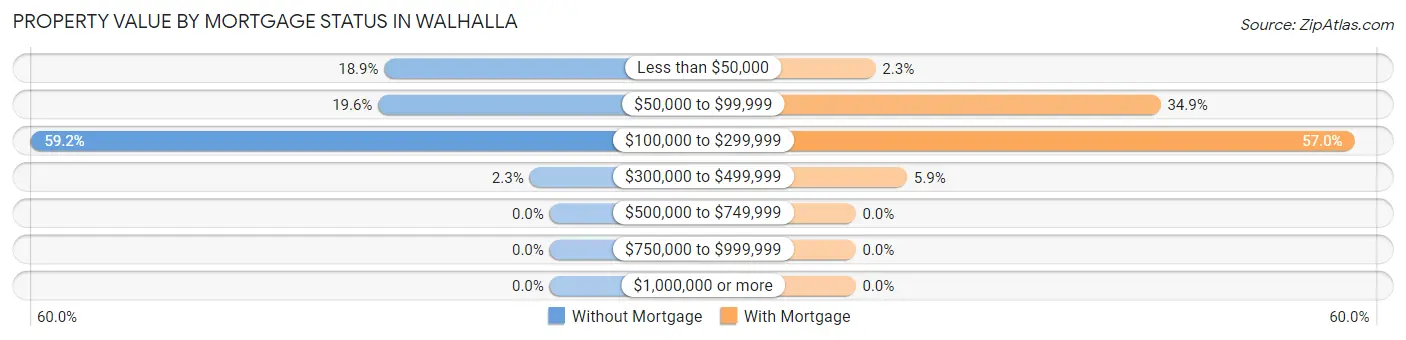
| Property Value | Without Mortgage | With Mortgage |
| Less than $50,000 | 82 (18.9%) | 12 (2.3%) |
| $50,000 to $99,999 | 85 (19.6%) | 184 (34.8%) |
| $100,000 to $299,999 | 257 (59.2%) | 301 (57.0%) |
| $300,000 to $499,999 | 10 (2.3%) | 31 (5.9%) |
| $500,000 to $749,999 | 0 (0.0%) | 0 (0.0%) |
| $750,000 to $999,999 | 0 (0.0%) | 0 (0.0%) |
| $1,000,000 or more | 0 (0.0%) | 0 (0.0%) |
| Total | 434 (100.0%) | 528 (100.0%) |
Household Income by Mortgage Status in Walhalla
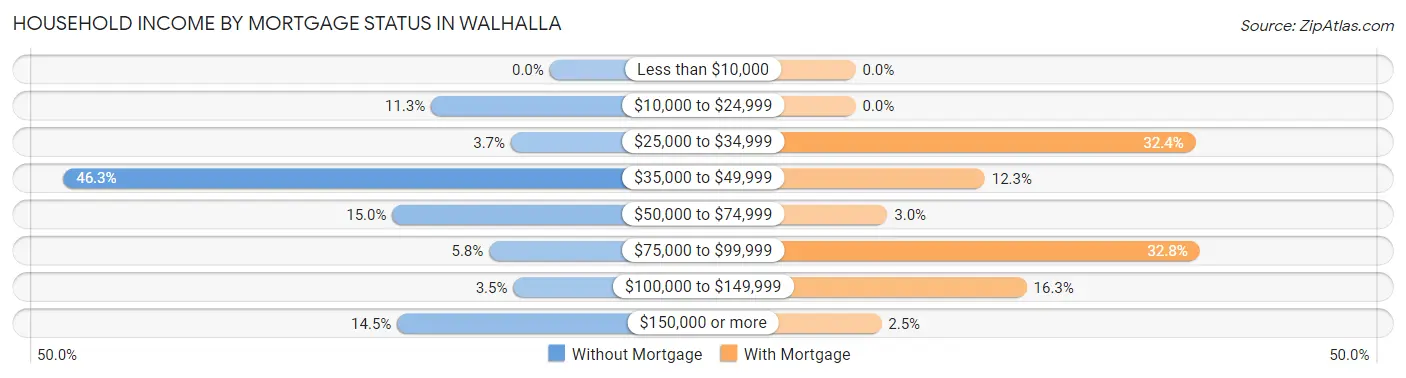
| Household Income | Without Mortgage | With Mortgage |
| Less than $10,000 | 0 (0.0%) | 0 (0.0%) |
| $10,000 to $24,999 | 49 (11.3%) | 0 (0.0%) |
| $25,000 to $34,999 | 16 (3.7%) | 171 (32.4%) |
| $35,000 to $49,999 | 201 (46.3%) | 65 (12.3%) |
| $50,000 to $74,999 | 65 (15.0%) | 16 (3.0%) |
| $75,000 to $99,999 | 25 (5.8%) | 173 (32.8%) |
| $100,000 to $149,999 | 15 (3.5%) | 86 (16.3%) |
| $150,000 or more | 63 (14.5%) | 13 (2.5%) |
| Total | 434 (100.0%) | 528 (100.0%) |
Property Value to Household Income Ratio in Walhalla
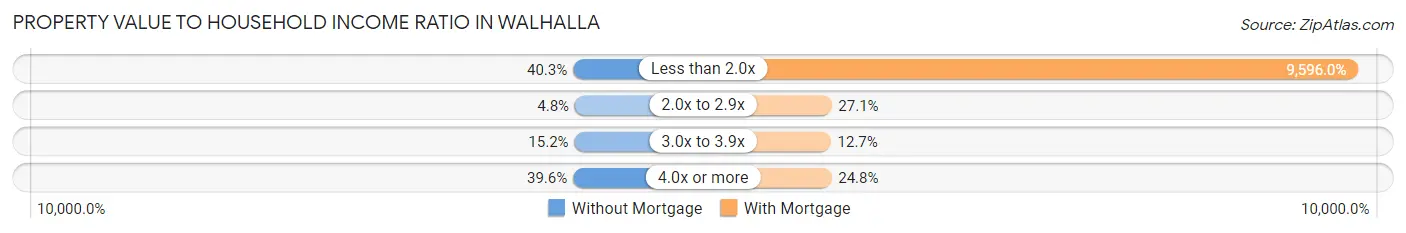
| Value-to-Income Ratio | Without Mortgage | With Mortgage |
| Less than 2.0x | 175 (40.3%) | 50,667 (9,596.0%) |
| 2.0x to 2.9x | 21 (4.8%) | 143 (27.1%) |
| 3.0x to 3.9x | 66 (15.2%) | 67 (12.7%) |
| 4.0x or more | 172 (39.6%) | 131 (24.8%) |
| Total | 434 (100.0%) | 528 (100.0%) |
Real Estate Taxes by Mortgage Status in Walhalla
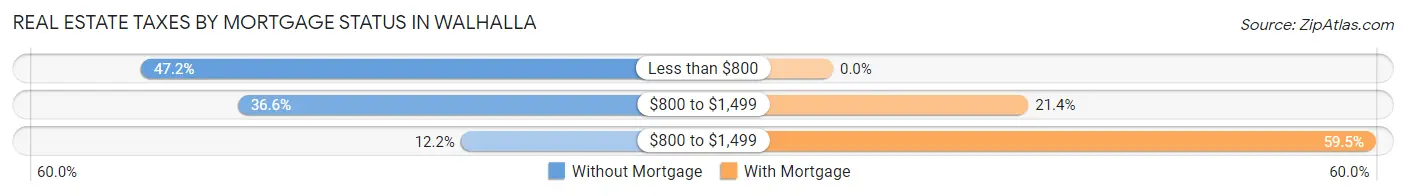
| Property Taxes | Without Mortgage | With Mortgage |
| Less than $800 | 205 (47.2%) | 0 (0.0%) |
| $800 to $1,499 | 159 (36.6%) | 113 (21.4%) |
| $800 to $1,499 | 53 (12.2%) | 314 (59.5%) |
| Total | 434 (100.0%) | 528 (100.0%) |
Health & Disability in Walhalla
Health Insurance Coverage by Age in Walhalla
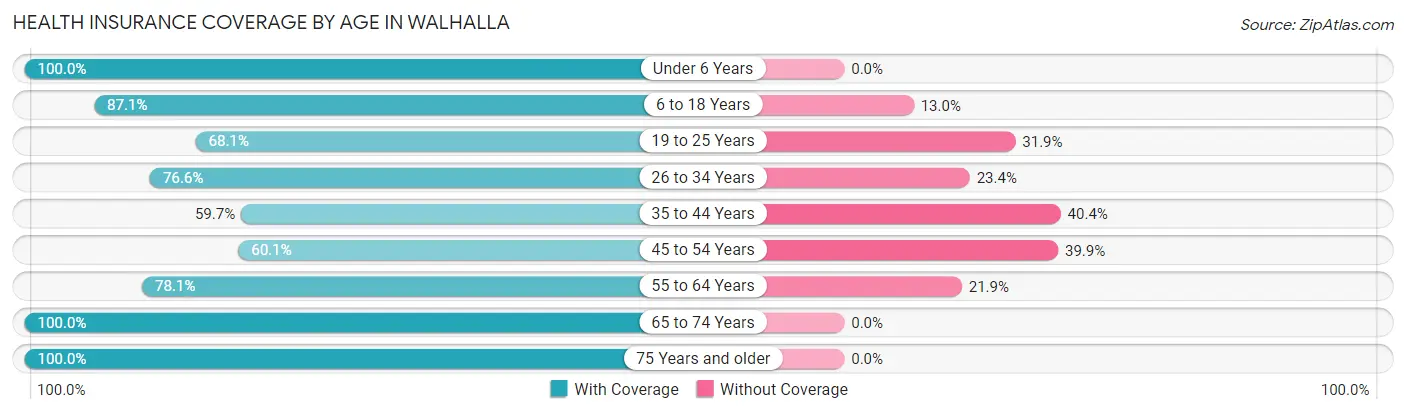
| Age Bracket | With Coverage | Without Coverage |
| Under 6 Years | 88 (100.0%) | 0 (0.0%) |
| 6 to 18 Years | 659 (87.1%) | 98 (13.0%) |
| 19 to 25 Years | 143 (68.1%) | 67 (31.9%) |
| 26 to 34 Years | 429 (76.6%) | 131 (23.4%) |
| 35 to 44 Years | 380 (59.7%) | 257 (40.4%) |
| 45 to 54 Years | 249 (60.1%) | 165 (39.9%) |
| 55 to 64 Years | 303 (78.1%) | 85 (21.9%) |
| 65 to 74 Years | 559 (100.0%) | 0 (0.0%) |
| 75 Years and older | 340 (100.0%) | 0 (0.0%) |
| Total | 3,150 (79.7%) | 803 (20.3%) |
Health Insurance Coverage by Citizenship Status in Walhalla
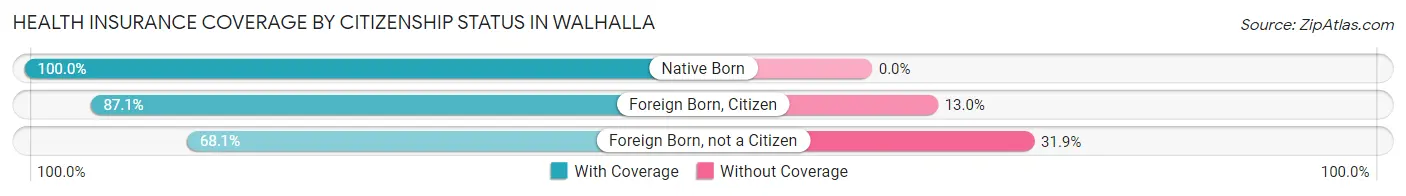
| Citizenship Status | With Coverage | Without Coverage |
| Native Born | 88 (100.0%) | 0 (0.0%) |
| Foreign Born, Citizen | 659 (87.1%) | 98 (13.0%) |
| Foreign Born, not a Citizen | 143 (68.1%) | 67 (31.9%) |
Health Insurance Coverage by Household Income in Walhalla
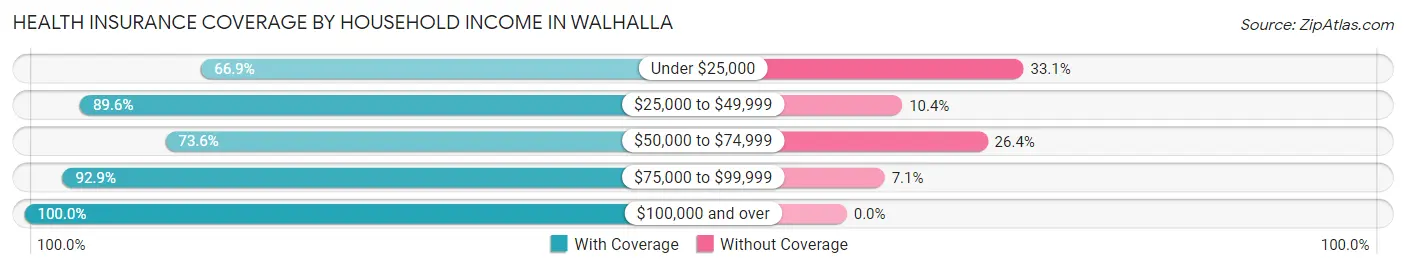
| Household Income | With Coverage | Without Coverage |
| Under $25,000 | 923 (66.9%) | 457 (33.1%) |
| $25,000 to $49,999 | 898 (89.6%) | 104 (10.4%) |
| $50,000 to $74,999 | 583 (73.6%) | 209 (26.4%) |
| $75,000 to $99,999 | 431 (92.9%) | 33 (7.1%) |
| $100,000 and over | 315 (100.0%) | 0 (0.0%) |
Public vs Private Health Insurance Coverage by Age in Walhalla
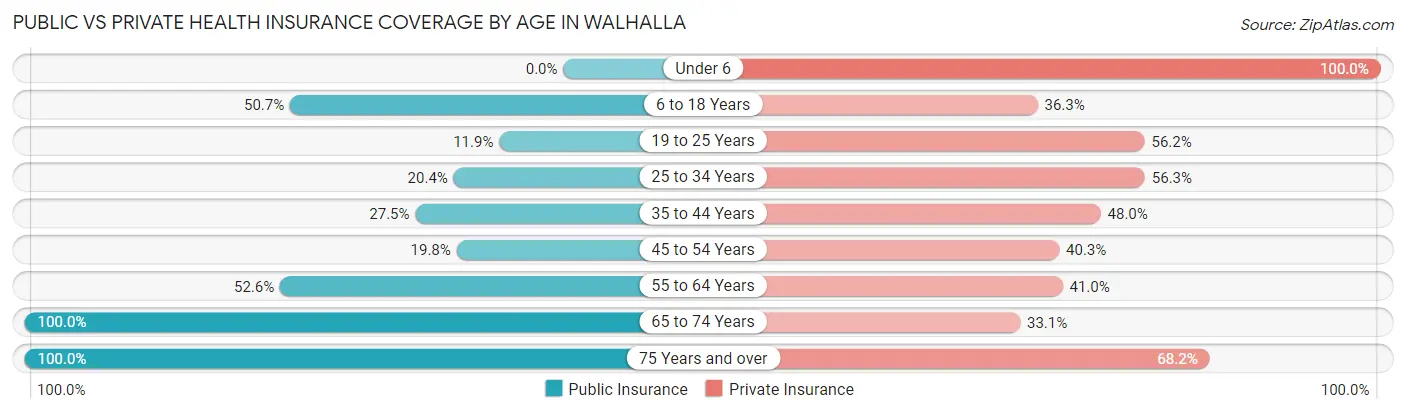
| Age Bracket | Public Insurance | Private Insurance |
| Under 6 | 0 (0.0%) | 88 (100.0%) |
| 6 to 18 Years | 384 (50.7%) | 275 (36.3%) |
| 19 to 25 Years | 25 (11.9%) | 118 (56.2%) |
| 25 to 34 Years | 114 (20.4%) | 315 (56.2%) |
| 35 to 44 Years | 175 (27.5%) | 306 (48.0%) |
| 45 to 54 Years | 82 (19.8%) | 167 (40.3%) |
| 55 to 64 Years | 204 (52.6%) | 159 (41.0%) |
| 65 to 74 Years | 559 (100.0%) | 185 (33.1%) |
| 75 Years and over | 340 (100.0%) | 232 (68.2%) |
| Total | 1,883 (47.6%) | 1,845 (46.7%) |
Disability Status by Sex by Age in Walhalla
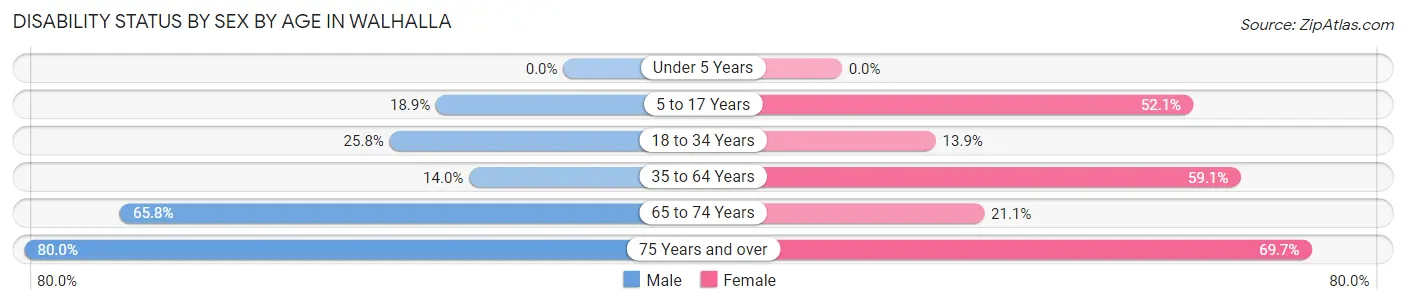
| Age Bracket | Male | Female |
| Under 5 Years | 0 (0.0%) | 0 (0.0%) |
| 5 to 17 Years | 72 (18.9%) | 122 (52.1%) |
| 18 to 34 Years | 139 (25.8%) | 52 (13.9%) |
| 35 to 64 Years | 75 (14.0%) | 534 (59.1%) |
| 65 to 74 Years | 206 (65.8%) | 52 (21.1%) |
| 75 Years and over | 132 (80.0%) | 122 (69.7%) |
Disability Class by Sex by Age in Walhalla
Disability Class: Hearing Difficulty
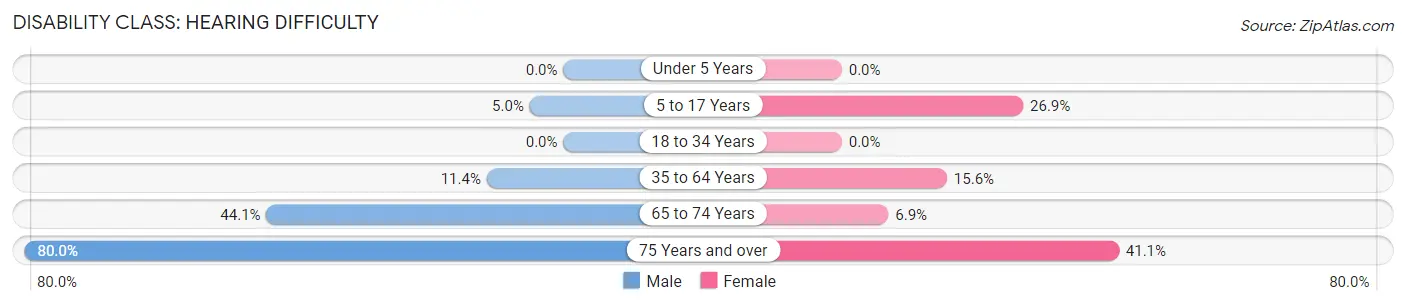
| Age Bracket | Male | Female |
| Under 5 Years | 0 (0.0%) | 0 (0.0%) |
| 5 to 17 Years | 19 (5.0%) | 63 (26.9%) |
| 18 to 34 Years | 0 (0.0%) | 0 (0.0%) |
| 35 to 64 Years | 61 (11.4%) | 141 (15.6%) |
| 65 to 74 Years | 138 (44.1%) | 17 (6.9%) |
| 75 Years and over | 132 (80.0%) | 72 (41.1%) |
Disability Class: Vision Difficulty
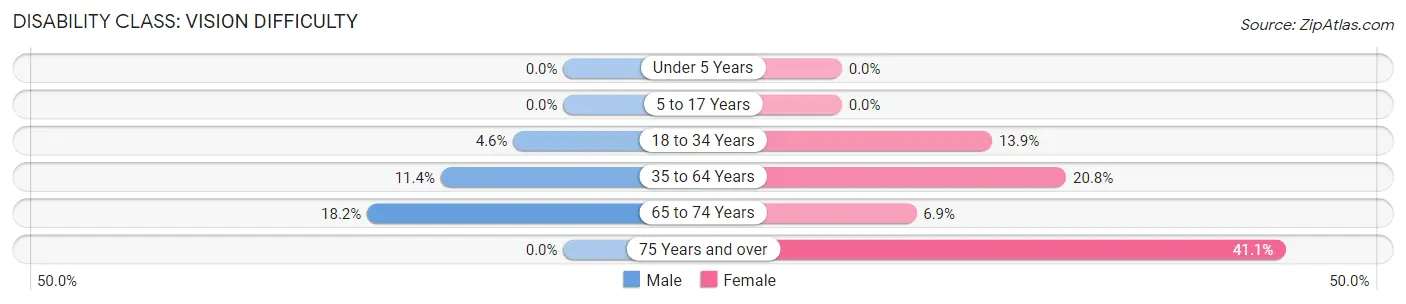
| Age Bracket | Male | Female |
| Under 5 Years | 0 (0.0%) | 0 (0.0%) |
| 5 to 17 Years | 0 (0.0%) | 0 (0.0%) |
| 18 to 34 Years | 25 (4.6%) | 52 (13.9%) |
| 35 to 64 Years | 61 (11.4%) | 188 (20.8%) |
| 65 to 74 Years | 57 (18.2%) | 17 (6.9%) |
| 75 Years and over | 0 (0.0%) | 72 (41.1%) |
Disability Class: Cognitive Difficulty
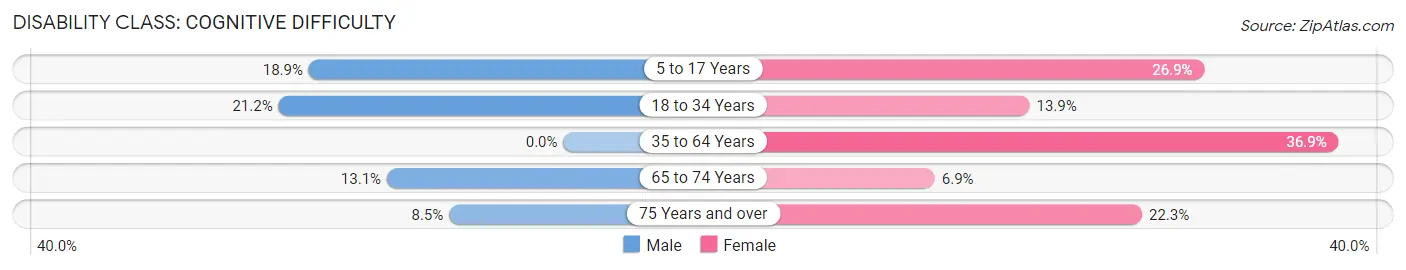
| Age Bracket | Male | Female |
| 5 to 17 Years | 72 (18.9%) | 63 (26.9%) |
| 18 to 34 Years | 114 (21.1%) | 52 (13.9%) |
| 35 to 64 Years | 0 (0.0%) | 333 (36.9%) |
| 65 to 74 Years | 41 (13.1%) | 17 (6.9%) |
| 75 Years and over | 14 (8.5%) | 39 (22.3%) |
Disability Class: Ambulatory Difficulty
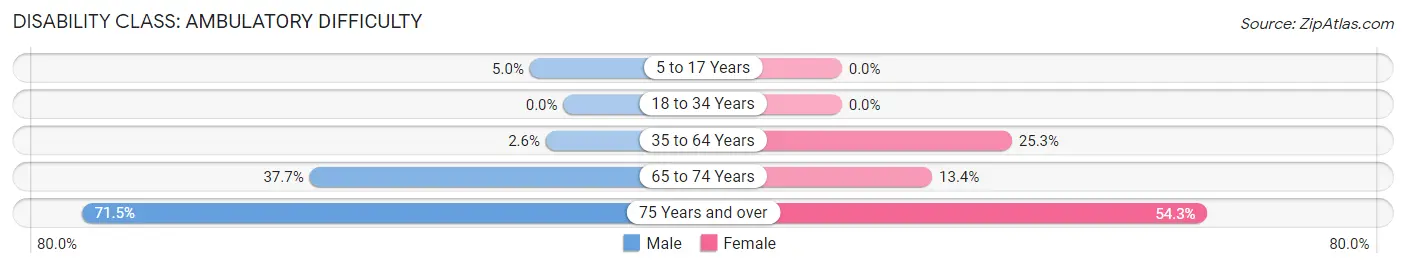
| Age Bracket | Male | Female |
| 5 to 17 Years | 19 (5.0%) | 0 (0.0%) |
| 18 to 34 Years | 0 (0.0%) | 0 (0.0%) |
| 35 to 64 Years | 14 (2.6%) | 228 (25.3%) |
| 65 to 74 Years | 118 (37.7%) | 33 (13.4%) |
| 75 Years and over | 118 (71.5%) | 95 (54.3%) |
Disability Class: Self-Care Difficulty
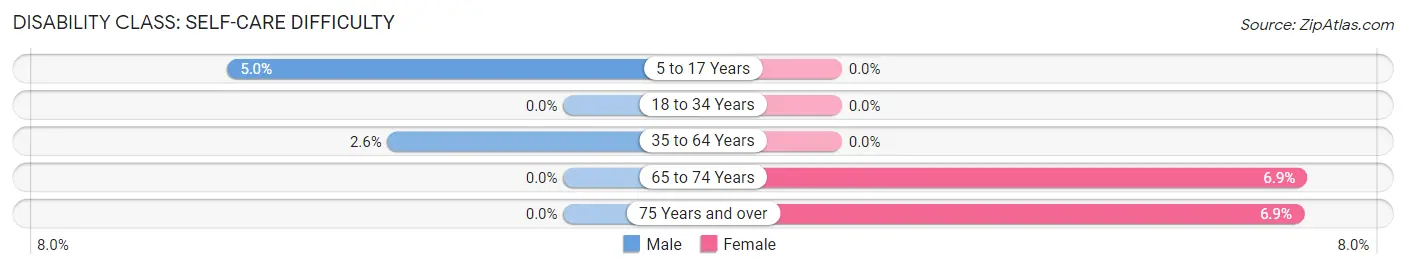
| Age Bracket | Male | Female |
| 5 to 17 Years | 19 (5.0%) | 0 (0.0%) |
| 18 to 34 Years | 0 (0.0%) | 0 (0.0%) |
| 35 to 64 Years | 14 (2.6%) | 0 (0.0%) |
| 65 to 74 Years | 0 (0.0%) | 17 (6.9%) |
| 75 Years and over | 0 (0.0%) | 12 (6.9%) |
Technology Access in Walhalla
Computing Device Access in Walhalla
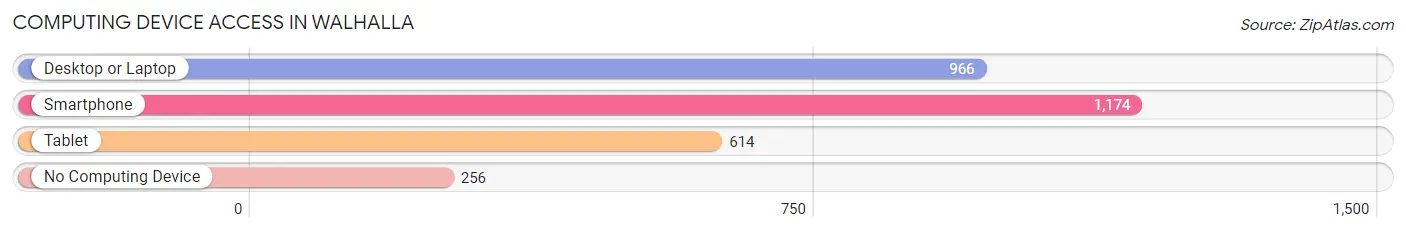
| Device Type | # Households | % Households |
| Desktop or Laptop | 966 | 61.5% |
| Smartphone | 1,174 | 74.7% |
| Tablet | 614 | 39.1% |
| No Computing Device | 256 | 16.3% |
| Total | 1,572 | 100.0% |
Internet Access in Walhalla
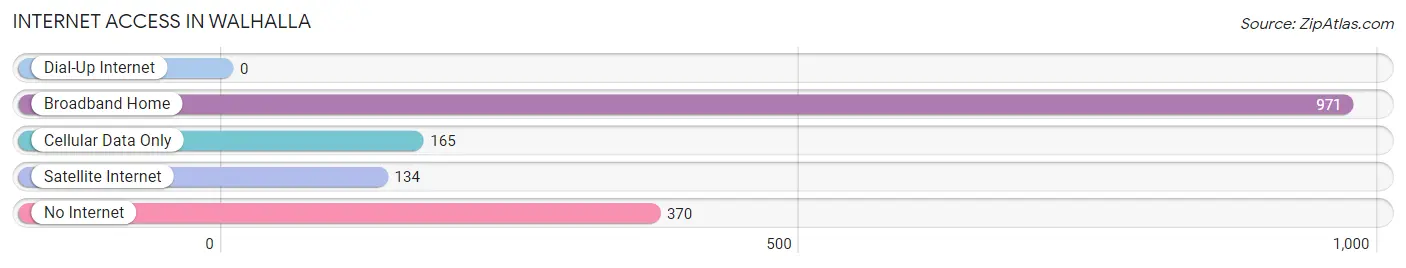
| Internet Type | # Households | % Households |
| Dial-Up Internet | 0 | 0.0% |
| Broadband Home | 971 | 61.8% |
| Cellular Data Only | 165 | 10.5% |
| Satellite Internet | 134 | 8.5% |
| No Internet | 370 | 23.5% |
| Total | 1,572 | 100.0% |
Walhalla Summary
Walhalla is a small city located in the foothills of the Blue Ridge Mountains in Oconee County, South Carolina. It is situated along the Chattooga River, which forms the border between South Carolina and Georgia. The city is part of the Greenville-Spartanburg-Anderson Combined Statistical Area, and is located approximately 30 miles west of Greenville and 50 miles northeast of Atlanta.
History
The area that is now Walhalla was first settled by German immigrants in the early 1800s. The city was founded in 1849 and named after the German city of Walhalla, which was the site of a legendary hall of heroes in Norse mythology. The city was incorporated in 1868 and was the county seat of Oconee County until the county seat was moved to nearby Seneca in 1868.
Walhalla was an important center of commerce in the late 19th and early 20th centuries. It was home to several cotton mills, a furniture factory, and a number of other businesses. The city was also home to a number of educational institutions, including the Walhalla Female College, which was founded in 1851 and closed in 1868.
Geography
Walhalla is located in the foothills of the Blue Ridge Mountains in Oconee County, South Carolina. The city is situated along the Chattooga River, which forms the border between South Carolina and Georgia. The city is located approximately 30 miles west of Greenville and 50 miles northeast of Atlanta.
The city has a total area of 4.2 square miles, all of which is land. The city is located at an elevation of 1,000 feet above sea level.
Economy
The economy of Walhalla is largely based on tourism and manufacturing. The city is home to several tourist attractions, including the Stumphouse Tunnel, a historic railroad tunnel, and the Oconee Heritage Center, a museum and cultural center. The city is also home to several manufacturing companies, including a furniture factory and a number of textile mills.
Demographics
As of the 2010 census, the population of Walhalla was 4,569. The racial makeup of the city was 87.3% White, 8.2% African American, 0.3% Native American, 0.7% Asian, 0.1% Pacific Islander, 1.2% from other races, and 2.4% from two or more races. Hispanic or Latino of any race were 3.2% of the population.
The median household income in Walhalla was $35,938, and the median family income was $45,938. The per capita income for the city was $20,938. About 15.3% of the population was below the poverty line.
Common Questions
What is Per Capita Income in Walhalla?
Per Capita income in Walhalla is $18,566.
What is the Median Family Income in Walhalla?
Median Family Income in Walhalla is $45,083.
What is the Median Household income in Walhalla?
Median Household Income in Walhalla is $40,176.
What is Income or Wage Gap in Walhalla?
Income or Wage Gap in Walhalla is 44.7%.
Women in Walhalla earn 55.3 cents for every dollar earned by a man.
What is Family Income Deficit in Walhalla?
Family Income Deficit in Walhalla is $7,034.
Families that are below poverty line in Walhalla earn $7,034 less on average than the poverty threshold level.
What is Inequality or Gini Index in Walhalla?
Inequality or Gini Index in Walhalla is 0.41.
What is the Total Population of Walhalla?
Total Population of Walhalla is 4,102.
What is the Total Male Population of Walhalla?
Total Male Population of Walhalla is 2,074.
What is the Total Female Population of Walhalla?
Total Female Population of Walhalla is 2,028.
What is the Ratio of Males per 100 Females in Walhalla?
There are 102.27 Males per 100 Females in Walhalla.
What is the Ratio of Females per 100 Males in Walhalla?
There are 97.78 Females per 100 Males in Walhalla.
What is the Median Population Age in Walhalla?
Median Population Age in Walhalla is 44.0 Years.
What is the Average Family Size in Walhalla
Average Family Size in Walhalla is 3.0 People.
What is the Average Household Size in Walhalla
Average Household Size in Walhalla is 2.5 People.
How Large is the Labor Force in Walhalla?
There are 1,629 People in the Labor Forcein in Walhalla.
What is the Percentage of People in the Labor Force in Walhalla?
46.2% of People are in the Labor Force in Walhalla.
What is the Unemployment Rate in Walhalla?
Unemployment Rate in Walhalla is 9.3%.