Campobello, SC Map & Demographics
Campobello Map
Campobello Overview
$31,041
PER CAPITA INCOME
$87,273
AVG FAMILY INCOME
$85,227
AVG HOUSEHOLD INCOME
2.1%
WAGE / INCOME GAP [ % ]
97.9¢/ $1
WAGE / INCOME GAP [ $ ]
0.43
INEQUALITY / GINI INDEX
866
TOTAL POPULATION
412
MALE POPULATION
454
FEMALE POPULATION
90.75
MALES / 100 FEMALES
110.19
FEMALES / 100 MALES
27.7
MEDIAN AGE
3.6
AVG FAMILY SIZE
3.3
AVG HOUSEHOLD SIZE
449
LABOR FORCE [ PEOPLE ]
66.0%
PERCENT IN LABOR FORCE
3.1%
UNEMPLOYMENT RATE
Campobello Zip Codes
Campobello Area Codes
Income in Campobello
Income Overview in Campobello
Per Capita Income in Campobello is $31,041, while median incomes of families and households are $87,273 and $85,227 respectively.
| Characteristic | Number | Measure |
| Per Capita Income | 866 | $31,041 |
| Median Family Income | 222 | $87,273 |
| Mean Family Income | 222 | $100,967 |
| Median Household Income | 262 | $85,227 |
| Mean Household Income | 262 | $93,933 |
| Income Deficit | 222 | $0 |
| Wage / Income Gap (%) | 866 | 2.12% |
| Wage / Income Gap ($) | 866 | 97.88¢ per $1 |
| Gini / Inequality Index | 866 | 0.43 |
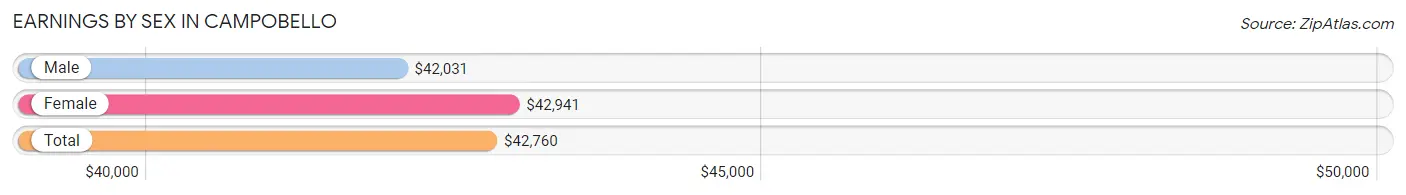
Earnings by Sex in Campobello
Average Earnings in Campobello are $42,760, $42,031 for men and $42,941 for women, a difference of 2.1%.
| Sex | Number | Average Earnings |
| Male | 229 (49.2%) | $42,031 |
| Female | 236 (50.7%) | $42,941 |
| Total | 465 (100.0%) | $42,760 |
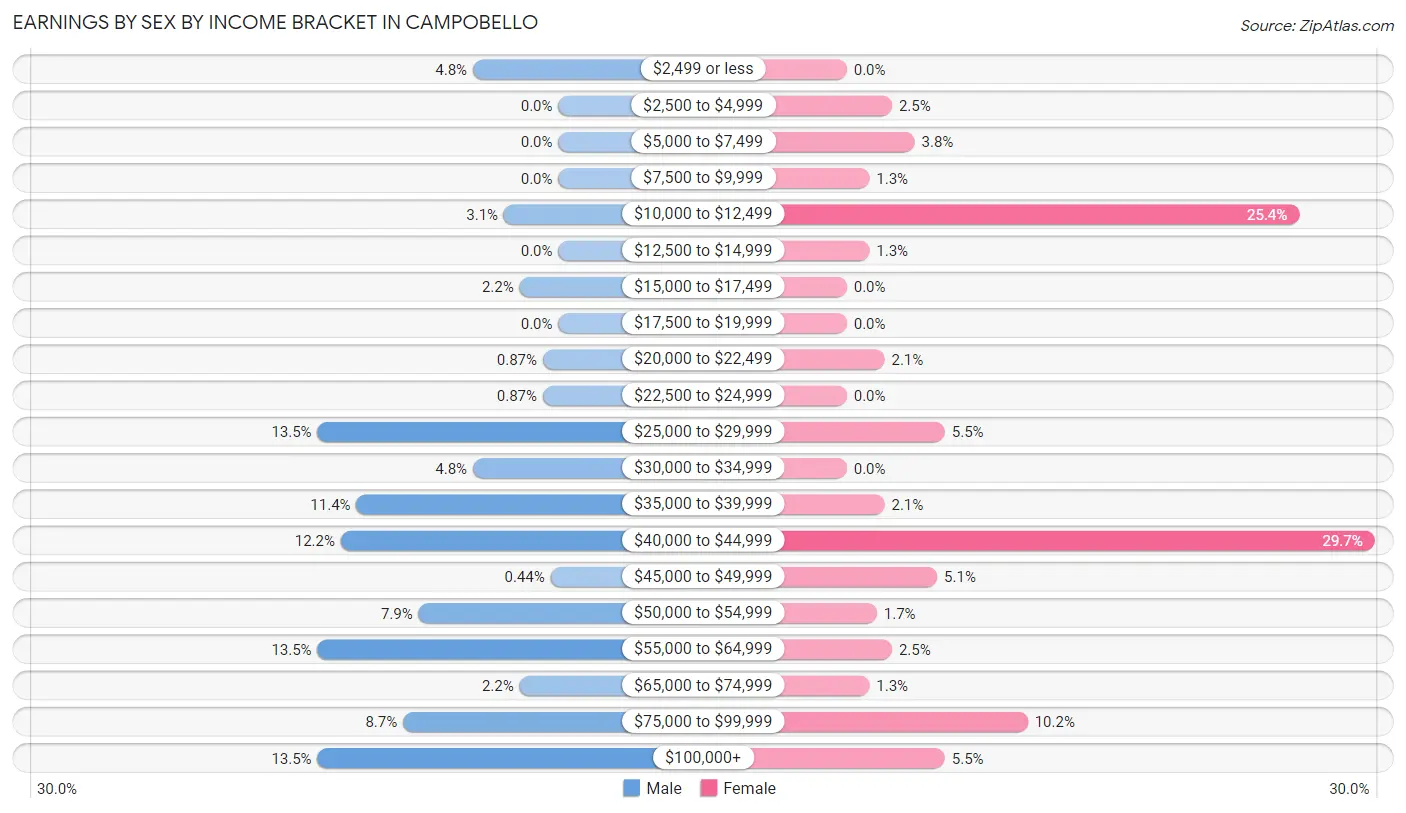
Earnings by Sex by Income Bracket in Campobello
The most common earnings brackets in Campobello are $25,000 to $29,999 for men (31 | 13.5%) and $40,000 to $44,999 for women (70 | 29.7%).
| Income | Male | Female |
| $2,499 or less | 11 (4.8%) | 0 (0.0%) |
| $2,500 to $4,999 | 0 (0.0%) | 6 (2.5%) |
| $5,000 to $7,499 | 0 (0.0%) | 9 (3.8%) |
| $7,500 to $9,999 | 0 (0.0%) | 3 (1.3%) |
| $10,000 to $12,499 | 7 (3.1%) | 60 (25.4%) |
| $12,500 to $14,999 | 0 (0.0%) | 3 (1.3%) |
| $15,000 to $17,499 | 5 (2.2%) | 0 (0.0%) |
| $17,500 to $19,999 | 0 (0.0%) | 0 (0.0%) |
| $20,000 to $22,499 | 2 (0.9%) | 5 (2.1%) |
| $22,500 to $24,999 | 2 (0.9%) | 0 (0.0%) |
| $25,000 to $29,999 | 31 (13.5%) | 13 (5.5%) |
| $30,000 to $34,999 | 11 (4.8%) | 0 (0.0%) |
| $35,000 to $39,999 | 26 (11.4%) | 5 (2.1%) |
| $40,000 to $44,999 | 28 (12.2%) | 70 (29.7%) |
| $45,000 to $49,999 | 1 (0.4%) | 12 (5.1%) |
| $50,000 to $54,999 | 18 (7.9%) | 4 (1.7%) |
| $55,000 to $64,999 | 31 (13.5%) | 6 (2.5%) |
| $65,000 to $74,999 | 5 (2.2%) | 3 (1.3%) |
| $75,000 to $99,999 | 20 (8.7%) | 24 (10.2%) |
| $100,000+ | 31 (13.5%) | 13 (5.5%) |
| Total | 229 (100.0%) | 236 (100.0%) |
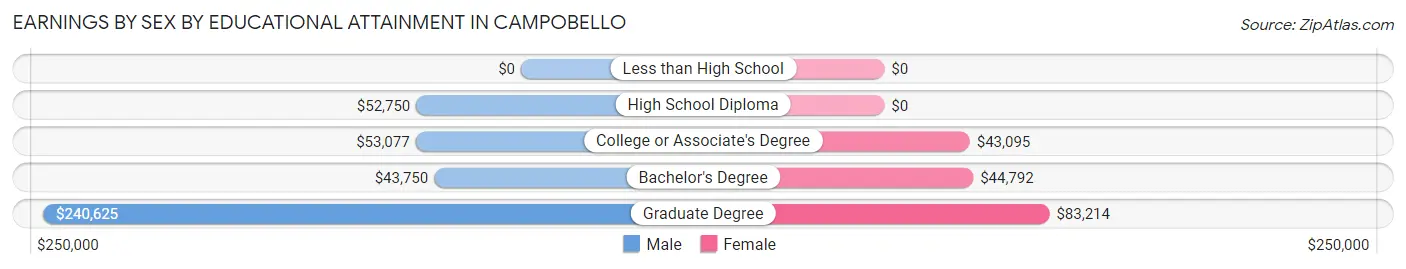
Earnings by Sex by Educational Attainment in Campobello
Average earnings in Campobello are $53,542 for men and $43,974 for women, a difference of 17.9%. Men with an educational attainment of graduate degree enjoy the highest average annual earnings of $240,625, while those with bachelor's degree education earn the least with $43,750. Women with an educational attainment of graduate degree earn the most with the average annual earnings of $83,214, while those with college or associate's degree education have the smallest earnings of $43,095.
| Educational Attainment | Male Income | Female Income |
| Less than High School | - | - |
| High School Diploma | $52,750 | $0 |
| College or Associate's Degree | $53,077 | $43,095 |
| Bachelor's Degree | $43,750 | $44,792 |
| Graduate Degree | $240,625 | $83,214 |
| Total | $53,542 | $43,974 |
Family Income in Campobello
Family Income Brackets in Campobello
According to the Campobello family income data, there are 55 families falling into the $75,000 to $99,999 income range, which is the most common income bracket and makes up 24.8% of all families.
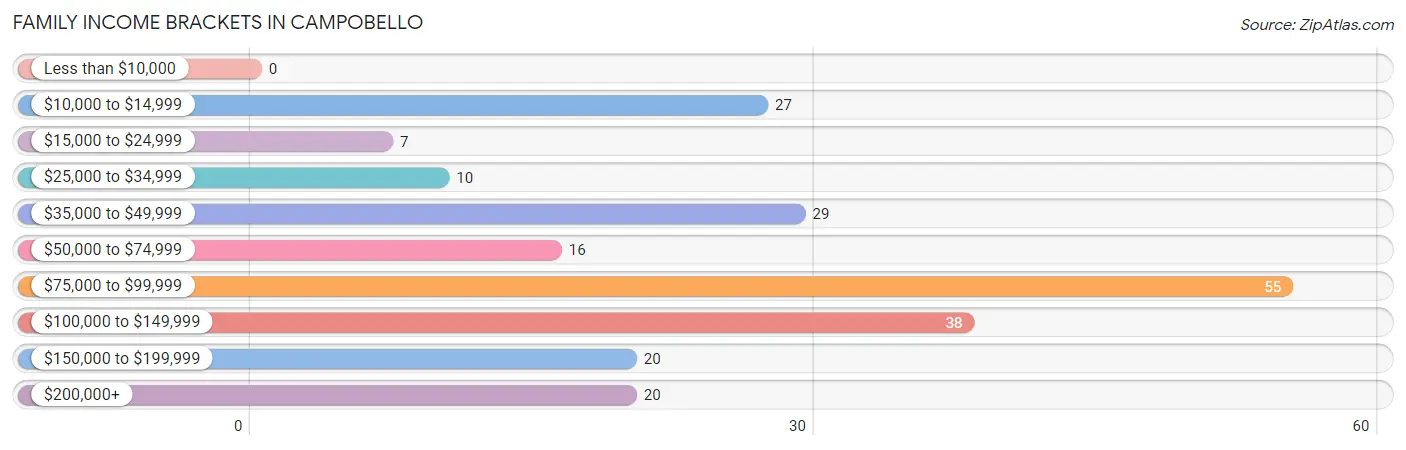
| Income Bracket | # Families | % Families |
| Less than $10,000 | 0 | 0.0% |
| $10,000 to $14,999 | 27 | 12.2% |
| $15,000 to $24,999 | 7 | 3.2% |
| $25,000 to $34,999 | 10 | 4.5% |
| $35,000 to $49,999 | 29 | 13.1% |
| $50,000 to $74,999 | 16 | 7.2% |
| $75,000 to $99,999 | 55 | 24.8% |
| $100,000 to $149,999 | 38 | 17.1% |
| $150,000 to $199,999 | 20 | 9.0% |
| $200,000+ | 20 | 9.0% |
Family Income by Famaliy Size in Campobello
4-person families (34 | 15.3%) account for the highest median family income in Campobello with $144,643 per family, while 3-person families (56 | 25.2%) have the highest median income of $38,974 per family member.
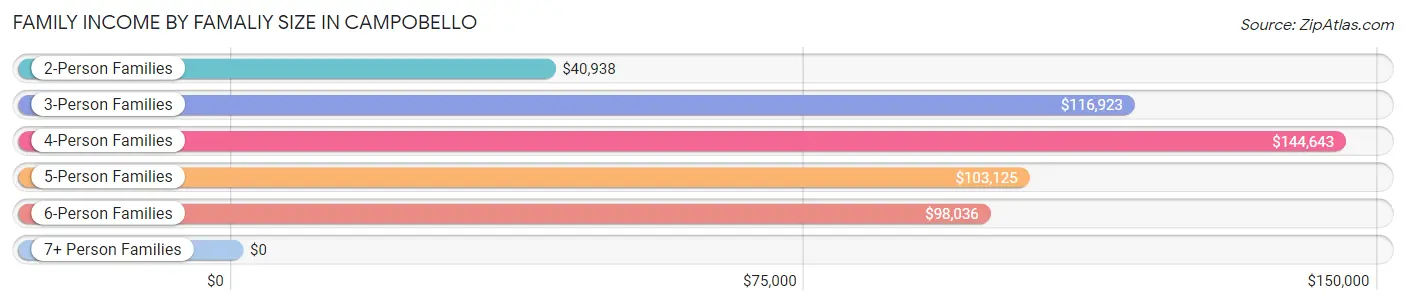
| Income Bracket | # Families | Median Income |
| 2-Person Families | 87 (39.2%) | $40,938 |
| 3-Person Families | 56 (25.2%) | $116,923 |
| 4-Person Families | 34 (15.3%) | $144,643 |
| 5-Person Families | 12 (5.4%) | $103,125 |
| 6-Person Families | 33 (14.9%) | $98,036 |
| 7+ Person Families | 0 (0.0%) | $0 |
| Total | 222 (100.0%) | $87,273 |
Family Income by Number of Earners in Campobello
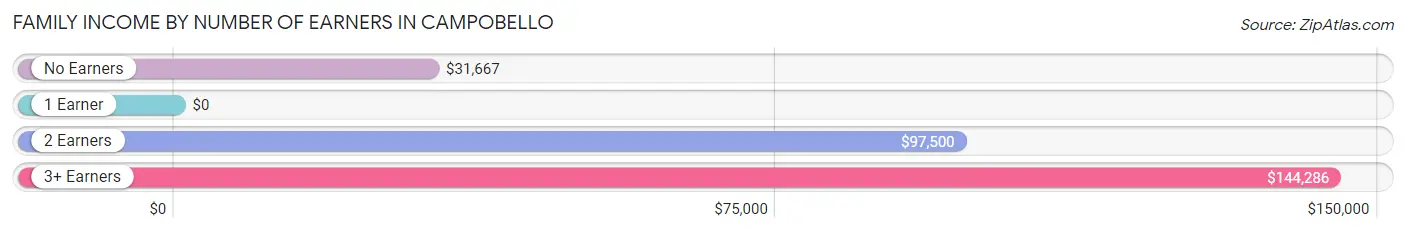
| Number of Earners | # Families | Median Income |
| No Earners | 30 (13.5%) | $31,667 |
| 1 Earner | 58 (26.1%) | $0 |
| 2 Earners | 78 (35.1%) | $97,500 |
| 3+ Earners | 56 (25.2%) | $144,286 |
| Total | 222 (100.0%) | $87,273 |
Household Income in Campobello
Household Income Brackets in Campobello
With 59 households falling in the category, the $75,000 to $99,999 income range is the most frequent in Campobello, accounting for 22.5% of all households. In contrast, only 6 households (2.3%) fall into the less than $10,000 income bracket, making it the least populous group.
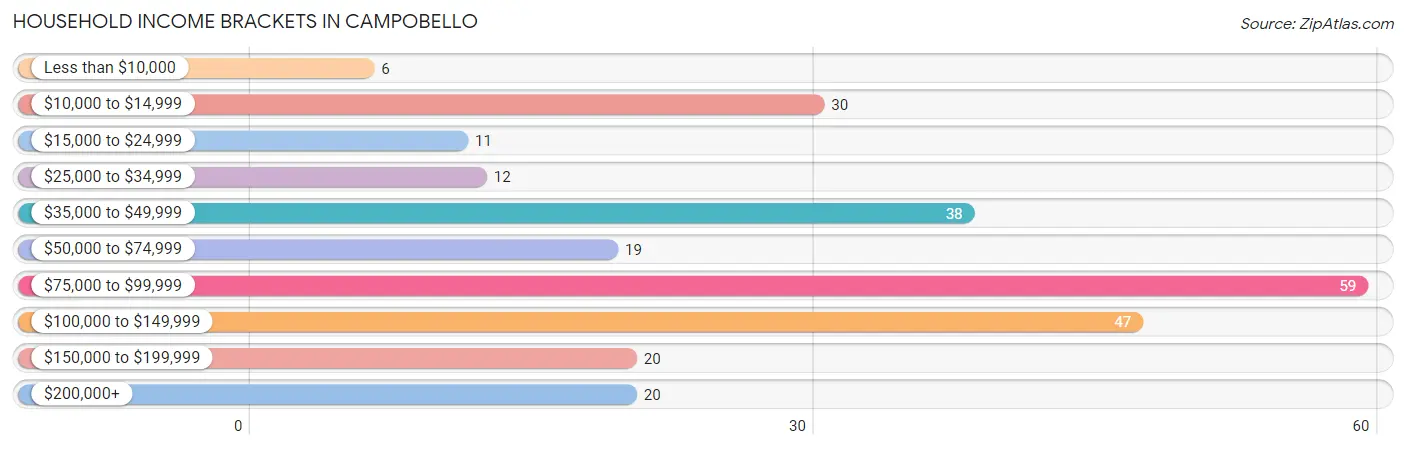
| Income Bracket | # Households | % Households |
| Less than $10,000 | 6 | 2.3% |
| $10,000 to $14,999 | 30 | 11.5% |
| $15,000 to $24,999 | 11 | 4.2% |
| $25,000 to $34,999 | 12 | 4.6% |
| $35,000 to $49,999 | 38 | 14.5% |
| $50,000 to $74,999 | 19 | 7.3% |
| $75,000 to $99,999 | 59 | 22.5% |
| $100,000 to $149,999 | 47 | 17.9% |
| $150,000 to $199,999 | 20 | 7.6% |
| $200,000+ | 20 | 7.6% |
Household Income by Householder Age in Campobello
The median household income in Campobello is $85,227, with the highest median household income of $114,688 found in the 45 to 64 years age bracket for the primary householder. A total of 107 households (40.8%) fall into this category. Meanwhile, the 15 to 24 years age bracket for the primary householder has the lowest median household income of $0, with 29 households (11.1%) in this group.
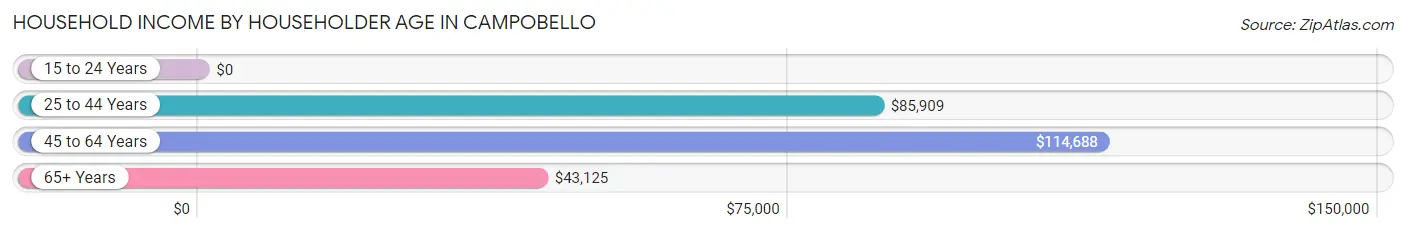
| Income Bracket | # Households | Median Income |
| 15 to 24 Years | 29 (11.1%) | $0 |
| 25 to 44 Years | 72 (27.5%) | $85,909 |
| 45 to 64 Years | 107 (40.8%) | $114,688 |
| 65+ Years | 54 (20.6%) | $43,125 |
| Total | 262 (100.0%) | $85,227 |
Poverty in Campobello
Income Below Poverty by Sex and Age in Campobello
With 5.3% poverty level for males and 9.5% for females among the residents of Campobello, 16 and 17 year old males and 18 to 24 year old females are the most vulnerable to poverty, with 16 males (59.3%) and 25 females (25.3%) in their respective age groups living below the poverty level.
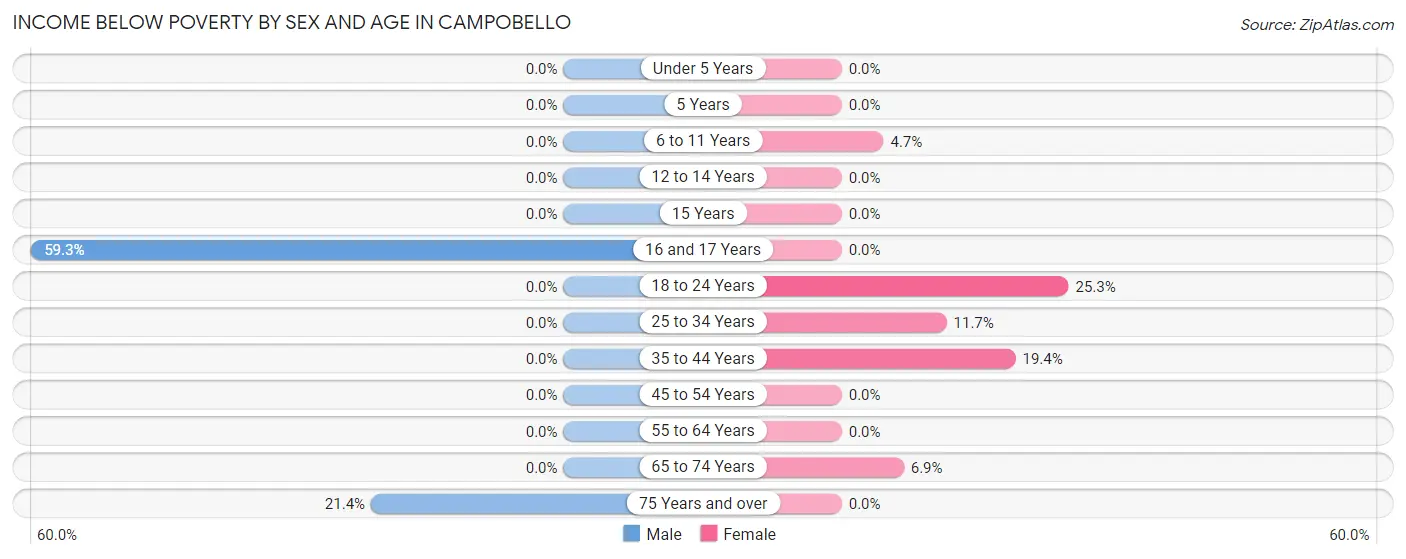
| Age Bracket | Male | Female |
| Under 5 Years | 0 (0.0%) | 0 (0.0%) |
| 5 Years | 0 (0.0%) | 0 (0.0%) |
| 6 to 11 Years | 0 (0.0%) | 2 (4.6%) |
| 12 to 14 Years | 0 (0.0%) | 0 (0.0%) |
| 15 Years | 0 (0.0%) | 0 (0.0%) |
| 16 and 17 Years | 16 (59.3%) | 0 (0.0%) |
| 18 to 24 Years | 0 (0.0%) | 25 (25.3%) |
| 25 to 34 Years | 0 (0.0%) | 7 (11.7%) |
| 35 to 44 Years | 0 (0.0%) | 6 (19.4%) |
| 45 to 54 Years | 0 (0.0%) | 0 (0.0%) |
| 55 to 64 Years | 0 (0.0%) | 0 (0.0%) |
| 65 to 74 Years | 0 (0.0%) | 2 (6.9%) |
| 75 Years and over | 6 (21.4%) | 0 (0.0%) |
| Total | 22 (5.3%) | 42 (9.5%) |
Income Above Poverty by Sex and Age in Campobello
According to the poverty statistics in Campobello, males aged under 5 years and females aged under 5 years are the age groups that are most secure financially, with 100.0% of males and 100.0% of females in these age groups living above the poverty line.
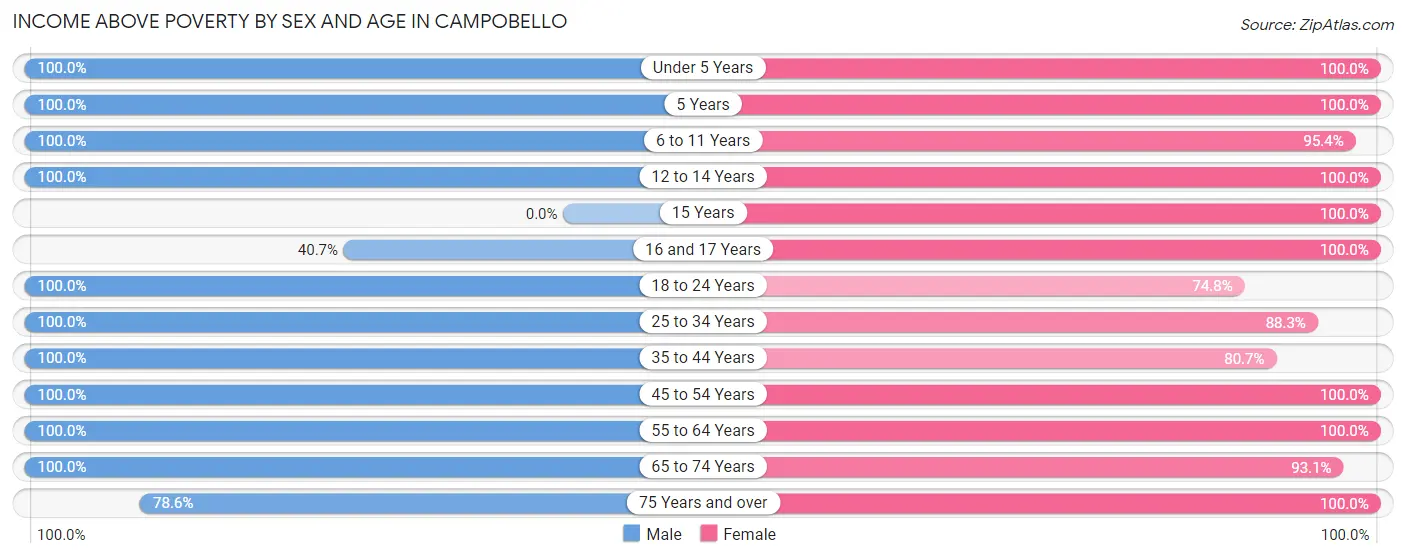
| Age Bracket | Male | Female |
| Under 5 Years | 30 (100.0%) | 19 (100.0%) |
| 5 Years | 20 (100.0%) | 2 (100.0%) |
| 6 to 11 Years | 24 (100.0%) | 41 (95.4%) |
| 12 to 14 Years | 18 (100.0%) | 9 (100.0%) |
| 15 Years | 0 (0.0%) | 8 (100.0%) |
| 16 and 17 Years | 11 (40.7%) | 11 (100.0%) |
| 18 to 24 Years | 55 (100.0%) | 74 (74.8%) |
| 25 to 34 Years | 56 (100.0%) | 53 (88.3%) |
| 35 to 44 Years | 30 (100.0%) | 25 (80.6%) |
| 45 to 54 Years | 54 (100.0%) | 90 (100.0%) |
| 55 to 64 Years | 48 (100.0%) | 21 (100.0%) |
| 65 to 74 Years | 22 (100.0%) | 27 (93.1%) |
| 75 Years and over | 22 (78.6%) | 19 (100.0%) |
| Total | 390 (94.7%) | 399 (90.5%) |
Income Below Poverty Among Married-Couple Families in Campobello
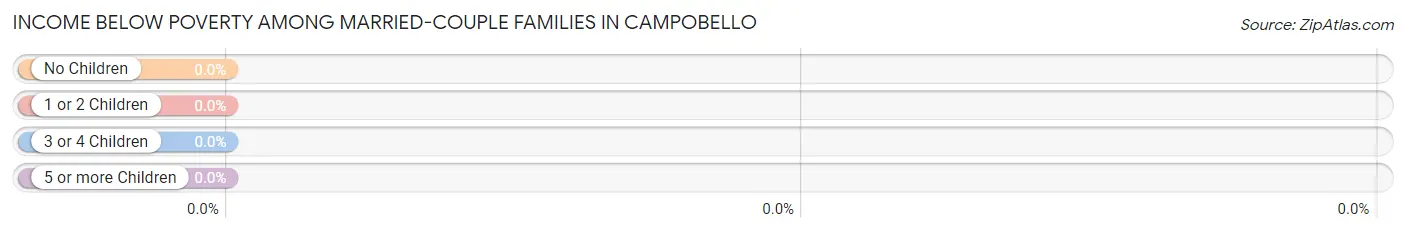
| Children | Above Poverty | Below Poverty |
| No Children | 69 (100.0%) | 0 (0.0%) |
| 1 or 2 Children | 70 (100.0%) | 0 (0.0%) |
| 3 or 4 Children | 24 (100.0%) | 0 (0.0%) |
| 5 or more Children | 0 (0.0%) | 0 (0.0%) |
| Total | 163 (100.0%) | 0 (0.0%) |
Income Below Poverty Among Single-Parent Households in Campobello
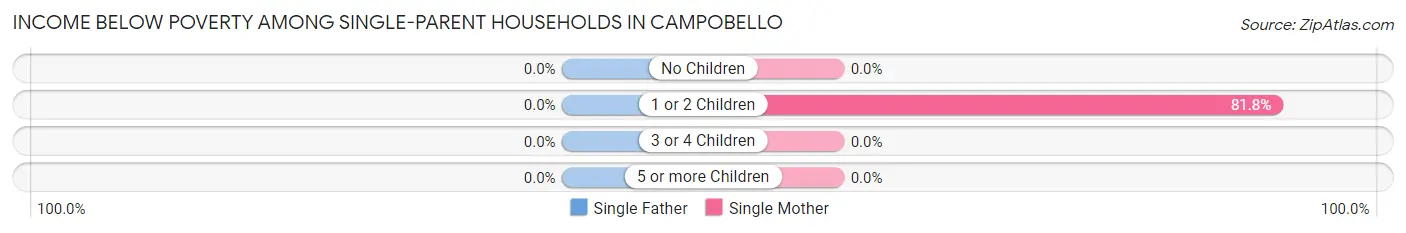
| Children | Single Father | Single Mother |
| No Children | 0 (0.0%) | 0 (0.0%) |
| 1 or 2 Children | 0 (0.0%) | 27 (81.8%) |
| 3 or 4 Children | 0 (0.0%) | 0 (0.0%) |
| 5 or more Children | 0 (0.0%) | 0 (0.0%) |
| Total | 0 (0.0%) | 27 (54.0%) |
Income Below Poverty Among Married-Couple vs Single-Parent Households in Campobello
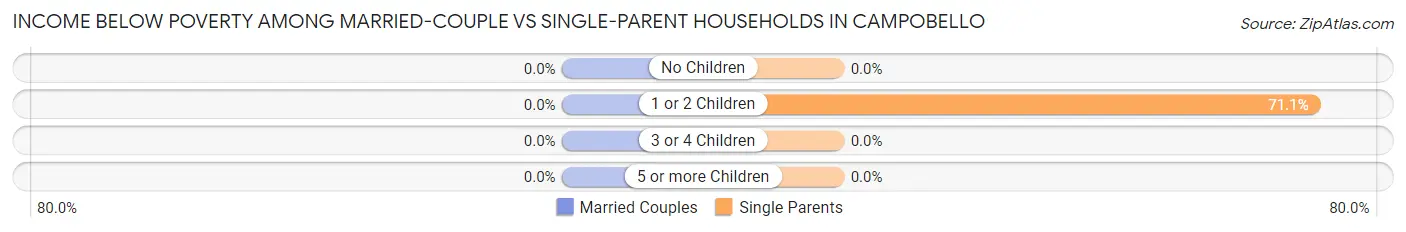
| Children | Married-Couple Families | Single-Parent Households |
| No Children | 0 (0.0%) | 0 (0.0%) |
| 1 or 2 Children | 0 (0.0%) | 27 (71.1%) |
| 3 or 4 Children | 0 (0.0%) | 0 (0.0%) |
| 5 or more Children | 0 (0.0%) | 0 (0.0%) |
| Total | 0 (0.0%) | 27 (45.8%) |
Race in Campobello
The most populous races in Campobello are White / Caucasian (760 | 87.8%), Hispanic or Latino (179 | 20.7%), and Black / African American (78 | 9.0%).
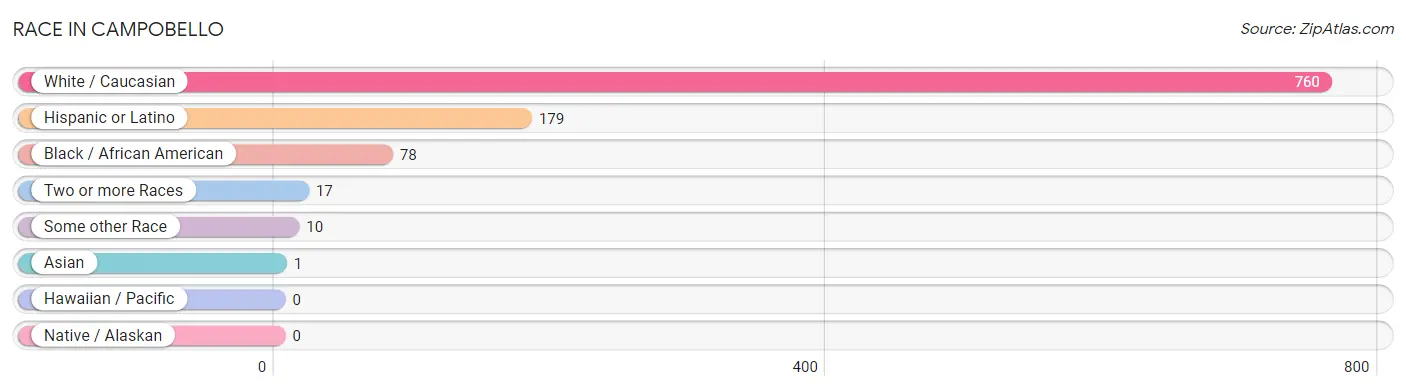
| Race | # Population | % Population |
| Asian | 1 | 0.1% |
| Black / African American | 78 | 9.0% |
| Hawaiian / Pacific | 0 | 0.0% |
| Hispanic or Latino | 179 | 20.7% |
| Native / Alaskan | 0 | 0.0% |
| White / Caucasian | 760 | 87.8% |
| Two or more Races | 17 | 2.0% |
| Some other Race | 10 | 1.1% |
| Total | 866 | 100.0% |
Ancestry in Campobello
The most populous ancestries reported in Campobello are Mexican (106 | 12.2%), English (83 | 9.6%), Irish (78 | 9.0%), American (59 | 6.8%), and Cuban (56 | 6.5%), together accounting for 44.1% of all Campobello residents.
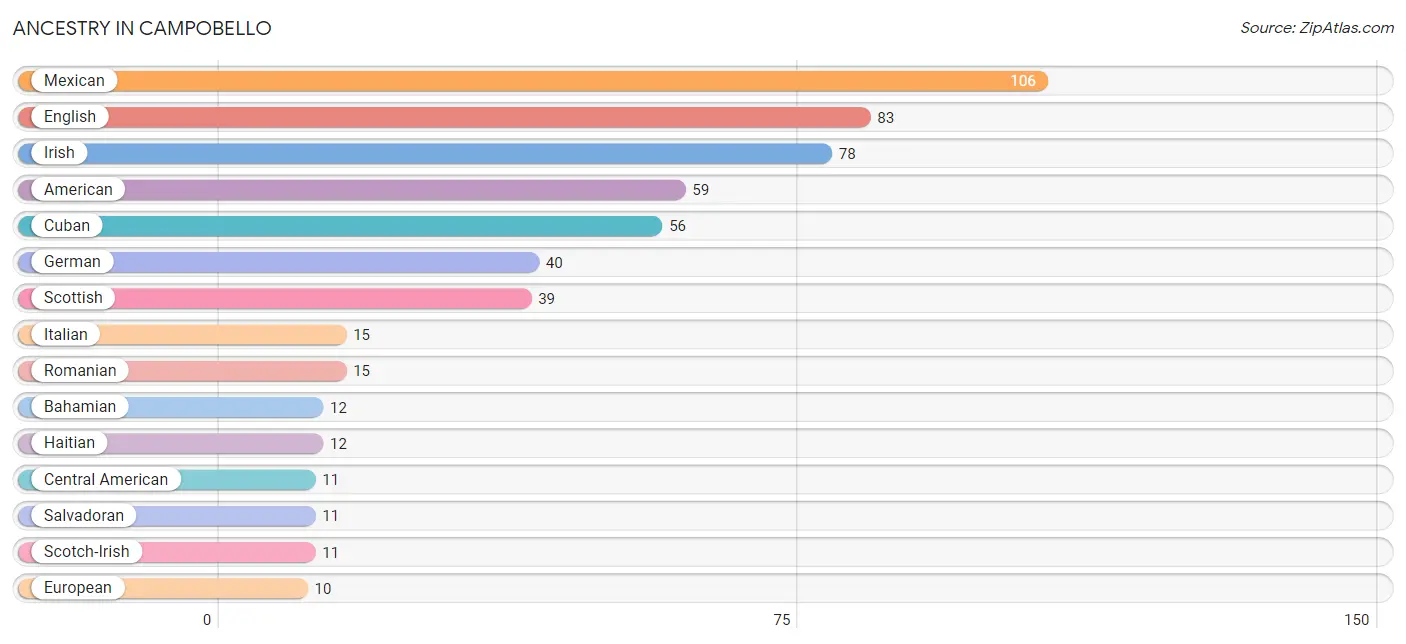
| Ancestry | # Population | % Population |
| American | 59 | 6.8% |
| Bahamian | 12 | 1.4% |
| Central American | 11 | 1.3% |
| Cherokee | 2 | 0.2% |
| Cuban | 56 | 6.5% |
| English | 83 | 9.6% |
| European | 10 | 1.1% |
| Finnish | 3 | 0.4% |
| French | 2 | 0.2% |
| German | 40 | 4.6% |
| Haitian | 12 | 1.4% |
| Irish | 78 | 9.0% |
| Italian | 15 | 1.7% |
| Korean | 6 | 0.7% |
| Mexican | 106 | 12.2% |
| Polish | 3 | 0.4% |
| Romanian | 15 | 1.7% |
| Russian | 1 | 0.1% |
| Salvadoran | 11 | 1.3% |
| Scotch-Irish | 11 | 1.3% |
| Scottish | 39 | 4.5% |
| Sri Lankan | 1 | 0.1% |
| Swedish | 10 | 1.1% |
| Ukrainian | 7 | 0.8% |
| Welsh | 8 | 0.9% | View All 25 Rows |
Immigrants in Campobello
The most numerous immigrant groups reported in Campobello came from Central America (33 | 3.8%), Latin America (33 | 3.8%), Mexico (33 | 3.8%), Europe (30 | 3.5%), and Eastern Europe (21 | 2.4%), together accounting for 17.3% of all Campobello residents.
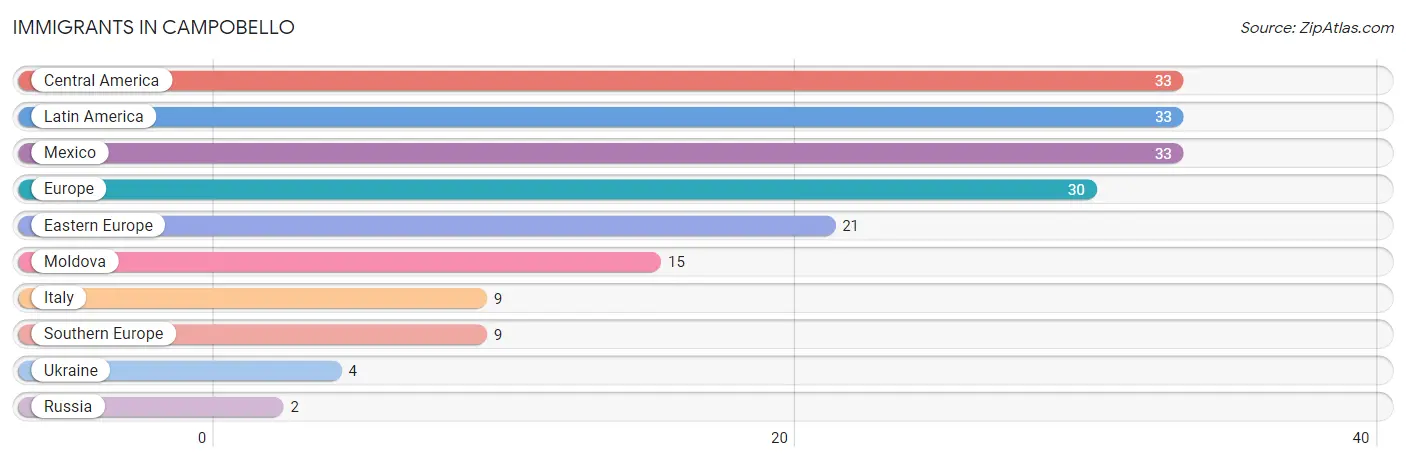
| Immigration Origin | # Population | % Population |
| Central America | 33 | 3.8% |
| Eastern Europe | 21 | 2.4% |
| Europe | 30 | 3.5% |
| Italy | 9 | 1.0% |
| Latin America | 33 | 3.8% |
| Mexico | 33 | 3.8% |
| Moldova | 15 | 1.7% |
| Russia | 2 | 0.2% |
| Southern Europe | 9 | 1.0% |
| Ukraine | 4 | 0.5% | View All 10 Rows |
Sex and Age in Campobello
Sex and Age in Campobello
The most populous age groups in Campobello are 5 to 9 Years (43 | 10.4%) for men and 15 to 19 Years (67 | 14.8%) for women.
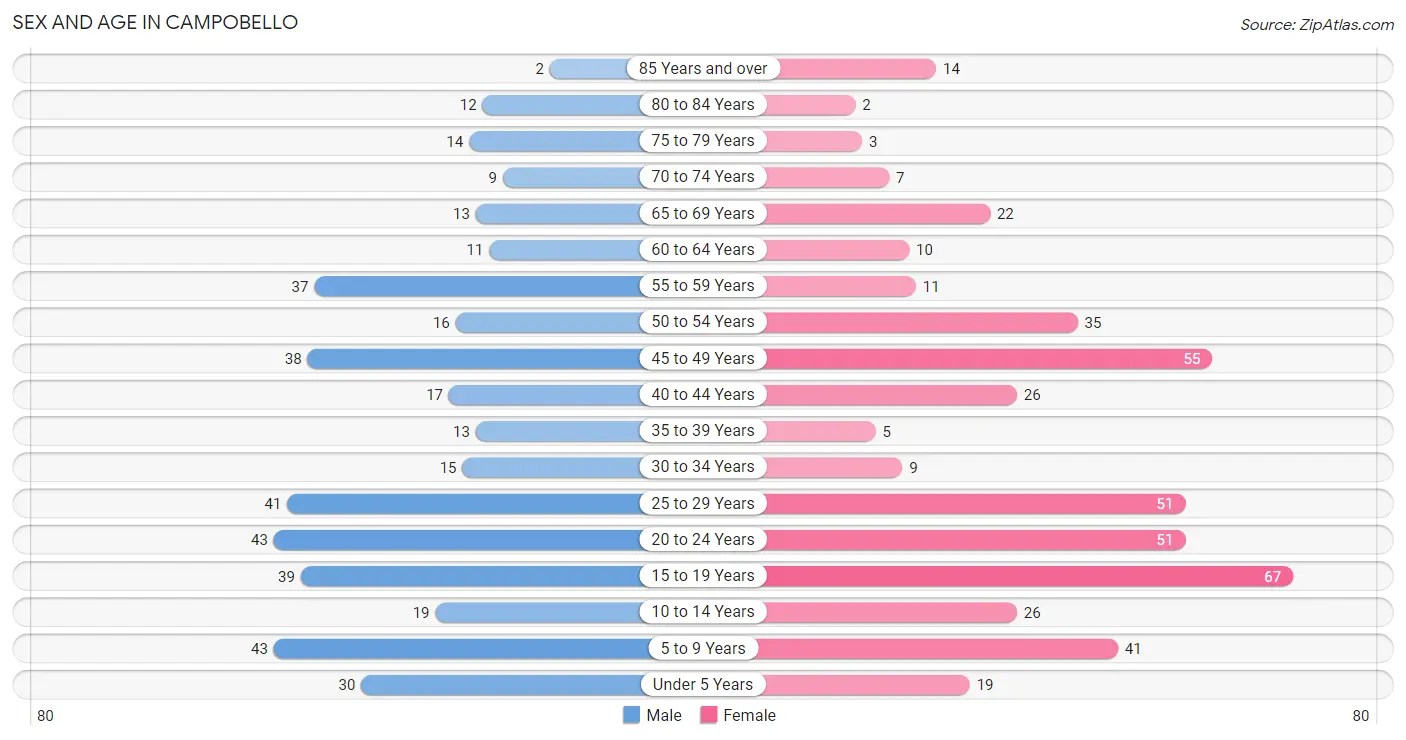
| Age Bracket | Male | Female |
| Under 5 Years | 30 (7.3%) | 19 (4.2%) |
| 5 to 9 Years | 43 (10.4%) | 41 (9.0%) |
| 10 to 14 Years | 19 (4.6%) | 26 (5.7%) |
| 15 to 19 Years | 39 (9.5%) | 67 (14.8%) |
| 20 to 24 Years | 43 (10.4%) | 51 (11.2%) |
| 25 to 29 Years | 41 (10.0%) | 51 (11.2%) |
| 30 to 34 Years | 15 (3.6%) | 9 (2.0%) |
| 35 to 39 Years | 13 (3.2%) | 5 (1.1%) |
| 40 to 44 Years | 17 (4.1%) | 26 (5.7%) |
| 45 to 49 Years | 38 (9.2%) | 55 (12.1%) |
| 50 to 54 Years | 16 (3.9%) | 35 (7.7%) |
| 55 to 59 Years | 37 (9.0%) | 11 (2.4%) |
| 60 to 64 Years | 11 (2.7%) | 10 (2.2%) |
| 65 to 69 Years | 13 (3.2%) | 22 (4.9%) |
| 70 to 74 Years | 9 (2.2%) | 7 (1.5%) |
| 75 to 79 Years | 14 (3.4%) | 3 (0.7%) |
| 80 to 84 Years | 12 (2.9%) | 2 (0.4%) |
| 85 Years and over | 2 (0.5%) | 14 (3.1%) |
| Total | 412 (100.0%) | 454 (100.0%) |
Families and Households in Campobello
Median Family Size in Campobello
The median family size in Campobello is 3.58 persons per family, with married-couple families (163 | 73.4%) accounting for the largest median family size of 4.07 persons per family. On the other hand, single female/mother families (50 | 22.5%) represent the smallest median family size with 2.20 persons per family.
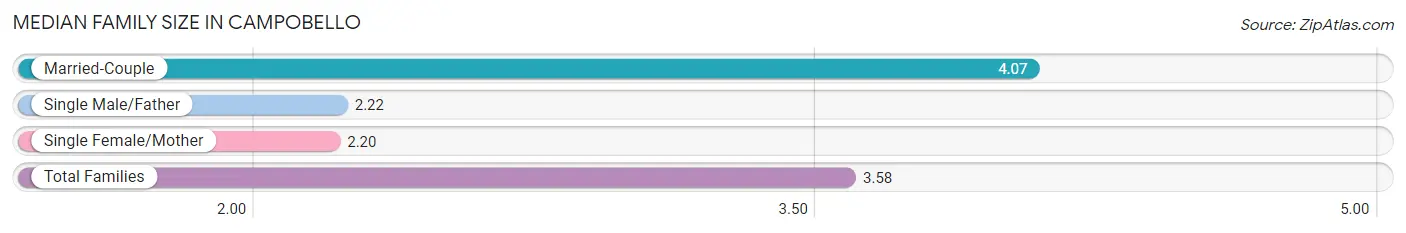
| Family Type | # Families | Family Size |
| Married-Couple | 163 (73.4%) | 4.07 |
| Single Male/Father | 9 (4.1%) | 2.22 |
| Single Female/Mother | 50 (22.5%) | 2.20 |
| Total Families | 222 (100.0%) | 3.58 |
Median Household Size in Campobello
The median household size in Campobello is 3.31 persons per household, with married-couple households (163 | 62.2%) accounting for the largest median household size of 4.07 persons per household. non-family households (40 | 15.3%) represent the smallest median household size with 1.58 persons per household.
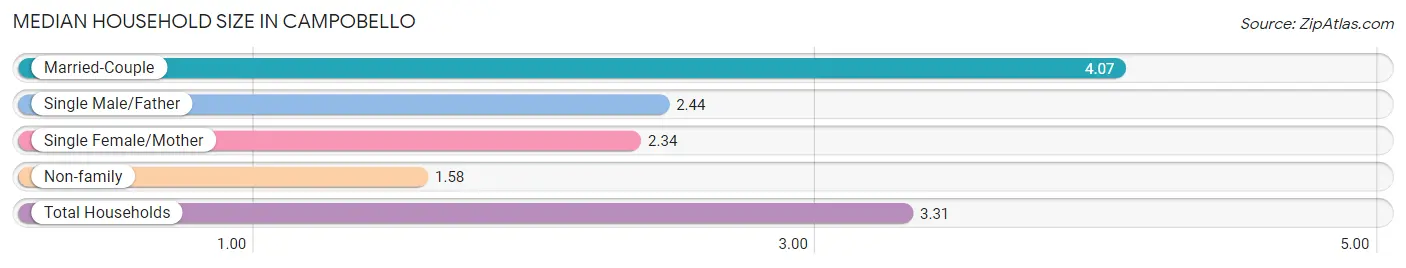
| Household Type | # Households | Household Size |
| Married-Couple | 163 (62.2%) | 4.07 |
| Single Male/Father | 9 (3.4%) | 2.44 |
| Single Female/Mother | 50 (19.1%) | 2.34 |
| Non-family | 40 (15.3%) | 1.58 |
| Total Households | 262 (100.0%) | 3.31 |
Household Size by Marriage Status in Campobello
Out of a total of 262 households in Campobello, 222 (84.7%) are family households, while 40 (15.3%) are nonfamily households. The most numerous type of family households are 2-person households, comprising 85, and the most common type of nonfamily households are 1-person households, comprising 29.
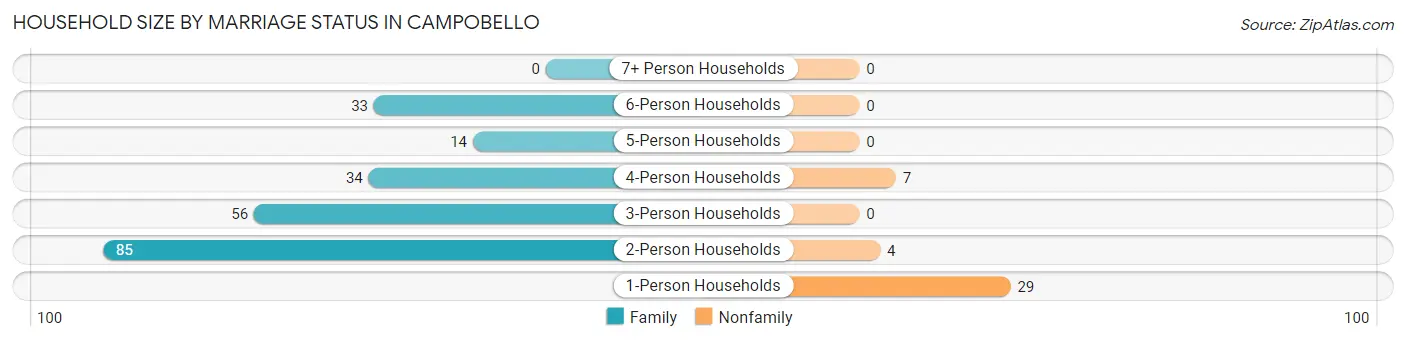
| Household Size | Family Households | Nonfamily Households |
| 1-Person Households | - | 29 (11.1%) |
| 2-Person Households | 85 (32.4%) | 4 (1.5%) |
| 3-Person Households | 56 (21.4%) | 0 (0.0%) |
| 4-Person Households | 34 (13.0%) | 7 (2.7%) |
| 5-Person Households | 14 (5.3%) | 0 (0.0%) |
| 6-Person Households | 33 (12.6%) | 0 (0.0%) |
| 7+ Person Households | 0 (0.0%) | 0 (0.0%) |
| Total | 222 (84.7%) | 40 (15.3%) |
Female Fertility in Campobello
Fertility by Age in Campobello
Average fertility rate in Campobello is 91.0 births per 1,000 women. Women in the age bracket of 20 to 34 years have the highest fertility rate with 153.0 births per 1,000 women. Women in the age bracket of 20 to 34 years acount for 65.4% of all women with births.
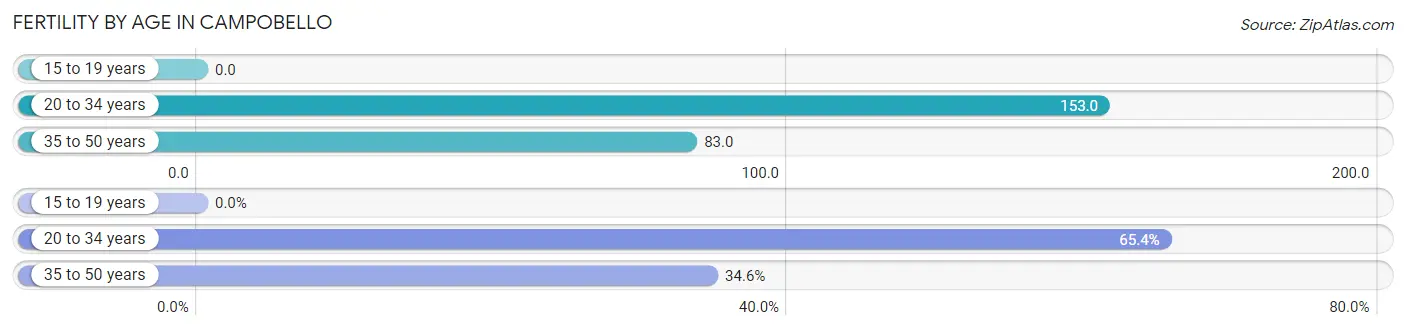
| Age Bracket | Women with Births | Births / 1,000 Women |
| 15 to 19 years | 0 (0.0%) | 0.0 |
| 20 to 34 years | 17 (65.4%) | 153.0 |
| 35 to 50 years | 9 (34.6%) | 83.0 |
| Total | 26 (100.0%) | 91.0 |
Fertility by Age by Marriage Status in Campobello
92.3% of women with births (26) in Campobello are married. The highest percentage of unmarried women with births falls into 35 to 50 years age bracket with 22.2% of them unmarried at the time of birth, while the lowest percentage of unmarried women with births belong to 20 to 34 years age bracket with 0.0% of them unmarried.
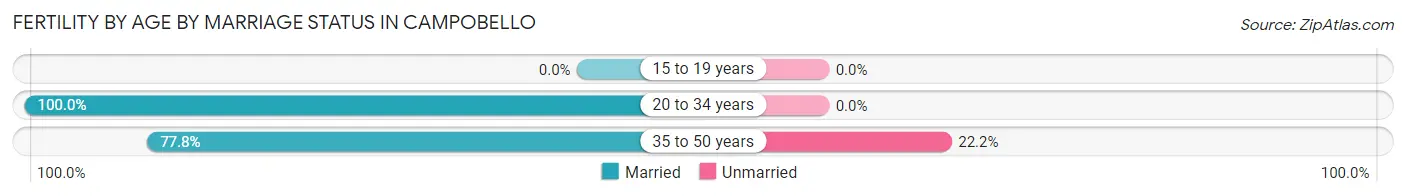
| Age Bracket | Married | Unmarried |
| 15 to 19 years | 0 (0.0%) | 0 (0.0%) |
| 20 to 34 years | 17 (100.0%) | 0 (0.0%) |
| 35 to 50 years | 7 (77.8%) | 2 (22.2%) |
| Total | 24 (92.3%) | 2 (7.7%) |
Fertility by Education in Campobello
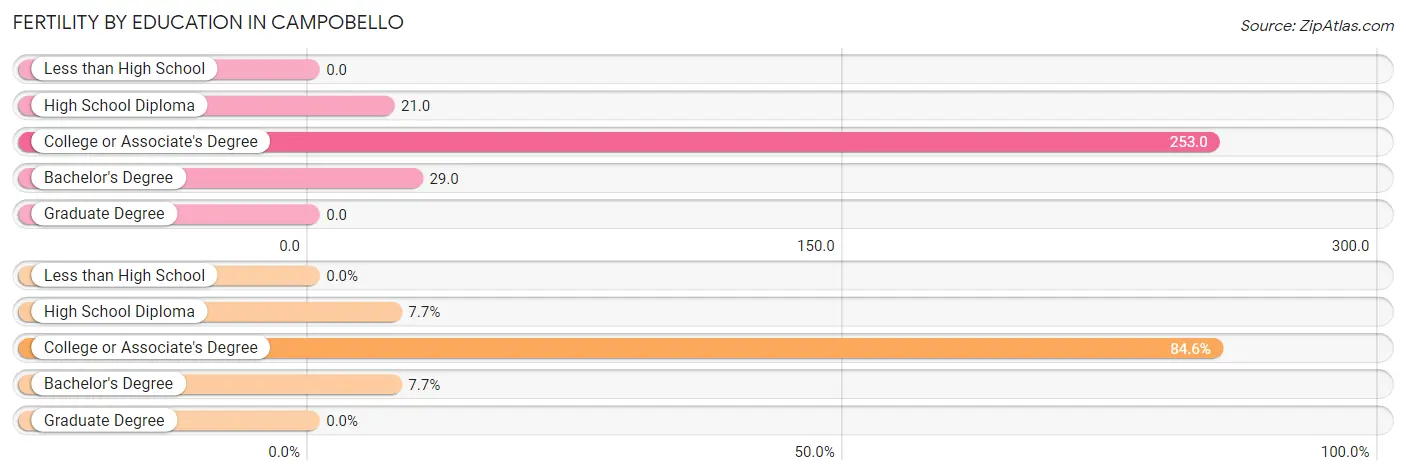
| Educational Attainment | Women with Births | Births / 1,000 Women |
| Less than High School | 0 (0.0%) | 0.0 |
| High School Diploma | 2 (7.7%) | 21.0 |
| College or Associate's Degree | 22 (84.6%) | 253.0 |
| Bachelor's Degree | 2 (7.7%) | 29.0 |
| Graduate Degree | 0 (0.0%) | 0.0 |
| Total | 26 (100.0%) | 91.0 |
Fertility by Education by Marriage Status in Campobello
7.7% of women with births in Campobello are unmarried. Women with the educational attainment of college or associate's degree are most likely to be married with 100.0% of them married at childbirth, while women with the educational attainment of high school diploma are least likely to be married with 100.0% of them unmarried at childbirth.
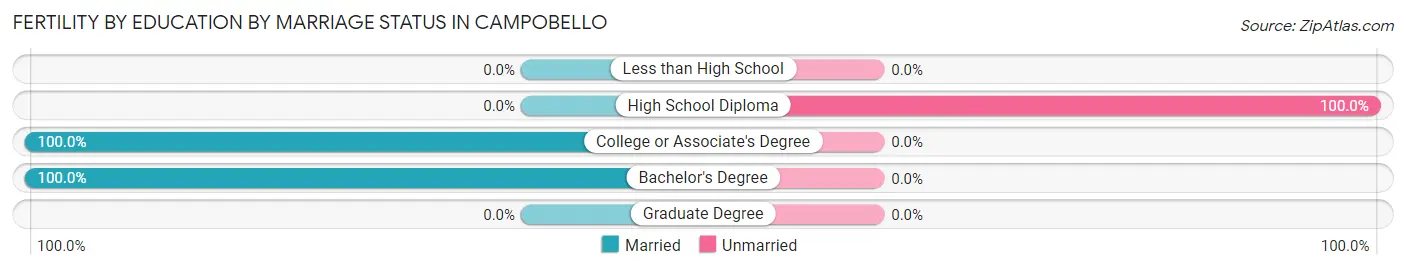
| Educational Attainment | Married | Unmarried |
| Less than High School | 0 (0.0%) | 0 (0.0%) |
| High School Diploma | 0 (0.0%) | 2 (100.0%) |
| College or Associate's Degree | 22 (100.0%) | 0 (0.0%) |
| Bachelor's Degree | 2 (100.0%) | 0 (0.0%) |
| Graduate Degree | 0 (0.0%) | 0 (0.0%) |
| Total | 24 (92.3%) | 2 (7.7%) |
Employment Characteristics in Campobello
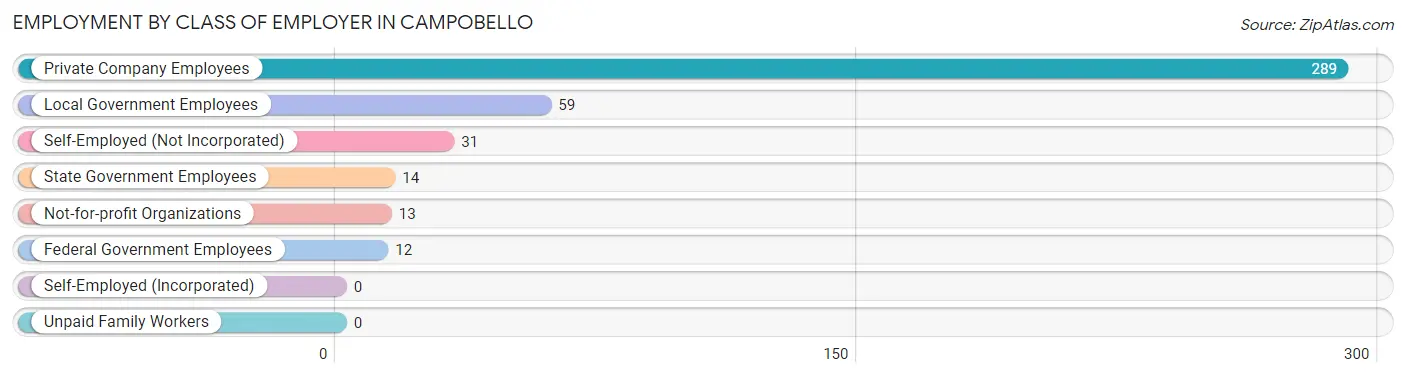
Employment by Class of Employer in Campobello
Among the 418 employed individuals in Campobello, private company employees (289 | 69.1%), local government employees (59 | 14.1%), and self-employed (not incorporated) (31 | 7.4%) make up the most common classes of employment.
| Employer Class | # Employees | % Employees |
| Private Company Employees | 289 | 69.1% |
| Self-Employed (Incorporated) | 0 | 0.0% |
| Self-Employed (Not Incorporated) | 31 | 7.4% |
| Not-for-profit Organizations | 13 | 3.1% |
| Local Government Employees | 59 | 14.1% |
| State Government Employees | 14 | 3.4% |
| Federal Government Employees | 12 | 2.9% |
| Unpaid Family Workers | 0 | 0.0% |
| Total | 418 | 100.0% |
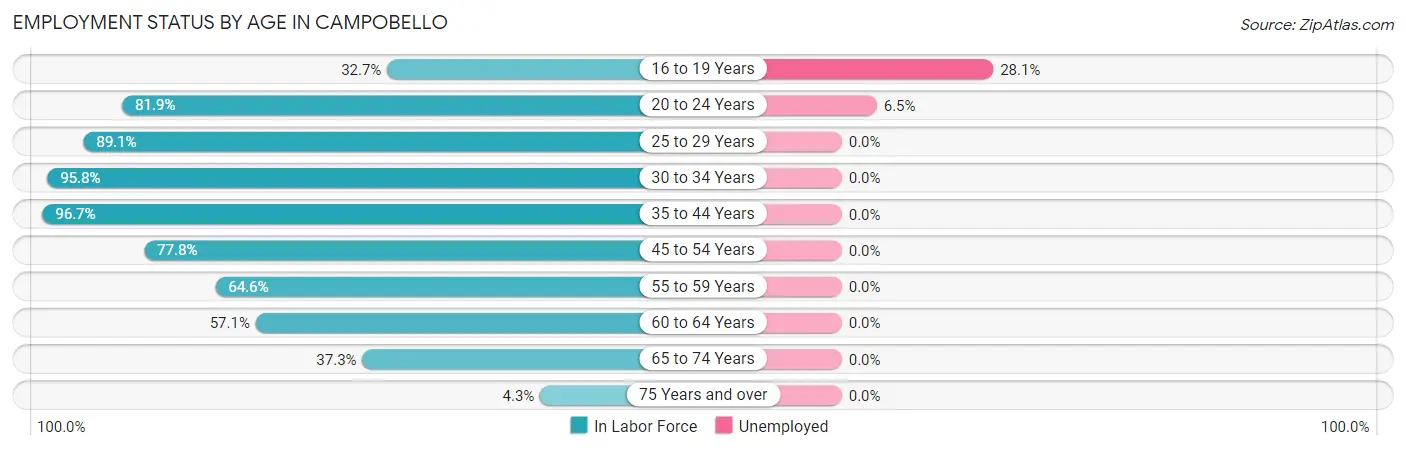
Employment Status by Age in Campobello
According to the labor force statistics for Campobello, out of the total population over 16 years of age (680), 66.0% or 449 individuals are in the labor force, with 3.1% or 14 of them unemployed. The age group with the highest labor force participation rate is 35 to 44 years, with 96.7% or 59 individuals in the labor force. Within the labor force, the 16 to 19 years age range has the highest percentage of unemployed individuals, with 28.1% or 9 of them being unemployed.
| Age Bracket | In Labor Force | Unemployed |
| 16 to 19 Years | 32 (32.7%) | 9 (28.1%) |
| 20 to 24 Years | 77 (81.9%) | 5 (6.5%) |
| 25 to 29 Years | 82 (89.1%) | 0 (0.0%) |
| 30 to 34 Years | 23 (95.8%) | 0 (0.0%) |
| 35 to 44 Years | 59 (96.7%) | 0 (0.0%) |
| 45 to 54 Years | 112 (77.8%) | 0 (0.0%) |
| 55 to 59 Years | 31 (64.6%) | 0 (0.0%) |
| 60 to 64 Years | 12 (57.1%) | 0 (0.0%) |
| 65 to 74 Years | 19 (37.3%) | 0 (0.0%) |
| 75 Years and over | 2 (4.3%) | 0 (0.0%) |
| Total | 449 (66.0%) | 14 (3.1%) |
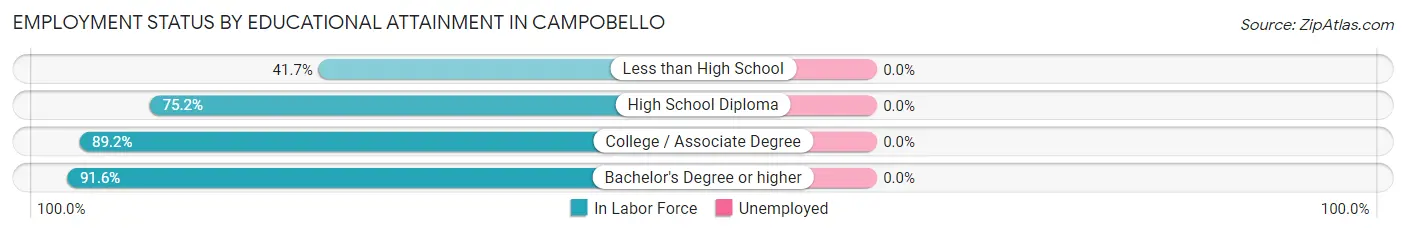
Employment Status by Educational Attainment in Campobello
| Educational Attainment | In Labor Force | Unemployed |
| Less than High School | 15 (41.7%) | 0 (0.0%) |
| High School Diploma | 76 (75.2%) | 0 (0.0%) |
| College / Associate Degree | 141 (89.2%) | 0 (0.0%) |
| Bachelor's Degree or higher | 87 (91.6%) | 0 (0.0%) |
| Total | 319 (81.8%) | 0 (0.0%) |
Employment Occupations by Sex in Campobello
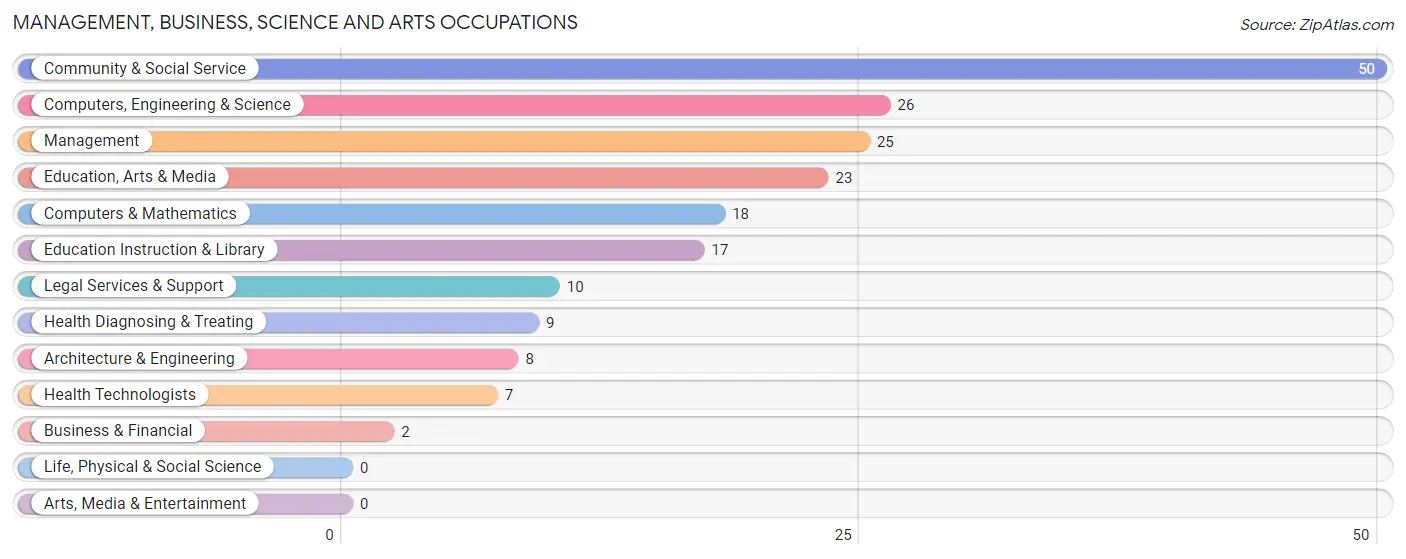
Management, Business, Science and Arts Occupations
The most common Management, Business, Science and Arts occupations in Campobello are Community & Social Service (50 | 11.5%), Computers, Engineering & Science (26 | 6.0%), Management (25 | 5.8%), Education, Arts & Media (23 | 5.3%), and Computers & Mathematics (18 | 4.1%).
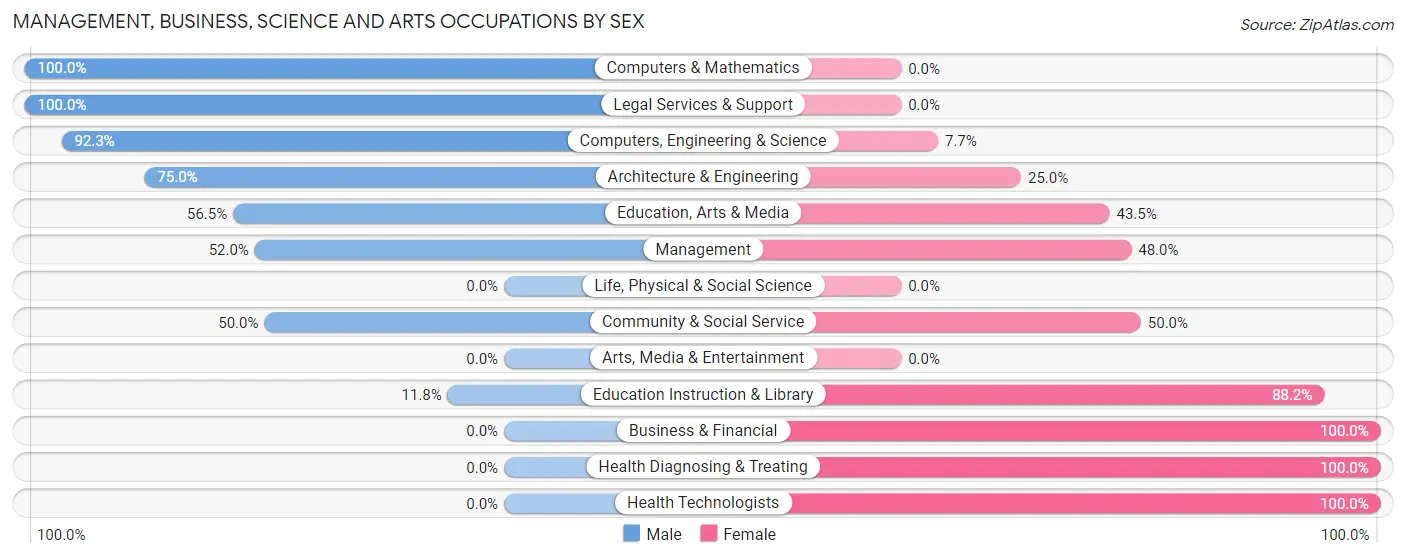
Management, Business, Science and Arts Occupations by Sex
Within the Management, Business, Science and Arts occupations in Campobello, the most male-oriented occupations are Computers & Mathematics (100.0%), Legal Services & Support (100.0%), and Computers, Engineering & Science (92.3%), while the most female-oriented occupations are Business & Financial (100.0%), Health Diagnosing & Treating (100.0%), and Health Technologists (100.0%).
| Occupation | Male | Female |
| Management | 13 (52.0%) | 12 (48.0%) |
| Business & Financial | 0 (0.0%) | 2 (100.0%) |
| Computers, Engineering & Science | 24 (92.3%) | 2 (7.7%) |
| Computers & Mathematics | 18 (100.0%) | 0 (0.0%) |
| Architecture & Engineering | 6 (75.0%) | 2 (25.0%) |
| Life, Physical & Social Science | 0 (0.0%) | 0 (0.0%) |
| Community & Social Service | 25 (50.0%) | 25 (50.0%) |
| Education, Arts & Media | 13 (56.5%) | 10 (43.5%) |
| Legal Services & Support | 10 (100.0%) | 0 (0.0%) |
| Education Instruction & Library | 2 (11.8%) | 15 (88.2%) |
| Arts, Media & Entertainment | 0 (0.0%) | 0 (0.0%) |
| Health Diagnosing & Treating | 0 (0.0%) | 9 (100.0%) |
| Health Technologists | 0 (0.0%) | 7 (100.0%) |
| Total (Category) | 62 (55.4%) | 50 (44.6%) |
| Total (Overall) | 226 (51.9%) | 209 (48.0%) |
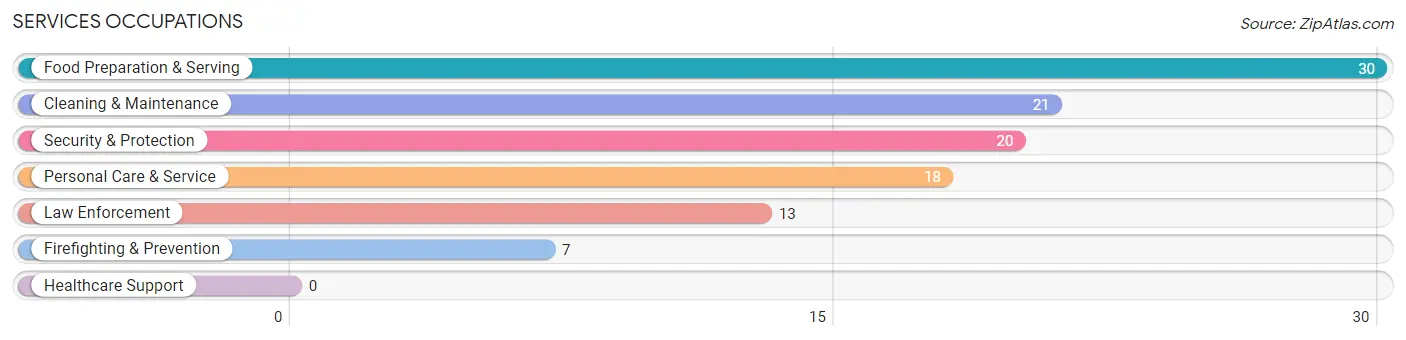
Services Occupations
The most common Services occupations in Campobello are Food Preparation & Serving (30 | 6.9%), Cleaning & Maintenance (21 | 4.8%), Security & Protection (20 | 4.6%), Personal Care & Service (18 | 4.1%), and Law Enforcement (13 | 3.0%).
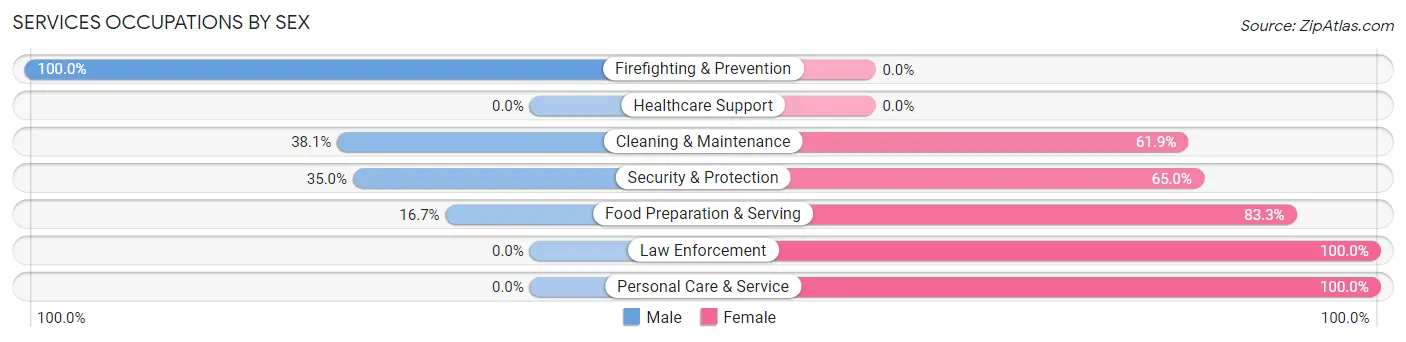
Services Occupations by Sex
Within the Services occupations in Campobello, the most male-oriented occupations are Firefighting & Prevention (100.0%), Cleaning & Maintenance (38.1%), and Security & Protection (35.0%), while the most female-oriented occupations are Law Enforcement (100.0%), Personal Care & Service (100.0%), and Food Preparation & Serving (83.3%).
| Occupation | Male | Female |
| Healthcare Support | 0 (0.0%) | 0 (0.0%) |
| Security & Protection | 7 (35.0%) | 13 (65.0%) |
| Firefighting & Prevention | 7 (100.0%) | 0 (0.0%) |
| Law Enforcement | 0 (0.0%) | 13 (100.0%) |
| Food Preparation & Serving | 5 (16.7%) | 25 (83.3%) |
| Cleaning & Maintenance | 8 (38.1%) | 13 (61.9%) |
| Personal Care & Service | 0 (0.0%) | 18 (100.0%) |
| Total (Category) | 20 (22.5%) | 69 (77.5%) |
| Total (Overall) | 226 (51.9%) | 209 (48.0%) |
Sales and Office Occupations
The most common Sales and Office occupations in Campobello are Office & Administration (56 | 12.9%), and Sales & Related (43 | 9.9%).

Sales and Office Occupations by Sex
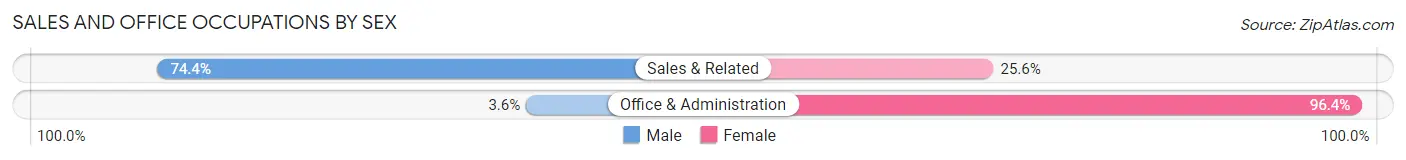
| Occupation | Male | Female |
| Sales & Related | 32 (74.4%) | 11 (25.6%) |
| Office & Administration | 2 (3.6%) | 54 (96.4%) |
| Total (Category) | 34 (34.3%) | 65 (65.7%) |
| Total (Overall) | 226 (51.9%) | 209 (48.0%) |
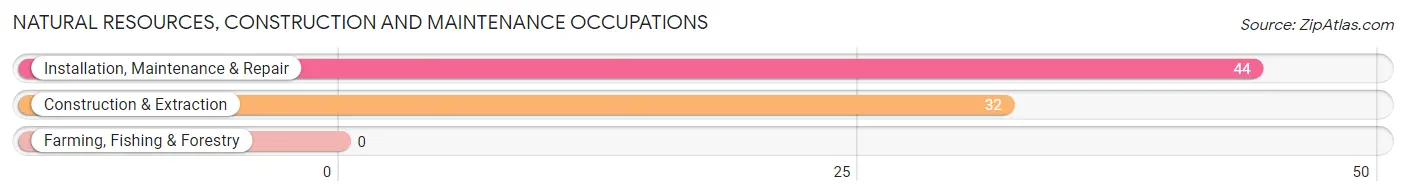
Natural Resources, Construction and Maintenance Occupations
The most common Natural Resources, Construction and Maintenance occupations in Campobello are Installation, Maintenance & Repair (44 | 10.1%), and Construction & Extraction (32 | 7.4%).
Natural Resources, Construction and Maintenance Occupations by Sex
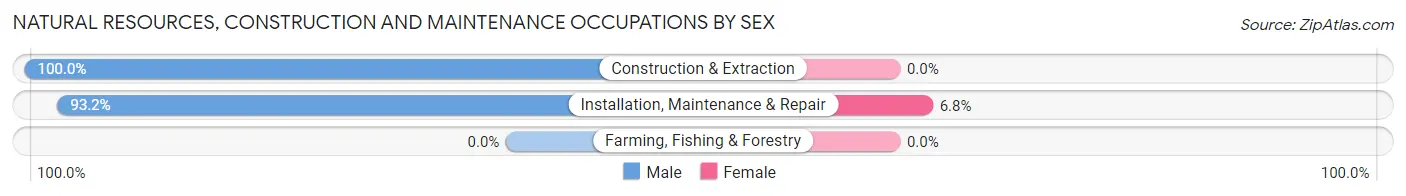
| Occupation | Male | Female |
| Farming, Fishing & Forestry | 0 (0.0%) | 0 (0.0%) |
| Construction & Extraction | 32 (100.0%) | 0 (0.0%) |
| Installation, Maintenance & Repair | 41 (93.2%) | 3 (6.8%) |
| Total (Category) | 73 (96.1%) | 3 (4.0%) |
| Total (Overall) | 226 (51.9%) | 209 (48.0%) |
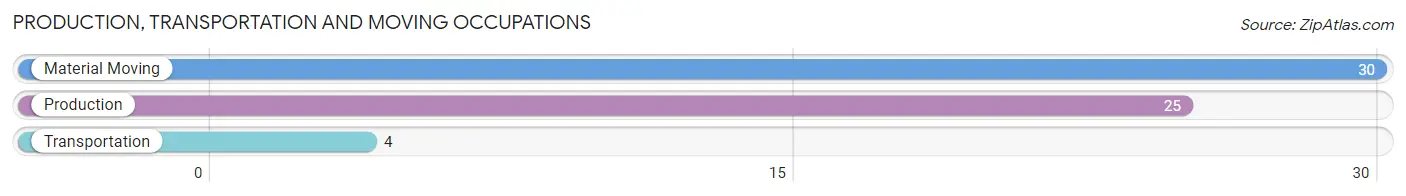
Production, Transportation and Moving Occupations
The most common Production, Transportation and Moving occupations in Campobello are Material Moving (30 | 6.9%), Production (25 | 5.8%), and Transportation (4 | 0.9%).
Production, Transportation and Moving Occupations by Sex
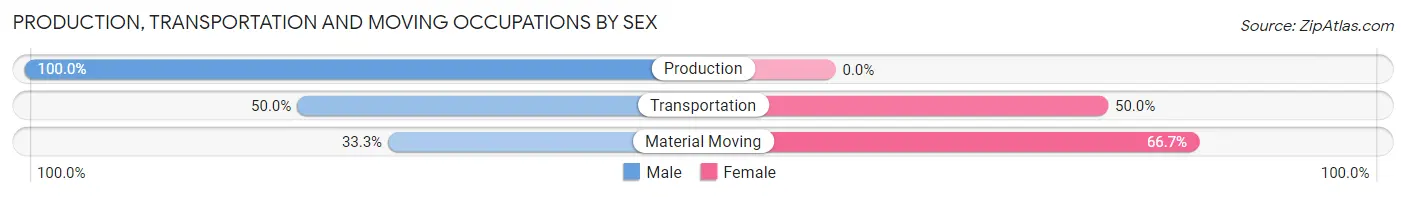
| Occupation | Male | Female |
| Production | 25 (100.0%) | 0 (0.0%) |
| Transportation | 2 (50.0%) | 2 (50.0%) |
| Material Moving | 10 (33.3%) | 20 (66.7%) |
| Total (Category) | 37 (62.7%) | 22 (37.3%) |
| Total (Overall) | 226 (51.9%) | 209 (48.0%) |
Employment Industries by Sex in Campobello
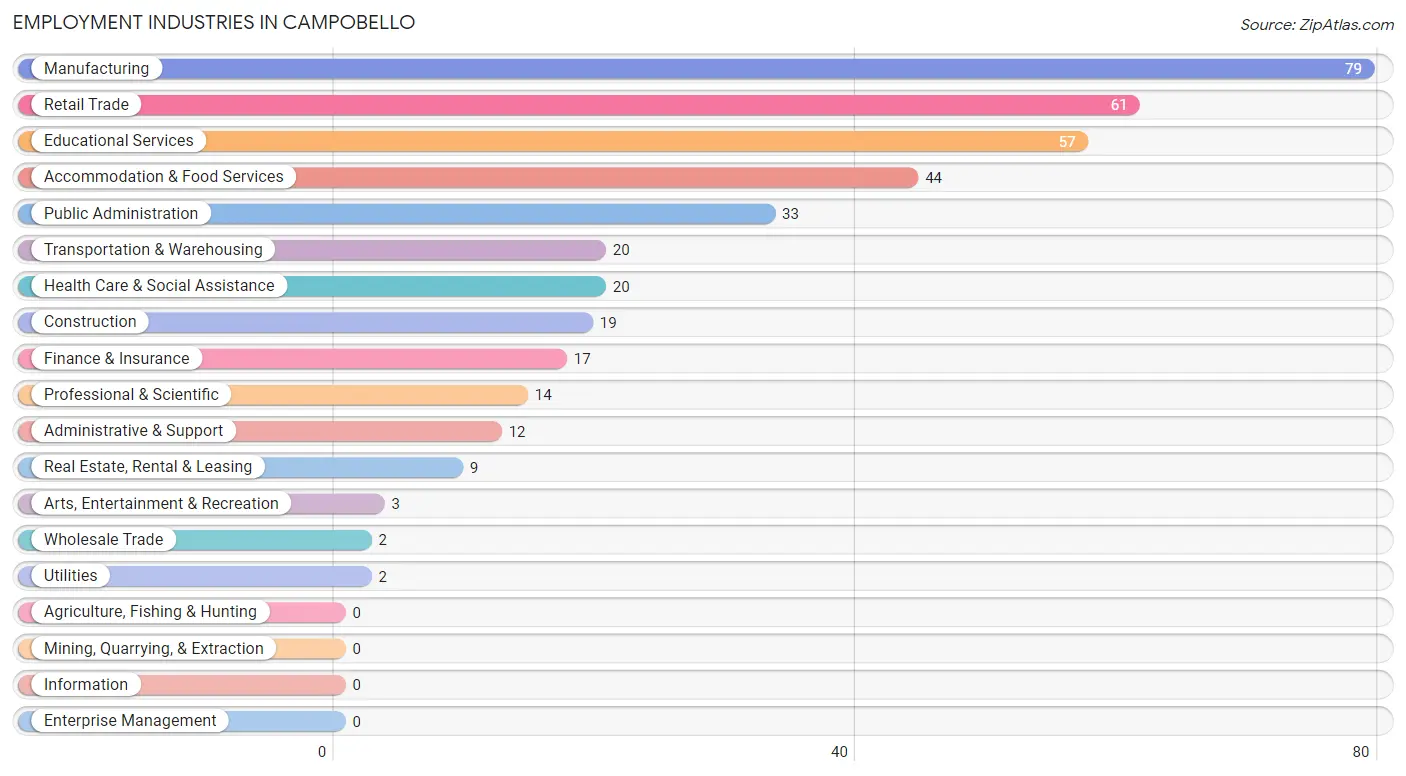
Employment Industries in Campobello
The major employment industries in Campobello include Manufacturing (79 | 18.2%), Retail Trade (61 | 14.0%), Educational Services (57 | 13.1%), Accommodation & Food Services (44 | 10.1%), and Public Administration (33 | 7.6%).
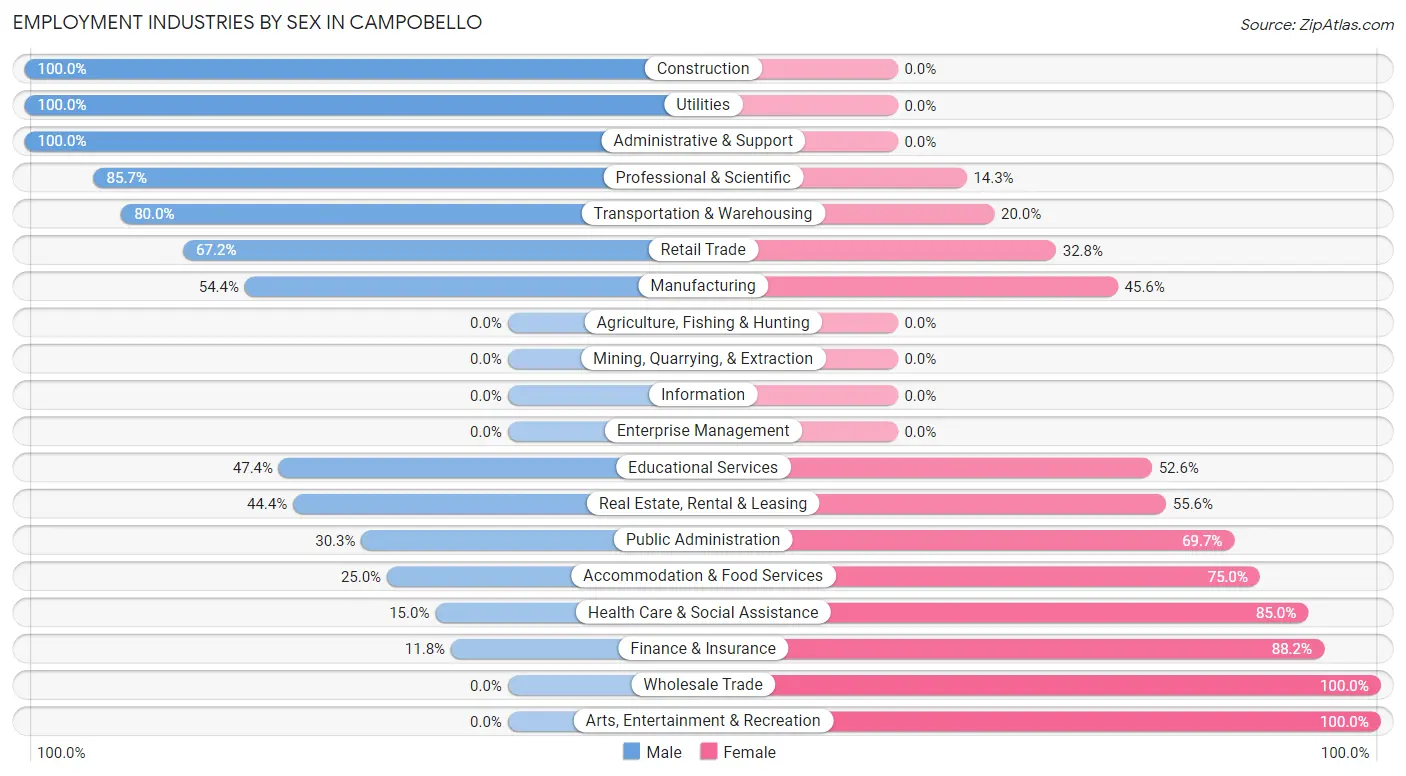
Employment Industries by Sex in Campobello
The Campobello industries that see more men than women are Construction (100.0%), Utilities (100.0%), and Administrative & Support (100.0%), whereas the industries that tend to have a higher number of women are Wholesale Trade (100.0%), Arts, Entertainment & Recreation (100.0%), and Finance & Insurance (88.2%).
| Industry | Male | Female |
| Agriculture, Fishing & Hunting | 0 (0.0%) | 0 (0.0%) |
| Mining, Quarrying, & Extraction | 0 (0.0%) | 0 (0.0%) |
| Construction | 19 (100.0%) | 0 (0.0%) |
| Manufacturing | 43 (54.4%) | 36 (45.6%) |
| Wholesale Trade | 0 (0.0%) | 2 (100.0%) |
| Retail Trade | 41 (67.2%) | 20 (32.8%) |
| Transportation & Warehousing | 16 (80.0%) | 4 (20.0%) |
| Utilities | 2 (100.0%) | 0 (0.0%) |
| Information | 0 (0.0%) | 0 (0.0%) |
| Finance & Insurance | 2 (11.8%) | 15 (88.2%) |
| Real Estate, Rental & Leasing | 4 (44.4%) | 5 (55.6%) |
| Professional & Scientific | 12 (85.7%) | 2 (14.3%) |
| Enterprise Management | 0 (0.0%) | 0 (0.0%) |
| Administrative & Support | 12 (100.0%) | 0 (0.0%) |
| Educational Services | 27 (47.4%) | 30 (52.6%) |
| Health Care & Social Assistance | 3 (15.0%) | 17 (85.0%) |
| Arts, Entertainment & Recreation | 0 (0.0%) | 3 (100.0%) |
| Accommodation & Food Services | 11 (25.0%) | 33 (75.0%) |
| Public Administration | 10 (30.3%) | 23 (69.7%) |
| Total | 226 (51.9%) | 209 (48.0%) |
Education in Campobello
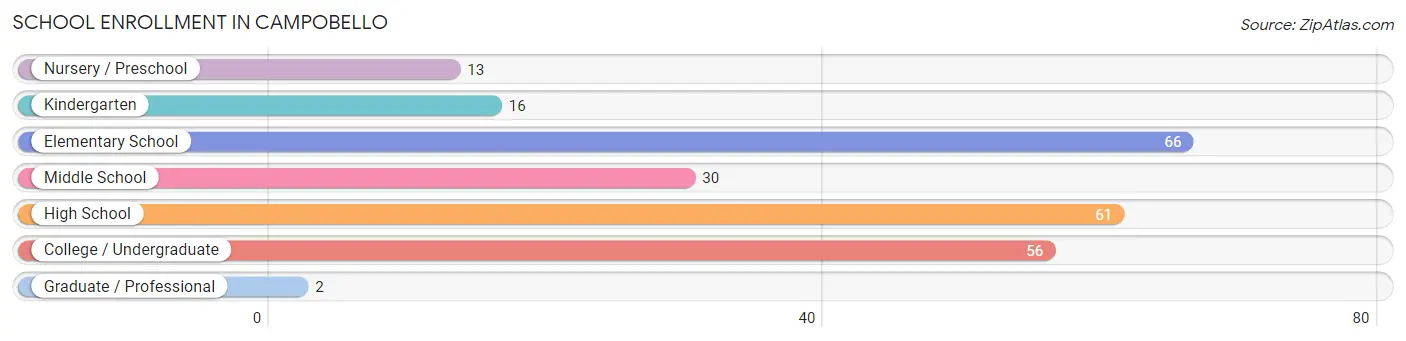
School Enrollment in Campobello
The most common levels of schooling among the 244 students in Campobello are elementary school (66 | 27.1%), high school (61 | 25.0%), and college / undergraduate (56 | 23.0%).
| School Level | # Students | % Students |
| Nursery / Preschool | 13 | 5.3% |
| Kindergarten | 16 | 6.6% |
| Elementary School | 66 | 27.1% |
| Middle School | 30 | 12.3% |
| High School | 61 | 25.0% |
| College / Undergraduate | 56 | 23.0% |
| Graduate / Professional | 2 | 0.8% |
| Total | 244 | 100.0% |
School Enrollment by Age by Funding Source in Campobello
Out of a total of 244 students who are enrolled in schools in Campobello, 40 (16.4%) attend a private institution, while the remaining 204 (83.6%) are enrolled in public schools. The age group of 20 to 24 year olds has the highest likelihood of being enrolled in private schools, with 14 (63.6% in the age bracket) enrolled. Conversely, the age group of 3 to 4 year olds has the lowest likelihood of being enrolled in a private school, with 9 (100.0% in the age bracket) attending a public institution.
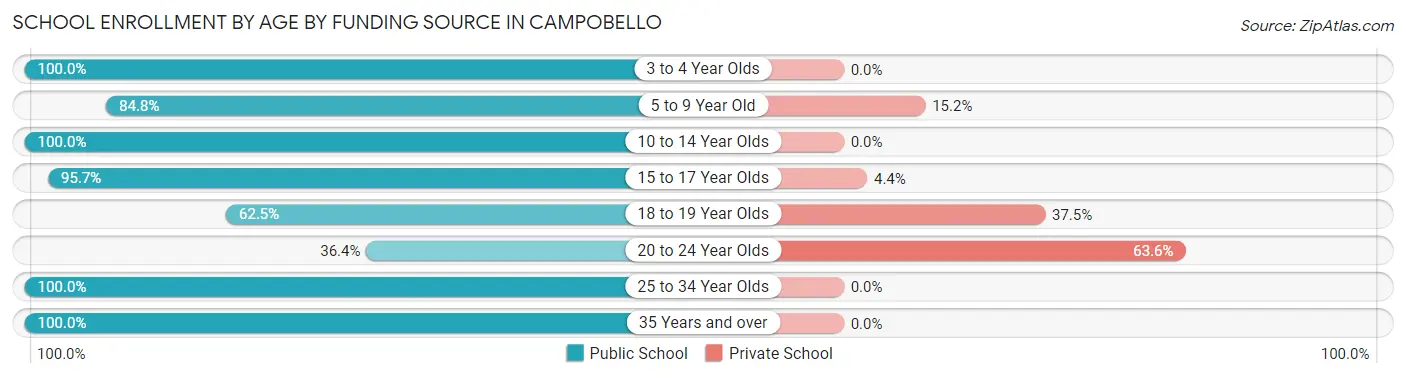
| Age Bracket | Public School | Private School |
| 3 to 4 Year Olds | 9 (100.0%) | 0 (0.0%) |
| 5 to 9 Year Old | 67 (84.8%) | 12 (15.2%) |
| 10 to 14 Year Olds | 45 (100.0%) | 0 (0.0%) |
| 15 to 17 Year Olds | 44 (95.7%) | 2 (4.3%) |
| 18 to 19 Year Olds | 20 (62.5%) | 12 (37.5%) |
| 20 to 24 Year Olds | 8 (36.4%) | 14 (63.6%) |
| 25 to 34 Year Olds | 10 (100.0%) | 0 (0.0%) |
| 35 Years and over | 1 (100.0%) | 0 (0.0%) |
| Total | 204 (83.6%) | 40 (16.4%) |
Educational Attainment by Field of Study in Campobello
Arts & humanities (28 | 23.3%), education (23 | 19.2%), business (13 | 10.8%), liberal arts & history (13 | 10.8%), and literature & languages (10 | 8.3%) are the most common fields of study among 120 individuals in Campobello who have obtained a bachelor's degree or higher.
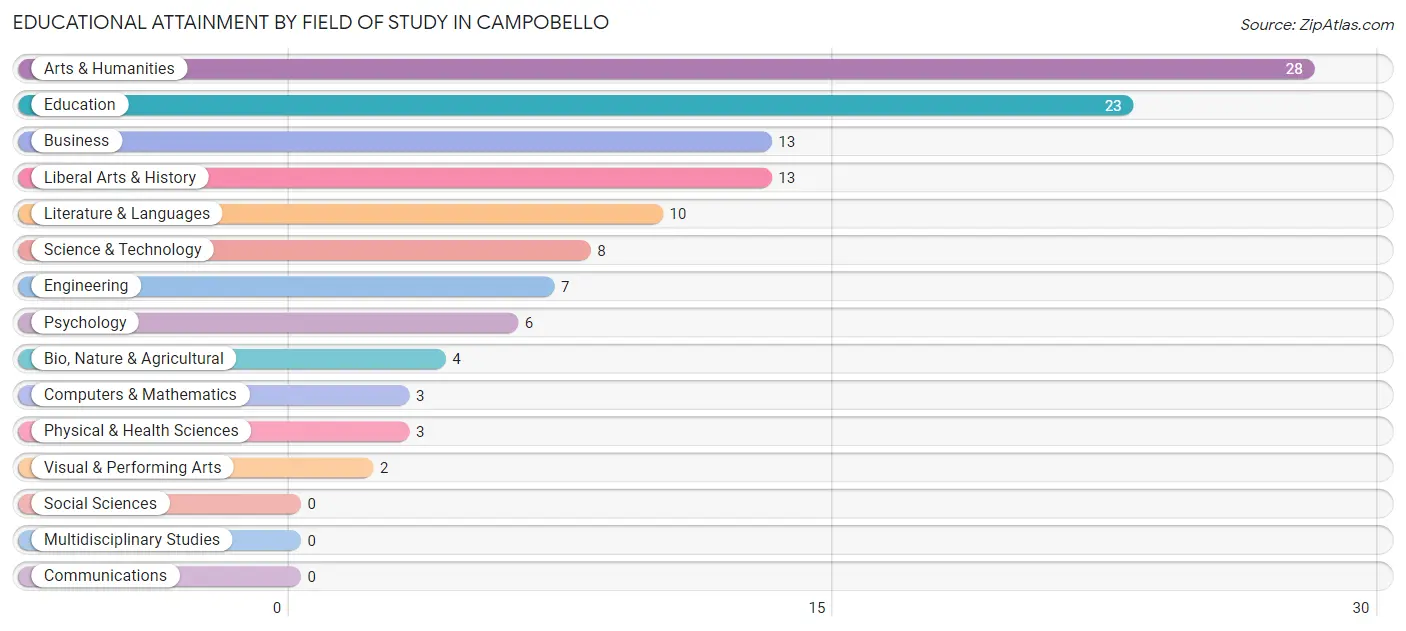
| Field of Study | # Graduates | % Graduates |
| Computers & Mathematics | 3 | 2.5% |
| Bio, Nature & Agricultural | 4 | 3.3% |
| Physical & Health Sciences | 3 | 2.5% |
| Psychology | 6 | 5.0% |
| Social Sciences | 0 | 0.0% |
| Engineering | 7 | 5.8% |
| Multidisciplinary Studies | 0 | 0.0% |
| Science & Technology | 8 | 6.7% |
| Business | 13 | 10.8% |
| Education | 23 | 19.2% |
| Literature & Languages | 10 | 8.3% |
| Liberal Arts & History | 13 | 10.8% |
| Visual & Performing Arts | 2 | 1.7% |
| Communications | 0 | 0.0% |
| Arts & Humanities | 28 | 23.3% |
| Total | 120 | 100.0% |
Transportation & Commute in Campobello
Vehicle Availability by Sex in Campobello
The most prevalent vehicle ownership categories in Campobello are males with 4 vehicles (65, accounting for 29.0%) and females with 4 vehicles (43, making up 33.5%).
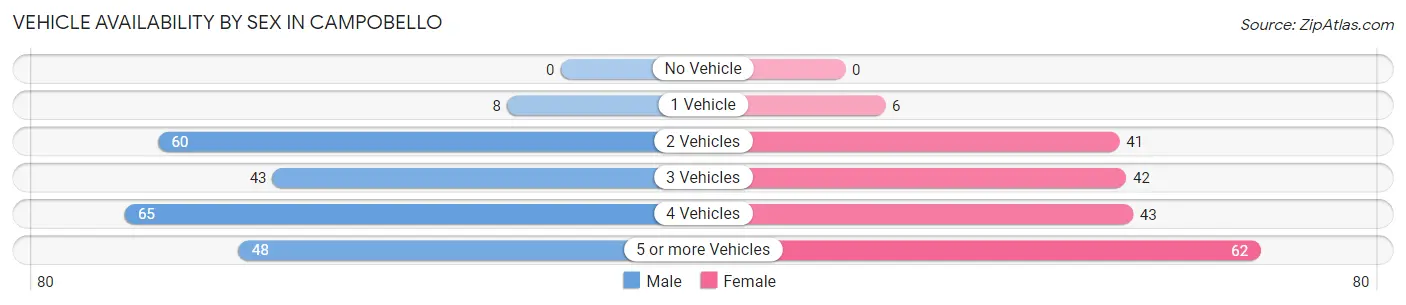
| Vehicles Available | Male | Female |
| No Vehicle | 0 (0.0%) | 0 (0.0%) |
| 1 Vehicle | 8 (3.6%) | 6 (3.1%) |
| 2 Vehicles | 60 (26.8%) | 41 (21.1%) |
| 3 Vehicles | 43 (19.2%) | 42 (21.6%) |
| 4 Vehicles | 65 (29.0%) | 43 (22.2%) |
| 5 or more Vehicles | 48 (21.4%) | 62 (32.0%) |
| Total | 224 (100.0%) | 194 (100.0%) |
Commute Time in Campobello
The most frequently occuring commute durations in Campobello are 30 to 34 minutes (62 commuters, 16.8%), 20 to 24 minutes (60 commuters, 16.2%), and 45 to 59 minutes (57 commuters, 15.4%).
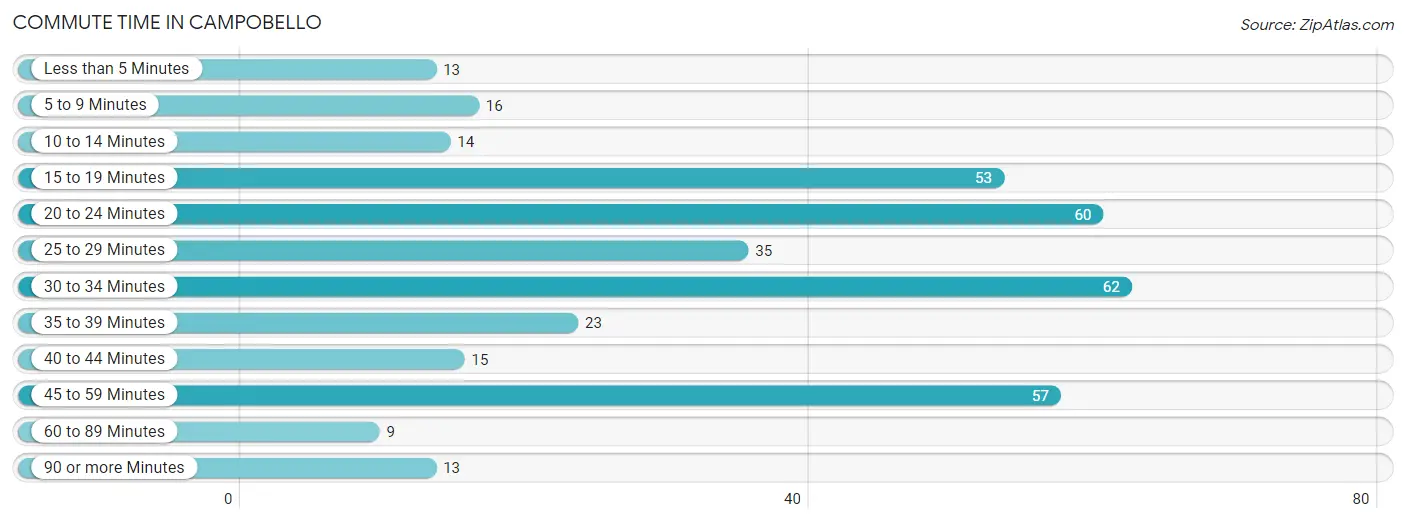
| Commute Time | # Commuters | % Commuters |
| Less than 5 Minutes | 13 | 3.5% |
| 5 to 9 Minutes | 16 | 4.3% |
| 10 to 14 Minutes | 14 | 3.8% |
| 15 to 19 Minutes | 53 | 14.3% |
| 20 to 24 Minutes | 60 | 16.2% |
| 25 to 29 Minutes | 35 | 9.5% |
| 30 to 34 Minutes | 62 | 16.8% |
| 35 to 39 Minutes | 23 | 6.2% |
| 40 to 44 Minutes | 15 | 4.1% |
| 45 to 59 Minutes | 57 | 15.4% |
| 60 to 89 Minutes | 9 | 2.4% |
| 90 or more Minutes | 13 | 3.5% |
Commute Time by Sex in Campobello
The most common commute times in Campobello are 45 to 59 minutes (49 commuters, 22.8%) for males and 20 to 24 minutes (36 commuters, 23.2%) for females.
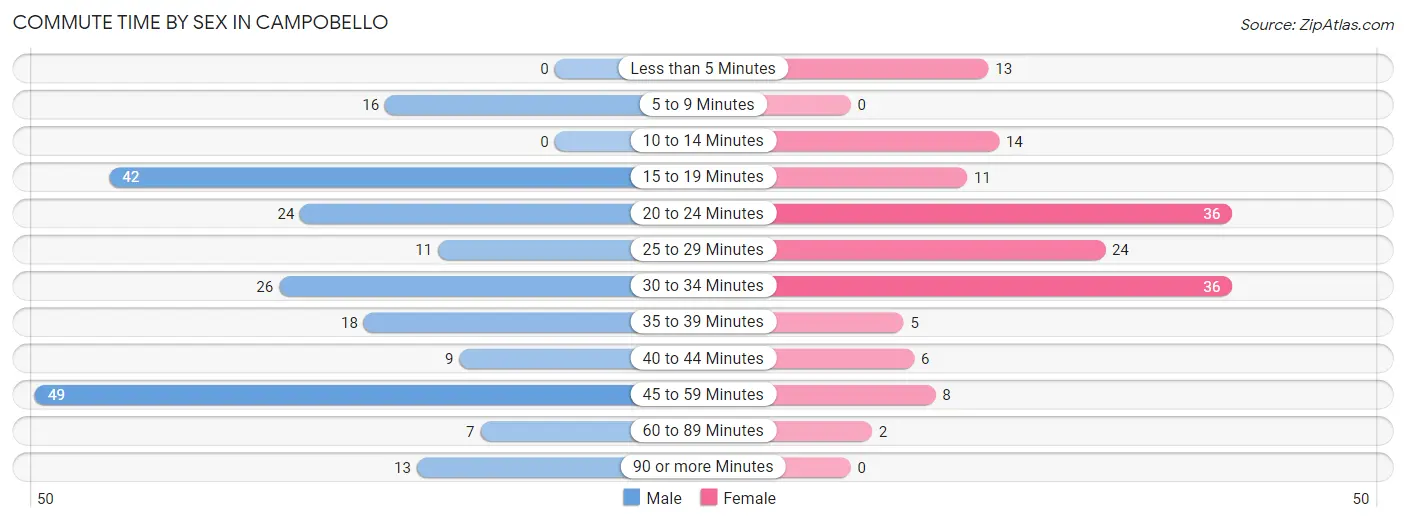
| Commute Time | Male | Female |
| Less than 5 Minutes | 0 (0.0%) | 13 (8.4%) |
| 5 to 9 Minutes | 16 (7.4%) | 0 (0.0%) |
| 10 to 14 Minutes | 0 (0.0%) | 14 (9.0%) |
| 15 to 19 Minutes | 42 (19.5%) | 11 (7.1%) |
| 20 to 24 Minutes | 24 (11.2%) | 36 (23.2%) |
| 25 to 29 Minutes | 11 (5.1%) | 24 (15.5%) |
| 30 to 34 Minutes | 26 (12.1%) | 36 (23.2%) |
| 35 to 39 Minutes | 18 (8.4%) | 5 (3.2%) |
| 40 to 44 Minutes | 9 (4.2%) | 6 (3.9%) |
| 45 to 59 Minutes | 49 (22.8%) | 8 (5.2%) |
| 60 to 89 Minutes | 7 (3.3%) | 2 (1.3%) |
| 90 or more Minutes | 13 (6.0%) | 0 (0.0%) |
Time of Departure to Work by Sex in Campobello
The most frequent times of departure to work in Campobello are 7:30 AM to 7:59 AM (43, 20.0%) for males and 12:00 PM to 3:59 PM (21, 13.6%) for females.
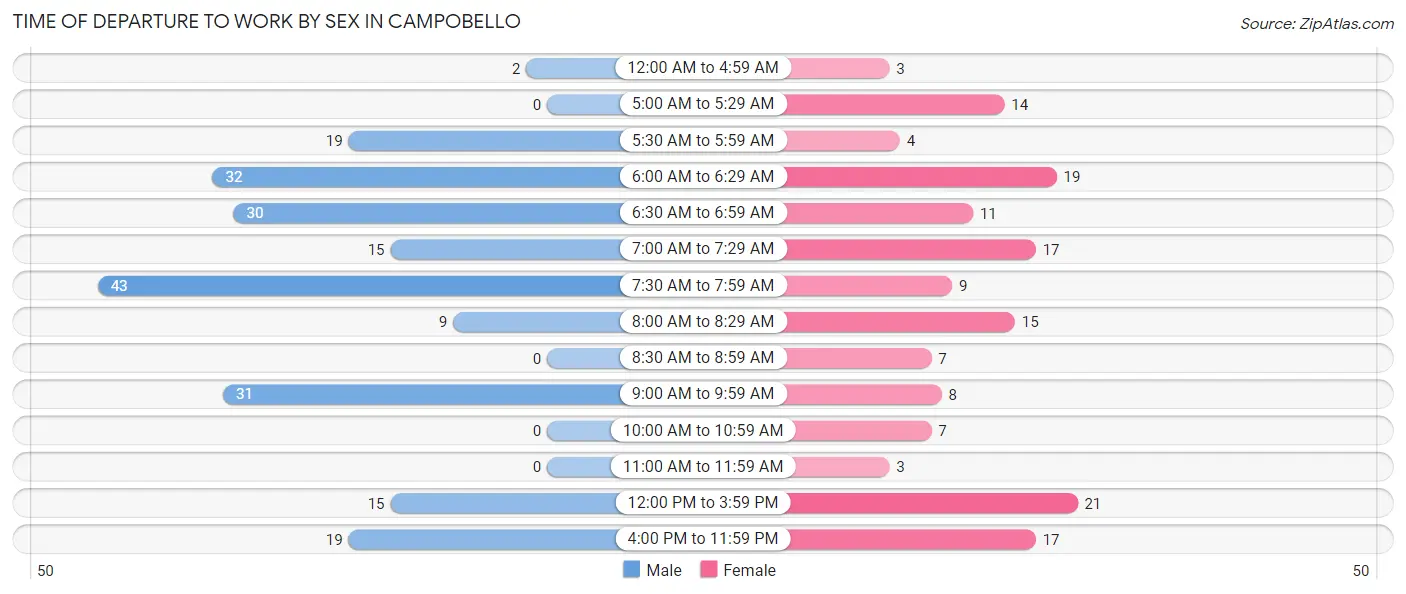
| Time of Departure | Male | Female |
| 12:00 AM to 4:59 AM | 2 (0.9%) | 3 (1.9%) |
| 5:00 AM to 5:29 AM | 0 (0.0%) | 14 (9.0%) |
| 5:30 AM to 5:59 AM | 19 (8.8%) | 4 (2.6%) |
| 6:00 AM to 6:29 AM | 32 (14.9%) | 19 (12.3%) |
| 6:30 AM to 6:59 AM | 30 (14.0%) | 11 (7.1%) |
| 7:00 AM to 7:29 AM | 15 (7.0%) | 17 (11.0%) |
| 7:30 AM to 7:59 AM | 43 (20.0%) | 9 (5.8%) |
| 8:00 AM to 8:29 AM | 9 (4.2%) | 15 (9.7%) |
| 8:30 AM to 8:59 AM | 0 (0.0%) | 7 (4.5%) |
| 9:00 AM to 9:59 AM | 31 (14.4%) | 8 (5.2%) |
| 10:00 AM to 10:59 AM | 0 (0.0%) | 7 (4.5%) |
| 11:00 AM to 11:59 AM | 0 (0.0%) | 3 (1.9%) |
| 12:00 PM to 3:59 PM | 15 (7.0%) | 21 (13.6%) |
| 4:00 PM to 11:59 PM | 19 (8.8%) | 17 (11.0%) |
| Total | 215 (100.0%) | 155 (100.0%) |
Housing Occupancy in Campobello
Occupancy by Ownership in Campobello
Of the total 262 dwellings in Campobello, owner-occupied units account for 196 (74.8%), while renter-occupied units make up 66 (25.2%).
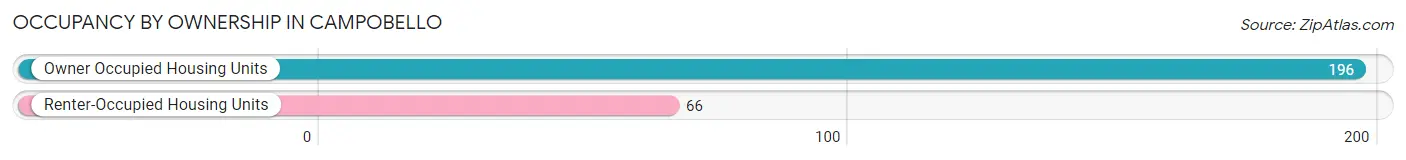
| Occupancy | # Housing Units | % Housing Units |
| Owner Occupied Housing Units | 196 | 74.8% |
| Renter-Occupied Housing Units | 66 | 25.2% |
| Total Occupied Housing Units | 262 | 100.0% |
Occupancy by Household Size in Campobello
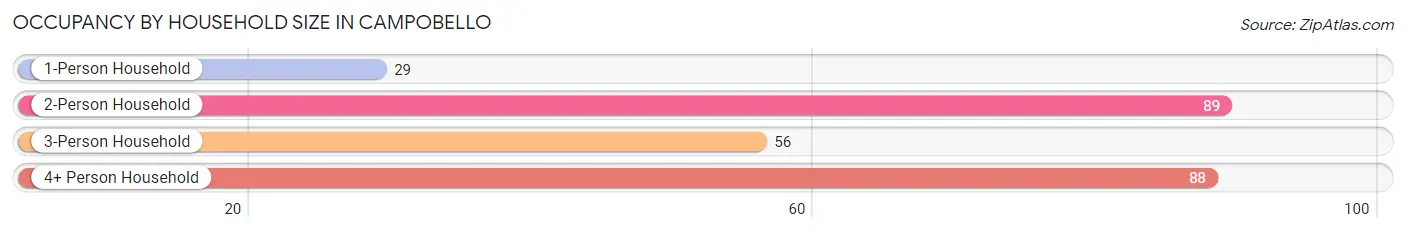
| Household Size | # Housing Units | % Housing Units |
| 1-Person Household | 29 | 11.1% |
| 2-Person Household | 89 | 34.0% |
| 3-Person Household | 56 | 21.4% |
| 4+ Person Household | 88 | 33.6% |
| Total Housing Units | 262 | 100.0% |
Occupancy by Ownership by Household Size in Campobello
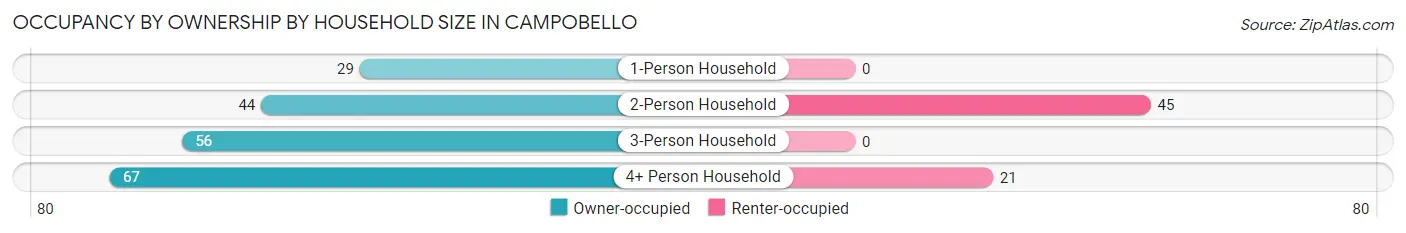
| Household Size | Owner-occupied | Renter-occupied |
| 1-Person Household | 29 (100.0%) | 0 (0.0%) |
| 2-Person Household | 44 (49.4%) | 45 (50.6%) |
| 3-Person Household | 56 (100.0%) | 0 (0.0%) |
| 4+ Person Household | 67 (76.1%) | 21 (23.9%) |
| Total Housing Units | 196 (74.8%) | 66 (25.2%) |
Occupancy by Educational Attainment in Campobello
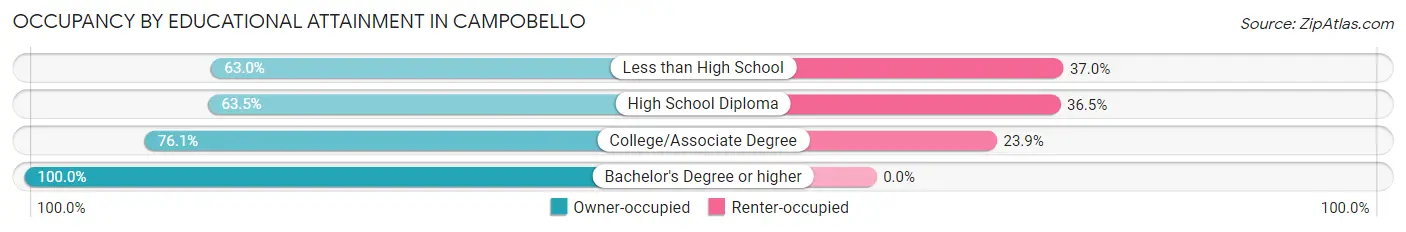
| Household Size | Owner-occupied | Renter-occupied |
| Less than High School | 17 (63.0%) | 10 (37.0%) |
| High School Diploma | 61 (63.5%) | 35 (36.5%) |
| College/Associate Degree | 67 (76.1%) | 21 (23.9%) |
| Bachelor's Degree or higher | 51 (100.0%) | 0 (0.0%) |
Occupancy by Age of Householder in Campobello
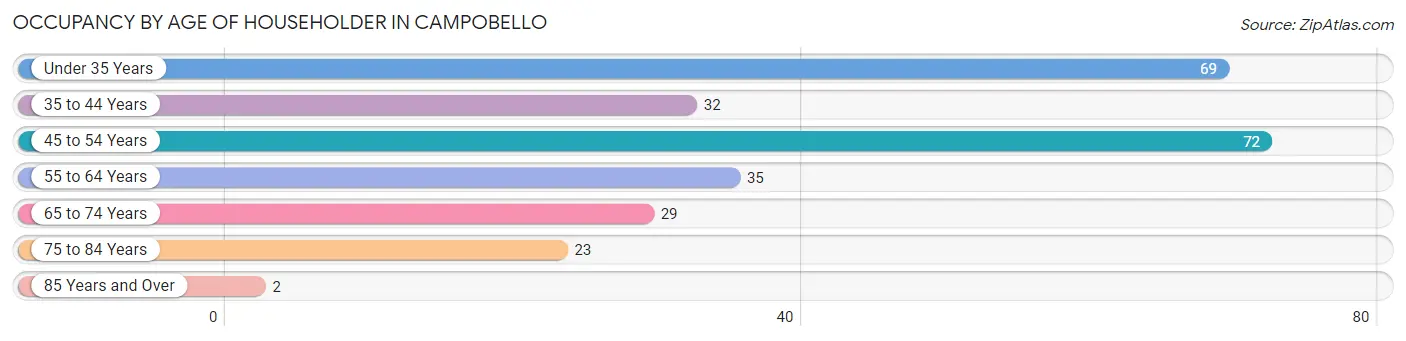
| Age Bracket | # Households | % Households |
| Under 35 Years | 69 | 26.3% |
| 35 to 44 Years | 32 | 12.2% |
| 45 to 54 Years | 72 | 27.5% |
| 55 to 64 Years | 35 | 13.4% |
| 65 to 74 Years | 29 | 11.1% |
| 75 to 84 Years | 23 | 8.8% |
| 85 Years and Over | 2 | 0.8% |
| Total | 262 | 100.0% |
Housing Finances in Campobello
Median Income by Occupancy in Campobello
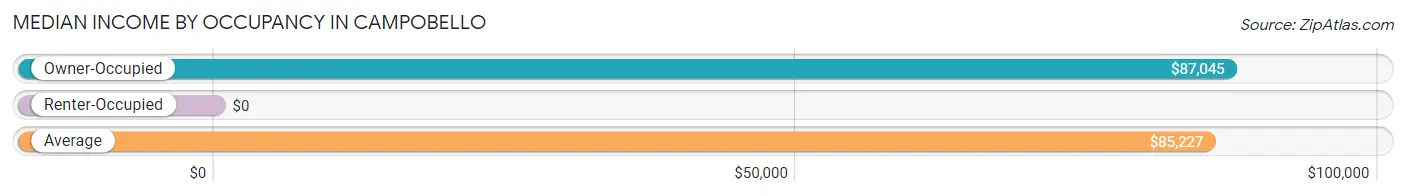
| Occupancy Type | # Households | Median Income |
| Owner-Occupied | 196 (74.8%) | $87,045 |
| Renter-Occupied | 66 (25.2%) | $0 |
| Average | 262 (100.0%) | $85,227 |
Occupancy by Householder Income Bracket in Campobello
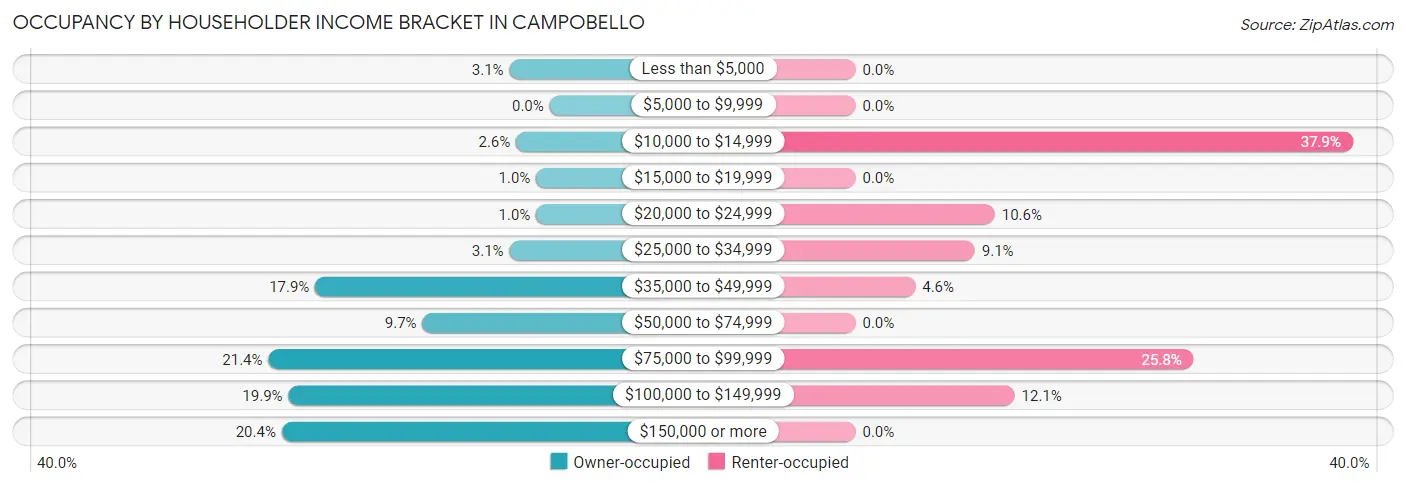
| Income Bracket | Owner-occupied | Renter-occupied |
| Less than $5,000 | 6 (3.1%) | 0 (0.0%) |
| $5,000 to $9,999 | 0 (0.0%) | 0 (0.0%) |
| $10,000 to $14,999 | 5 (2.5%) | 25 (37.9%) |
| $15,000 to $19,999 | 2 (1.0%) | 0 (0.0%) |
| $20,000 to $24,999 | 2 (1.0%) | 7 (10.6%) |
| $25,000 to $34,999 | 6 (3.1%) | 6 (9.1%) |
| $35,000 to $49,999 | 35 (17.9%) | 3 (4.5%) |
| $50,000 to $74,999 | 19 (9.7%) | 0 (0.0%) |
| $75,000 to $99,999 | 42 (21.4%) | 17 (25.8%) |
| $100,000 to $149,999 | 39 (19.9%) | 8 (12.1%) |
| $150,000 or more | 40 (20.4%) | 0 (0.0%) |
| Total | 196 (100.0%) | 66 (100.0%) |
Monthly Housing Cost Tiers in Campobello
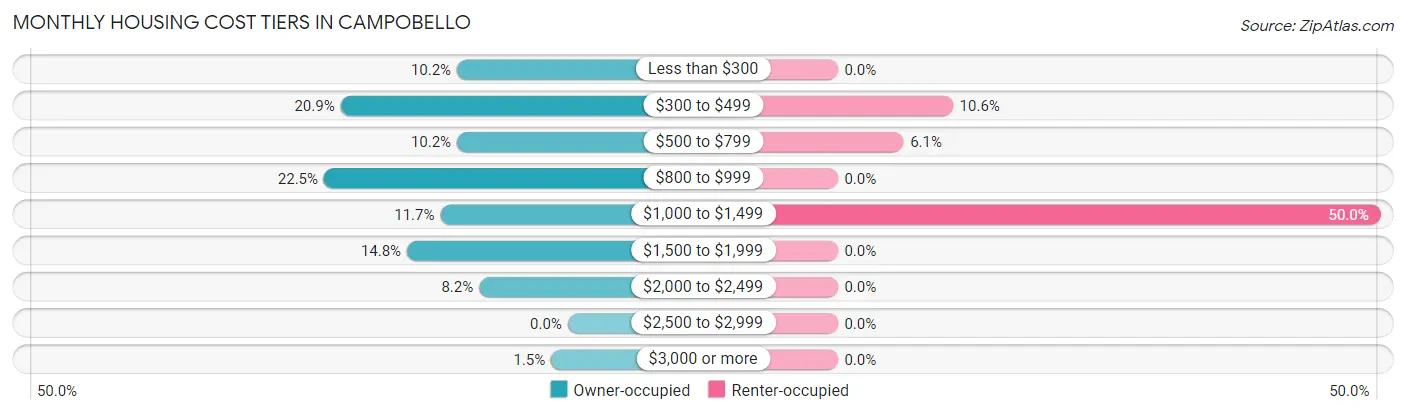
| Monthly Cost | Owner-occupied | Renter-occupied |
| Less than $300 | 20 (10.2%) | 0 (0.0%) |
| $300 to $499 | 41 (20.9%) | 7 (10.6%) |
| $500 to $799 | 20 (10.2%) | 4 (6.1%) |
| $800 to $999 | 44 (22.5%) | 0 (0.0%) |
| $1,000 to $1,499 | 23 (11.7%) | 33 (50.0%) |
| $1,500 to $1,999 | 29 (14.8%) | 0 (0.0%) |
| $2,000 to $2,499 | 16 (8.2%) | 0 (0.0%) |
| $2,500 to $2,999 | 0 (0.0%) | 0 (0.0%) |
| $3,000 or more | 3 (1.5%) | 0 (0.0%) |
| Total | 196 (100.0%) | 66 (100.0%) |
Physical Housing Characteristics in Campobello
Housing Structures in Campobello
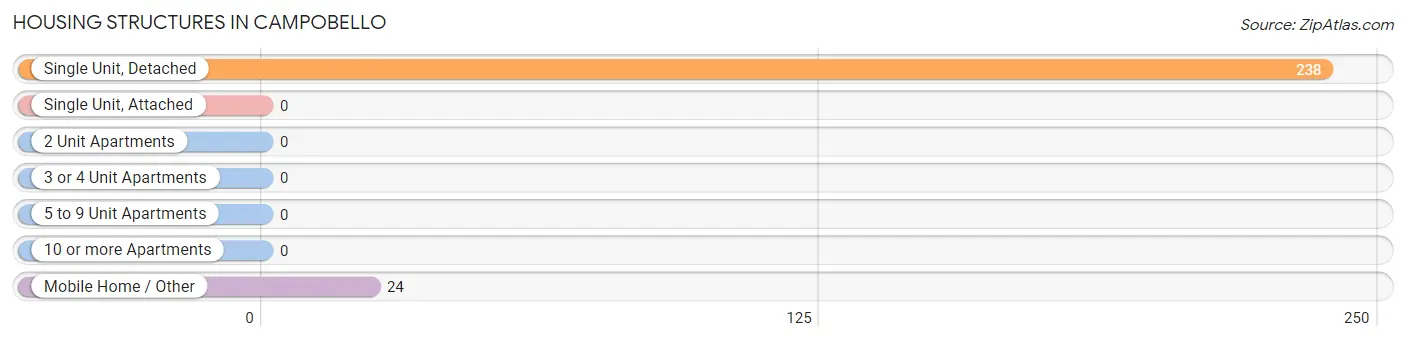
| Structure Type | # Housing Units | % Housing Units |
| Single Unit, Detached | 238 | 90.8% |
| Single Unit, Attached | 0 | 0.0% |
| 2 Unit Apartments | 0 | 0.0% |
| 3 or 4 Unit Apartments | 0 | 0.0% |
| 5 to 9 Unit Apartments | 0 | 0.0% |
| 10 or more Apartments | 0 | 0.0% |
| Mobile Home / Other | 24 | 9.2% |
| Total | 262 | 100.0% |
Housing Structures by Occupancy in Campobello
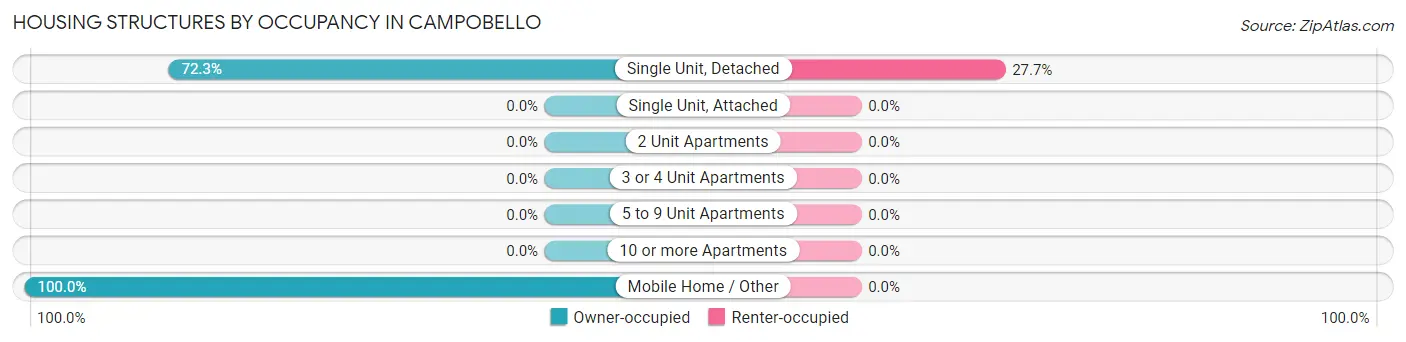
| Structure Type | Owner-occupied | Renter-occupied |
| Single Unit, Detached | 172 (72.3%) | 66 (27.7%) |
| Single Unit, Attached | 0 (0.0%) | 0 (0.0%) |
| 2 Unit Apartments | 0 (0.0%) | 0 (0.0%) |
| 3 or 4 Unit Apartments | 0 (0.0%) | 0 (0.0%) |
| 5 to 9 Unit Apartments | 0 (0.0%) | 0 (0.0%) |
| 10 or more Apartments | 0 (0.0%) | 0 (0.0%) |
| Mobile Home / Other | 24 (100.0%) | 0 (0.0%) |
| Total | 196 (74.8%) | 66 (25.2%) |
Housing Structures by Number of Rooms in Campobello
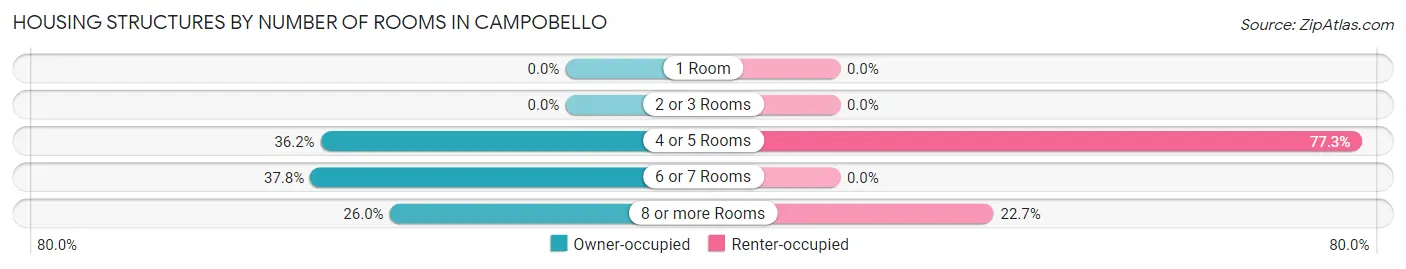
| Number of Rooms | Owner-occupied | Renter-occupied |
| 1 Room | 0 (0.0%) | 0 (0.0%) |
| 2 or 3 Rooms | 0 (0.0%) | 0 (0.0%) |
| 4 or 5 Rooms | 71 (36.2%) | 51 (77.3%) |
| 6 or 7 Rooms | 74 (37.8%) | 0 (0.0%) |
| 8 or more Rooms | 51 (26.0%) | 15 (22.7%) |
| Total | 196 (100.0%) | 66 (100.0%) |
Housing Structure by Heating Type in Campobello
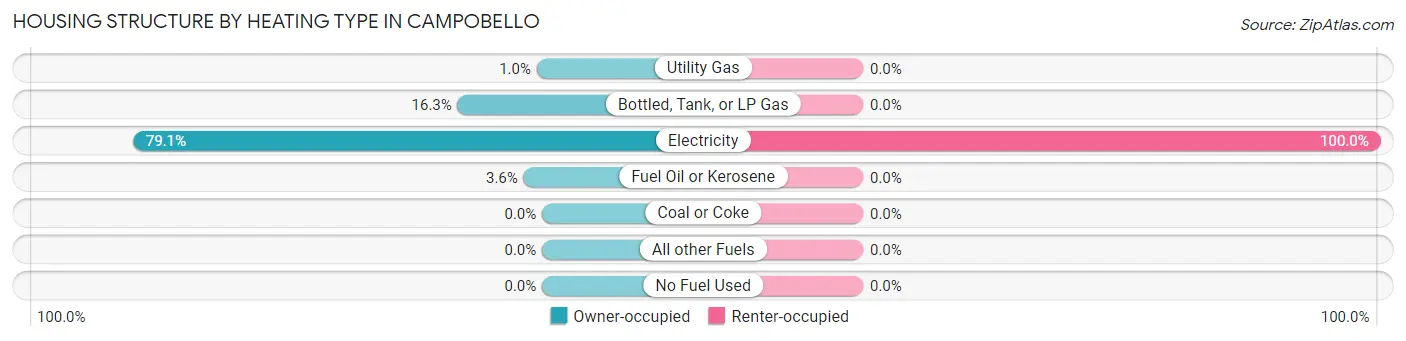
| Heating Type | Owner-occupied | Renter-occupied |
| Utility Gas | 2 (1.0%) | 0 (0.0%) |
| Bottled, Tank, or LP Gas | 32 (16.3%) | 0 (0.0%) |
| Electricity | 155 (79.1%) | 66 (100.0%) |
| Fuel Oil or Kerosene | 7 (3.6%) | 0 (0.0%) |
| Coal or Coke | 0 (0.0%) | 0 (0.0%) |
| All other Fuels | 0 (0.0%) | 0 (0.0%) |
| No Fuel Used | 0 (0.0%) | 0 (0.0%) |
| Total | 196 (100.0%) | 66 (100.0%) |
Household Vehicle Usage in Campobello
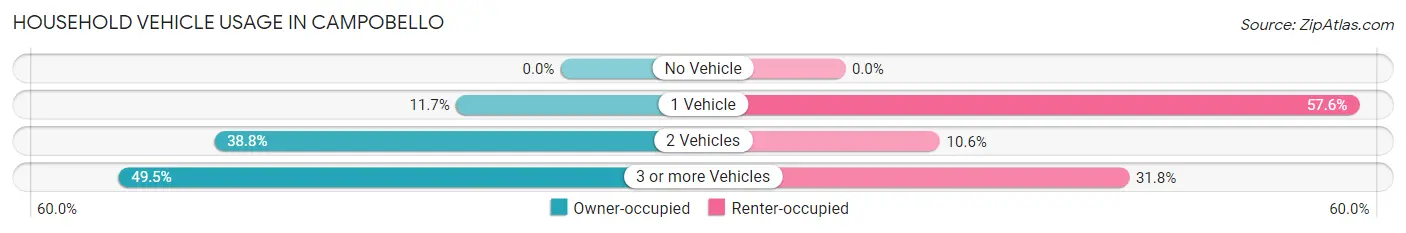
| Vehicles per Household | Owner-occupied | Renter-occupied |
| No Vehicle | 0 (0.0%) | 0 (0.0%) |
| 1 Vehicle | 23 (11.7%) | 38 (57.6%) |
| 2 Vehicles | 76 (38.8%) | 7 (10.6%) |
| 3 or more Vehicles | 97 (49.5%) | 21 (31.8%) |
| Total | 196 (100.0%) | 66 (100.0%) |
Real Estate & Mortgages in Campobello
Real Estate and Mortgage Overview in Campobello
| Characteristic | Without Mortgage | With Mortgage |
| Housing Units | 70 | 126 |
| Median Property Value | $112,500 | $266,700 |
| Median Household Income | $66,250 | $34 |
| Monthly Housing Costs | $370 | $3 |
| Real Estate Taxes | $927 | $0 |
Property Value by Mortgage Status in Campobello
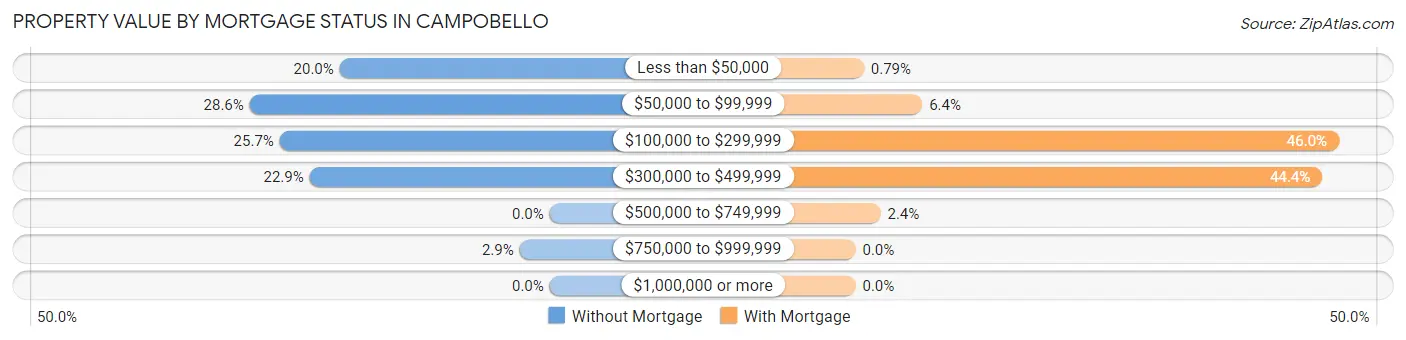
| Property Value | Without Mortgage | With Mortgage |
| Less than $50,000 | 14 (20.0%) | 1 (0.8%) |
| $50,000 to $99,999 | 20 (28.6%) | 8 (6.4%) |
| $100,000 to $299,999 | 18 (25.7%) | 58 (46.0%) |
| $300,000 to $499,999 | 16 (22.9%) | 56 (44.4%) |
| $500,000 to $749,999 | 0 (0.0%) | 3 (2.4%) |
| $750,000 to $999,999 | 2 (2.9%) | 0 (0.0%) |
| $1,000,000 or more | 0 (0.0%) | 0 (0.0%) |
| Total | 70 (100.0%) | 126 (100.0%) |
Household Income by Mortgage Status in Campobello
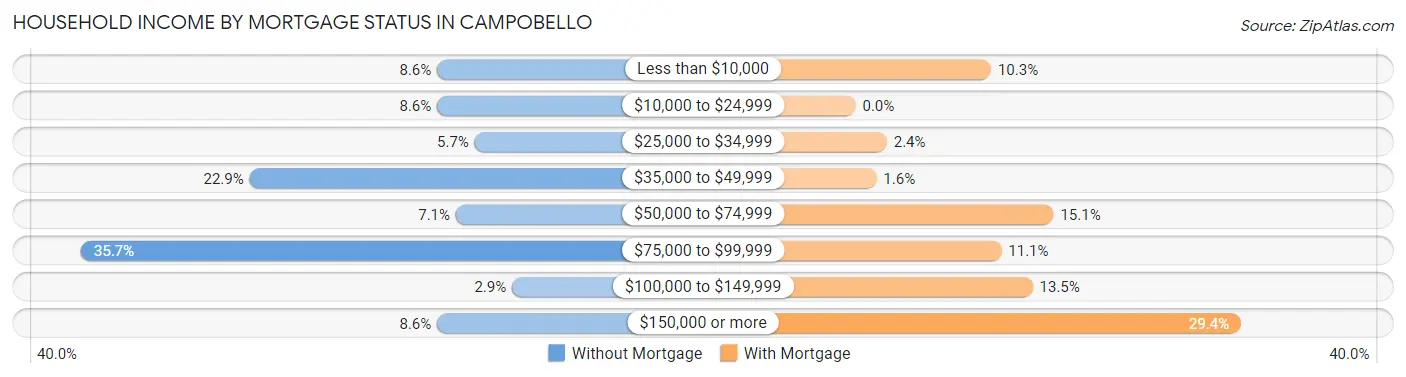
| Household Income | Without Mortgage | With Mortgage |
| Less than $10,000 | 6 (8.6%) | 13 (10.3%) |
| $10,000 to $24,999 | 6 (8.6%) | 0 (0.0%) |
| $25,000 to $34,999 | 4 (5.7%) | 3 (2.4%) |
| $35,000 to $49,999 | 16 (22.9%) | 2 (1.6%) |
| $50,000 to $74,999 | 5 (7.1%) | 19 (15.1%) |
| $75,000 to $99,999 | 25 (35.7%) | 14 (11.1%) |
| $100,000 to $149,999 | 2 (2.9%) | 17 (13.5%) |
| $150,000 or more | 6 (8.6%) | 37 (29.4%) |
| Total | 70 (100.0%) | 126 (100.0%) |
Property Value to Household Income Ratio in Campobello
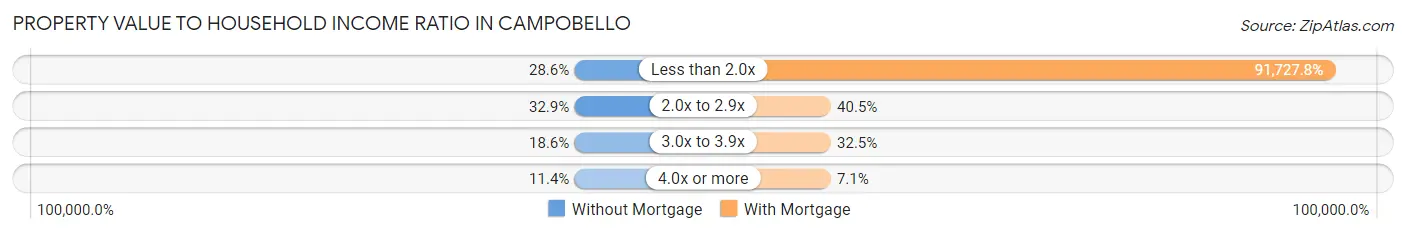
| Value-to-Income Ratio | Without Mortgage | With Mortgage |
| Less than 2.0x | 20 (28.6%) | 115,577 (91,727.8%) |
| 2.0x to 2.9x | 23 (32.9%) | 51 (40.5%) |
| 3.0x to 3.9x | 13 (18.6%) | 41 (32.5%) |
| 4.0x or more | 8 (11.4%) | 9 (7.1%) |
| Total | 70 (100.0%) | 126 (100.0%) |
Real Estate Taxes by Mortgage Status in Campobello
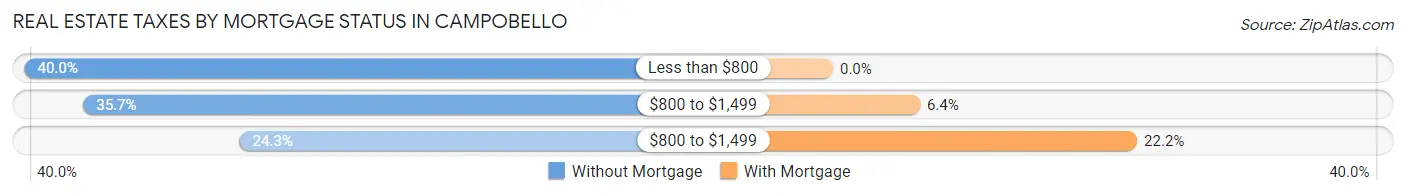
| Property Taxes | Without Mortgage | With Mortgage |
| Less than $800 | 28 (40.0%) | 0 (0.0%) |
| $800 to $1,499 | 25 (35.7%) | 8 (6.4%) |
| $800 to $1,499 | 17 (24.3%) | 28 (22.2%) |
| Total | 70 (100.0%) | 126 (100.0%) |
Health & Disability in Campobello
Health Insurance Coverage by Age in Campobello
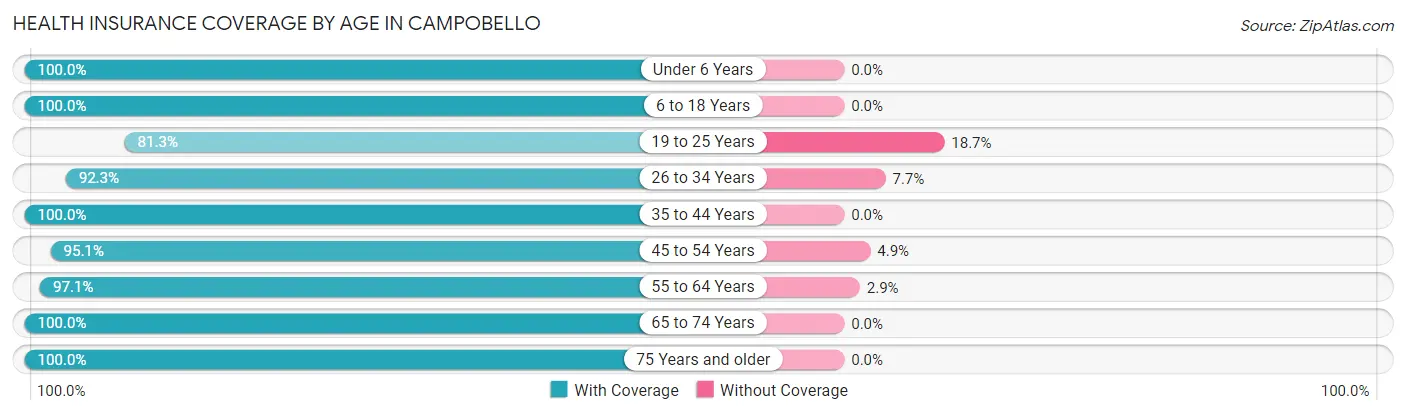
| Age Bracket | With Coverage | Without Coverage |
| Under 6 Years | 71 (100.0%) | 0 (0.0%) |
| 6 to 18 Years | 185 (100.0%) | 0 (0.0%) |
| 19 to 25 Years | 109 (81.3%) | 25 (18.7%) |
| 26 to 34 Years | 96 (92.3%) | 8 (7.7%) |
| 35 to 44 Years | 61 (100.0%) | 0 (0.0%) |
| 45 to 54 Years | 137 (95.1%) | 7 (4.9%) |
| 55 to 64 Years | 67 (97.1%) | 2 (2.9%) |
| 65 to 74 Years | 51 (100.0%) | 0 (0.0%) |
| 75 Years and older | 47 (100.0%) | 0 (0.0%) |
| Total | 824 (95.2%) | 42 (4.9%) |
Health Insurance Coverage by Citizenship Status in Campobello
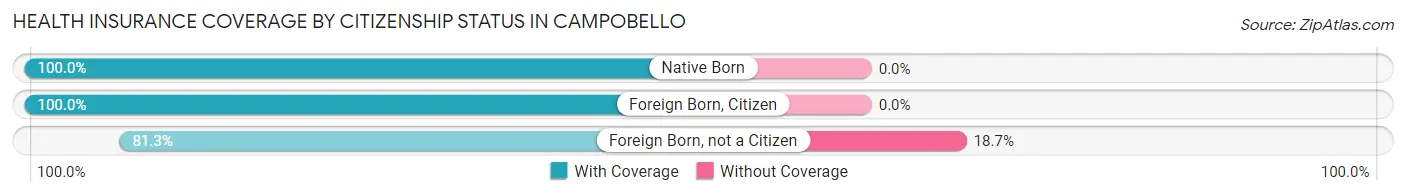
| Citizenship Status | With Coverage | Without Coverage |
| Native Born | 71 (100.0%) | 0 (0.0%) |
| Foreign Born, Citizen | 185 (100.0%) | 0 (0.0%) |
| Foreign Born, not a Citizen | 109 (81.3%) | 25 (18.7%) |
Health Insurance Coverage by Household Income in Campobello
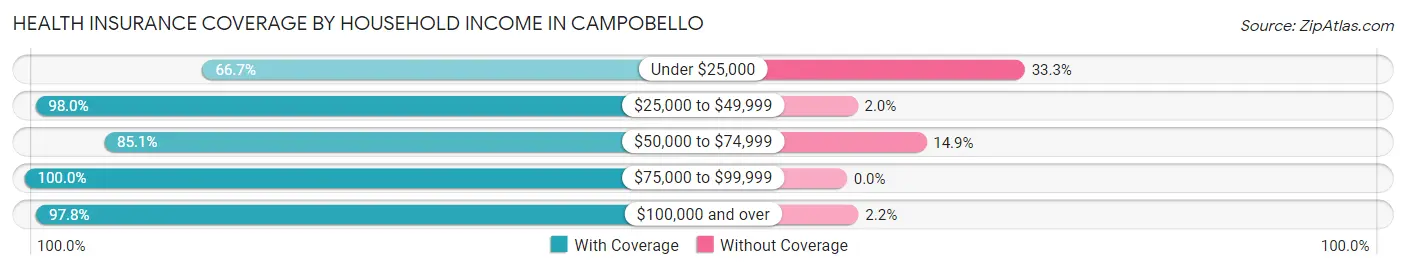
| Household Income | With Coverage | Without Coverage |
| Under $25,000 | 50 (66.7%) | 25 (33.3%) |
| $25,000 to $49,999 | 146 (98.0%) | 3 (2.0%) |
| $50,000 to $74,999 | 40 (85.1%) | 7 (14.9%) |
| $75,000 to $99,999 | 272 (100.0%) | 0 (0.0%) |
| $100,000 and over | 316 (97.8%) | 7 (2.2%) |
Public vs Private Health Insurance Coverage by Age in Campobello
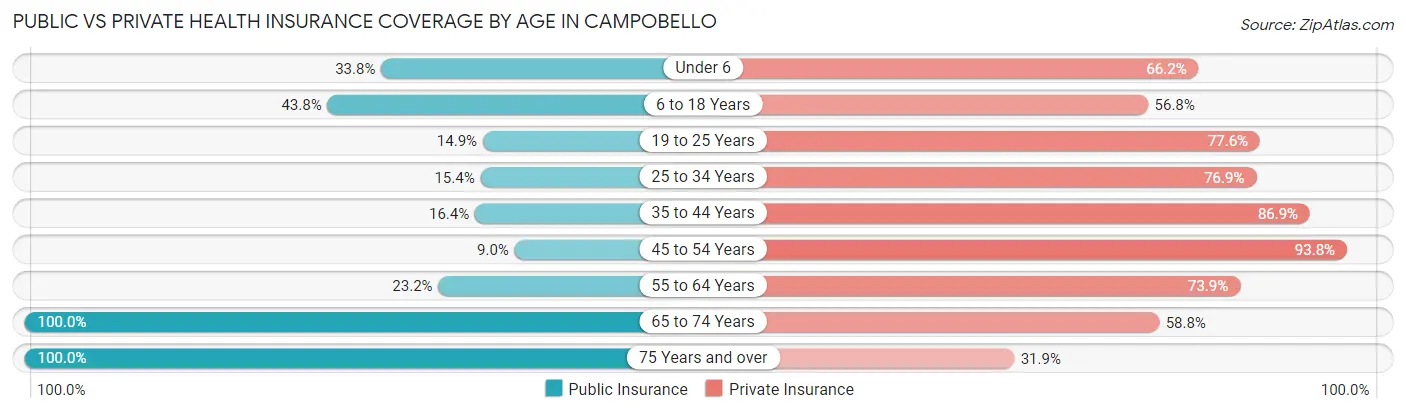
| Age Bracket | Public Insurance | Private Insurance |
| Under 6 | 24 (33.8%) | 47 (66.2%) |
| 6 to 18 Years | 81 (43.8%) | 105 (56.8%) |
| 19 to 25 Years | 20 (14.9%) | 104 (77.6%) |
| 25 to 34 Years | 16 (15.4%) | 80 (76.9%) |
| 35 to 44 Years | 10 (16.4%) | 53 (86.9%) |
| 45 to 54 Years | 13 (9.0%) | 135 (93.8%) |
| 55 to 64 Years | 16 (23.2%) | 51 (73.9%) |
| 65 to 74 Years | 51 (100.0%) | 30 (58.8%) |
| 75 Years and over | 47 (100.0%) | 15 (31.9%) |
| Total | 278 (32.1%) | 620 (71.6%) |
Disability Status by Sex by Age in Campobello
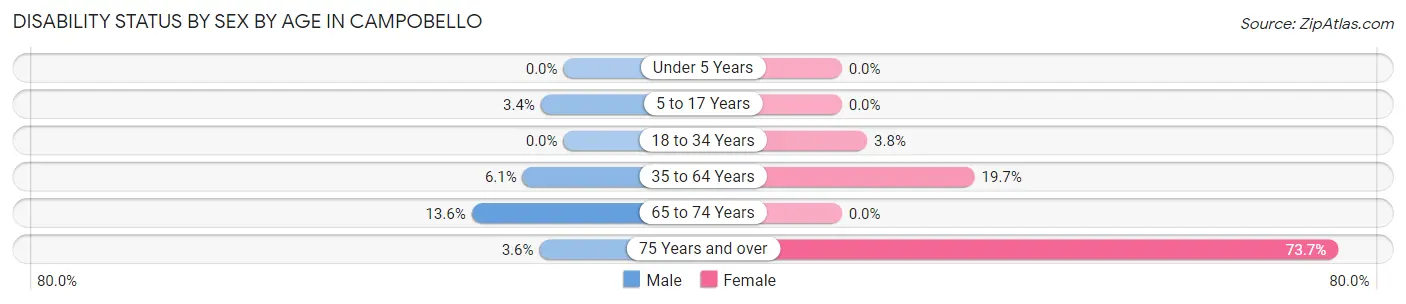
| Age Bracket | Male | Female |
| Under 5 Years | 0 (0.0%) | 0 (0.0%) |
| 5 to 17 Years | 3 (3.4%) | 0 (0.0%) |
| 18 to 34 Years | 0 (0.0%) | 6 (3.8%) |
| 35 to 64 Years | 8 (6.1%) | 28 (19.7%) |
| 65 to 74 Years | 3 (13.6%) | 0 (0.0%) |
| 75 Years and over | 1 (3.6%) | 14 (73.7%) |
Disability Class by Sex by Age in Campobello
Disability Class: Hearing Difficulty
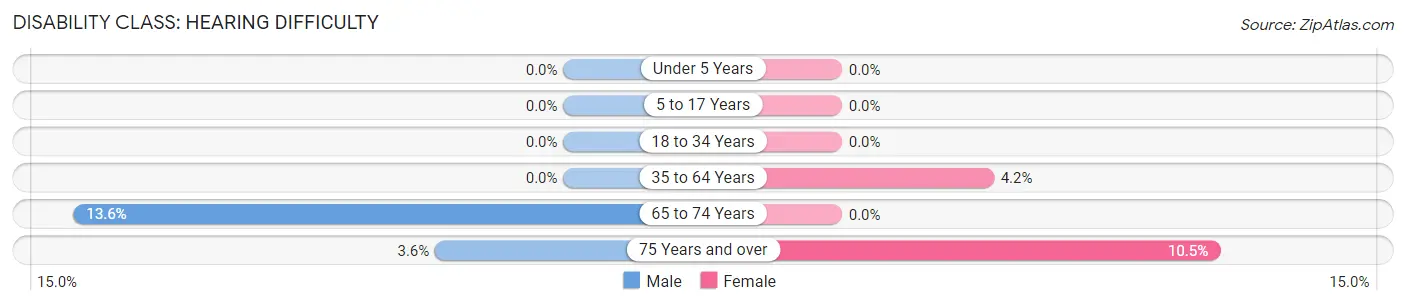
| Age Bracket | Male | Female |
| Under 5 Years | 0 (0.0%) | 0 (0.0%) |
| 5 to 17 Years | 0 (0.0%) | 0 (0.0%) |
| 18 to 34 Years | 0 (0.0%) | 0 (0.0%) |
| 35 to 64 Years | 0 (0.0%) | 6 (4.2%) |
| 65 to 74 Years | 3 (13.6%) | 0 (0.0%) |
| 75 Years and over | 1 (3.6%) | 2 (10.5%) |
Disability Class: Vision Difficulty
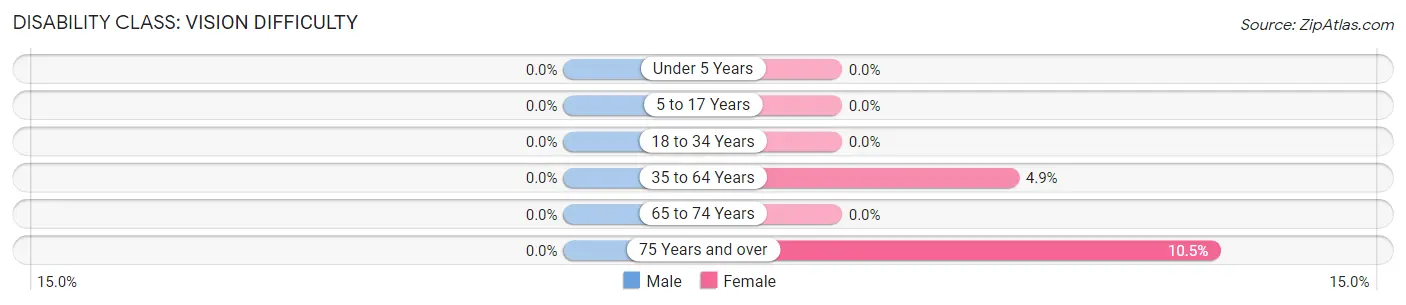
| Age Bracket | Male | Female |
| Under 5 Years | 0 (0.0%) | 0 (0.0%) |
| 5 to 17 Years | 0 (0.0%) | 0 (0.0%) |
| 18 to 34 Years | 0 (0.0%) | 0 (0.0%) |
| 35 to 64 Years | 0 (0.0%) | 7 (4.9%) |
| 65 to 74 Years | 0 (0.0%) | 0 (0.0%) |
| 75 Years and over | 0 (0.0%) | 2 (10.5%) |
Disability Class: Cognitive Difficulty
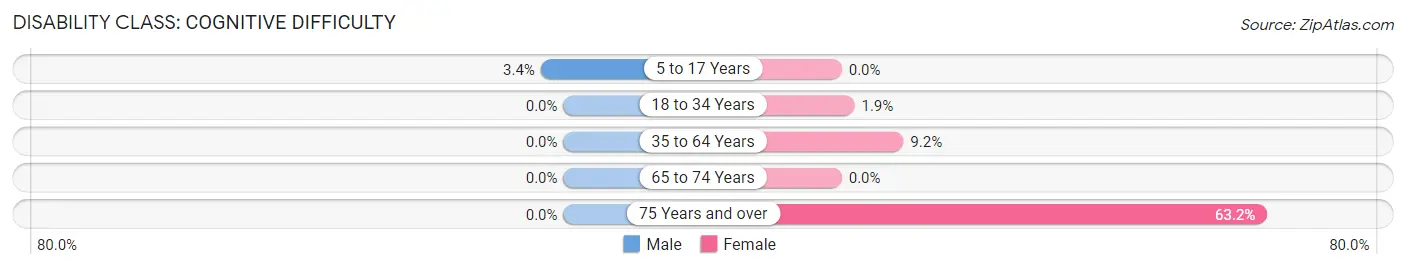
| Age Bracket | Male | Female |
| 5 to 17 Years | 3 (3.4%) | 0 (0.0%) |
| 18 to 34 Years | 0 (0.0%) | 3 (1.9%) |
| 35 to 64 Years | 0 (0.0%) | 13 (9.1%) |
| 65 to 74 Years | 0 (0.0%) | 0 (0.0%) |
| 75 Years and over | 0 (0.0%) | 12 (63.2%) |
Disability Class: Ambulatory Difficulty
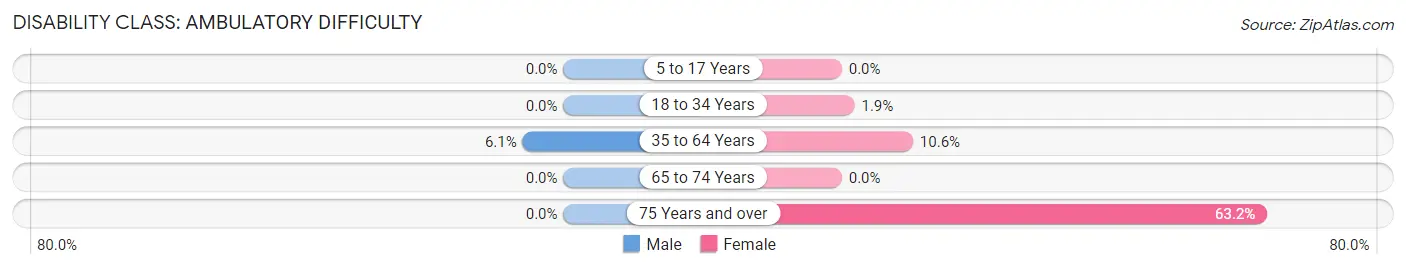
| Age Bracket | Male | Female |
| 5 to 17 Years | 0 (0.0%) | 0 (0.0%) |
| 18 to 34 Years | 0 (0.0%) | 3 (1.9%) |
| 35 to 64 Years | 8 (6.1%) | 15 (10.6%) |
| 65 to 74 Years | 0 (0.0%) | 0 (0.0%) |
| 75 Years and over | 0 (0.0%) | 12 (63.2%) |
Disability Class: Self-Care Difficulty
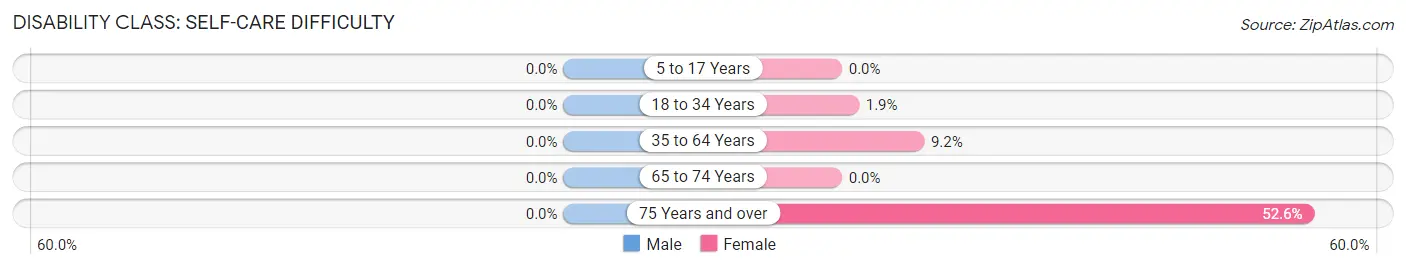
| Age Bracket | Male | Female |
| 5 to 17 Years | 0 (0.0%) | 0 (0.0%) |
| 18 to 34 Years | 0 (0.0%) | 3 (1.9%) |
| 35 to 64 Years | 0 (0.0%) | 13 (9.1%) |
| 65 to 74 Years | 0 (0.0%) | 0 (0.0%) |
| 75 Years and over | 0 (0.0%) | 10 (52.6%) |
Technology Access in Campobello
Computing Device Access in Campobello
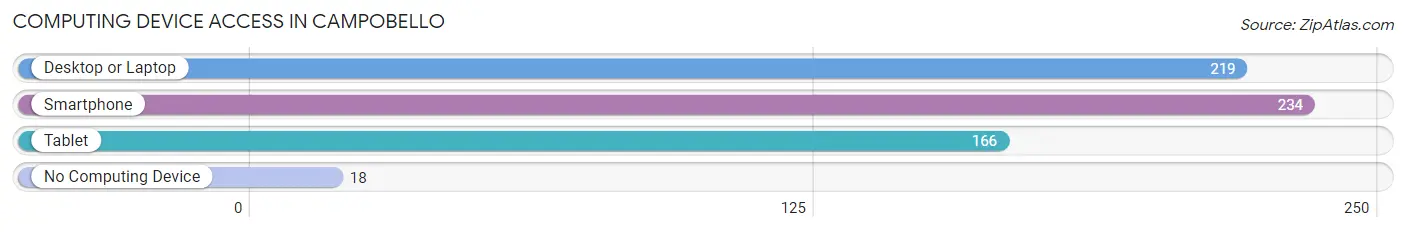
| Device Type | # Households | % Households |
| Desktop or Laptop | 219 | 83.6% |
| Smartphone | 234 | 89.3% |
| Tablet | 166 | 63.4% |
| No Computing Device | 18 | 6.9% |
| Total | 262 | 100.0% |
Internet Access in Campobello
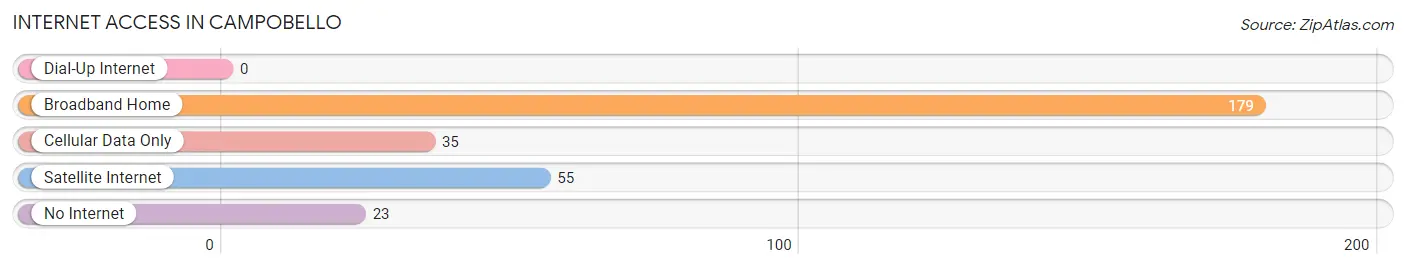
| Internet Type | # Households | % Households |
| Dial-Up Internet | 0 | 0.0% |
| Broadband Home | 179 | 68.3% |
| Cellular Data Only | 35 | 13.4% |
| Satellite Internet | 55 | 21.0% |
| No Internet | 23 | 8.8% |
| Total | 262 | 100.0% |
Campobello Summary
Campobello is a small town located in the foothills of the Blue Ridge Mountains in South Carolina. It is situated in the northern part of the state, about 30 miles from the city of Greenville. The town has a population of just over 1,000 people and is part of the Greenville-Spartanburg-Anderson metropolitan area.
History
Campobello was founded in 1820 by a group of settlers from North Carolina. The town was named after the Italian city of Campobello di Licata, which was the birthplace of one of the settlers. The town was originally a farming community, but it soon developed into a small manufacturing center. The town was home to several mills, including a cotton mill, a grist mill, and a sawmill.
In the late 19th century, Campobello became a popular tourist destination. The town was known for its scenic beauty and its proximity to the Blue Ridge Mountains. The town was also home to several resorts, including the Campobello Hotel, which was built in 1891.
Geography
Campobello is located in the foothills of the Blue Ridge Mountains in northern South Carolina. The town is situated in the Piedmont region of the state, which is characterized by rolling hills and valleys. The town is located about 30 miles from the city of Greenville and is part of the Greenville-Spartanburg-Anderson metropolitan area.
The town is situated at an elevation of 1,000 feet above sea level. The town is located in a temperate climate zone, with hot summers and mild winters. The average annual temperature is around 60 degrees Fahrenheit.
Economy
The economy of Campobello is largely based on agriculture and tourism. The town is home to several farms, which produce a variety of crops, including corn, soybeans, and wheat. The town is also home to several tourist attractions, including the Campobello Hotel and the nearby Blue Ridge Mountains.
The town is also home to several small businesses, including restaurants, shops, and other services. The town is served by several major highways, including Interstate 85 and US Route 25.
Demographics
As of the 2010 census, the population of Campobello was 1,072. The town has a population density of 545 people per square mile. The median age of the population is 44.7 years, and the median household income is $37,917.
The town is predominantly white, with 92.3% of the population identifying as white. The town is also home to a small African American population, with 4.3% of the population identifying as African American. The town is also home to a small Hispanic population, with 2.2% of the population identifying as Hispanic or Latino.
Conclusion
Campobello is a small town located in the foothills of the Blue Ridge Mountains in South Carolina. The town has a population of just over 1,000 people and is part of the Greenville-Spartanburg-Anderson metropolitan area. The town is known for its scenic beauty and its proximity to the Blue Ridge Mountains. The economy of Campobello is largely based on agriculture and tourism. The town is predominantly white, with 92.3% of the population identifying as white. The town is also home to a small African American population, with 4.3% of the population identifying as African American. The town is also home to a small Hispanic population, with 2.2% of the population identifying as Hispanic or Latino.
Common Questions
What is Per Capita Income in Campobello?
Per Capita income in Campobello is $31,041.
What is the Median Family Income in Campobello?
Median Family Income in Campobello is $87,273.
What is the Median Household income in Campobello?
Median Household Income in Campobello is $85,227.
What is Income or Wage Gap in Campobello?
Income or Wage Gap in Campobello is 2.1%.
Women in Campobello earn 97.9 cents for every dollar earned by a man.
What is Inequality or Gini Index in Campobello?
Inequality or Gini Index in Campobello is 0.43.
What is the Total Population of Campobello?
Total Population of Campobello is 866.
What is the Total Male Population of Campobello?
Total Male Population of Campobello is 412.
What is the Total Female Population of Campobello?
Total Female Population of Campobello is 454.
What is the Ratio of Males per 100 Females in Campobello?
There are 90.75 Males per 100 Females in Campobello.
What is the Ratio of Females per 100 Males in Campobello?
There are 110.19 Females per 100 Males in Campobello.
What is the Median Population Age in Campobello?
Median Population Age in Campobello is 27.7 Years.
What is the Average Family Size in Campobello
Average Family Size in Campobello is 3.6 People.
What is the Average Household Size in Campobello
Average Household Size in Campobello is 3.3 People.
How Large is the Labor Force in Campobello?
There are 449 People in the Labor Forcein in Campobello.
What is the Percentage of People in the Labor Force in Campobello?
66.0% of People are in the Labor Force in Campobello.
What is the Unemployment Rate in Campobello?
Unemployment Rate in Campobello is 3.1%.