Zip Codes with the Highest Percentage of Population Employed in Legal Services & Support in Conway, SC
RELATED REPORTS & OPTIONS
Legal Services & Support
Conway
Compare Zip Codes
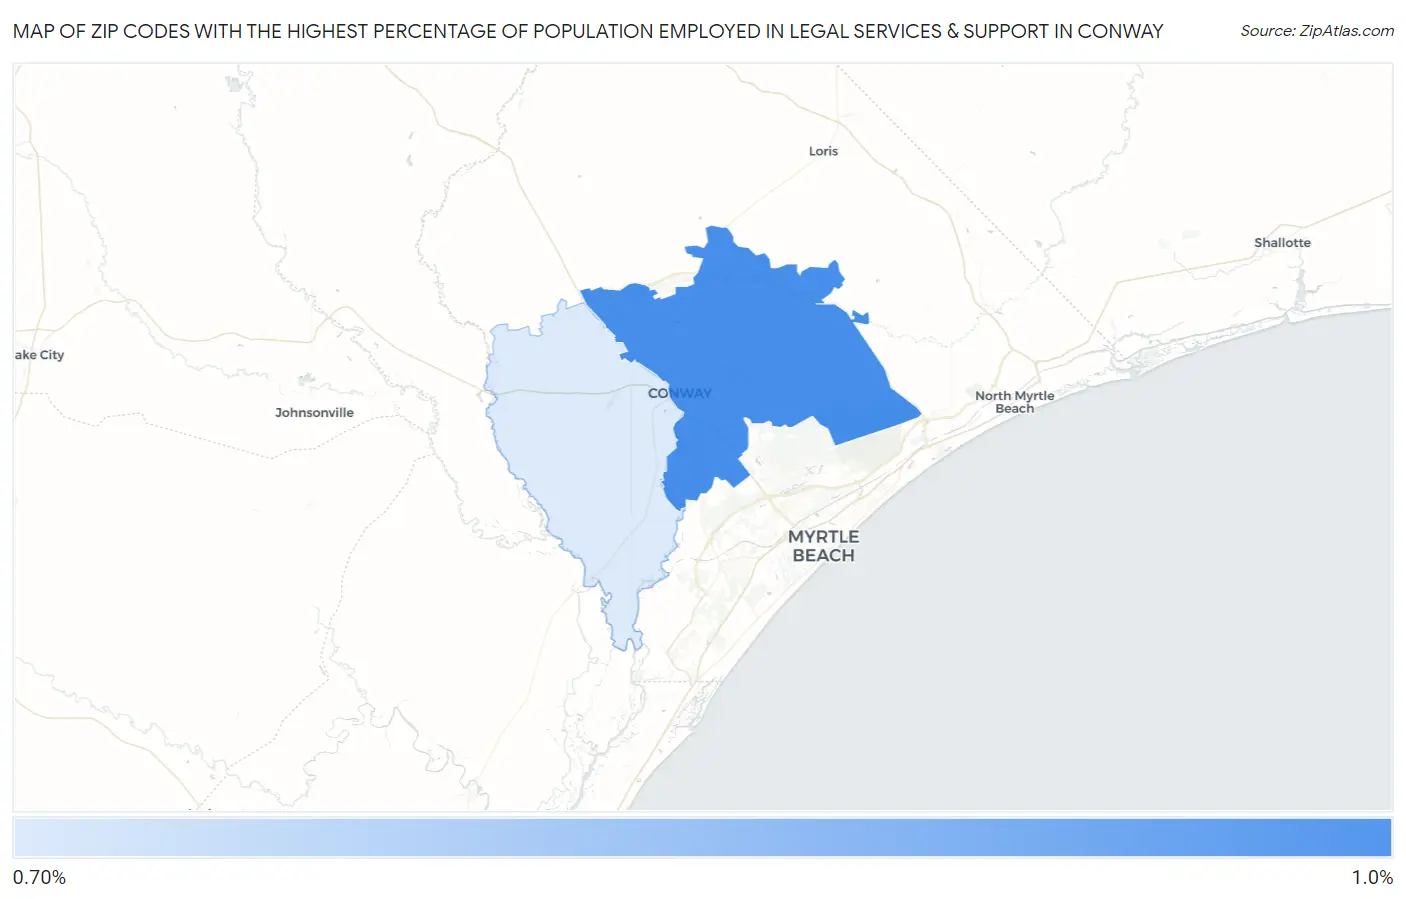
Map of Zip Codes with the Highest Percentage of Population Employed in Legal Services & Support in Conway
0.72%
0.88%
Zip Codes with the Highest Percentage of Population Employed in Legal Services & Support in Conway, SC
| Zip Code | % Employed | vs State | vs National | |
| 1. | 29526 | 0.88% | 0.97%(-0.098)#105 | 1.2%(-0.307)#8,809 |
| 2. | 29527 | 0.72% | 0.97%(-0.252)#122 | 1.2%(-0.462)#10,178 |
1
Common Questions
What are the Top Zip Codes with the Highest Percentage of Population Employed in Legal Services & Support in Conway, SC?
Top Zip Codes with the Highest Percentage of Population Employed in Legal Services & Support in Conway, SC are:
What zip code has the Highest Percentage of Population Employed in Legal Services & Support in Conway, SC?
29526 has the Highest Percentage of Population Employed in Legal Services & Support in Conway, SC with 0.88%.
What is the Percentage of Population Employed in Legal Services & Support in Conway, SC?
Percentage of Population Employed in Legal Services & Support in Conway is 0.96%.
What is the Percentage of Population Employed in Legal Services & Support in South Carolina?
Percentage of Population Employed in Legal Services & Support in South Carolina is 0.97%.
What is the Percentage of Population Employed in Legal Services & Support in the United States?
Percentage of Population Employed in Legal Services & Support in the United States is 1.2%.