Graniteville, SC Map & Demographics
Graniteville Map
Graniteville Overview
$19,708
PER CAPITA INCOME
$45,000
AVG FAMILY INCOME
$32,339
AVG HOUSEHOLD INCOME
65.3%
WAGE / INCOME GAP [ % ]
34.7¢/ $1
WAGE / INCOME GAP [ $ ]
0.50
INEQUALITY / GINI INDEX
2,465
TOTAL POPULATION
1,155
MALE POPULATION
1,310
FEMALE POPULATION
88.17
MALES / 100 FEMALES
113.42
FEMALES / 100 MALES
33.4
MEDIAN AGE
3.5
AVG FAMILY SIZE
2.6
AVG HOUSEHOLD SIZE
905
LABOR FORCE [ PEOPLE ]
54.2%
PERCENT IN LABOR FORCE
6.9%
UNEMPLOYMENT RATE
Graniteville Zip Codes
Graniteville Area Codes
Income in Graniteville
Income Overview in Graniteville
Per Capita Income in Graniteville is $19,708, while median incomes of families and households are $45,000 and $32,339 respectively.
| Characteristic | Number | Measure |
| Per Capita Income | 2,465 | $19,708 |
| Median Family Income | 534 | $45,000 |
| Mean Family Income | 534 | $61,356 |
| Median Household Income | 954 | $32,339 |
| Mean Household Income | 954 | $49,275 |
| Income Deficit | 534 | $0 |
| Wage / Income Gap (%) | 2,465 | 65.32% |
| Wage / Income Gap ($) | 2,465 | 34.68¢ per $1 |
| Gini / Inequality Index | 2,465 | 0.50 |
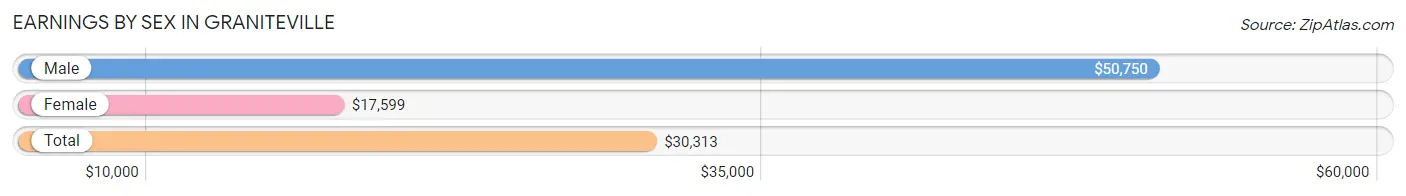
Earnings by Sex in Graniteville
Average Earnings in Graniteville are $30,313, $50,750 for men and $17,599 for women, a difference of 65.3%.
| Sex | Number | Average Earnings |
| Male | 489 (54.6%) | $50,750 |
| Female | 407 (45.4%) | $17,599 |
| Total | 896 (100.0%) | $30,313 |
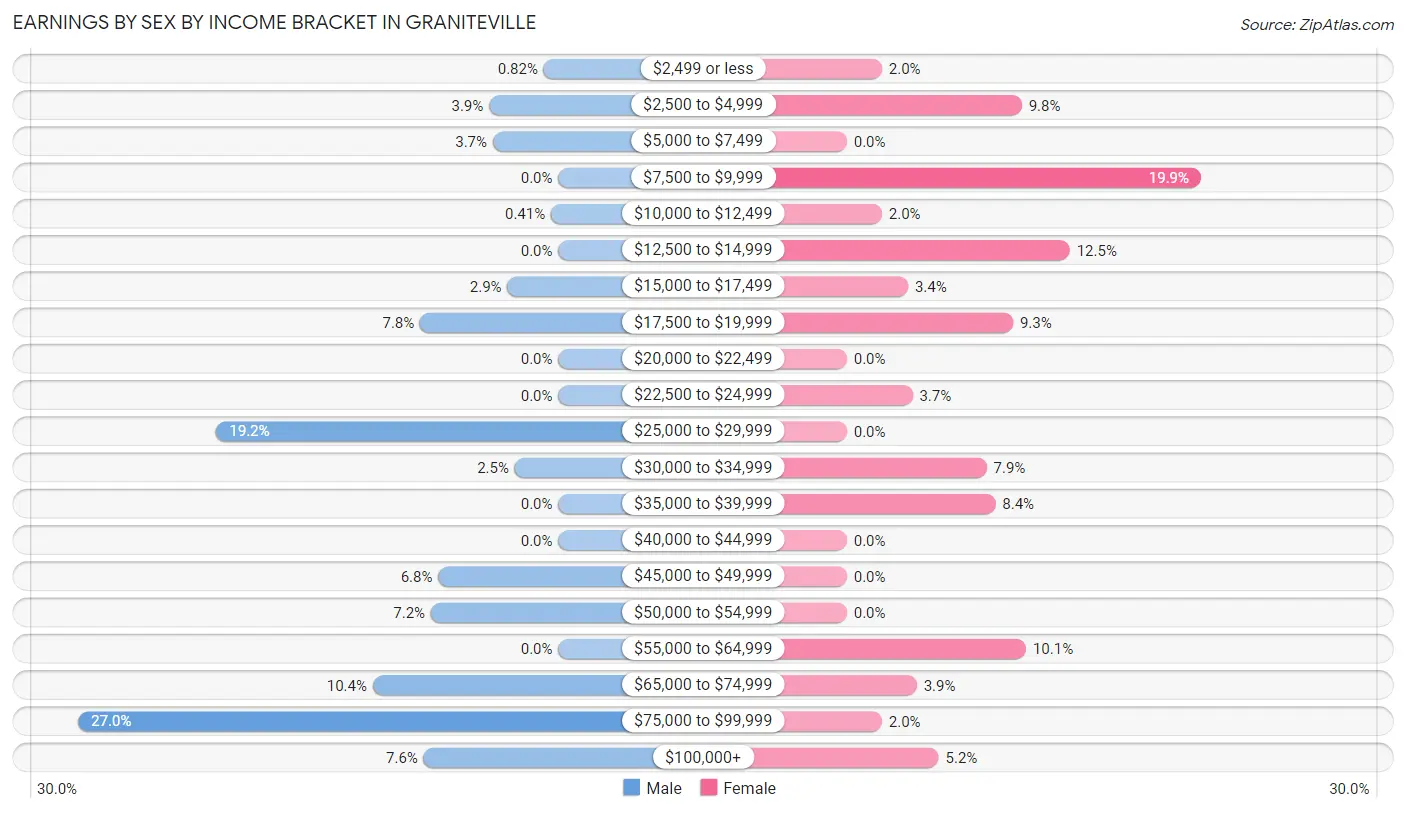
Earnings by Sex by Income Bracket in Graniteville
The most common earnings brackets in Graniteville are $75,000 to $99,999 for men (132 | 27.0%) and $7,500 to $9,999 for women (81 | 19.9%).
| Income | Male | Female |
| $2,499 or less | 4 (0.8%) | 8 (2.0%) |
| $2,500 to $4,999 | 19 (3.9%) | 40 (9.8%) |
| $5,000 to $7,499 | 18 (3.7%) | 0 (0.0%) |
| $7,500 to $9,999 | 0 (0.0%) | 81 (19.9%) |
| $10,000 to $12,499 | 2 (0.4%) | 8 (2.0%) |
| $12,500 to $14,999 | 0 (0.0%) | 51 (12.5%) |
| $15,000 to $17,499 | 14 (2.9%) | 14 (3.4%) |
| $17,500 to $19,999 | 38 (7.8%) | 38 (9.3%) |
| $20,000 to $22,499 | 0 (0.0%) | 0 (0.0%) |
| $22,500 to $24,999 | 0 (0.0%) | 15 (3.7%) |
| $25,000 to $29,999 | 94 (19.2%) | 0 (0.0%) |
| $30,000 to $34,999 | 12 (2.5%) | 32 (7.9%) |
| $35,000 to $39,999 | 0 (0.0%) | 34 (8.4%) |
| $40,000 to $44,999 | 0 (0.0%) | 0 (0.0%) |
| $45,000 to $49,999 | 33 (6.8%) | 0 (0.0%) |
| $50,000 to $54,999 | 35 (7.2%) | 0 (0.0%) |
| $55,000 to $64,999 | 0 (0.0%) | 41 (10.1%) |
| $65,000 to $74,999 | 51 (10.4%) | 16 (3.9%) |
| $75,000 to $99,999 | 132 (27.0%) | 8 (2.0%) |
| $100,000+ | 37 (7.6%) | 21 (5.2%) |
| Total | 489 (100.0%) | 407 (100.0%) |
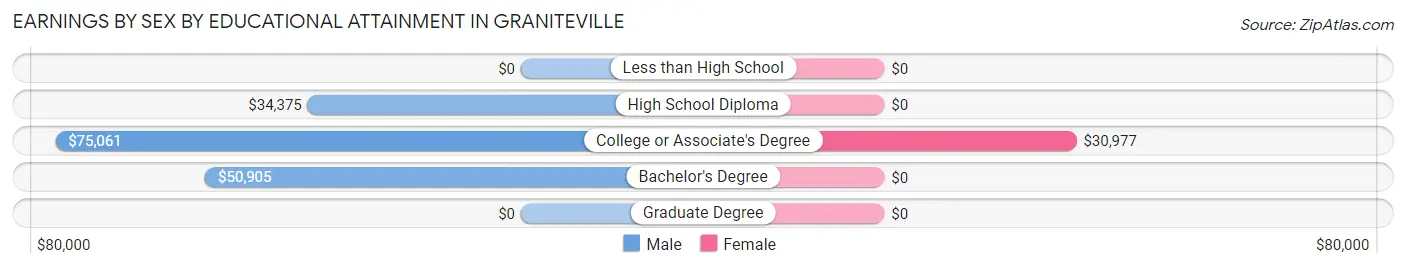
Earnings by Sex by Educational Attainment in Graniteville
Average earnings in Graniteville are $52,393 for men and $18,158 for women, a difference of 65.3%. Men with an educational attainment of college or associate's degree enjoy the highest average annual earnings of $75,061, while those with high school diploma education earn the least with $34,375. Women with an educational attainment of college or associate's degree earn the most with the average annual earnings of $30,977, while those with college or associate's degree education have the smallest earnings of $30,977.
| Educational Attainment | Male Income | Female Income |
| Less than High School | - | - |
| High School Diploma | $34,375 | $0 |
| College or Associate's Degree | $75,061 | $30,977 |
| Bachelor's Degree | $50,905 | $0 |
| Graduate Degree | - | - |
| Total | $52,393 | $18,158 |
Family Income in Graniteville
Family Income Brackets in Graniteville
According to the Graniteville family income data, there are 111 families falling into the $25,000 to $34,999 income range, which is the most common income bracket and makes up 20.8% of all families.
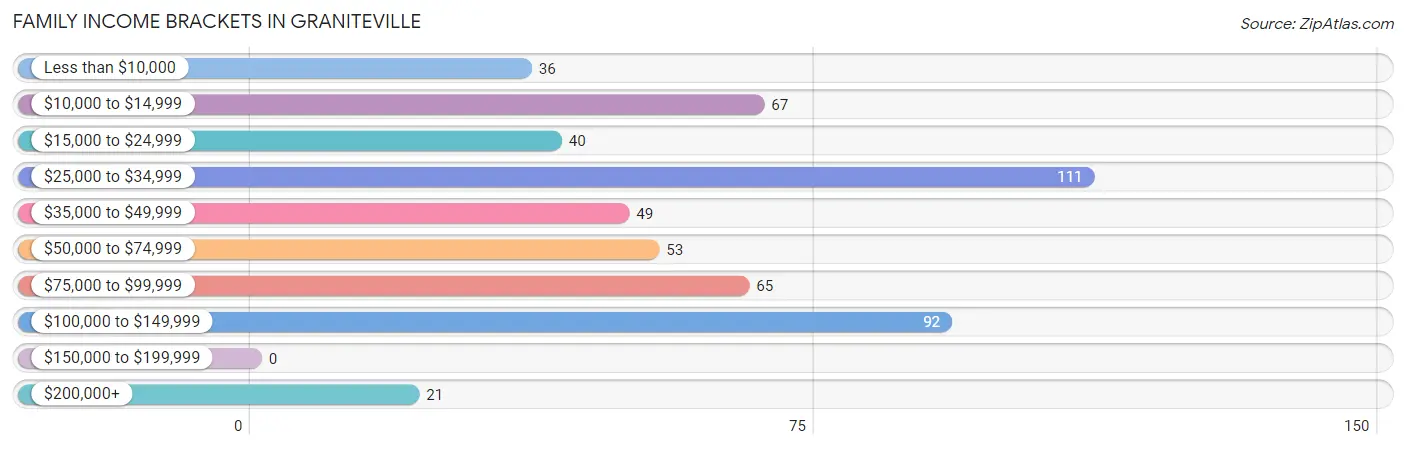
| Income Bracket | # Families | % Families |
| Less than $10,000 | 36 | 6.7% |
| $10,000 to $14,999 | 67 | 12.5% |
| $15,000 to $24,999 | 40 | 7.5% |
| $25,000 to $34,999 | 111 | 20.8% |
| $35,000 to $49,999 | 49 | 9.2% |
| $50,000 to $74,999 | 53 | 9.9% |
| $75,000 to $99,999 | 65 | 12.2% |
| $100,000 to $149,999 | 92 | 17.2% |
| $150,000 to $199,999 | 0 | 0.0% |
| $200,000+ | 21 | 3.9% |
Family Income by Famaliy Size in Graniteville
3-person families (165 | 30.9%) account for the highest median family income in Graniteville with $75,799 per family, while 3-person families (165 | 30.9%) have the highest median income of $25,266 per family member.
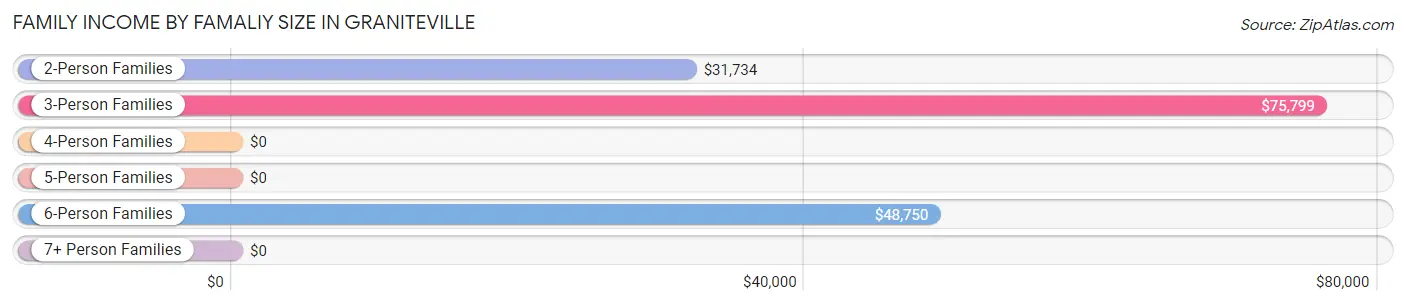
| Income Bracket | # Families | Median Income |
| 2-Person Families | 191 (35.8%) | $31,734 |
| 3-Person Families | 165 (30.9%) | $75,799 |
| 4-Person Families | 71 (13.3%) | $0 |
| 5-Person Families | 40 (7.5%) | $0 |
| 6-Person Families | 38 (7.1%) | $48,750 |
| 7+ Person Families | 29 (5.4%) | $0 |
| Total | 534 (100.0%) | $45,000 |
Family Income by Number of Earners in Graniteville
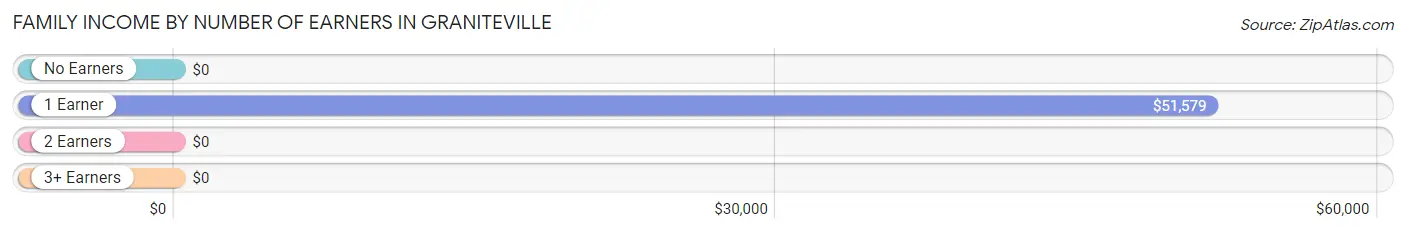
| Number of Earners | # Families | Median Income |
| No Earners | 148 (27.7%) | $0 |
| 1 Earner | 218 (40.8%) | $51,579 |
| 2 Earners | 114 (21.3%) | $0 |
| 3+ Earners | 54 (10.1%) | $0 |
| Total | 534 (100.0%) | $45,000 |
Household Income in Graniteville
Household Income Brackets in Graniteville
With 143 households falling in the category, the $25,000 to $34,999 income range is the most frequent in Graniteville, accounting for 15.0% of all households.
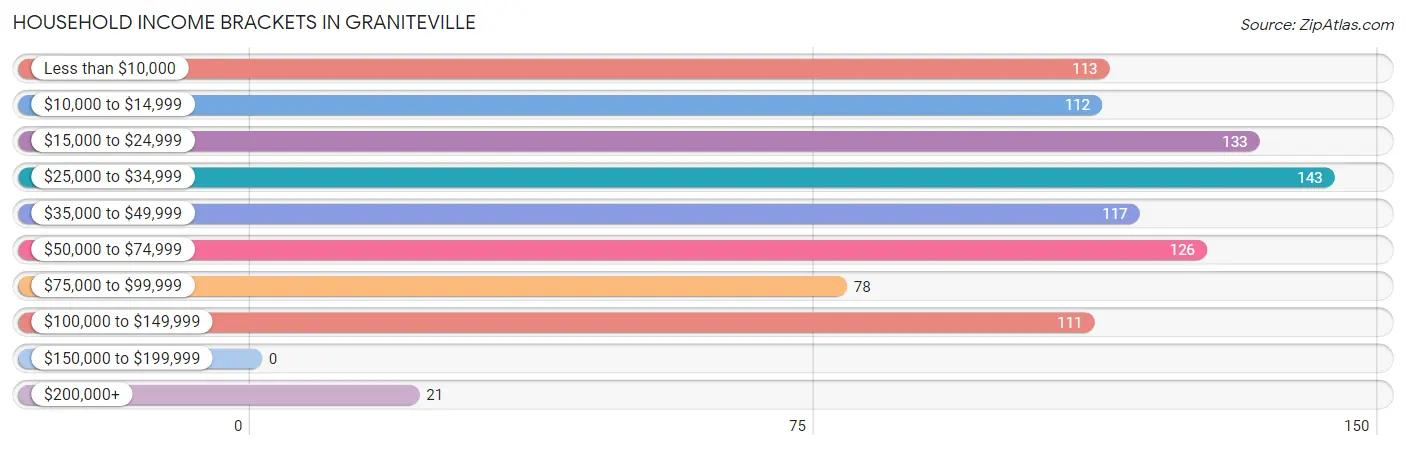
| Income Bracket | # Households | % Households |
| Less than $10,000 | 113 | 11.8% |
| $10,000 to $14,999 | 112 | 11.7% |
| $15,000 to $24,999 | 133 | 13.9% |
| $25,000 to $34,999 | 143 | 15.0% |
| $35,000 to $49,999 | 117 | 12.3% |
| $50,000 to $74,999 | 126 | 13.2% |
| $75,000 to $99,999 | 78 | 8.2% |
| $100,000 to $149,999 | 111 | 11.6% |
| $150,000 to $199,999 | 0 | 0.0% |
| $200,000+ | 21 | 2.2% |
Household Income by Householder Age in Graniteville
The median household income in Graniteville is $32,339, with the highest median household income of $50,250 found in the 45 to 64 years age bracket for the primary householder. A total of 283 households (29.7%) fall into this category. Meanwhile, the 15 to 24 years age bracket for the primary householder has the lowest median household income of $0, with 17 households (1.8%) in this group.
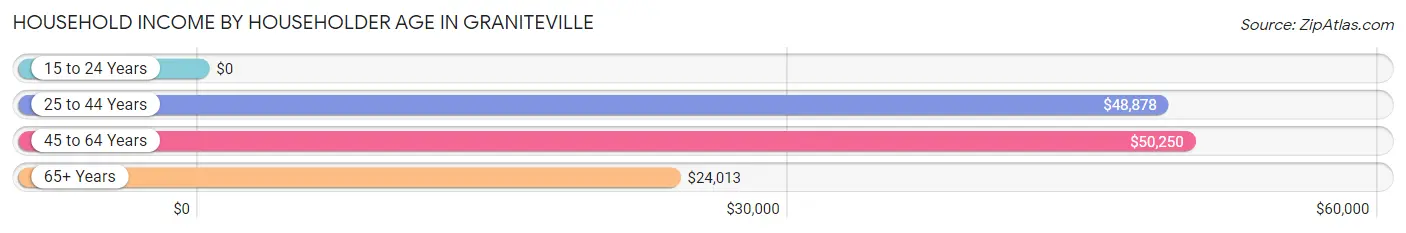
| Income Bracket | # Households | Median Income |
| 15 to 24 Years | 17 (1.8%) | $0 |
| 25 to 44 Years | 377 (39.5%) | $48,878 |
| 45 to 64 Years | 283 (29.7%) | $50,250 |
| 65+ Years | 277 (29.0%) | $24,013 |
| Total | 954 (100.0%) | $32,339 |
Poverty in Graniteville
Income Below Poverty by Sex and Age in Graniteville
With 27.0% poverty level for males and 32.4% for females among the residents of Graniteville, 65 to 74 year old males and 18 to 24 year old females are the most vulnerable to poverty, with 65 males (82.3%) and 17 females (100.0%) in their respective age groups living below the poverty level.
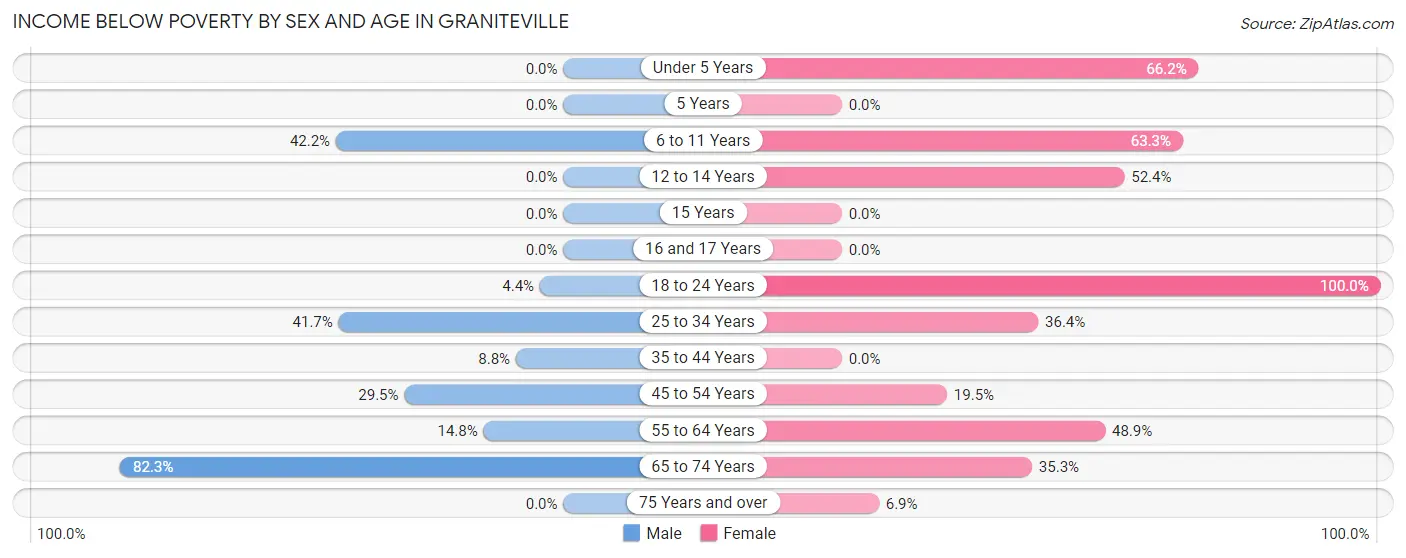
| Age Bracket | Male | Female |
| Under 5 Years | 0 (0.0%) | 47 (66.2%) |
| 5 Years | 0 (0.0%) | 0 (0.0%) |
| 6 to 11 Years | 122 (42.2%) | 69 (63.3%) |
| 12 to 14 Years | 0 (0.0%) | 54 (52.4%) |
| 15 Years | 0 (0.0%) | 0 (0.0%) |
| 16 and 17 Years | 0 (0.0%) | 0 (0.0%) |
| 18 to 24 Years | 2 (4.3%) | 17 (100.0%) |
| 25 to 34 Years | 73 (41.7%) | 82 (36.4%) |
| 35 to 44 Years | 19 (8.8%) | 0 (0.0%) |
| 45 to 54 Years | 18 (29.5%) | 8 (19.5%) |
| 55 to 64 Years | 12 (14.8%) | 107 (48.9%) |
| 65 to 74 Years | 65 (82.3%) | 18 (35.3%) |
| 75 Years and over | 0 (0.0%) | 12 (6.9%) |
| Total | 311 (27.0%) | 414 (32.4%) |
Income Above Poverty by Sex and Age in Graniteville
According to the poverty statistics in Graniteville, males aged under 5 years and females aged 15 years are the age groups that are most secure financially, with 100.0% of males and 100.0% of females in these age groups living above the poverty line.
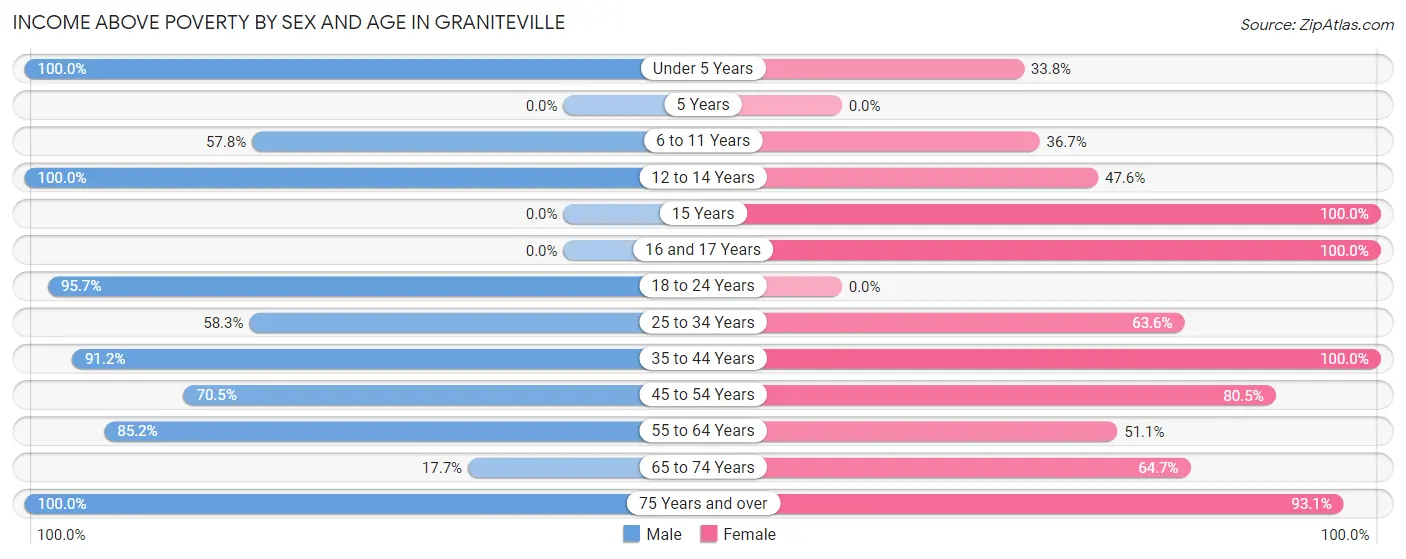
| Age Bracket | Male | Female |
| Under 5 Years | 124 (100.0%) | 24 (33.8%) |
| 5 Years | 0 (0.0%) | 0 (0.0%) |
| 6 to 11 Years | 167 (57.8%) | 40 (36.7%) |
| 12 to 14 Years | 8 (100.0%) | 49 (47.6%) |
| 15 Years | 0 (0.0%) | 57 (100.0%) |
| 16 and 17 Years | 0 (0.0%) | 49 (100.0%) |
| 18 to 24 Years | 44 (95.7%) | 0 (0.0%) |
| 25 to 34 Years | 102 (58.3%) | 143 (63.6%) |
| 35 to 44 Years | 197 (91.2%) | 161 (100.0%) |
| 45 to 54 Years | 43 (70.5%) | 33 (80.5%) |
| 55 to 64 Years | 69 (85.2%) | 112 (51.1%) |
| 65 to 74 Years | 14 (17.7%) | 33 (64.7%) |
| 75 Years and over | 73 (100.0%) | 163 (93.1%) |
| Total | 841 (73.0%) | 864 (67.6%) |
Income Below Poverty Among Married-Couple Families in Graniteville
The poverty statistics for married-couple families in Graniteville show that 2.4% or 8 of the total 341 families live below the poverty line. Families with 3 or 4 children have the highest poverty rate of 21.0%, comprising of 8 families. On the other hand, families with no children have the lowest poverty rate of 0.0%, which includes 0 families.
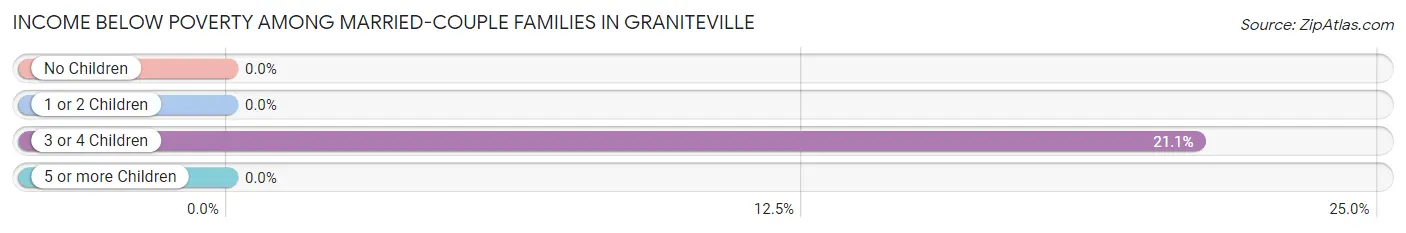
| Children | Above Poverty | Below Poverty |
| No Children | 126 (100.0%) | 0 (0.0%) |
| 1 or 2 Children | 148 (100.0%) | 0 (0.0%) |
| 3 or 4 Children | 30 (78.9%) | 8 (21.0%) |
| 5 or more Children | 29 (100.0%) | 0 (0.0%) |
| Total | 333 (97.7%) | 8 (2.4%) |
Income Below Poverty Among Single-Parent Households in Graniteville
According to the poverty data in Graniteville, 79.2% or 57 single-father households and 64.5% or 78 single-mother households are living below the poverty line. Among single-father households, those with no children have the highest poverty rate, with 38 households (100.0%) experiencing poverty. Likewise, among single-mother households, those with 1 or 2 children have the highest poverty rate, with 17 households (100.0%) falling below the poverty line.
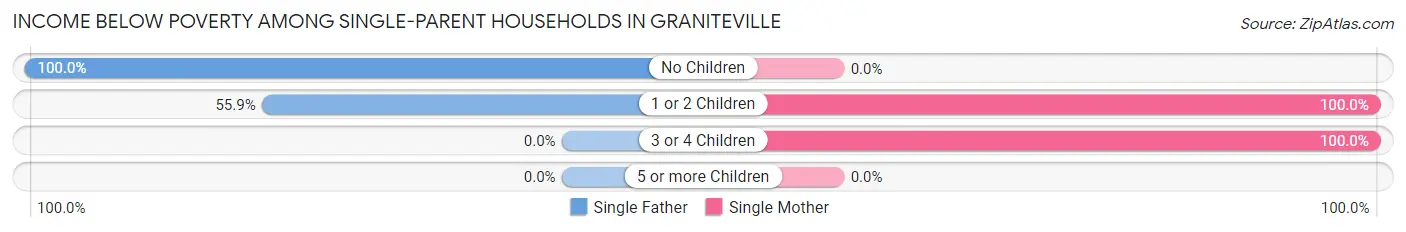
| Children | Single Father | Single Mother |
| No Children | 38 (100.0%) | 0 (0.0%) |
| 1 or 2 Children | 19 (55.9%) | 17 (100.0%) |
| 3 or 4 Children | 0 (0.0%) | 61 (100.0%) |
| 5 or more Children | 0 (0.0%) | 0 (0.0%) |
| Total | 57 (79.2%) | 78 (64.5%) |
Income Below Poverty Among Married-Couple vs Single-Parent Households in Graniteville
The poverty data for Graniteville shows that 8 of the married-couple family households (2.4%) and 135 of the single-parent households (70.0%) are living below the poverty level. Within the married-couple family households, those with 3 or 4 children have the highest poverty rate, with 8 households (21.0%) falling below the poverty line. Among the single-parent households, those with 3 or 4 children have the highest poverty rate, with 61 household (100.0%) living below poverty.
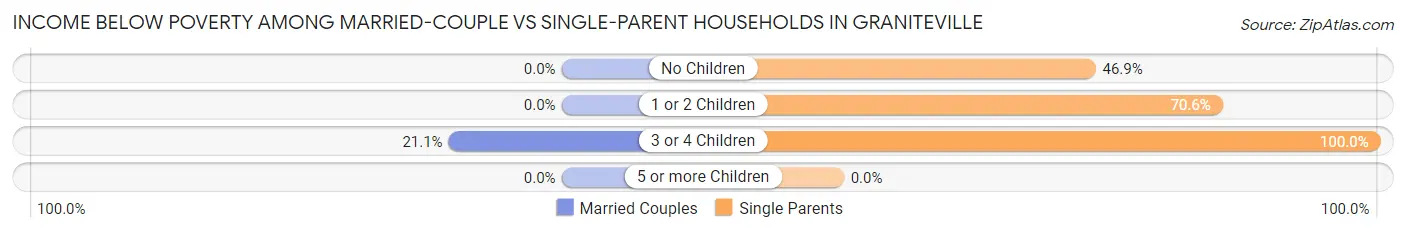
| Children | Married-Couple Families | Single-Parent Households |
| No Children | 0 (0.0%) | 38 (46.9%) |
| 1 or 2 Children | 0 (0.0%) | 36 (70.6%) |
| 3 or 4 Children | 8 (21.0%) | 61 (100.0%) |
| 5 or more Children | 0 (0.0%) | 0 (0.0%) |
| Total | 8 (2.4%) | 135 (70.0%) |
Race in Graniteville
The most populous races in Graniteville are White / Caucasian (1,500 | 60.9%), Black / African American (582 | 23.6%), and Hispanic or Latino (465 | 18.9%).
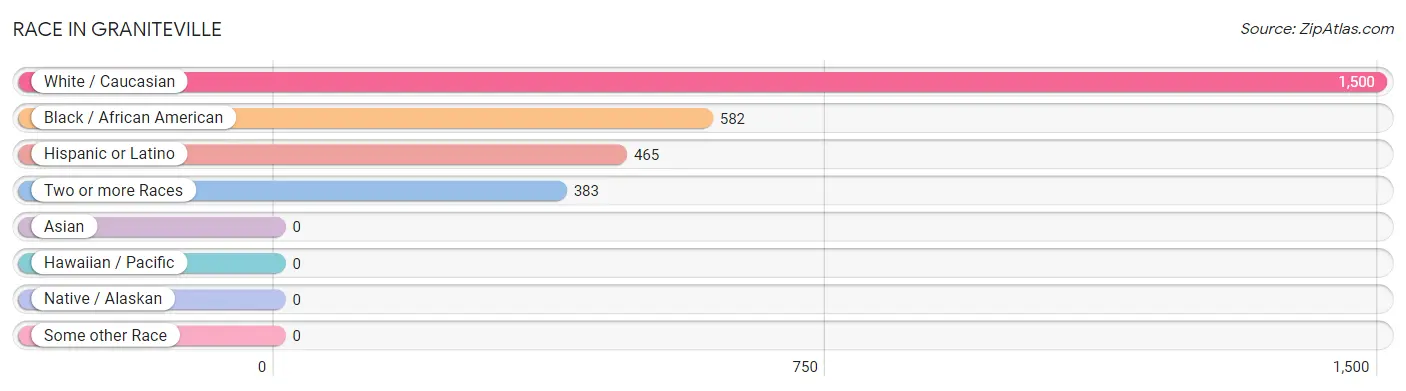
| Race | # Population | % Population |
| Asian | 0 | 0.0% |
| Black / African American | 582 | 23.6% |
| Hawaiian / Pacific | 0 | 0.0% |
| Hispanic or Latino | 465 | 18.9% |
| Native / Alaskan | 0 | 0.0% |
| White / Caucasian | 1,500 | 60.9% |
| Two or more Races | 383 | 15.5% |
| Some other Race | 0 | 0.0% |
| Total | 2,465 | 100.0% |
Ancestry in Graniteville
The most populous ancestries reported in Graniteville are American (465 | 18.9%), Mexican (424 | 17.2%), German (113 | 4.6%), Irish (113 | 4.6%), and Italian (107 | 4.3%), together accounting for 49.6% of all Graniteville residents.
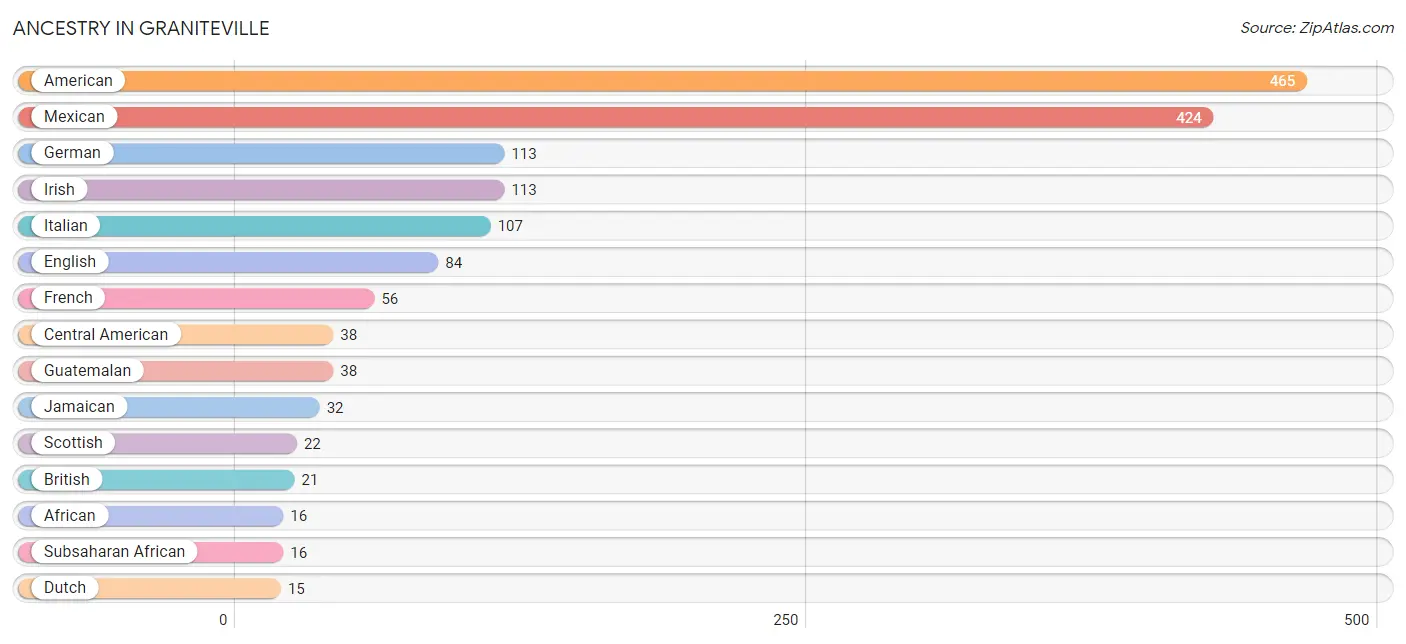
| Ancestry | # Population | % Population |
| African | 16 | 0.6% |
| American | 465 | 18.9% |
| British | 21 | 0.9% |
| Central American | 38 | 1.5% |
| Cherokee | 9 | 0.4% |
| Dutch | 15 | 0.6% |
| English | 84 | 3.4% |
| French | 56 | 2.3% |
| German | 113 | 4.6% |
| Guatemalan | 38 | 1.5% |
| Irish | 113 | 4.6% |
| Italian | 107 | 4.3% |
| Jamaican | 32 | 1.3% |
| Mexican | 424 | 17.2% |
| Polish | 15 | 0.6% |
| Russian | 9 | 0.4% |
| Scotch-Irish | 12 | 0.5% |
| Scottish | 22 | 0.9% |
| Subsaharan African | 16 | 0.6% | View All 19 Rows |
Immigrants in Graniteville
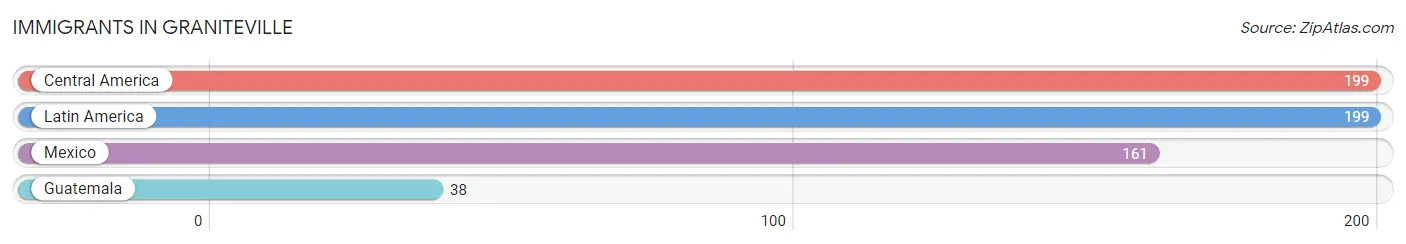
The most numerous immigrant groups reported in Graniteville came from Central America (199 | 8.1%), Latin America (199 | 8.1%), Mexico (161 | 6.5%), and Guatemala (38 | 1.5%), together accounting for 24.2% of all Graniteville residents.
| Immigration Origin | # Population | % Population |
| Central America | 199 | 8.1% |
| Guatemala | 38 | 1.5% |
| Latin America | 199 | 8.1% |
| Mexico | 161 | 6.5% | View All 4 Rows |
Sex and Age in Graniteville
Sex and Age in Graniteville
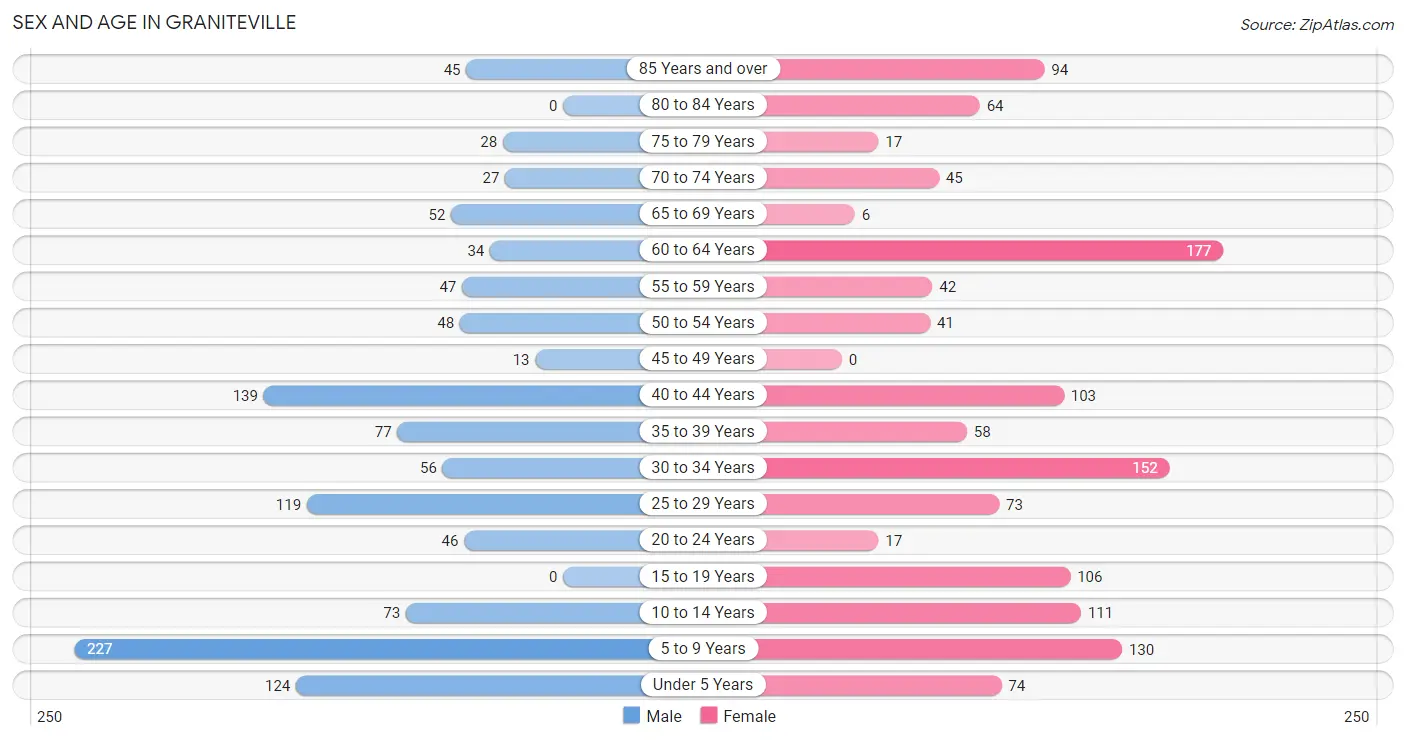
The most populous age groups in Graniteville are 5 to 9 Years (227 | 19.7%) for men and 60 to 64 Years (177 | 13.5%) for women.
| Age Bracket | Male | Female |
| Under 5 Years | 124 (10.7%) | 74 (5.7%) |
| 5 to 9 Years | 227 (19.7%) | 130 (9.9%) |
| 10 to 14 Years | 73 (6.3%) | 111 (8.5%) |
| 15 to 19 Years | 0 (0.0%) | 106 (8.1%) |
| 20 to 24 Years | 46 (4.0%) | 17 (1.3%) |
| 25 to 29 Years | 119 (10.3%) | 73 (5.6%) |
| 30 to 34 Years | 56 (4.9%) | 152 (11.6%) |
| 35 to 39 Years | 77 (6.7%) | 58 (4.4%) |
| 40 to 44 Years | 139 (12.0%) | 103 (7.9%) |
| 45 to 49 Years | 13 (1.1%) | 0 (0.0%) |
| 50 to 54 Years | 48 (4.2%) | 41 (3.1%) |
| 55 to 59 Years | 47 (4.1%) | 42 (3.2%) |
| 60 to 64 Years | 34 (2.9%) | 177 (13.5%) |
| 65 to 69 Years | 52 (4.5%) | 6 (0.5%) |
| 70 to 74 Years | 27 (2.3%) | 45 (3.4%) |
| 75 to 79 Years | 28 (2.4%) | 17 (1.3%) |
| 80 to 84 Years | 0 (0.0%) | 64 (4.9%) |
| 85 Years and over | 45 (3.9%) | 94 (7.2%) |
| Total | 1,155 (100.0%) | 1,310 (100.0%) |
Families and Households in Graniteville
Median Family Size in Graniteville
The median family size in Graniteville is 3.52 persons per family, with single female/mother families (121 | 22.7%) accounting for the largest median family size of 3.98 persons per family. On the other hand, single male/father families (72 | 13.5%) represent the smallest median family size with 2.07 persons per family.
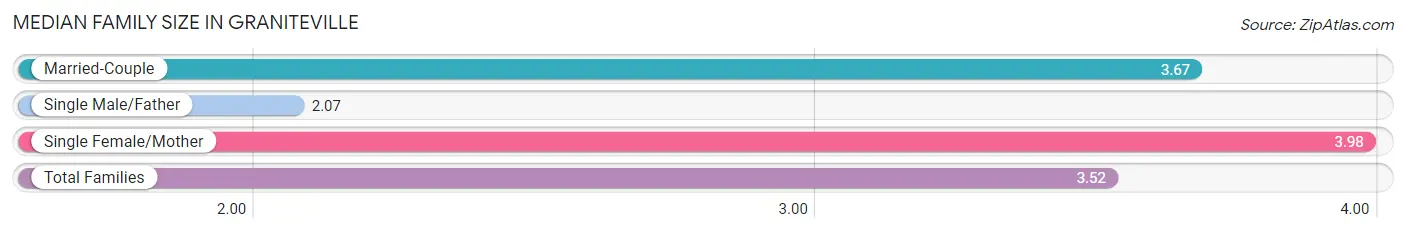
| Family Type | # Families | Family Size |
| Married-Couple | 341 (63.9%) | 3.67 |
| Single Male/Father | 72 (13.5%) | 2.07 |
| Single Female/Mother | 121 (22.7%) | 3.98 |
| Total Families | 534 (100.0%) | 3.52 |
Median Household Size in Graniteville
The median household size in Graniteville is 2.57 persons per household, with single female/mother households (121 | 12.7%) accounting for the largest median household size of 3.98 persons per household. non-family households (420 | 44.0%) represent the smallest median household size with 1.36 persons per household.
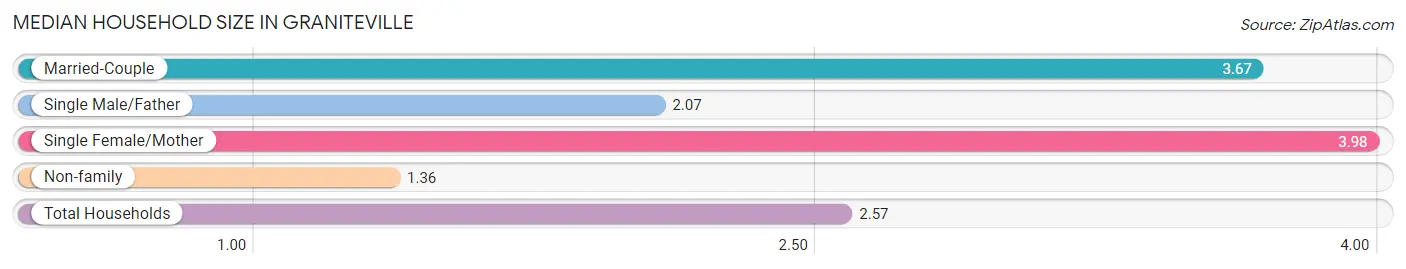
| Household Type | # Households | Household Size |
| Married-Couple | 341 (35.7%) | 3.67 |
| Single Male/Father | 72 (7.5%) | 2.07 |
| Single Female/Mother | 121 (12.7%) | 3.98 |
| Non-family | 420 (44.0%) | 1.36 |
| Total Households | 954 (100.0%) | 2.57 |
Household Size by Marriage Status in Graniteville
Out of a total of 954 households in Graniteville, 534 (56.0%) are family households, while 420 (44.0%) are nonfamily households. The most numerous type of family households are 2-person households, comprising 191, and the most common type of nonfamily households are 1-person households, comprising 315.
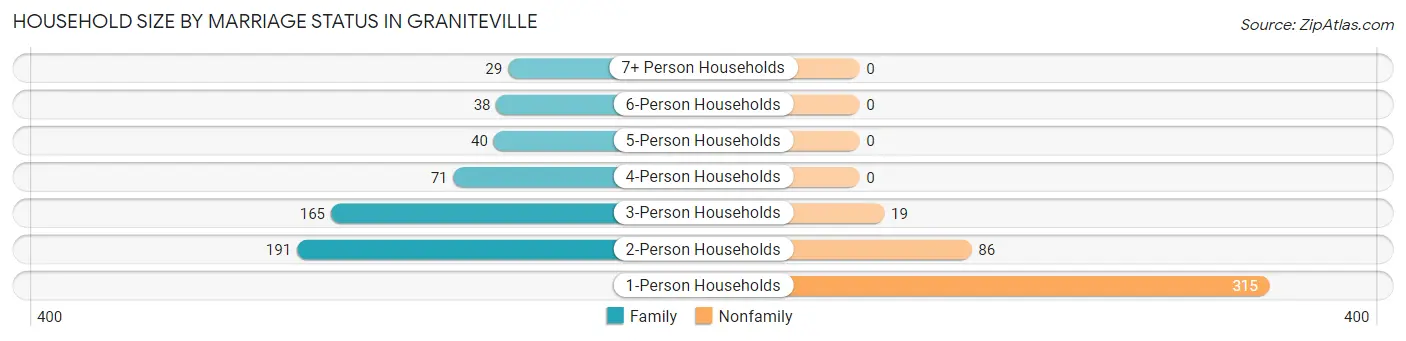
| Household Size | Family Households | Nonfamily Households |
| 1-Person Households | - | 315 (33.0%) |
| 2-Person Households | 191 (20.0%) | 86 (9.0%) |
| 3-Person Households | 165 (17.3%) | 19 (2.0%) |
| 4-Person Households | 71 (7.4%) | 0 (0.0%) |
| 5-Person Households | 40 (4.2%) | 0 (0.0%) |
| 6-Person Households | 38 (4.0%) | 0 (0.0%) |
| 7+ Person Households | 29 (3.0%) | 0 (0.0%) |
| Total | 534 (56.0%) | 420 (44.0%) |
Female Fertility in Graniteville
Fertility by Age in Graniteville
Average fertility rate in Graniteville is 47.0 births per 1,000 women. Women in the age bracket of 20 to 34 years have the highest fertility rate with 103.0 births per 1,000 women. Women in the age bracket of 20 to 34 years acount for 100.0% of all women with births.
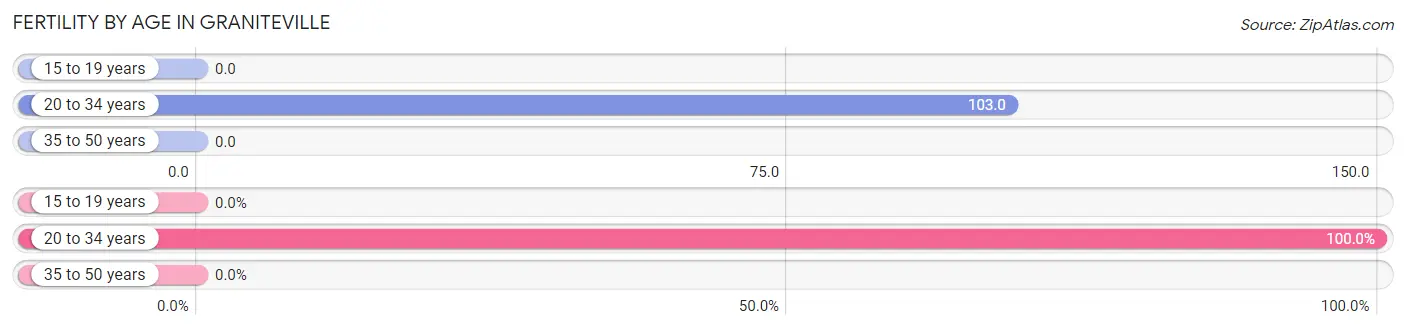
| Age Bracket | Women with Births | Births / 1,000 Women |
| 15 to 19 years | 0 (0.0%) | 0.0 |
| 20 to 34 years | 25 (100.0%) | 103.0 |
| 35 to 50 years | 0 (0.0%) | 0.0 |
| Total | 25 (100.0%) | 47.0 |
Fertility by Age by Marriage Status in Graniteville
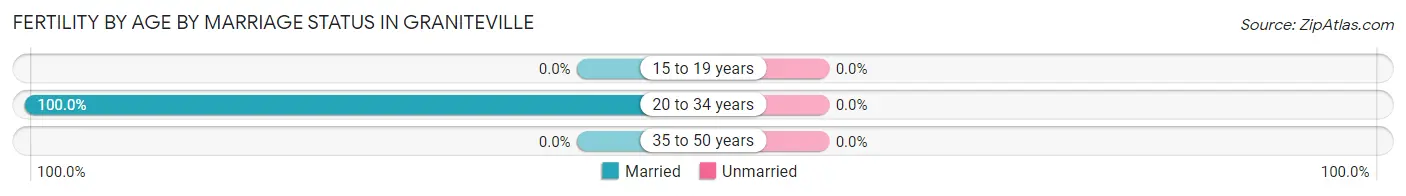
| Age Bracket | Married | Unmarried |
| 15 to 19 years | 0 (0.0%) | 0 (0.0%) |
| 20 to 34 years | 25 (100.0%) | 0 (0.0%) |
| 35 to 50 years | 0 (0.0%) | 0 (0.0%) |
| Total | 25 (100.0%) | 0 (0.0%) |
Fertility by Education in Graniteville
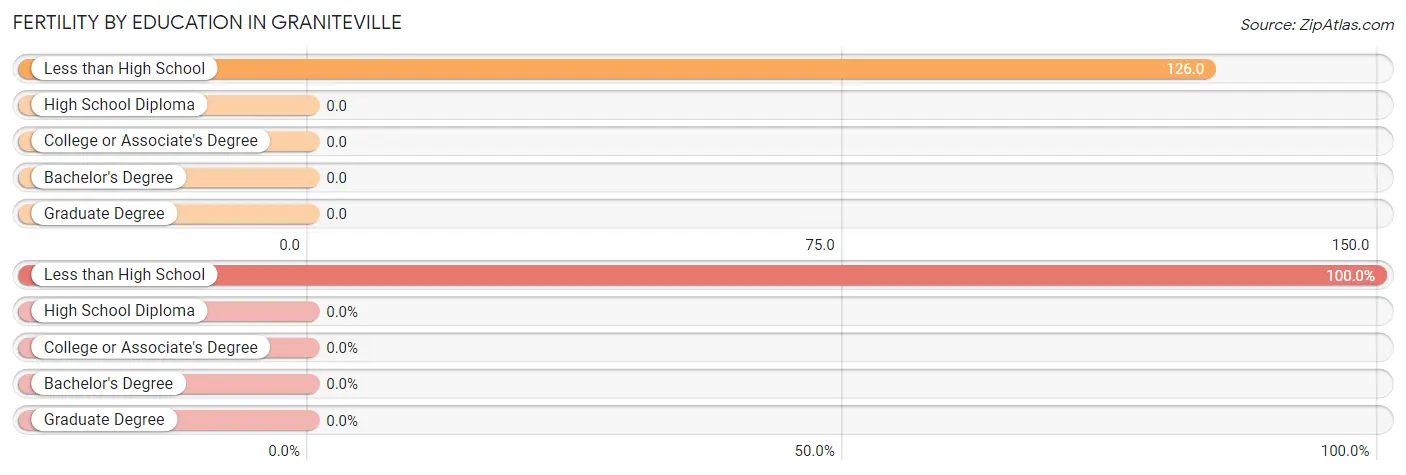
| Educational Attainment | Women with Births | Births / 1,000 Women |
| Less than High School | 25 (100.0%) | 126.0 |
| High School Diploma | 0 (0.0%) | 0.0 |
| College or Associate's Degree | 0 (0.0%) | 0.0 |
| Bachelor's Degree | 0 (0.0%) | 0.0 |
| Graduate Degree | 0 (0.0%) | 0.0 |
| Total | 25 (100.0%) | 47.0 |
Fertility by Education by Marriage Status in Graniteville
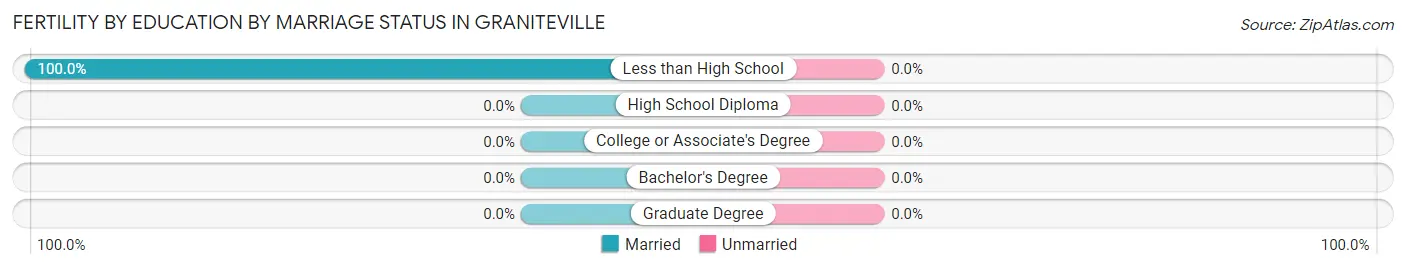
| Educational Attainment | Married | Unmarried |
| Less than High School | 25 (100.0%) | 0 (0.0%) |
| High School Diploma | 0 (0.0%) | 0 (0.0%) |
| College or Associate's Degree | 0 (0.0%) | 0 (0.0%) |
| Bachelor's Degree | 0 (0.0%) | 0 (0.0%) |
| Graduate Degree | 0 (0.0%) | 0 (0.0%) |
| Total | 25 (100.0%) | 0 (0.0%) |
Employment Characteristics in Graniteville
Employment by Class of Employer in Graniteville
Among the 842 employed individuals in Graniteville, private company employees (525 | 62.4%), self-employed (not incorporated) (116 | 13.8%), and state government employees (69 | 8.2%) make up the most common classes of employment.
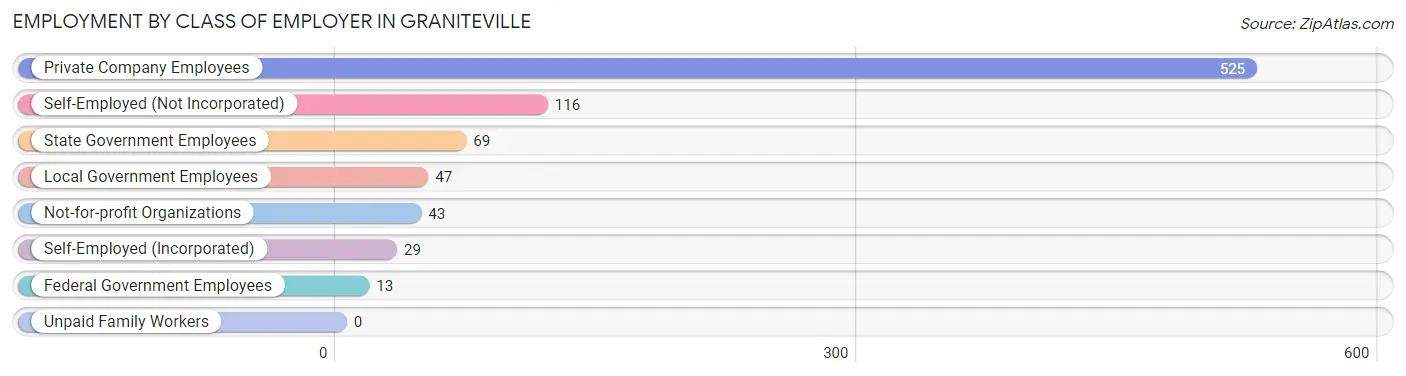
| Employer Class | # Employees | % Employees |
| Private Company Employees | 525 | 62.4% |
| Self-Employed (Incorporated) | 29 | 3.4% |
| Self-Employed (Not Incorporated) | 116 | 13.8% |
| Not-for-profit Organizations | 43 | 5.1% |
| Local Government Employees | 47 | 5.6% |
| State Government Employees | 69 | 8.2% |
| Federal Government Employees | 13 | 1.5% |
| Unpaid Family Workers | 0 | 0.0% |
| Total | 842 | 100.0% |
Employment Status by Age in Graniteville
According to the labor force statistics for Graniteville, out of the total population over 16 years of age (1,669), 54.2% or 905 individuals are in the labor force, with 6.9% or 62 of them unemployed. The age group with the highest labor force participation rate is 20 to 24 years, with 100.0% or 63 individuals in the labor force. Within the labor force, the 30 to 34 years age range has the highest percentage of unemployed individuals, with 30.5% or 40 of them being unemployed.
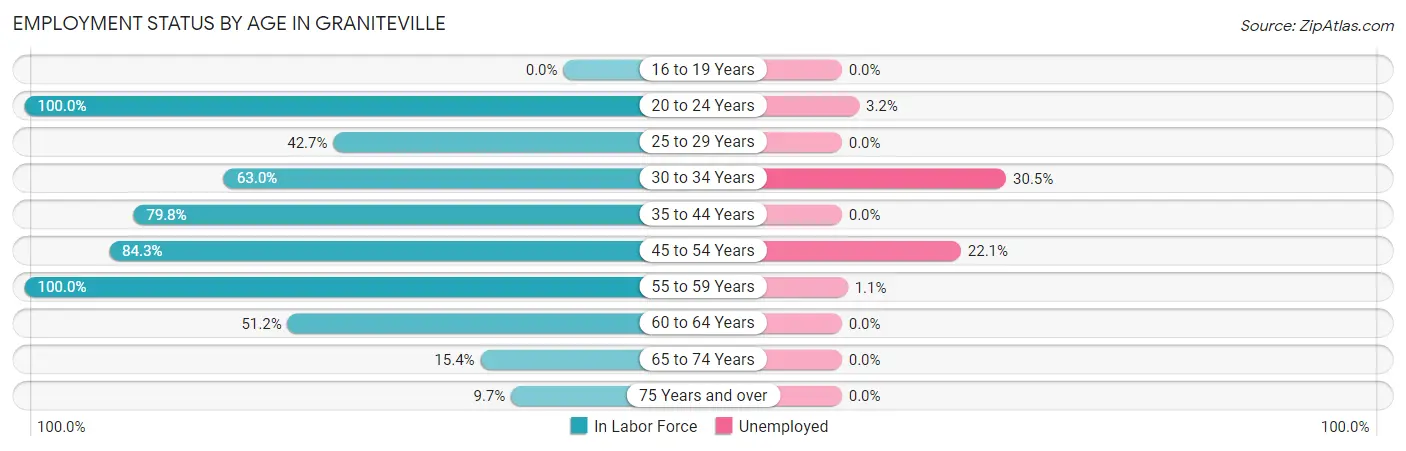
| Age Bracket | In Labor Force | Unemployed |
| 16 to 19 Years | 0 (0.0%) | 0 (0.0%) |
| 20 to 24 Years | 63 (100.0%) | 2 (3.2%) |
| 25 to 29 Years | 82 (42.7%) | 0 (0.0%) |
| 30 to 34 Years | 131 (63.0%) | 40 (30.5%) |
| 35 to 44 Years | 301 (79.8%) | 0 (0.0%) |
| 45 to 54 Years | 86 (84.3%) | 19 (22.1%) |
| 55 to 59 Years | 89 (100.0%) | 1 (1.1%) |
| 60 to 64 Years | 108 (51.2%) | 0 (0.0%) |
| 65 to 74 Years | 20 (15.4%) | 0 (0.0%) |
| 75 Years and over | 24 (9.7%) | 0 (0.0%) |
| Total | 905 (54.2%) | 62 (6.9%) |
Employment Status by Educational Attainment in Graniteville
According to labor force statistics for Graniteville, 67.6% of individuals (797) out of the total population between 25 and 64 years of age (1,179) are in the labor force, with 7.5% or 60 of them being unemployed. The group with the highest labor force participation rate are those with the educational attainment of bachelor's degree or higher, with 100.0% or 145 individuals in the labor force. Within the labor force, individuals with less than high school education have the highest percentage of unemployment, with 27.5% or 58 of them being unemployed.
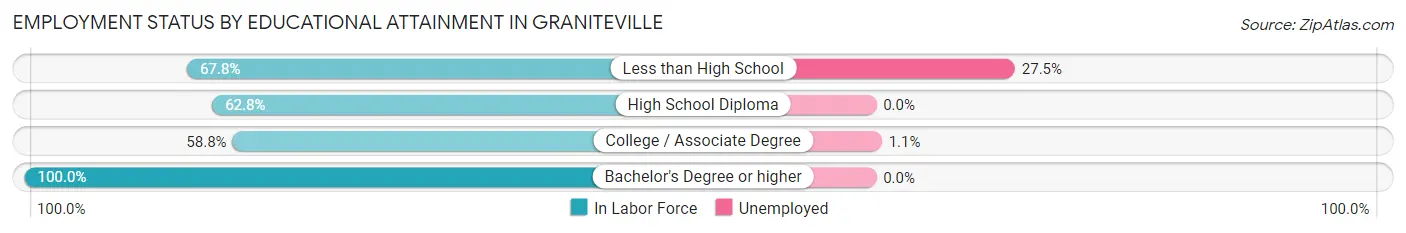
| Educational Attainment | In Labor Force | Unemployed |
| Less than High School | 211 (67.8%) | 86 (27.5%) |
| High School Diploma | 251 (62.8%) | 0 (0.0%) |
| College / Associate Degree | 190 (58.8%) | 4 (1.1%) |
| Bachelor's Degree or higher | 145 (100.0%) | 0 (0.0%) |
| Total | 797 (67.6%) | 88 (7.5%) |
Employment Occupations by Sex in Graniteville
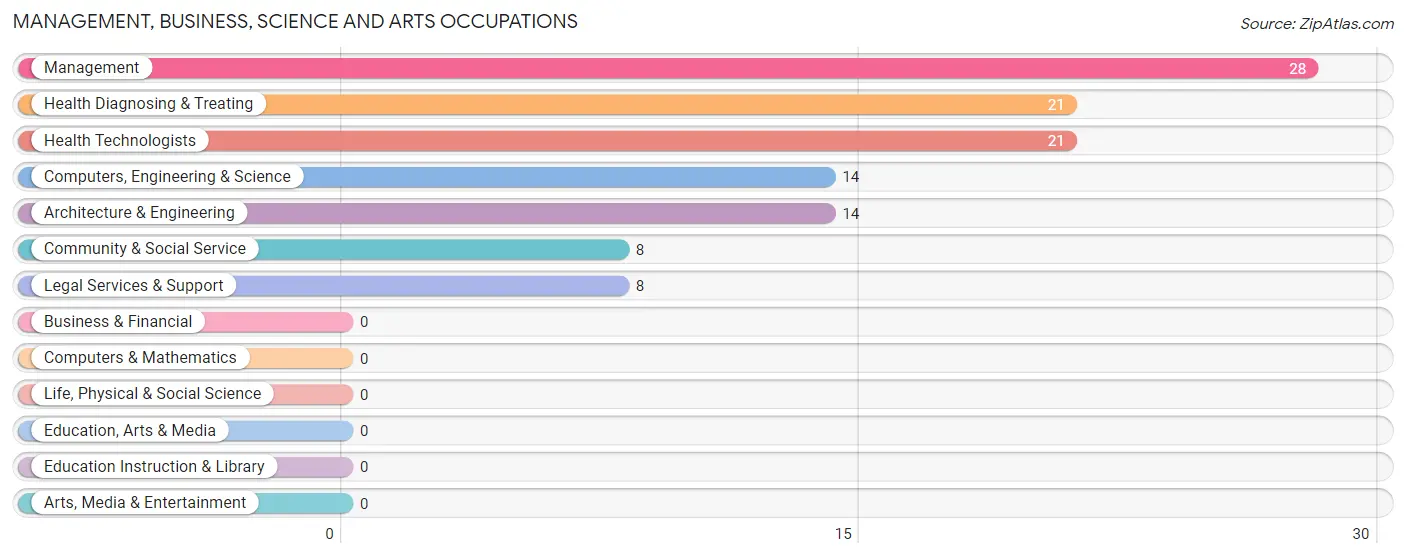
Management, Business, Science and Arts Occupations
The most common Management, Business, Science and Arts occupations in Graniteville are Management (28 | 3.3%), Health Diagnosing & Treating (21 | 2.5%), Health Technologists (21 | 2.5%), Computers, Engineering & Science (14 | 1.7%), and Architecture & Engineering (14 | 1.7%).
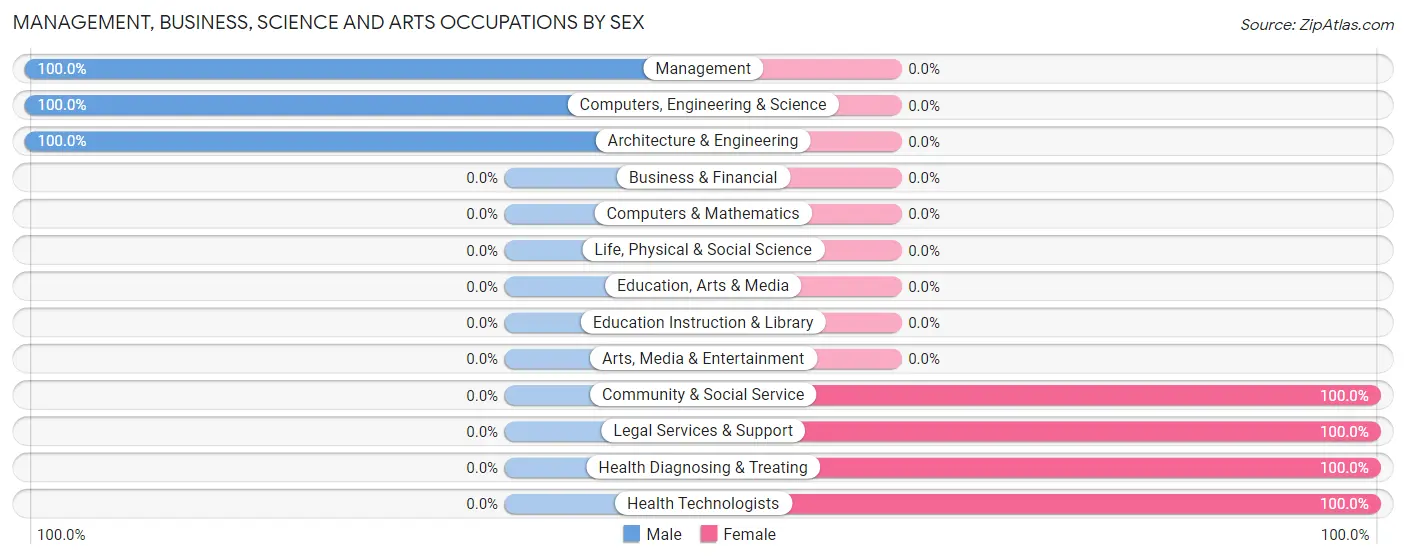
Management, Business, Science and Arts Occupations by Sex
Within the Management, Business, Science and Arts occupations in Graniteville, the most male-oriented occupations are Management (100.0%), Computers, Engineering & Science (100.0%), and Architecture & Engineering (100.0%), while the most female-oriented occupations are Community & Social Service (100.0%), Legal Services & Support (100.0%), and Health Diagnosing & Treating (100.0%).
| Occupation | Male | Female |
| Management | 28 (100.0%) | 0 (0.0%) |
| Business & Financial | 0 (0.0%) | 0 (0.0%) |
| Computers, Engineering & Science | 14 (100.0%) | 0 (0.0%) |
| Computers & Mathematics | 0 (0.0%) | 0 (0.0%) |
| Architecture & Engineering | 14 (100.0%) | 0 (0.0%) |
| Life, Physical & Social Science | 0 (0.0%) | 0 (0.0%) |
| Community & Social Service | 0 (0.0%) | 8 (100.0%) |
| Education, Arts & Media | 0 (0.0%) | 0 (0.0%) |
| Legal Services & Support | 0 (0.0%) | 8 (100.0%) |
| Education Instruction & Library | 0 (0.0%) | 0 (0.0%) |
| Arts, Media & Entertainment | 0 (0.0%) | 0 (0.0%) |
| Health Diagnosing & Treating | 0 (0.0%) | 21 (100.0%) |
| Health Technologists | 0 (0.0%) | 21 (100.0%) |
| Total (Category) | 42 (59.2%) | 29 (40.8%) |
| Total (Overall) | 483 (57.4%) | 359 (42.6%) |
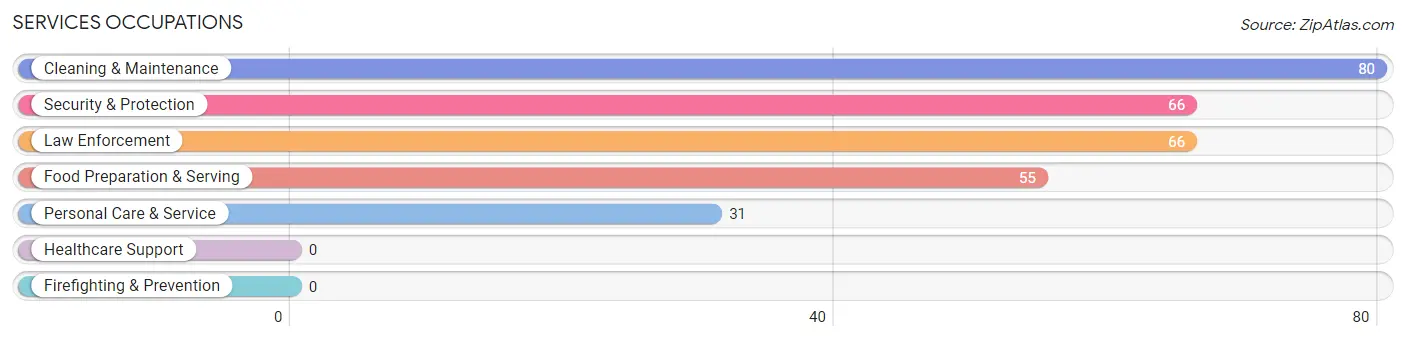
Services Occupations
The most common Services occupations in Graniteville are Cleaning & Maintenance (80 | 9.5%), Security & Protection (66 | 7.8%), Law Enforcement (66 | 7.8%), Food Preparation & Serving (55 | 6.5%), and Personal Care & Service (31 | 3.7%).
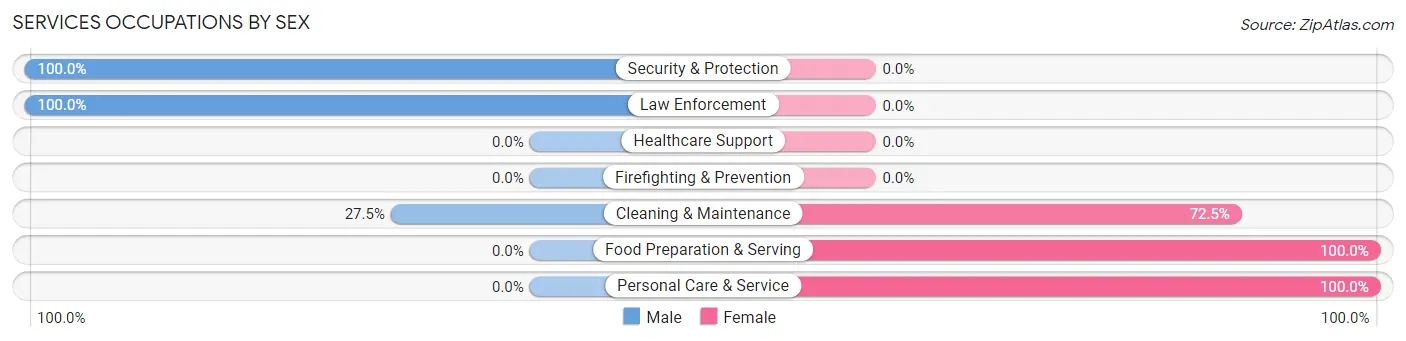
Services Occupations by Sex
Within the Services occupations in Graniteville, the most male-oriented occupations are Security & Protection (100.0%), Law Enforcement (100.0%), and Cleaning & Maintenance (27.5%), while the most female-oriented occupations are Food Preparation & Serving (100.0%), Personal Care & Service (100.0%), and Cleaning & Maintenance (72.5%).
| Occupation | Male | Female |
| Healthcare Support | 0 (0.0%) | 0 (0.0%) |
| Security & Protection | 66 (100.0%) | 0 (0.0%) |
| Firefighting & Prevention | 0 (0.0%) | 0 (0.0%) |
| Law Enforcement | 66 (100.0%) | 0 (0.0%) |
| Food Preparation & Serving | 0 (0.0%) | 55 (100.0%) |
| Cleaning & Maintenance | 22 (27.5%) | 58 (72.5%) |
| Personal Care & Service | 0 (0.0%) | 31 (100.0%) |
| Total (Category) | 88 (37.9%) | 144 (62.1%) |
| Total (Overall) | 483 (57.4%) | 359 (42.6%) |
Sales and Office Occupations
The most common Sales and Office occupations in Graniteville are Office & Administration (96 | 11.4%), and Sales & Related (76 | 9.0%).
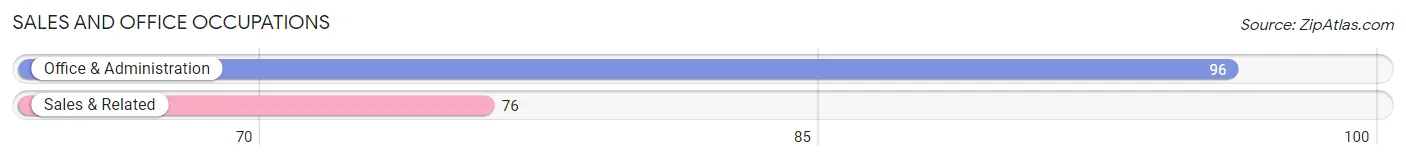
Sales and Office Occupations by Sex
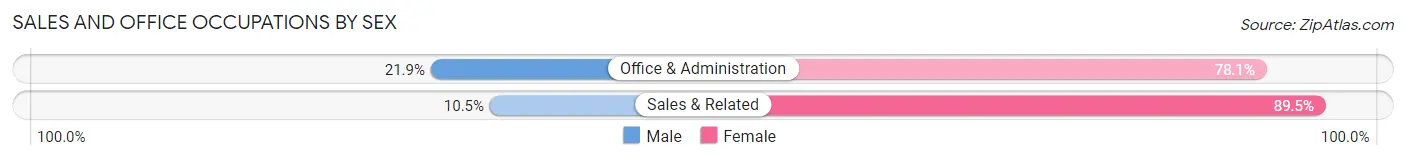
| Occupation | Male | Female |
| Sales & Related | 8 (10.5%) | 68 (89.5%) |
| Office & Administration | 21 (21.9%) | 75 (78.1%) |
| Total (Category) | 29 (16.9%) | 143 (83.1%) |
| Total (Overall) | 483 (57.4%) | 359 (42.6%) |
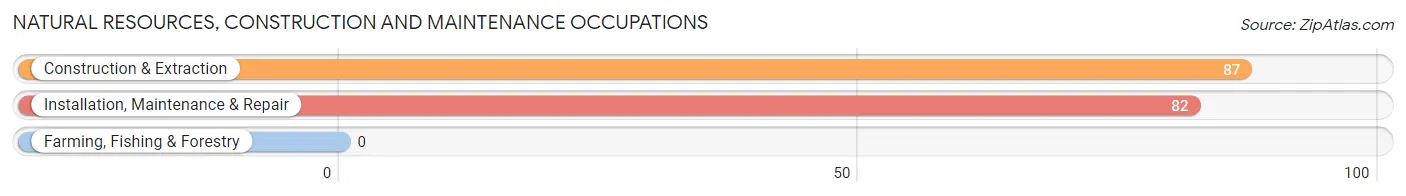
Natural Resources, Construction and Maintenance Occupations
The most common Natural Resources, Construction and Maintenance occupations in Graniteville are Construction & Extraction (87 | 10.3%), and Installation, Maintenance & Repair (82 | 9.7%).
Natural Resources, Construction and Maintenance Occupations by Sex
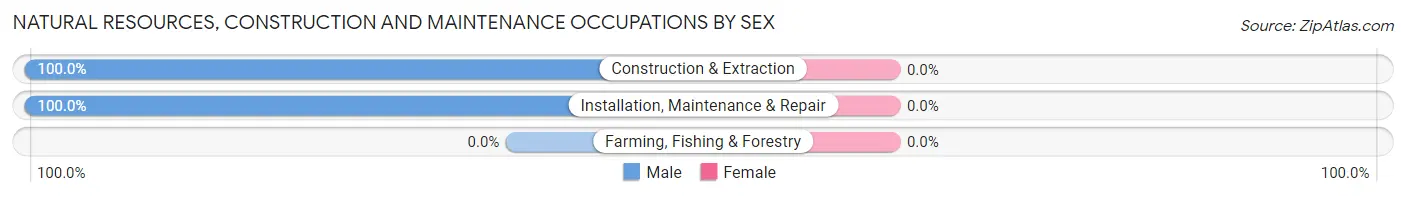
| Occupation | Male | Female |
| Farming, Fishing & Forestry | 0 (0.0%) | 0 (0.0%) |
| Construction & Extraction | 87 (100.0%) | 0 (0.0%) |
| Installation, Maintenance & Repair | 82 (100.0%) | 0 (0.0%) |
| Total (Category) | 169 (100.0%) | 0 (0.0%) |
| Total (Overall) | 483 (57.4%) | 359 (42.6%) |
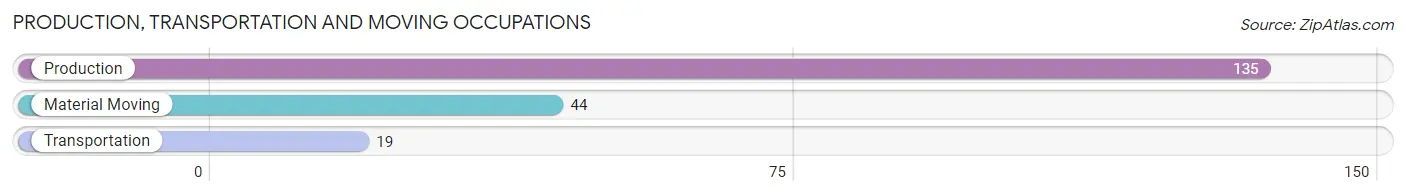
Production, Transportation and Moving Occupations
The most common Production, Transportation and Moving occupations in Graniteville are Production (135 | 16.0%), Material Moving (44 | 5.2%), and Transportation (19 | 2.3%).
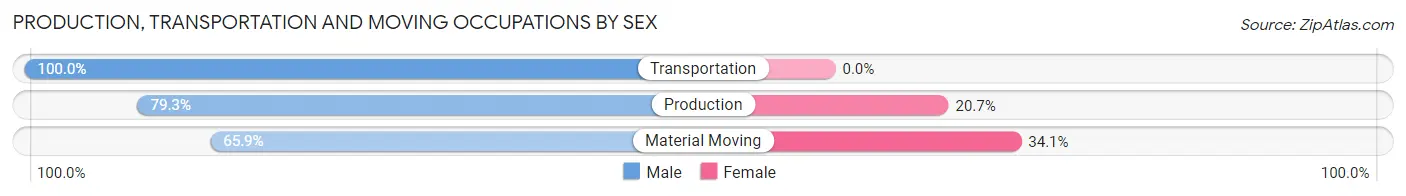
Production, Transportation and Moving Occupations by Sex
| Occupation | Male | Female |
| Production | 107 (79.3%) | 28 (20.7%) |
| Transportation | 19 (100.0%) | 0 (0.0%) |
| Material Moving | 29 (65.9%) | 15 (34.1%) |
| Total (Category) | 155 (78.3%) | 43 (21.7%) |
| Total (Overall) | 483 (57.4%) | 359 (42.6%) |
Employment Industries by Sex in Graniteville
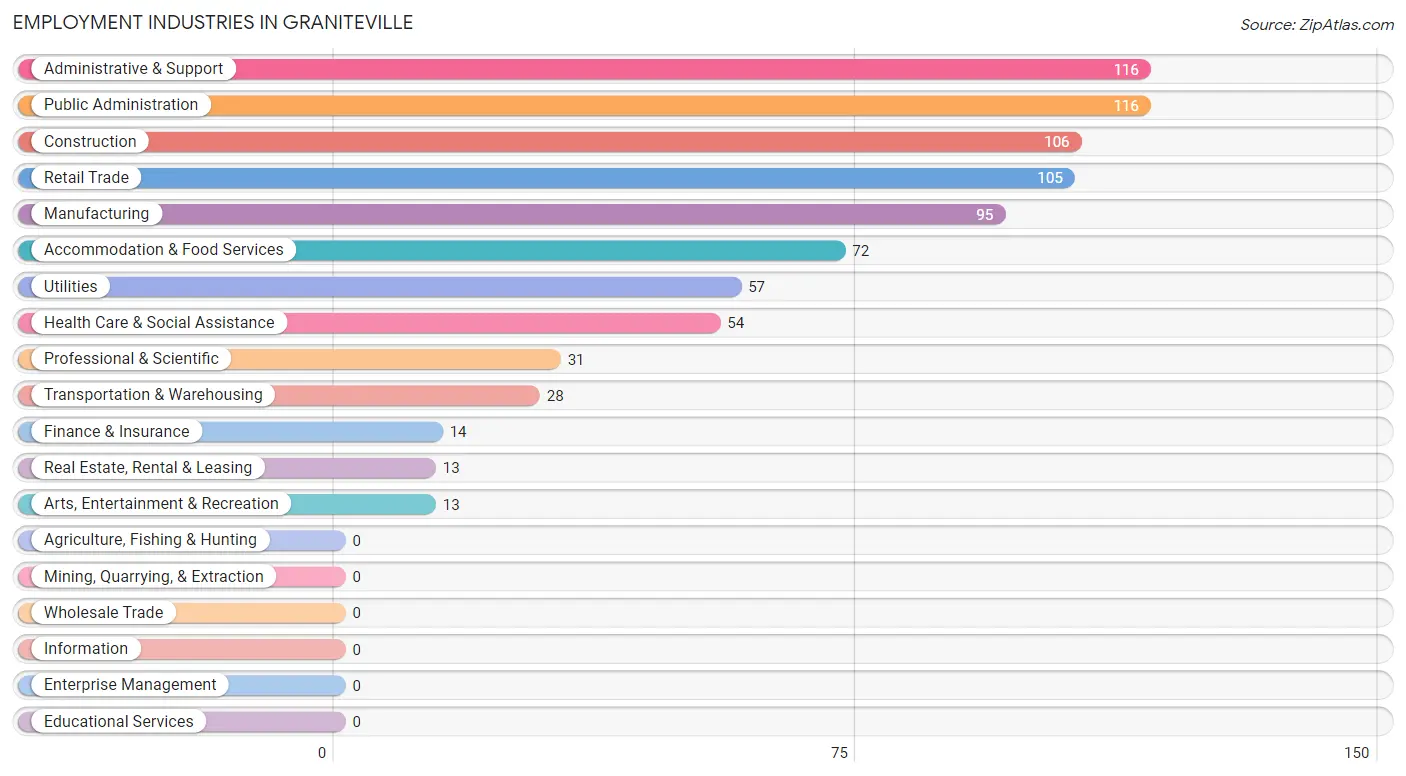
Employment Industries in Graniteville
The major employment industries in Graniteville include Administrative & Support (116 | 13.8%), Public Administration (116 | 13.8%), Construction (106 | 12.6%), Retail Trade (105 | 12.5%), and Manufacturing (95 | 11.3%).
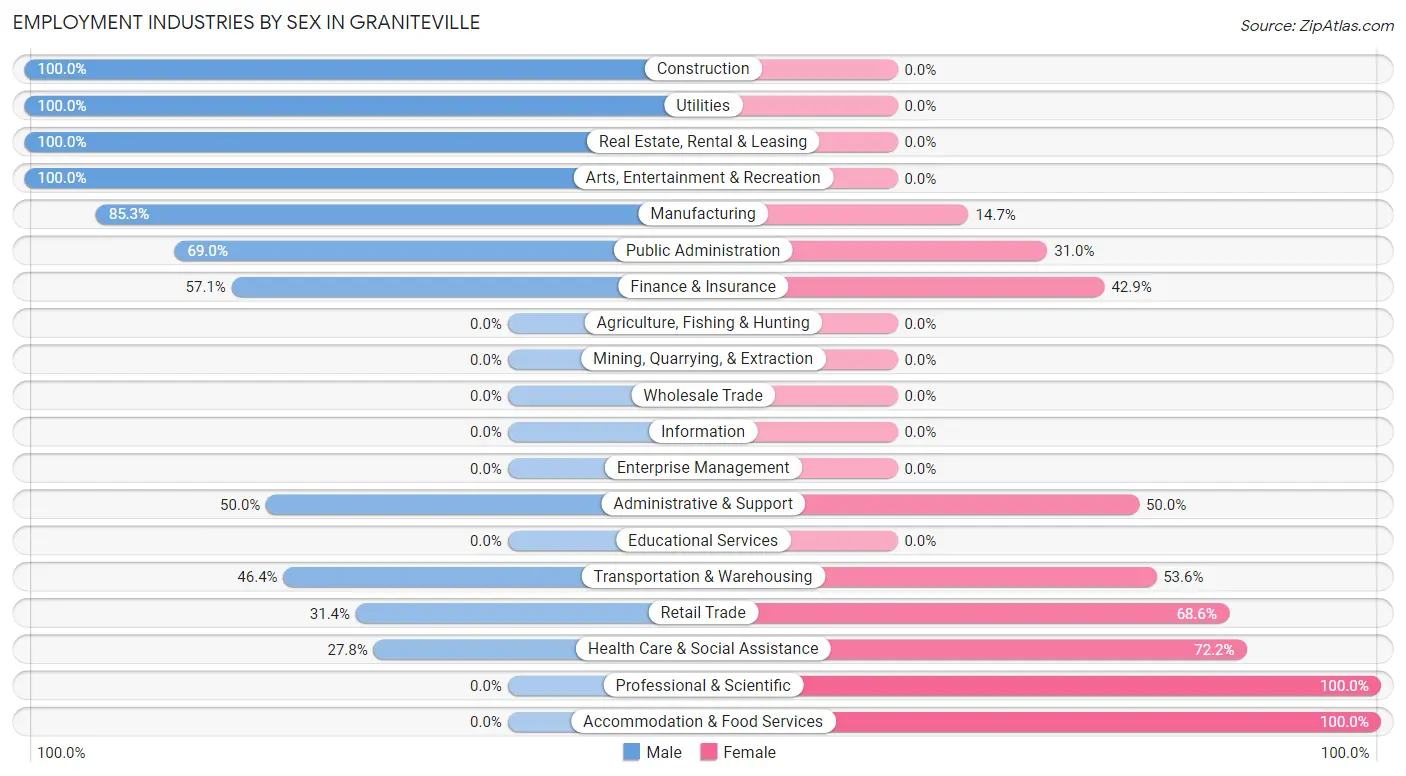
Employment Industries by Sex in Graniteville
The Graniteville industries that see more men than women are Construction (100.0%), Utilities (100.0%), and Real Estate, Rental & Leasing (100.0%), whereas the industries that tend to have a higher number of women are Professional & Scientific (100.0%), Accommodation & Food Services (100.0%), and Health Care & Social Assistance (72.2%).
| Industry | Male | Female |
| Agriculture, Fishing & Hunting | 0 (0.0%) | 0 (0.0%) |
| Mining, Quarrying, & Extraction | 0 (0.0%) | 0 (0.0%) |
| Construction | 106 (100.0%) | 0 (0.0%) |
| Manufacturing | 81 (85.3%) | 14 (14.7%) |
| Wholesale Trade | 0 (0.0%) | 0 (0.0%) |
| Retail Trade | 33 (31.4%) | 72 (68.6%) |
| Transportation & Warehousing | 13 (46.4%) | 15 (53.6%) |
| Utilities | 57 (100.0%) | 0 (0.0%) |
| Information | 0 (0.0%) | 0 (0.0%) |
| Finance & Insurance | 8 (57.1%) | 6 (42.9%) |
| Real Estate, Rental & Leasing | 13 (100.0%) | 0 (0.0%) |
| Professional & Scientific | 0 (0.0%) | 31 (100.0%) |
| Enterprise Management | 0 (0.0%) | 0 (0.0%) |
| Administrative & Support | 58 (50.0%) | 58 (50.0%) |
| Educational Services | 0 (0.0%) | 0 (0.0%) |
| Health Care & Social Assistance | 15 (27.8%) | 39 (72.2%) |
| Arts, Entertainment & Recreation | 13 (100.0%) | 0 (0.0%) |
| Accommodation & Food Services | 0 (0.0%) | 72 (100.0%) |
| Public Administration | 80 (69.0%) | 36 (31.0%) |
| Total | 483 (57.4%) | 359 (42.6%) |
Education in Graniteville
School Enrollment in Graniteville
The most common levels of schooling among the 697 students in Graniteville are elementary school (346 | 49.6%), middle school (155 | 22.2%), and high school (106 | 15.2%).
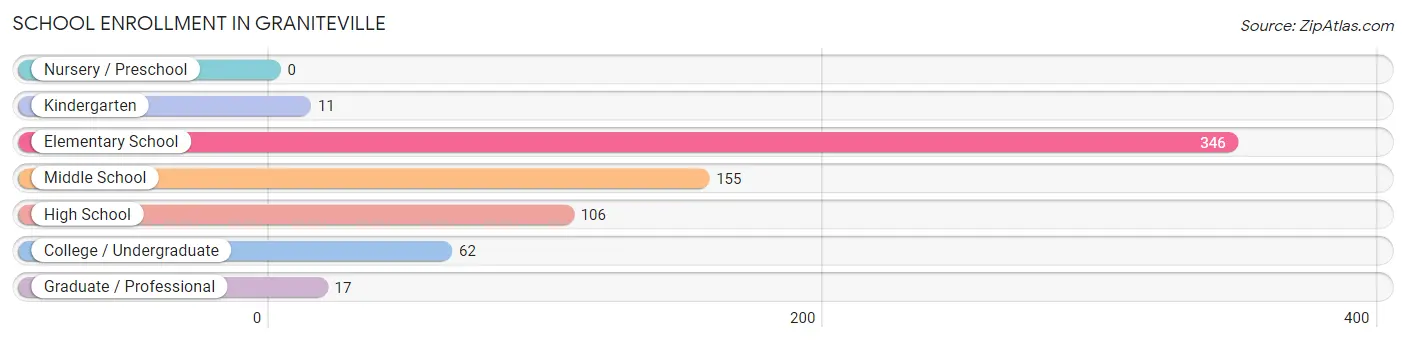
| School Level | # Students | % Students |
| Nursery / Preschool | 0 | 0.0% |
| Kindergarten | 11 | 1.6% |
| Elementary School | 346 | 49.6% |
| Middle School | 155 | 22.2% |
| High School | 106 | 15.2% |
| College / Undergraduate | 62 | 8.9% |
| Graduate / Professional | 17 | 2.4% |
| Total | 697 | 100.0% |
School Enrollment by Age by Funding Source in Graniteville
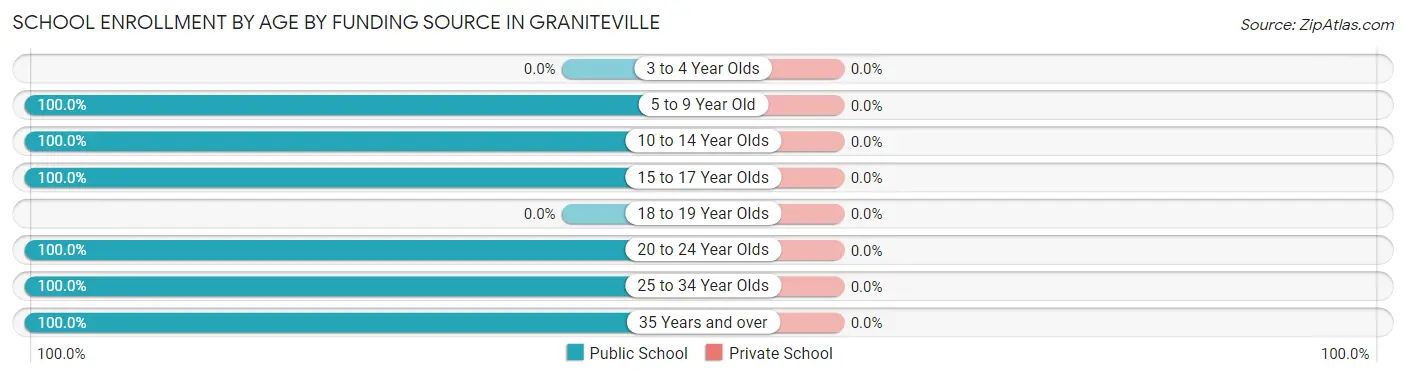
| Age Bracket | Public School | Private School |
| 3 to 4 Year Olds | 0 (0.0%) | 0 (0.0%) |
| 5 to 9 Year Old | 328 (100.0%) | 0 (0.0%) |
| 10 to 14 Year Olds | 184 (100.0%) | 0 (0.0%) |
| 15 to 17 Year Olds | 106 (100.0%) | 0 (0.0%) |
| 18 to 19 Year Olds | 0 (0.0%) | 0 (0.0%) |
| 20 to 24 Year Olds | 17 (100.0%) | 0 (0.0%) |
| 25 to 34 Year Olds | 43 (100.0%) | 0 (0.0%) |
| 35 Years and over | 19 (100.0%) | 0 (0.0%) |
| Total | 697 (100.0%) | 0 (0.0%) |
Educational Attainment by Field of Study in Graniteville
Business (59 | 32.6%), arts & humanities (54 | 29.8%), education (29 | 16.0%), social sciences (28 | 15.5%), and science & technology (11 | 6.1%) are the most common fields of study among 181 individuals in Graniteville who have obtained a bachelor's degree or higher.
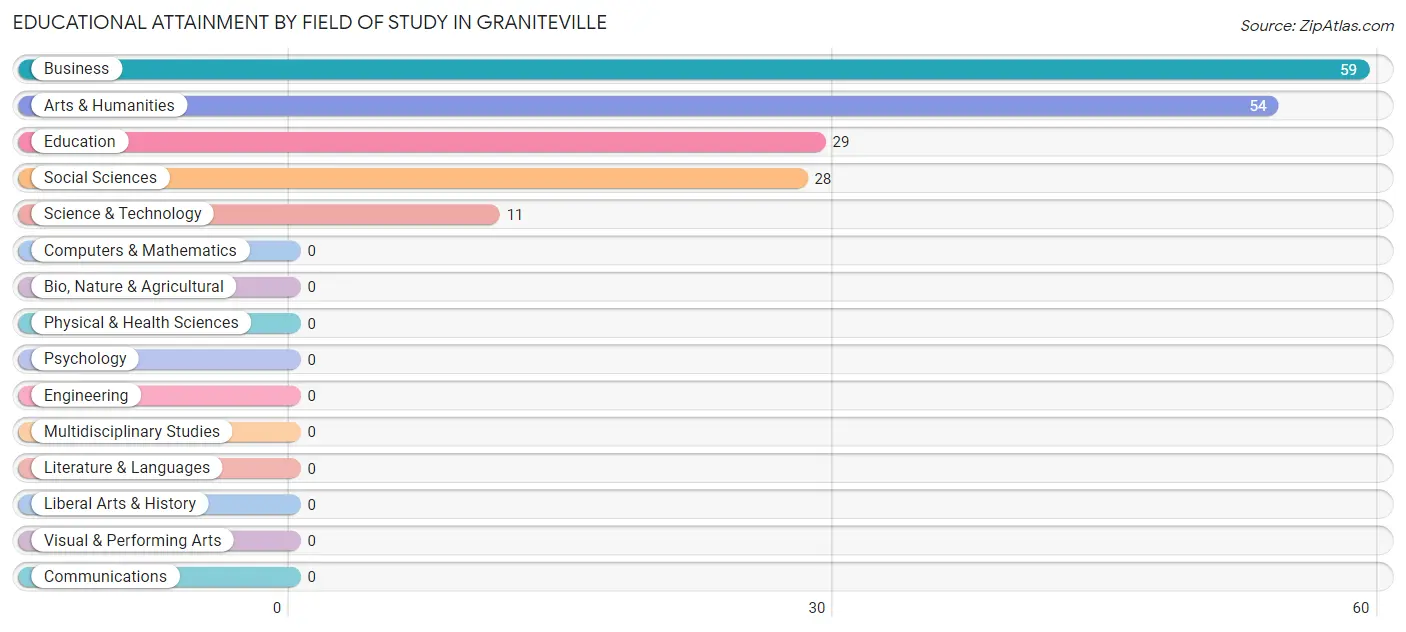
| Field of Study | # Graduates | % Graduates |
| Computers & Mathematics | 0 | 0.0% |
| Bio, Nature & Agricultural | 0 | 0.0% |
| Physical & Health Sciences | 0 | 0.0% |
| Psychology | 0 | 0.0% |
| Social Sciences | 28 | 15.5% |
| Engineering | 0 | 0.0% |
| Multidisciplinary Studies | 0 | 0.0% |
| Science & Technology | 11 | 6.1% |
| Business | 59 | 32.6% |
| Education | 29 | 16.0% |
| Literature & Languages | 0 | 0.0% |
| Liberal Arts & History | 0 | 0.0% |
| Visual & Performing Arts | 0 | 0.0% |
| Communications | 0 | 0.0% |
| Arts & Humanities | 54 | 29.8% |
| Total | 181 | 100.0% |
Transportation & Commute in Graniteville
Vehicle Availability by Sex in Graniteville
The most prevalent vehicle ownership categories in Graniteville are males with 2 vehicles (220, accounting for 45.6%) and females with 2 vehicles (106, making up 61.3%).
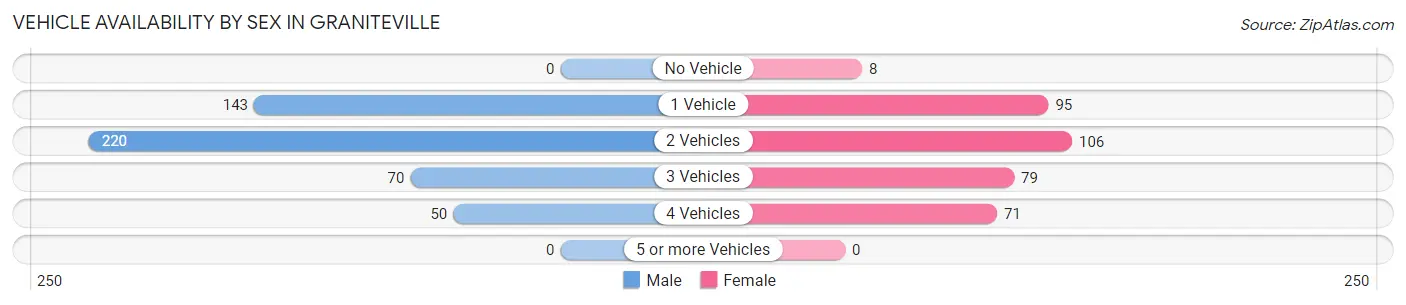
| Vehicles Available | Male | Female |
| No Vehicle | 0 (0.0%) | 8 (2.2%) |
| 1 Vehicle | 143 (29.6%) | 95 (26.5%) |
| 2 Vehicles | 220 (45.6%) | 106 (29.5%) |
| 3 Vehicles | 70 (14.5%) | 79 (22.0%) |
| 4 Vehicles | 50 (10.3%) | 71 (19.8%) |
| 5 or more Vehicles | 0 (0.0%) | 0 (0.0%) |
| Total | 483 (100.0%) | 359 (100.0%) |
Commute Time in Graniteville
The most frequently occuring commute durations in Graniteville are 20 to 24 minutes (162 commuters, 19.2%), 30 to 34 minutes (153 commuters, 18.2%), and 10 to 14 minutes (149 commuters, 17.7%).
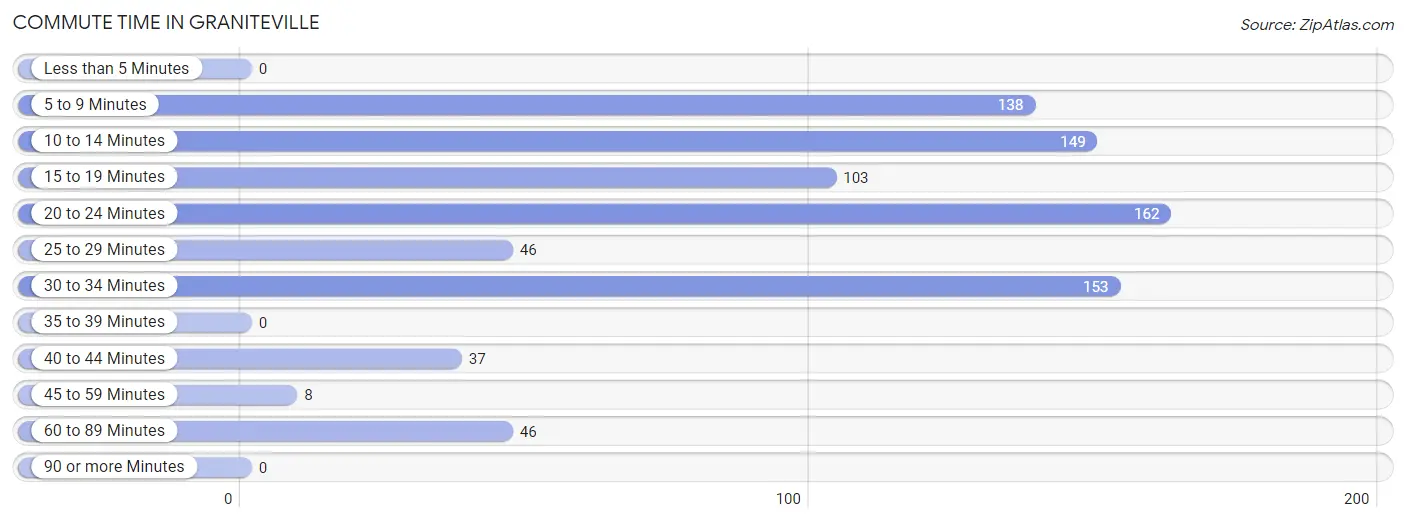
| Commute Time | # Commuters | % Commuters |
| Less than 5 Minutes | 0 | 0.0% |
| 5 to 9 Minutes | 138 | 16.4% |
| 10 to 14 Minutes | 149 | 17.7% |
| 15 to 19 Minutes | 103 | 12.2% |
| 20 to 24 Minutes | 162 | 19.2% |
| 25 to 29 Minutes | 46 | 5.5% |
| 30 to 34 Minutes | 153 | 18.2% |
| 35 to 39 Minutes | 0 | 0.0% |
| 40 to 44 Minutes | 37 | 4.4% |
| 45 to 59 Minutes | 8 | 0.9% |
| 60 to 89 Minutes | 46 | 5.5% |
| 90 or more Minutes | 0 | 0.0% |
Commute Time by Sex in Graniteville
The most common commute times in Graniteville are 5 to 9 minutes (97 commuters, 20.1%) for males and 20 to 24 minutes (78 commuters, 21.7%) for females.
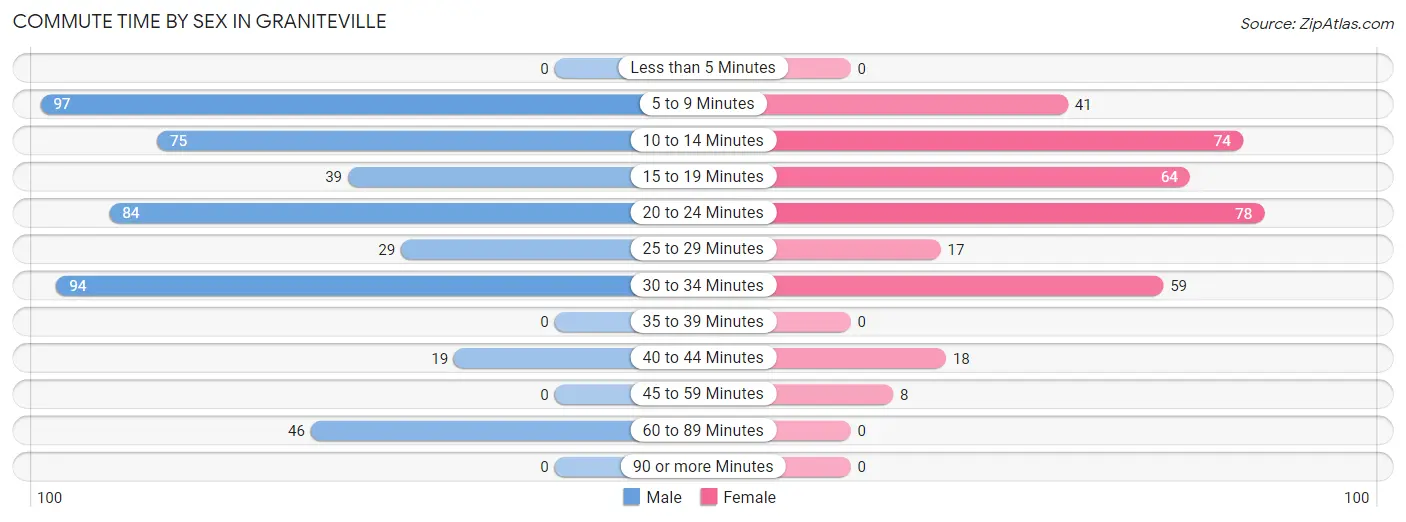
| Commute Time | Male | Female |
| Less than 5 Minutes | 0 (0.0%) | 0 (0.0%) |
| 5 to 9 Minutes | 97 (20.1%) | 41 (11.4%) |
| 10 to 14 Minutes | 75 (15.5%) | 74 (20.6%) |
| 15 to 19 Minutes | 39 (8.1%) | 64 (17.8%) |
| 20 to 24 Minutes | 84 (17.4%) | 78 (21.7%) |
| 25 to 29 Minutes | 29 (6.0%) | 17 (4.7%) |
| 30 to 34 Minutes | 94 (19.5%) | 59 (16.4%) |
| 35 to 39 Minutes | 0 (0.0%) | 0 (0.0%) |
| 40 to 44 Minutes | 19 (3.9%) | 18 (5.0%) |
| 45 to 59 Minutes | 0 (0.0%) | 8 (2.2%) |
| 60 to 89 Minutes | 46 (9.5%) | 0 (0.0%) |
| 90 or more Minutes | 0 (0.0%) | 0 (0.0%) |
Time of Departure to Work by Sex in Graniteville
The most frequent times of departure to work in Graniteville are 7:00 AM to 7:29 AM (178, 36.8%) for males and 8:00 AM to 8:29 AM (119, 33.2%) for females.
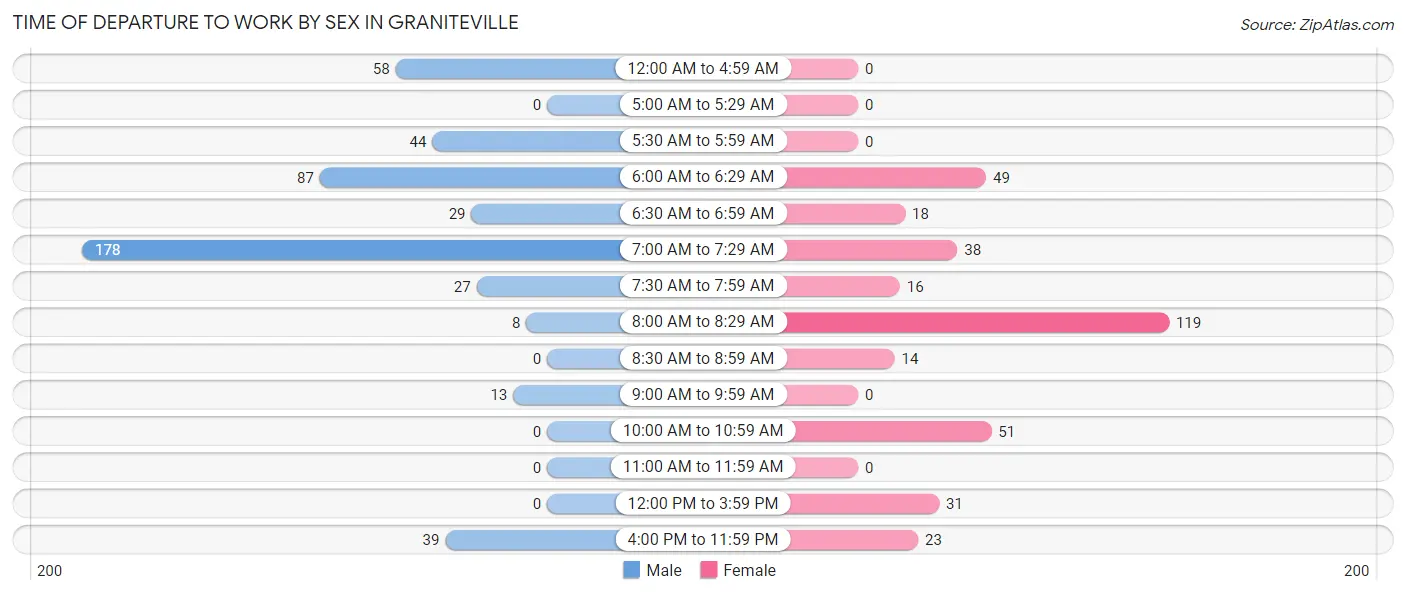
| Time of Departure | Male | Female |
| 12:00 AM to 4:59 AM | 58 (12.0%) | 0 (0.0%) |
| 5:00 AM to 5:29 AM | 0 (0.0%) | 0 (0.0%) |
| 5:30 AM to 5:59 AM | 44 (9.1%) | 0 (0.0%) |
| 6:00 AM to 6:29 AM | 87 (18.0%) | 49 (13.7%) |
| 6:30 AM to 6:59 AM | 29 (6.0%) | 18 (5.0%) |
| 7:00 AM to 7:29 AM | 178 (36.8%) | 38 (10.6%) |
| 7:30 AM to 7:59 AM | 27 (5.6%) | 16 (4.5%) |
| 8:00 AM to 8:29 AM | 8 (1.7%) | 119 (33.2%) |
| 8:30 AM to 8:59 AM | 0 (0.0%) | 14 (3.9%) |
| 9:00 AM to 9:59 AM | 13 (2.7%) | 0 (0.0%) |
| 10:00 AM to 10:59 AM | 0 (0.0%) | 51 (14.2%) |
| 11:00 AM to 11:59 AM | 0 (0.0%) | 0 (0.0%) |
| 12:00 PM to 3:59 PM | 0 (0.0%) | 31 (8.6%) |
| 4:00 PM to 11:59 PM | 39 (8.1%) | 23 (6.4%) |
| Total | 483 (100.0%) | 359 (100.0%) |
Housing Occupancy in Graniteville
Occupancy by Ownership in Graniteville
Of the total 954 dwellings in Graniteville, owner-occupied units account for 611 (64.0%), while renter-occupied units make up 343 (35.9%).
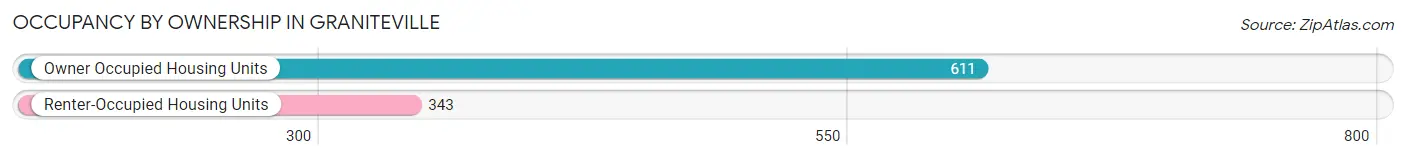
| Occupancy | # Housing Units | % Housing Units |
| Owner Occupied Housing Units | 611 | 64.0% |
| Renter-Occupied Housing Units | 343 | 35.9% |
| Total Occupied Housing Units | 954 | 100.0% |
Occupancy by Household Size in Graniteville
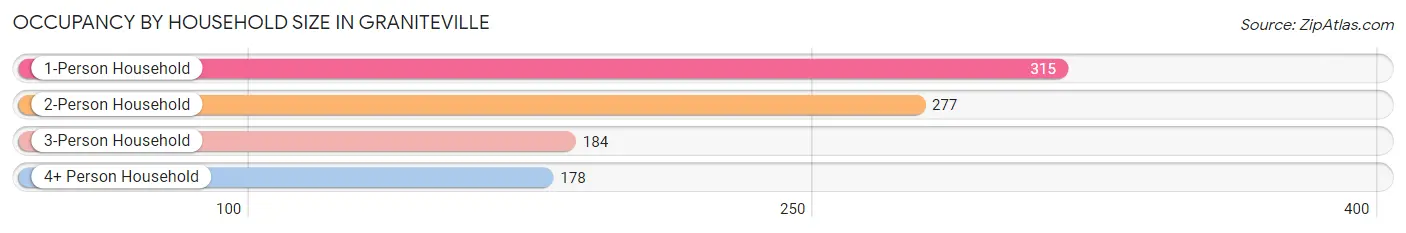
| Household Size | # Housing Units | % Housing Units |
| 1-Person Household | 315 | 33.0% |
| 2-Person Household | 277 | 29.0% |
| 3-Person Household | 184 | 19.3% |
| 4+ Person Household | 178 | 18.7% |
| Total Housing Units | 954 | 100.0% |
Occupancy by Ownership by Household Size in Graniteville
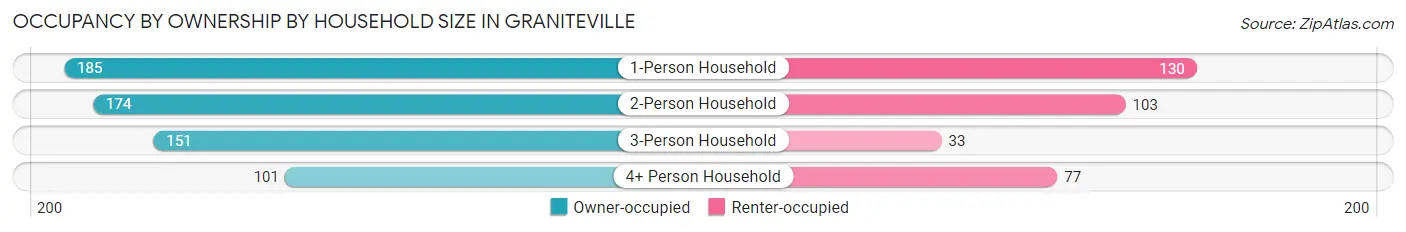
| Household Size | Owner-occupied | Renter-occupied |
| 1-Person Household | 185 (58.7%) | 130 (41.3%) |
| 2-Person Household | 174 (62.8%) | 103 (37.2%) |
| 3-Person Household | 151 (82.1%) | 33 (17.9%) |
| 4+ Person Household | 101 (56.7%) | 77 (43.3%) |
| Total Housing Units | 611 (64.0%) | 343 (35.9%) |
Occupancy by Educational Attainment in Graniteville
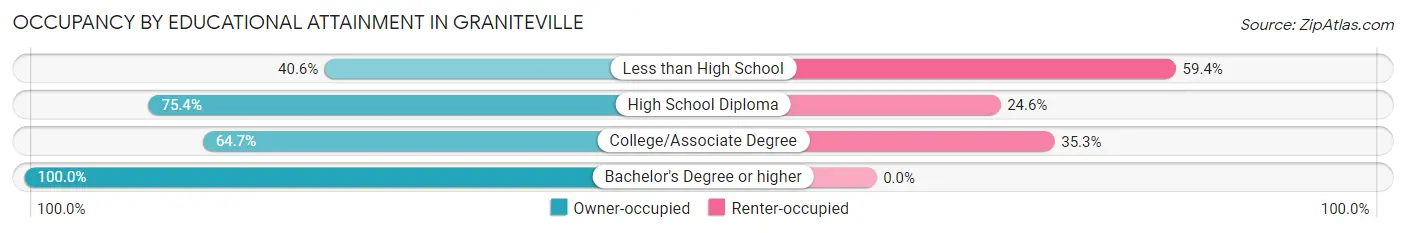
| Household Size | Owner-occupied | Renter-occupied |
| Less than High School | 117 (40.6%) | 171 (59.4%) |
| High School Diploma | 273 (75.4%) | 89 (24.6%) |
| College/Associate Degree | 152 (64.7%) | 83 (35.3%) |
| Bachelor's Degree or higher | 69 (100.0%) | 0 (0.0%) |
Occupancy by Age of Householder in Graniteville
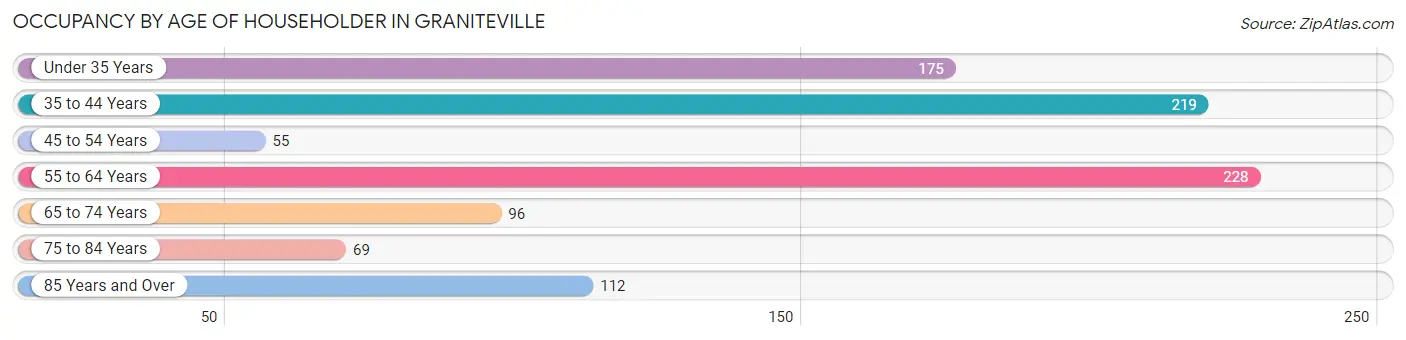
| Age Bracket | # Households | % Households |
| Under 35 Years | 175 | 18.3% |
| 35 to 44 Years | 219 | 23.0% |
| 45 to 54 Years | 55 | 5.8% |
| 55 to 64 Years | 228 | 23.9% |
| 65 to 74 Years | 96 | 10.1% |
| 75 to 84 Years | 69 | 7.2% |
| 85 Years and Over | 112 | 11.7% |
| Total | 954 | 100.0% |
Housing Finances in Graniteville
Median Income by Occupancy in Graniteville
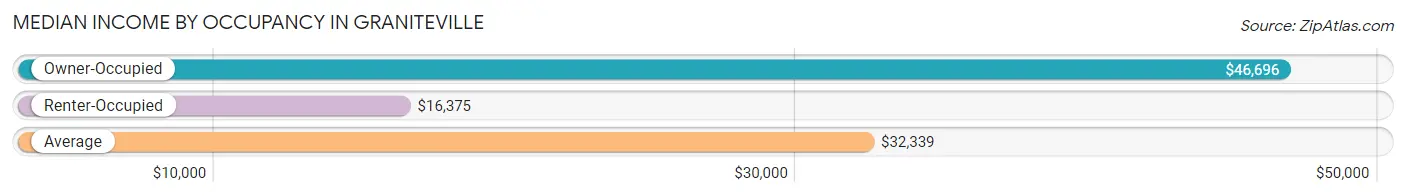
| Occupancy Type | # Households | Median Income |
| Owner-Occupied | 611 (64.0%) | $46,696 |
| Renter-Occupied | 343 (35.9%) | $16,375 |
| Average | 954 (100.0%) | $32,339 |
Occupancy by Householder Income Bracket in Graniteville
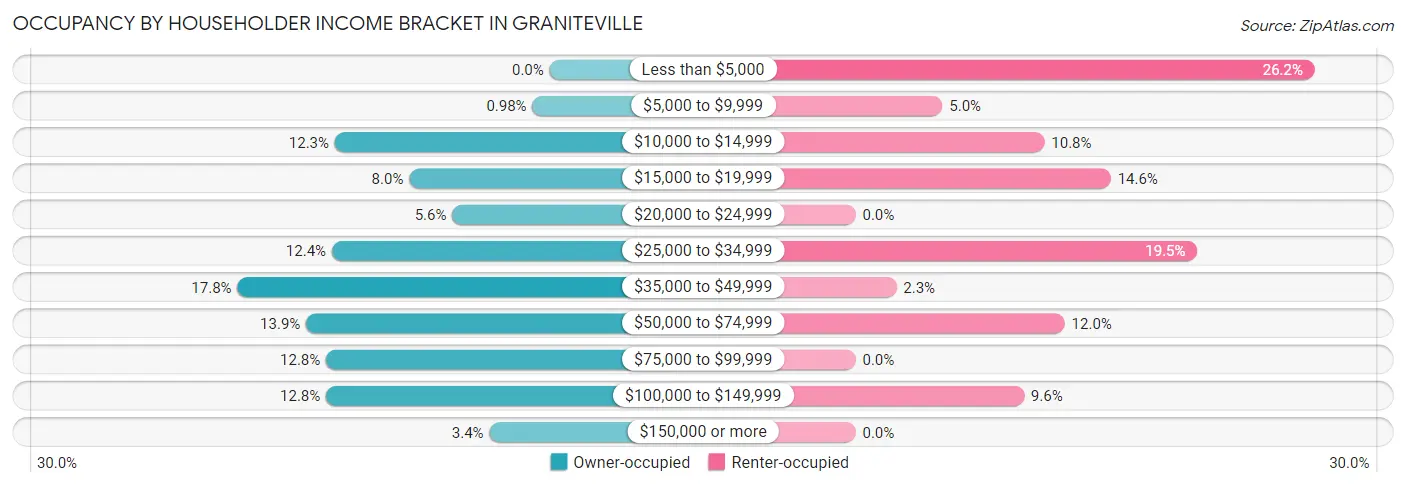
| Income Bracket | Owner-occupied | Renter-occupied |
| Less than $5,000 | 0 (0.0%) | 90 (26.2%) |
| $5,000 to $9,999 | 6 (1.0%) | 17 (5.0%) |
| $10,000 to $14,999 | 75 (12.3%) | 37 (10.8%) |
| $15,000 to $19,999 | 49 (8.0%) | 50 (14.6%) |
| $20,000 to $24,999 | 34 (5.6%) | 0 (0.0%) |
| $25,000 to $34,999 | 76 (12.4%) | 67 (19.5%) |
| $35,000 to $49,999 | 109 (17.8%) | 8 (2.3%) |
| $50,000 to $74,999 | 85 (13.9%) | 41 (11.9%) |
| $75,000 to $99,999 | 78 (12.8%) | 0 (0.0%) |
| $100,000 to $149,999 | 78 (12.8%) | 33 (9.6%) |
| $150,000 or more | 21 (3.4%) | 0 (0.0%) |
| Total | 611 (100.0%) | 343 (100.0%) |
Monthly Housing Cost Tiers in Graniteville
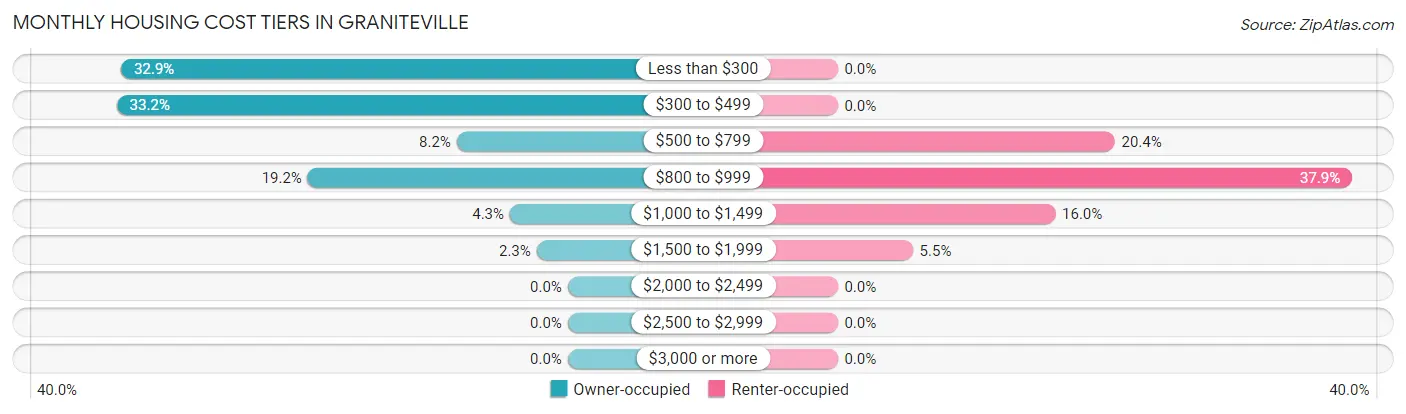
| Monthly Cost | Owner-occupied | Renter-occupied |
| Less than $300 | 201 (32.9%) | 0 (0.0%) |
| $300 to $499 | 203 (33.2%) | 0 (0.0%) |
| $500 to $799 | 50 (8.2%) | 70 (20.4%) |
| $800 to $999 | 117 (19.2%) | 130 (37.9%) |
| $1,000 to $1,499 | 26 (4.3%) | 55 (16.0%) |
| $1,500 to $1,999 | 14 (2.3%) | 19 (5.5%) |
| $2,000 to $2,499 | 0 (0.0%) | 0 (0.0%) |
| $2,500 to $2,999 | 0 (0.0%) | 0 (0.0%) |
| $3,000 or more | 0 (0.0%) | 0 (0.0%) |
| Total | 611 (100.0%) | 343 (100.0%) |
Physical Housing Characteristics in Graniteville
Housing Structures in Graniteville
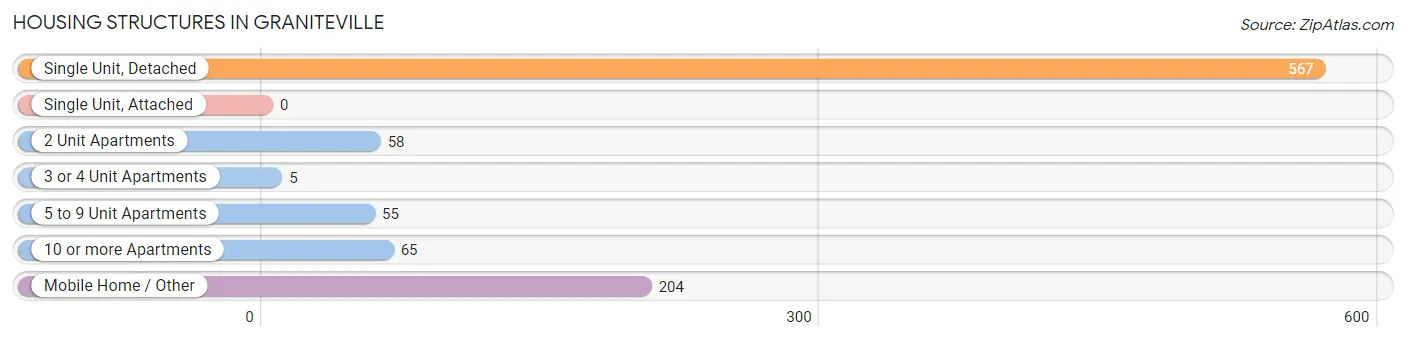
| Structure Type | # Housing Units | % Housing Units |
| Single Unit, Detached | 567 | 59.4% |
| Single Unit, Attached | 0 | 0.0% |
| 2 Unit Apartments | 58 | 6.1% |
| 3 or 4 Unit Apartments | 5 | 0.5% |
| 5 to 9 Unit Apartments | 55 | 5.8% |
| 10 or more Apartments | 65 | 6.8% |
| Mobile Home / Other | 204 | 21.4% |
| Total | 954 | 100.0% |
Housing Structures by Occupancy in Graniteville
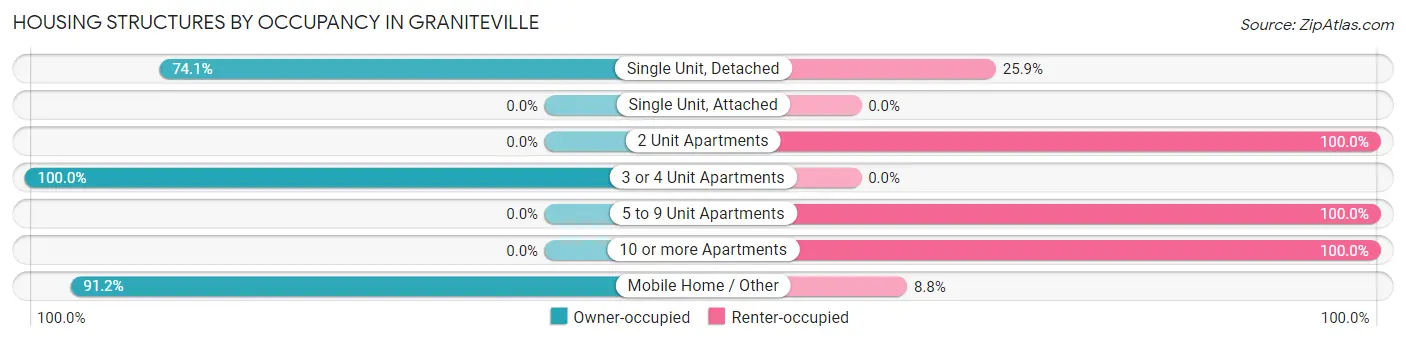
| Structure Type | Owner-occupied | Renter-occupied |
| Single Unit, Detached | 420 (74.1%) | 147 (25.9%) |
| Single Unit, Attached | 0 (0.0%) | 0 (0.0%) |
| 2 Unit Apartments | 0 (0.0%) | 58 (100.0%) |
| 3 or 4 Unit Apartments | 5 (100.0%) | 0 (0.0%) |
| 5 to 9 Unit Apartments | 0 (0.0%) | 55 (100.0%) |
| 10 or more Apartments | 0 (0.0%) | 65 (100.0%) |
| Mobile Home / Other | 186 (91.2%) | 18 (8.8%) |
| Total | 611 (64.0%) | 343 (35.9%) |
Housing Structures by Number of Rooms in Graniteville
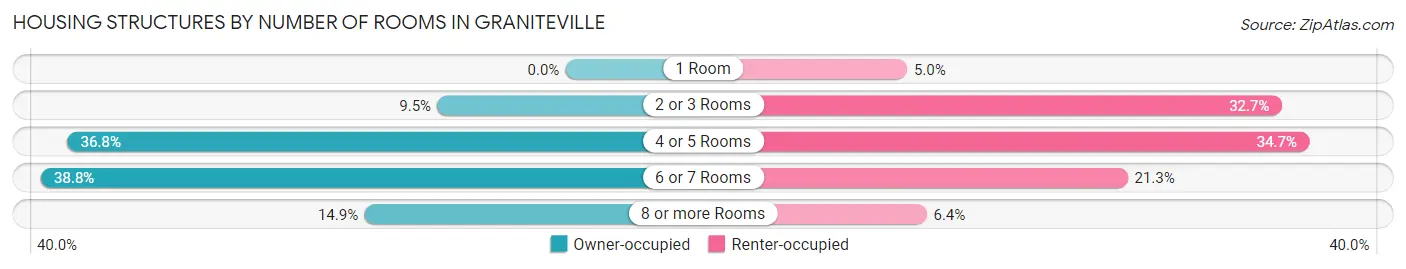
| Number of Rooms | Owner-occupied | Renter-occupied |
| 1 Room | 0 (0.0%) | 17 (5.0%) |
| 2 or 3 Rooms | 58 (9.5%) | 112 (32.7%) |
| 4 or 5 Rooms | 225 (36.8%) | 119 (34.7%) |
| 6 or 7 Rooms | 237 (38.8%) | 73 (21.3%) |
| 8 or more Rooms | 91 (14.9%) | 22 (6.4%) |
| Total | 611 (100.0%) | 343 (100.0%) |
Housing Structure by Heating Type in Graniteville
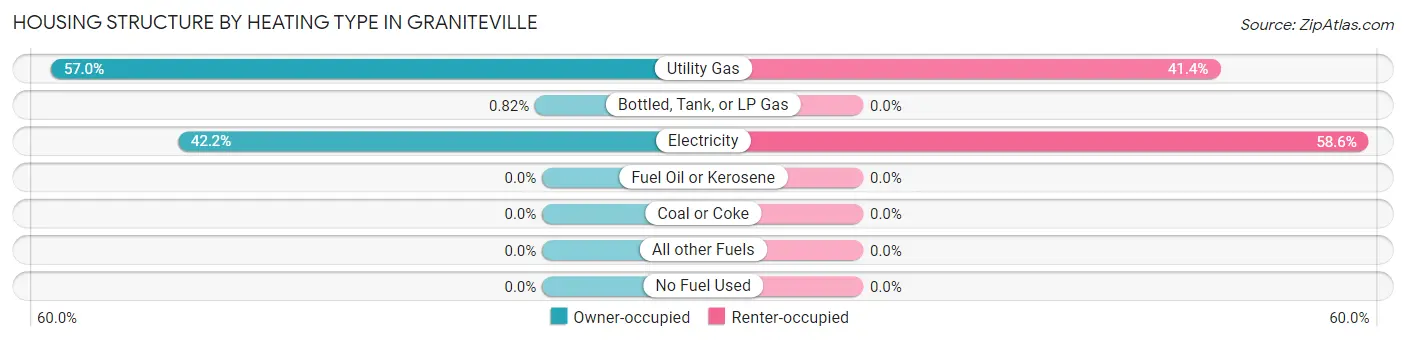
| Heating Type | Owner-occupied | Renter-occupied |
| Utility Gas | 348 (57.0%) | 142 (41.4%) |
| Bottled, Tank, or LP Gas | 5 (0.8%) | 0 (0.0%) |
| Electricity | 258 (42.2%) | 201 (58.6%) |
| Fuel Oil or Kerosene | 0 (0.0%) | 0 (0.0%) |
| Coal or Coke | 0 (0.0%) | 0 (0.0%) |
| All other Fuels | 0 (0.0%) | 0 (0.0%) |
| No Fuel Used | 0 (0.0%) | 0 (0.0%) |
| Total | 611 (100.0%) | 343 (100.0%) |
Household Vehicle Usage in Graniteville
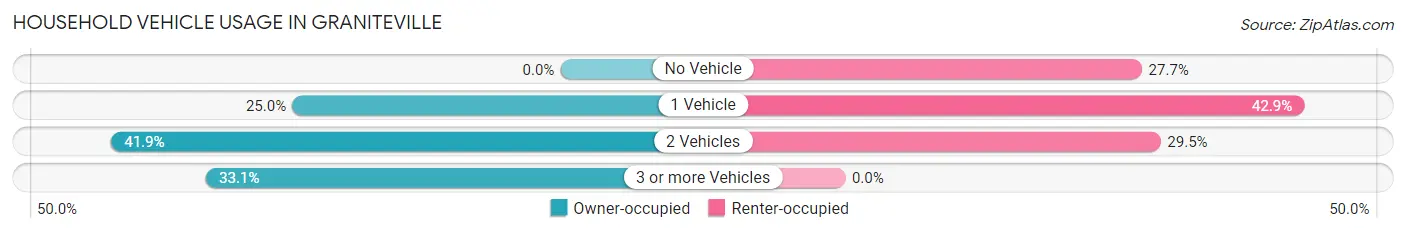
| Vehicles per Household | Owner-occupied | Renter-occupied |
| No Vehicle | 0 (0.0%) | 95 (27.7%) |
| 1 Vehicle | 153 (25.0%) | 147 (42.9%) |
| 2 Vehicles | 256 (41.9%) | 101 (29.4%) |
| 3 or more Vehicles | 202 (33.1%) | 0 (0.0%) |
| Total | 611 (100.0%) | 343 (100.0%) |
Real Estate & Mortgages in Graniteville
Real Estate and Mortgage Overview in Graniteville
| Characteristic | Without Mortgage | With Mortgage |
| Housing Units | 438 | 173 |
| Median Property Value | $76,000 | $89,400 |
| Median Household Income | $27,371 | $21 |
| Monthly Housing Costs | $307 | $0 |
| Real Estate Taxes | $384 | $0 |
Property Value by Mortgage Status in Graniteville
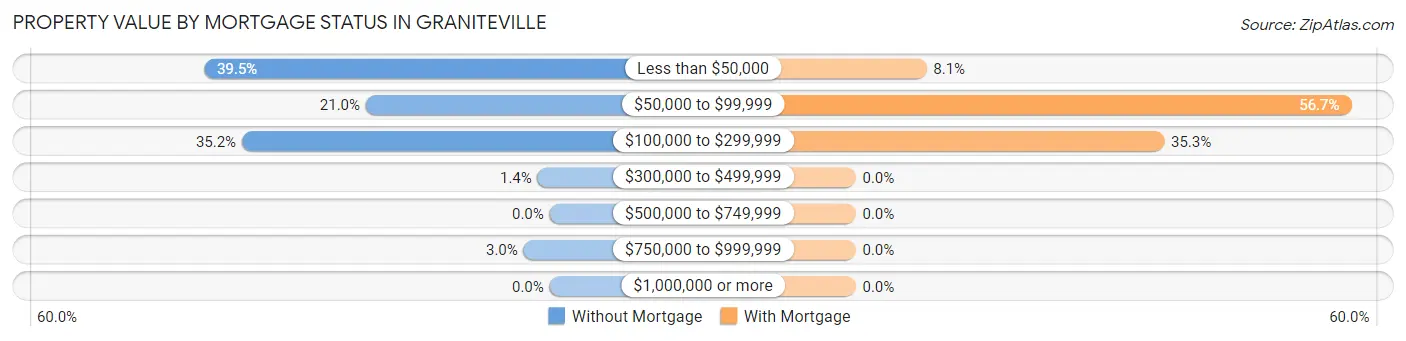
| Property Value | Without Mortgage | With Mortgage |
| Less than $50,000 | 173 (39.5%) | 14 (8.1%) |
| $50,000 to $99,999 | 92 (21.0%) | 98 (56.7%) |
| $100,000 to $299,999 | 154 (35.2%) | 61 (35.3%) |
| $300,000 to $499,999 | 6 (1.4%) | 0 (0.0%) |
| $500,000 to $749,999 | 0 (0.0%) | 0 (0.0%) |
| $750,000 to $999,999 | 13 (3.0%) | 0 (0.0%) |
| $1,000,000 or more | 0 (0.0%) | 0 (0.0%) |
| Total | 438 (100.0%) | 173 (100.0%) |
Household Income by Mortgage Status in Graniteville
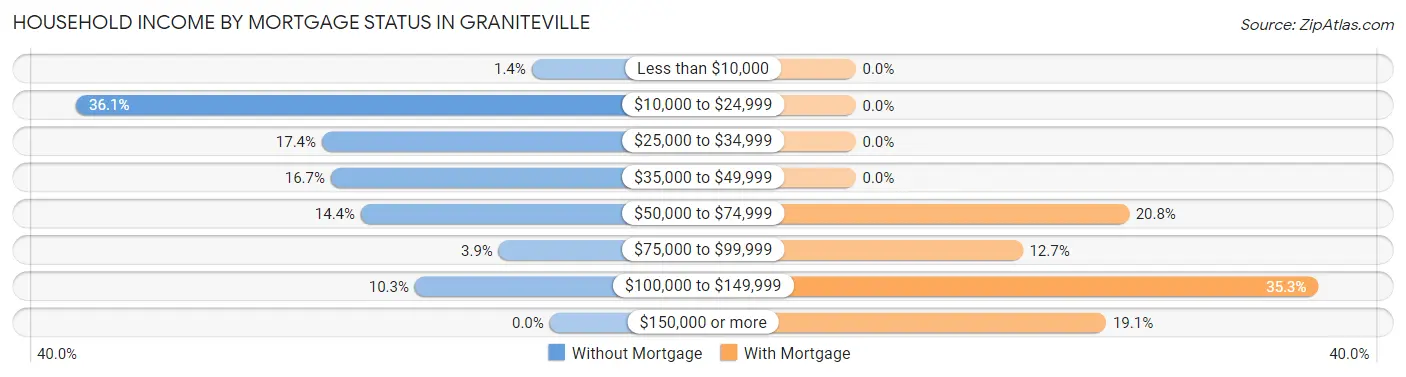
| Household Income | Without Mortgage | With Mortgage |
| Less than $10,000 | 6 (1.4%) | 0 (0.0%) |
| $10,000 to $24,999 | 158 (36.1%) | 0 (0.0%) |
| $25,000 to $34,999 | 76 (17.3%) | 0 (0.0%) |
| $35,000 to $49,999 | 73 (16.7%) | 0 (0.0%) |
| $50,000 to $74,999 | 63 (14.4%) | 36 (20.8%) |
| $75,000 to $99,999 | 17 (3.9%) | 22 (12.7%) |
| $100,000 to $149,999 | 45 (10.3%) | 61 (35.3%) |
| $150,000 or more | 0 (0.0%) | 33 (19.1%) |
| Total | 438 (100.0%) | 173 (100.0%) |
Property Value to Household Income Ratio in Graniteville
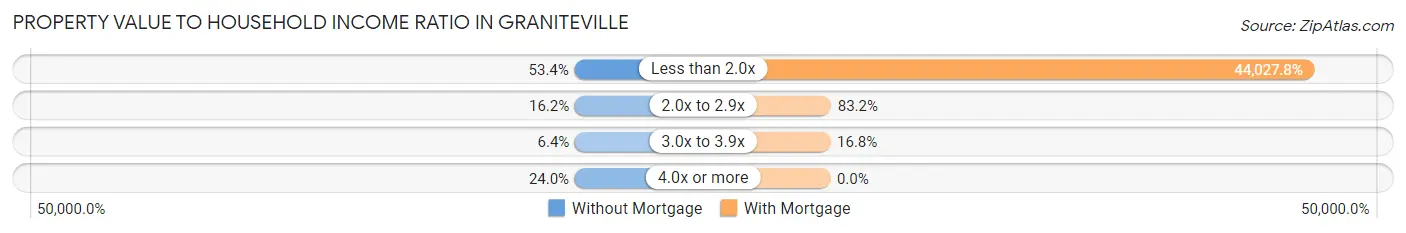
| Value-to-Income Ratio | Without Mortgage | With Mortgage |
| Less than 2.0x | 234 (53.4%) | 76,168 (44,027.7%) |
| 2.0x to 2.9x | 71 (16.2%) | 144 (83.2%) |
| 3.0x to 3.9x | 28 (6.4%) | 29 (16.8%) |
| 4.0x or more | 105 (24.0%) | 0 (0.0%) |
| Total | 438 (100.0%) | 173 (100.0%) |
Real Estate Taxes by Mortgage Status in Graniteville
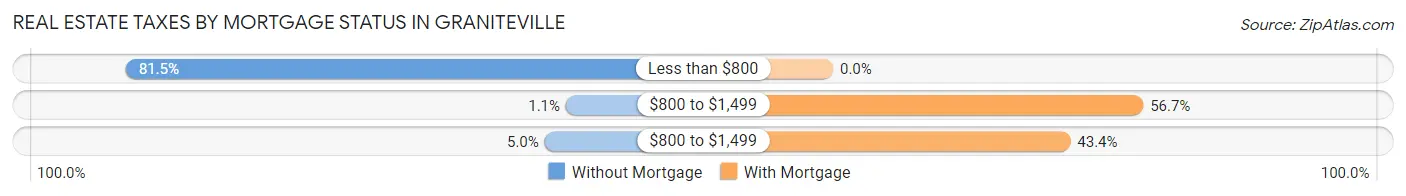
| Property Taxes | Without Mortgage | With Mortgage |
| Less than $800 | 357 (81.5%) | 0 (0.0%) |
| $800 to $1,499 | 5 (1.1%) | 98 (56.7%) |
| $800 to $1,499 | 22 (5.0%) | 75 (43.3%) |
| Total | 438 (100.0%) | 173 (100.0%) |
Health & Disability in Graniteville
Health Insurance Coverage by Age in Graniteville
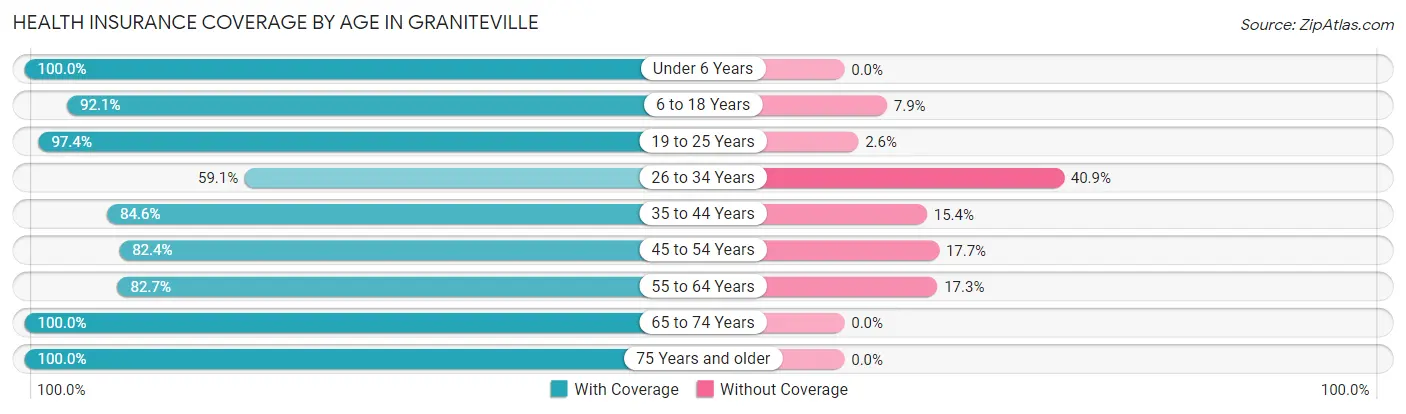
| Age Bracket | With Coverage | Without Coverage |
| Under 6 Years | 227 (100.0%) | 0 (0.0%) |
| 6 to 18 Years | 569 (92.1%) | 49 (7.9%) |
| 19 to 25 Years | 75 (97.4%) | 2 (2.6%) |
| 26 to 34 Years | 228 (59.1%) | 158 (40.9%) |
| 35 to 44 Years | 319 (84.6%) | 58 (15.4%) |
| 45 to 54 Years | 84 (82.4%) | 18 (17.6%) |
| 55 to 64 Years | 248 (82.7%) | 52 (17.3%) |
| 65 to 74 Years | 130 (100.0%) | 0 (0.0%) |
| 75 Years and older | 248 (100.0%) | 0 (0.0%) |
| Total | 2,128 (86.3%) | 337 (13.7%) |
Health Insurance Coverage by Citizenship Status in Graniteville
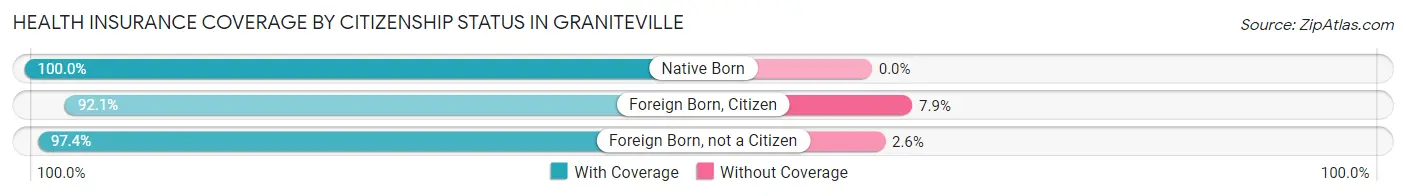
| Citizenship Status | With Coverage | Without Coverage |
| Native Born | 227 (100.0%) | 0 (0.0%) |
| Foreign Born, Citizen | 569 (92.1%) | 49 (7.9%) |
| Foreign Born, not a Citizen | 75 (97.4%) | 2 (2.6%) |
Health Insurance Coverage by Household Income in Graniteville
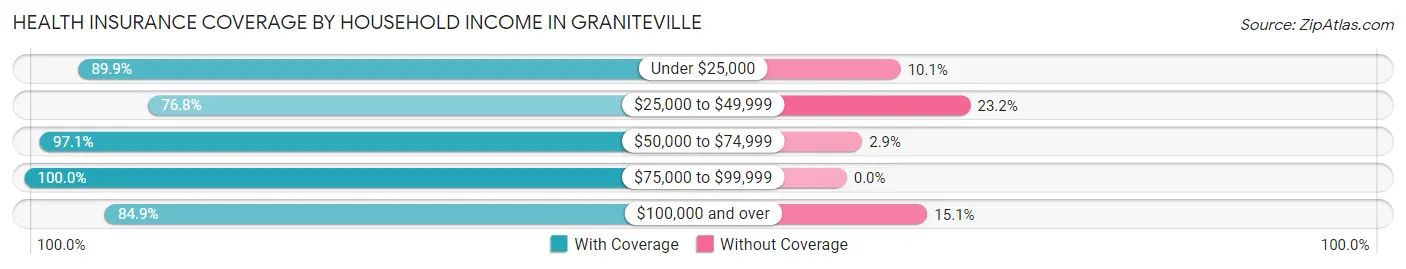
| Household Income | With Coverage | Without Coverage |
| Under $25,000 | 659 (89.9%) | 74 (10.1%) |
| $25,000 to $49,999 | 487 (76.8%) | 147 (23.2%) |
| $50,000 to $74,999 | 201 (97.1%) | 6 (2.9%) |
| $75,000 to $99,999 | 196 (100.0%) | 0 (0.0%) |
| $100,000 and over | 579 (84.9%) | 103 (15.1%) |
Public vs Private Health Insurance Coverage by Age in Graniteville
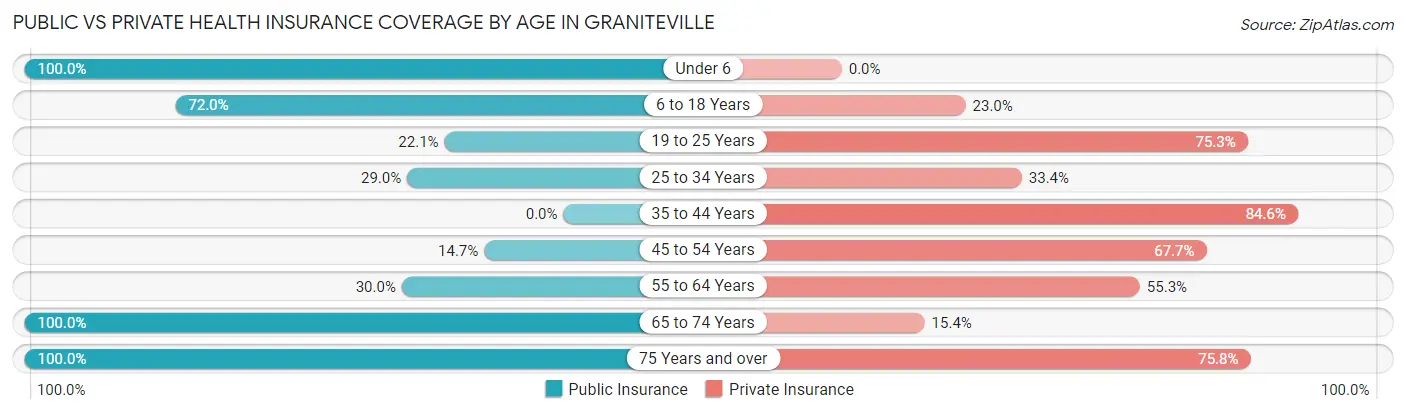
| Age Bracket | Public Insurance | Private Insurance |
| Under 6 | 227 (100.0%) | 0 (0.0%) |
| 6 to 18 Years | 445 (72.0%) | 142 (23.0%) |
| 19 to 25 Years | 17 (22.1%) | 58 (75.3%) |
| 25 to 34 Years | 112 (29.0%) | 129 (33.4%) |
| 35 to 44 Years | 0 (0.0%) | 319 (84.6%) |
| 45 to 54 Years | 15 (14.7%) | 69 (67.6%) |
| 55 to 64 Years | 90 (30.0%) | 166 (55.3%) |
| 65 to 74 Years | 130 (100.0%) | 20 (15.4%) |
| 75 Years and over | 248 (100.0%) | 188 (75.8%) |
| Total | 1,284 (52.1%) | 1,091 (44.3%) |
Disability Status by Sex by Age in Graniteville
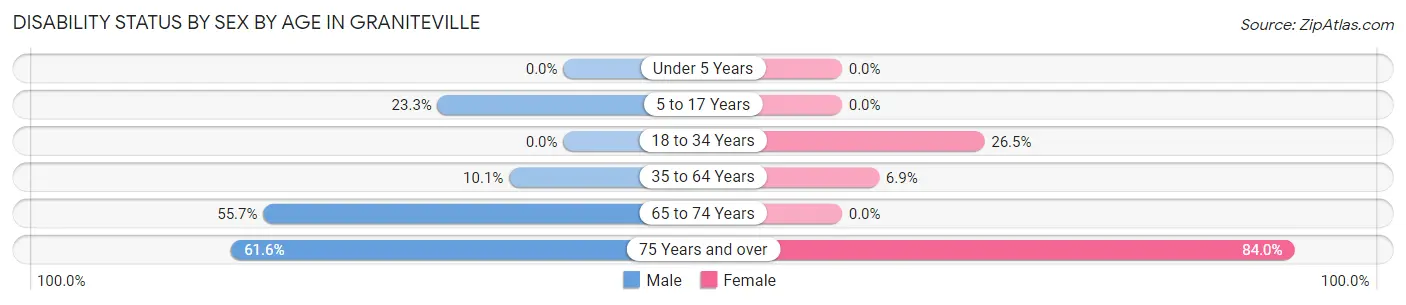
| Age Bracket | Male | Female |
| Under 5 Years | 0 (0.0%) | 0 (0.0%) |
| 5 to 17 Years | 70 (23.3%) | 0 (0.0%) |
| 18 to 34 Years | 0 (0.0%) | 64 (26.5%) |
| 35 to 64 Years | 36 (10.1%) | 29 (6.9%) |
| 65 to 74 Years | 44 (55.7%) | 0 (0.0%) |
| 75 Years and over | 45 (61.6%) | 147 (84.0%) |
Disability Class by Sex by Age in Graniteville
Disability Class: Hearing Difficulty
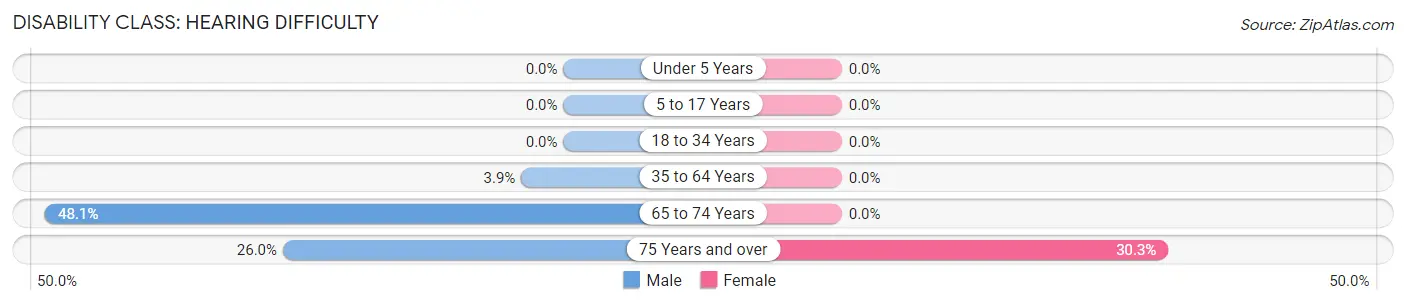
| Age Bracket | Male | Female |
| Under 5 Years | 0 (0.0%) | 0 (0.0%) |
| 5 to 17 Years | 0 (0.0%) | 0 (0.0%) |
| 18 to 34 Years | 0 (0.0%) | 0 (0.0%) |
| 35 to 64 Years | 14 (3.9%) | 0 (0.0%) |
| 65 to 74 Years | 38 (48.1%) | 0 (0.0%) |
| 75 Years and over | 19 (26.0%) | 53 (30.3%) |
Disability Class: Vision Difficulty
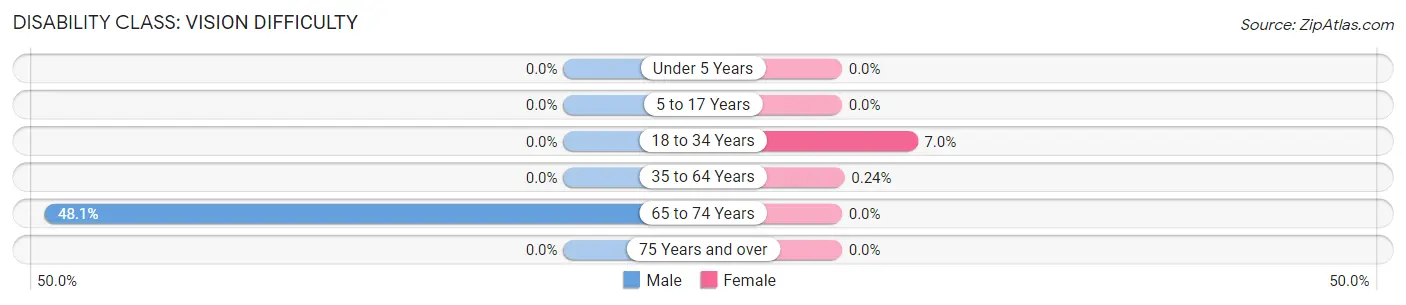
| Age Bracket | Male | Female |
| Under 5 Years | 0 (0.0%) | 0 (0.0%) |
| 5 to 17 Years | 0 (0.0%) | 0 (0.0%) |
| 18 to 34 Years | 0 (0.0%) | 17 (7.0%) |
| 35 to 64 Years | 0 (0.0%) | 1 (0.2%) |
| 65 to 74 Years | 38 (48.1%) | 0 (0.0%) |
| 75 Years and over | 0 (0.0%) | 0 (0.0%) |
Disability Class: Cognitive Difficulty
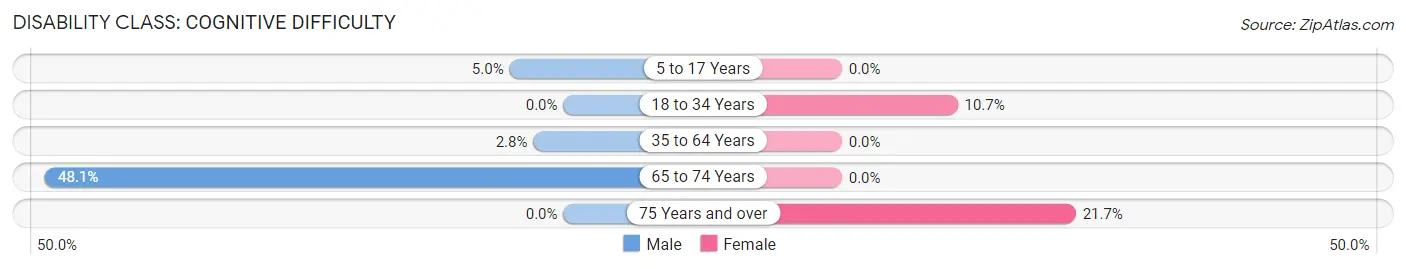
| Age Bracket | Male | Female |
| 5 to 17 Years | 15 (5.0%) | 0 (0.0%) |
| 18 to 34 Years | 0 (0.0%) | 26 (10.7%) |
| 35 to 64 Years | 10 (2.8%) | 0 (0.0%) |
| 65 to 74 Years | 38 (48.1%) | 0 (0.0%) |
| 75 Years and over | 0 (0.0%) | 38 (21.7%) |
Disability Class: Ambulatory Difficulty
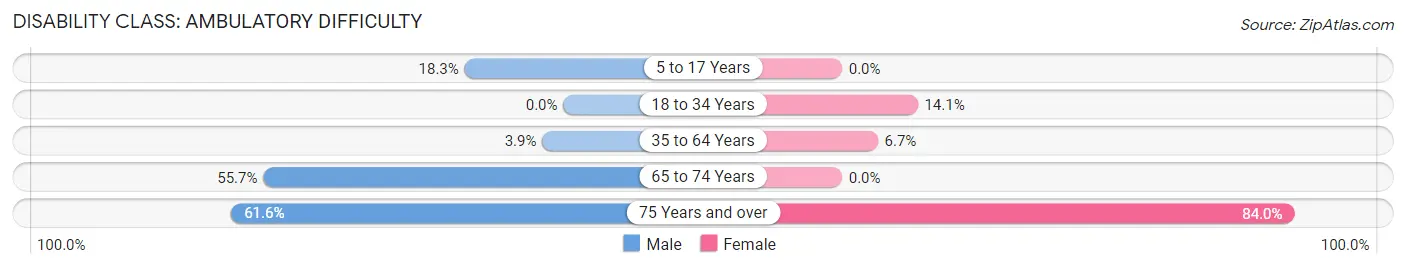
| Age Bracket | Male | Female |
| 5 to 17 Years | 55 (18.3%) | 0 (0.0%) |
| 18 to 34 Years | 0 (0.0%) | 34 (14.1%) |
| 35 to 64 Years | 14 (3.9%) | 28 (6.7%) |
| 65 to 74 Years | 44 (55.7%) | 0 (0.0%) |
| 75 Years and over | 45 (61.6%) | 147 (84.0%) |
Disability Class: Self-Care Difficulty
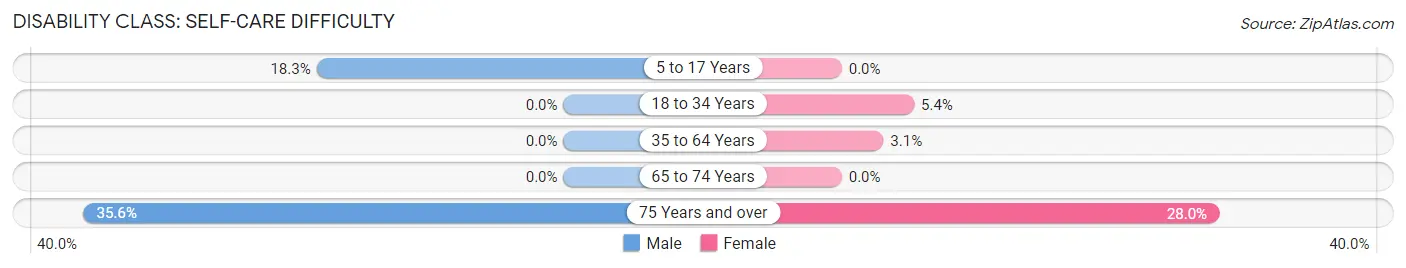
| Age Bracket | Male | Female |
| 5 to 17 Years | 55 (18.3%) | 0 (0.0%) |
| 18 to 34 Years | 0 (0.0%) | 13 (5.4%) |
| 35 to 64 Years | 0 (0.0%) | 13 (3.1%) |
| 65 to 74 Years | 0 (0.0%) | 0 (0.0%) |
| 75 Years and over | 26 (35.6%) | 49 (28.0%) |
Technology Access in Graniteville
Computing Device Access in Graniteville
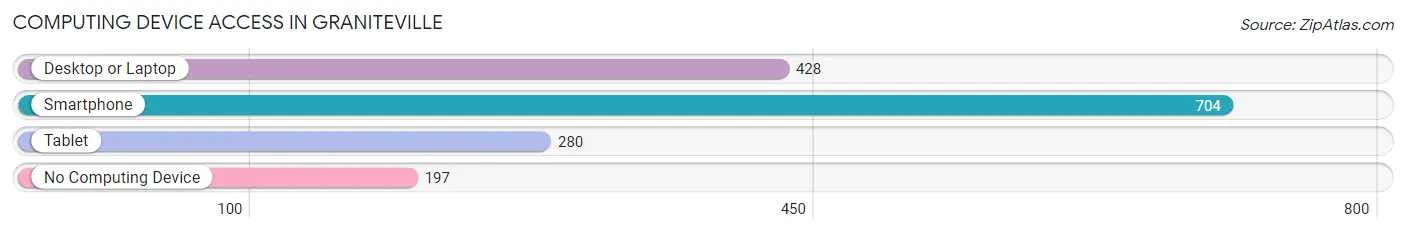
| Device Type | # Households | % Households |
| Desktop or Laptop | 428 | 44.9% |
| Smartphone | 704 | 73.8% |
| Tablet | 280 | 29.3% |
| No Computing Device | 197 | 20.6% |
| Total | 954 | 100.0% |
Internet Access in Graniteville
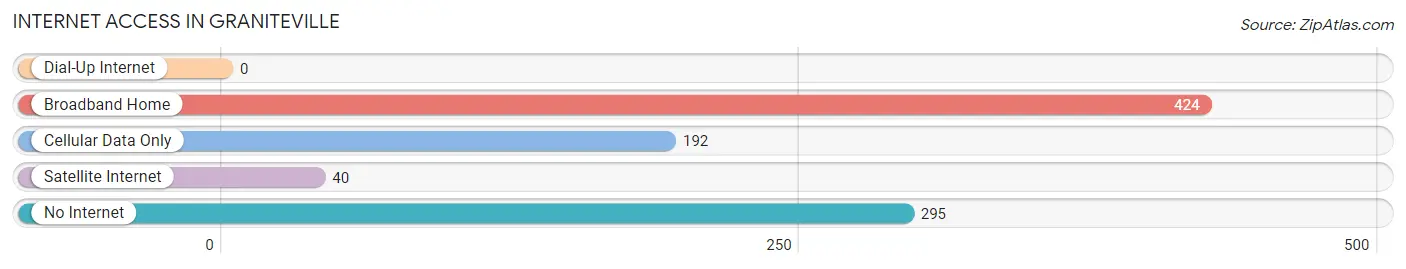
| Internet Type | # Households | % Households |
| Dial-Up Internet | 0 | 0.0% |
| Broadband Home | 424 | 44.4% |
| Cellular Data Only | 192 | 20.1% |
| Satellite Internet | 40 | 4.2% |
| No Internet | 295 | 30.9% |
| Total | 954 | 100.0% |
Graniteville Summary
Graniteville, South Carolina is a small town located in Aiken County, South Carolina. It is situated along the Savannah River, approximately 20 miles east of Augusta, Georgia. The town was founded in 1845 and is named after the granite deposits found in the area. Graniteville is home to approximately 5,000 people and is part of the Augusta-Aiken Metropolitan Statistical Area.
Geography
Graniteville is located in the Piedmont region of South Carolina, which is characterized by rolling hills and flat plains. The town is situated along the Savannah River, which forms the border between South Carolina and Georgia. The town is located in the Aiken County, which is part of the Central Savannah River Area (CSRA). The town is located approximately 20 miles east of Augusta, Georgia and is part of the Augusta-Aiken Metropolitan Statistical Area.
The climate in Graniteville is humid subtropical, with hot, humid summers and mild winters. The average annual temperature is around 64°F (18°C). The average annual precipitation is around 48 inches (122 cm).
Economy
Graniteville’s economy is largely based on manufacturing. The town is home to several large manufacturing companies, including the Graniteville Company, which produces textiles and other products. Other major employers in the area include the Savannah River Site, a nuclear power plant, and the Savannah River National Laboratory.
Graniteville is also home to several small businesses, including restaurants, retail stores, and other services. The town is also home to several educational institutions, including Aiken Technical College and the University of South Carolina Aiken.
Demographics
As of the 2010 census, Graniteville had a population of 5,052. The racial makeup of the town was 79.3% White, 16.2% African American, 0.3% Native American, 0.7% Asian, 0.1% Pacific Islander, 1.2% from other races, and 2.4% from two or more races. Hispanic or Latino of any race were 3.2% of the population.
The median income for a household in Graniteville was $37,917, and the median income for a family was $45,938. The per capita income for the town was $19,945. About 11.2% of families and 14.2% of the population were below the poverty line, including 19.2% of those under age 18 and 8.2% of those age 65 or over.
Conclusion
Graniteville, South Carolina is a small town located in Aiken County, South Carolina. It is situated along the Savannah River, approximately 20 miles east of Augusta, Georgia. The town was founded in 1845 and is named after the granite deposits found in the area. Graniteville is home to approximately 5,000 people and is part of the Augusta-Aiken Metropolitan Statistical Area. The town’s economy is largely based on manufacturing, and it is home to several large employers, including the Graniteville Company and the Savannah River Site. The town’s population is largely white, with a small African American population. The median income for a household in Graniteville is $37,917, and the median income for a family is $45,938.
Common Questions
What is Per Capita Income in Graniteville?
Per Capita income in Graniteville is $19,708.
What is the Median Family Income in Graniteville?
Median Family Income in Graniteville is $45,000.
What is the Median Household income in Graniteville?
Median Household Income in Graniteville is $32,339.
What is Income or Wage Gap in Graniteville?
Income or Wage Gap in Graniteville is 65.3%.
Women in Graniteville earn 34.7 cents for every dollar earned by a man.
What is Inequality or Gini Index in Graniteville?
Inequality or Gini Index in Graniteville is 0.50.
What is the Total Population of Graniteville?
Total Population of Graniteville is 2,465.
What is the Total Male Population of Graniteville?
Total Male Population of Graniteville is 1,155.
What is the Total Female Population of Graniteville?
Total Female Population of Graniteville is 1,310.
What is the Ratio of Males per 100 Females in Graniteville?
There are 88.17 Males per 100 Females in Graniteville.
What is the Ratio of Females per 100 Males in Graniteville?
There are 113.42 Females per 100 Males in Graniteville.
What is the Median Population Age in Graniteville?
Median Population Age in Graniteville is 33.4 Years.
What is the Average Family Size in Graniteville
Average Family Size in Graniteville is 3.5 People.
What is the Average Household Size in Graniteville
Average Household Size in Graniteville is 2.6 People.
How Large is the Labor Force in Graniteville?
There are 905 People in the Labor Forcein in Graniteville.
What is the Percentage of People in the Labor Force in Graniteville?
54.2% of People are in the Labor Force in Graniteville.
What is the Unemployment Rate in Graniteville?
Unemployment Rate in Graniteville is 6.9%.