Kershaw, SC Map & Demographics
Kershaw Map
Kershaw Overview
$29,054
PER CAPITA INCOME
$69,293
AVG FAMILY INCOME
$55,481
AVG HOUSEHOLD INCOME
25.2%
WAGE / INCOME GAP [ % ]
74.8¢/ $1
WAGE / INCOME GAP [ $ ]
0.48
INEQUALITY / GINI INDEX
2,311
TOTAL POPULATION
1,050
MALE POPULATION
1,261
FEMALE POPULATION
83.27
MALES / 100 FEMALES
120.10
FEMALES / 100 MALES
31.9
MEDIAN AGE
3.3
AVG FAMILY SIZE
2.8
AVG HOUSEHOLD SIZE
1,002
LABOR FORCE [ PEOPLE ]
62.8%
PERCENT IN LABOR FORCE
2.8%
UNEMPLOYMENT RATE
Kershaw Zip Codes
Kershaw Area Codes
Income in Kershaw
Income Overview in Kershaw
Per Capita Income in Kershaw is $29,054, while median incomes of families and households are $69,293 and $55,481 respectively.
| Characteristic | Number | Measure |
| Per Capita Income | 2,311 | $29,054 |
| Median Family Income | 603 | $69,293 |
| Mean Family Income | 603 | $90,512 |
| Median Household Income | 834 | $55,481 |
| Mean Household Income | 834 | $76,423 |
| Income Deficit | 603 | $0 |
| Wage / Income Gap (%) | 2,311 | 25.23% |
| Wage / Income Gap ($) | 2,311 | 74.77¢ per $1 |
| Gini / Inequality Index | 2,311 | 0.48 |
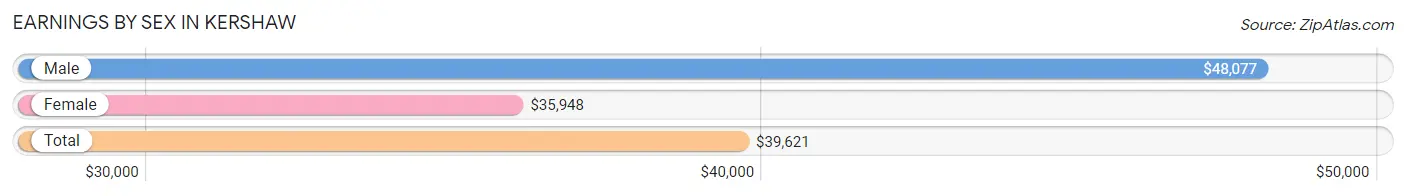
Earnings by Sex in Kershaw
Average Earnings in Kershaw are $39,621, $48,077 for men and $35,948 for women, a difference of 25.2%.
| Sex | Number | Average Earnings |
| Male | 534 (52.8%) | $48,077 |
| Female | 478 (47.2%) | $35,948 |
| Total | 1,012 (100.0%) | $39,621 |
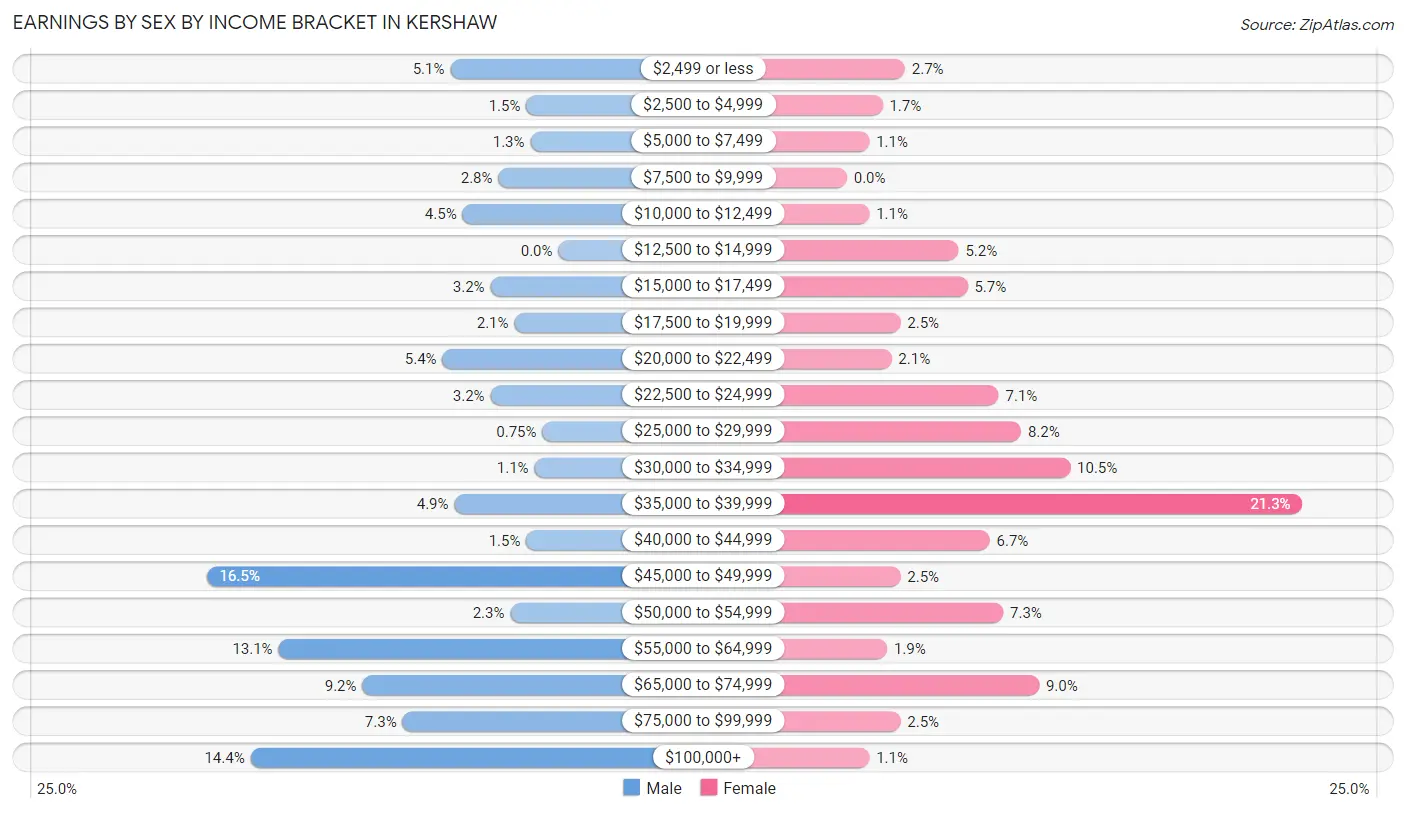
Earnings by Sex by Income Bracket in Kershaw
The most common earnings brackets in Kershaw are $45,000 to $49,999 for men (88 | 16.5%) and $35,000 to $39,999 for women (102 | 21.3%).
| Income | Male | Female |
| $2,499 or less | 27 (5.1%) | 13 (2.7%) |
| $2,500 to $4,999 | 8 (1.5%) | 8 (1.7%) |
| $5,000 to $7,499 | 7 (1.3%) | 5 (1.1%) |
| $7,500 to $9,999 | 15 (2.8%) | 0 (0.0%) |
| $10,000 to $12,499 | 24 (4.5%) | 5 (1.1%) |
| $12,500 to $14,999 | 0 (0.0%) | 25 (5.2%) |
| $15,000 to $17,499 | 17 (3.2%) | 27 (5.7%) |
| $17,500 to $19,999 | 11 (2.1%) | 12 (2.5%) |
| $20,000 to $22,499 | 29 (5.4%) | 10 (2.1%) |
| $22,500 to $24,999 | 17 (3.2%) | 34 (7.1%) |
| $25,000 to $29,999 | 4 (0.7%) | 39 (8.2%) |
| $30,000 to $34,999 | 6 (1.1%) | 50 (10.5%) |
| $35,000 to $39,999 | 26 (4.9%) | 102 (21.3%) |
| $40,000 to $44,999 | 8 (1.5%) | 32 (6.7%) |
| $45,000 to $49,999 | 88 (16.5%) | 12 (2.5%) |
| $50,000 to $54,999 | 12 (2.2%) | 35 (7.3%) |
| $55,000 to $64,999 | 70 (13.1%) | 9 (1.9%) |
| $65,000 to $74,999 | 49 (9.2%) | 43 (9.0%) |
| $75,000 to $99,999 | 39 (7.3%) | 12 (2.5%) |
| $100,000+ | 77 (14.4%) | 5 (1.1%) |
| Total | 534 (100.0%) | 478 (100.0%) |
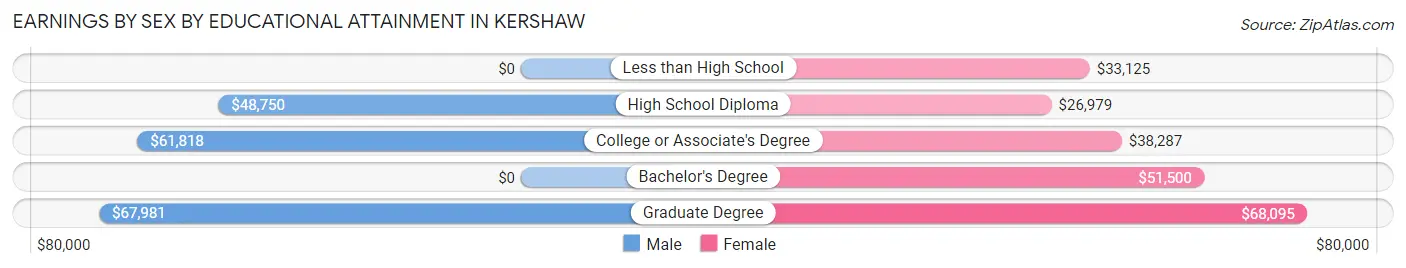
Earnings by Sex by Educational Attainment in Kershaw
Average earnings in Kershaw are $50,875 for men and $37,962 for women, a difference of 25.4%. Men with an educational attainment of graduate degree enjoy the highest average annual earnings of $67,981, while those with high school diploma education earn the least with $48,750. Women with an educational attainment of graduate degree earn the most with the average annual earnings of $68,095, while those with high school diploma education have the smallest earnings of $26,979.
| Educational Attainment | Male Income | Female Income |
| Less than High School | - | - |
| High School Diploma | $48,750 | $26,979 |
| College or Associate's Degree | $61,818 | $38,287 |
| Bachelor's Degree | - | - |
| Graduate Degree | $67,981 | $68,095 |
| Total | $50,875 | $37,962 |
Family Income in Kershaw
Family Income Brackets in Kershaw
According to the Kershaw family income data, there are 128 families falling into the $50,000 to $74,999 income range, which is the most common income bracket and makes up 21.2% of all families. Conversely, the $10,000 to $14,999 income bracket is the least frequent group with only 2 families (0.3%) belonging to this category.
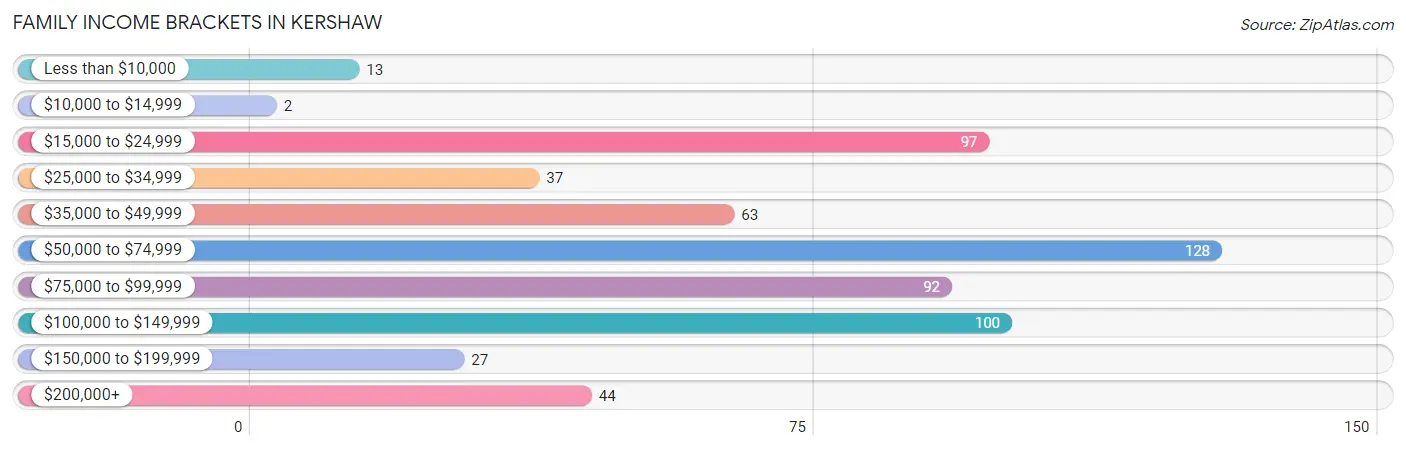
| Income Bracket | # Families | % Families |
| Less than $10,000 | 13 | 2.2% |
| $10,000 to $14,999 | 2 | 0.3% |
| $15,000 to $24,999 | 97 | 16.1% |
| $25,000 to $34,999 | 37 | 6.1% |
| $35,000 to $49,999 | 63 | 10.4% |
| $50,000 to $74,999 | 128 | 21.2% |
| $75,000 to $99,999 | 92 | 15.3% |
| $100,000 to $149,999 | 100 | 16.6% |
| $150,000 to $199,999 | 27 | 4.5% |
| $200,000+ | 44 | 7.3% |
Family Income by Famaliy Size in Kershaw
6-person families (9 | 1.5%) account for the highest median family income in Kershaw with $110,750 per family, while 2-person families (259 | 42.9%) have the highest median income of $32,118 per family member.
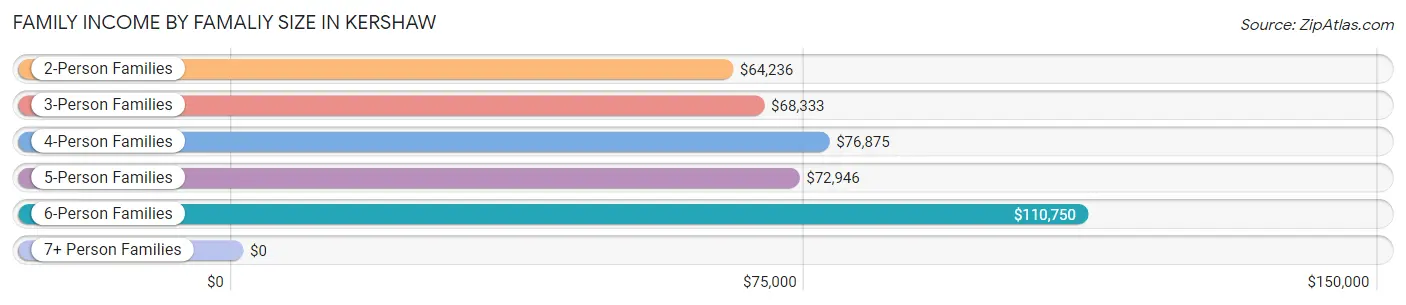
| Income Bracket | # Families | Median Income |
| 2-Person Families | 259 (42.9%) | $64,236 |
| 3-Person Families | 208 (34.5%) | $68,333 |
| 4-Person Families | 76 (12.6%) | $76,875 |
| 5-Person Families | 51 (8.5%) | $72,946 |
| 6-Person Families | 9 (1.5%) | $110,750 |
| 7+ Person Families | 0 (0.0%) | $0 |
| Total | 603 (100.0%) | $69,293 |
Family Income by Number of Earners in Kershaw
The median family income in Kershaw is $69,293, with families comprising 3+ earners (43) having the highest median family income of $136,691, while families with no earners (87) have the lowest median family income of $32,250, accounting for 7.1% and 14.4% of families, respectively.
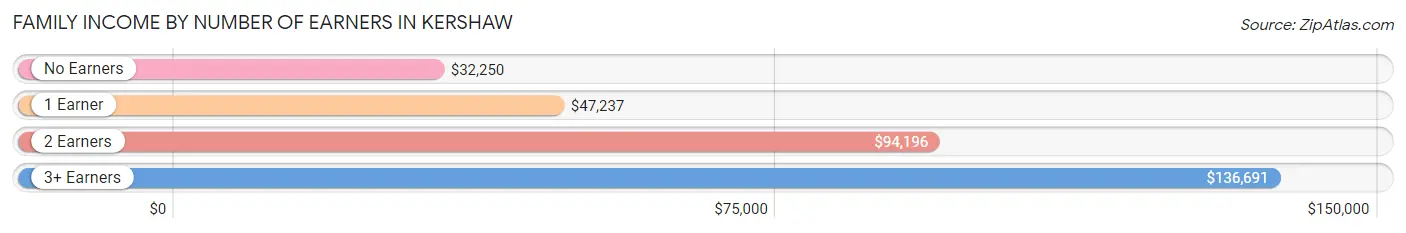
| Number of Earners | # Families | Median Income |
| No Earners | 87 (14.4%) | $32,250 |
| 1 Earner | 258 (42.8%) | $47,237 |
| 2 Earners | 215 (35.7%) | $94,196 |
| 3+ Earners | 43 (7.1%) | $136,691 |
| Total | 603 (100.0%) | $69,293 |
Household Income in Kershaw
Household Income Brackets in Kershaw
With 154 households falling in the category, the $50,000 to $74,999 income range is the most frequent in Kershaw, accounting for 18.5% of all households. In contrast, only 30 households (3.6%) fall into the $150,000 to $199,999 income bracket, making it the least populous group.
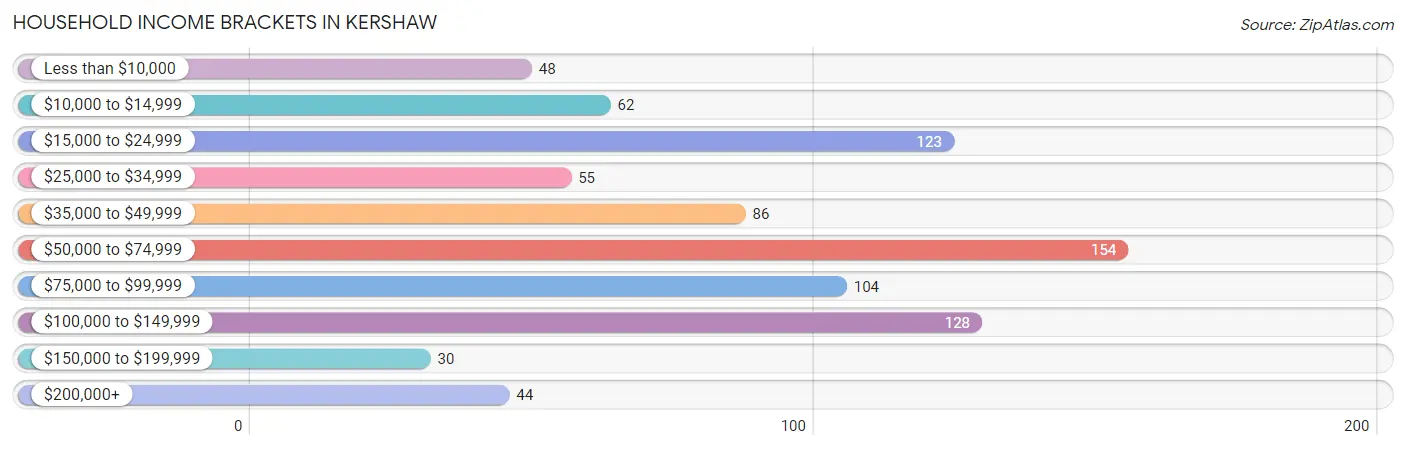
| Income Bracket | # Households | % Households |
| Less than $10,000 | 48 | 5.8% |
| $10,000 to $14,999 | 62 | 7.4% |
| $15,000 to $24,999 | 123 | 14.7% |
| $25,000 to $34,999 | 55 | 6.6% |
| $35,000 to $49,999 | 86 | 10.3% |
| $50,000 to $74,999 | 154 | 18.5% |
| $75,000 to $99,999 | 104 | 12.5% |
| $100,000 to $149,999 | 128 | 15.3% |
| $150,000 to $199,999 | 30 | 3.6% |
| $200,000+ | 44 | 5.3% |
Household Income by Householder Age in Kershaw
The median household income in Kershaw is $55,481, with the highest median household income of $73,661 found in the 45 to 64 years age bracket for the primary householder. A total of 253 households (30.3%) fall into this category. Meanwhile, the 15 to 24 years age bracket for the primary householder has the lowest median household income of $0, with 31 households (3.7%) in this group.
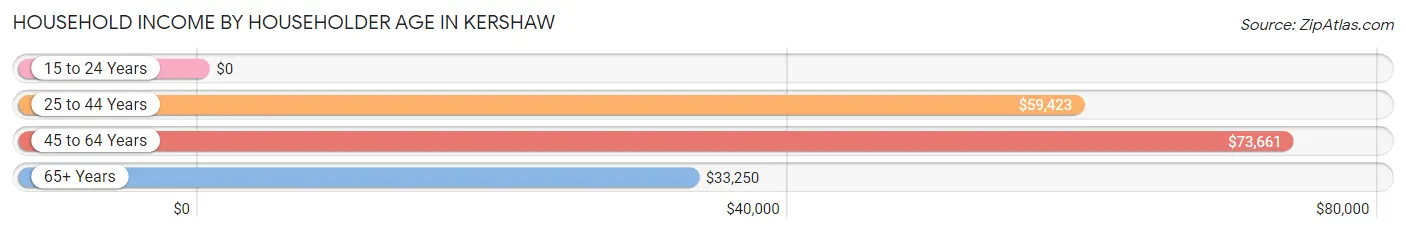
| Income Bracket | # Households | Median Income |
| 15 to 24 Years | 31 (3.7%) | $0 |
| 25 to 44 Years | 302 (36.2%) | $59,423 |
| 45 to 64 Years | 253 (30.3%) | $73,661 |
| 65+ Years | 248 (29.7%) | $33,250 |
| Total | 834 (100.0%) | $55,481 |
Poverty in Kershaw
Income Below Poverty by Sex and Age in Kershaw
With 11.7% poverty level for males and 21.2% for females among the residents of Kershaw, 6 to 11 year old males and 6 to 11 year old females are the most vulnerable to poverty, with 31 males (47.0%) and 58 females (46.8%) in their respective age groups living below the poverty level.
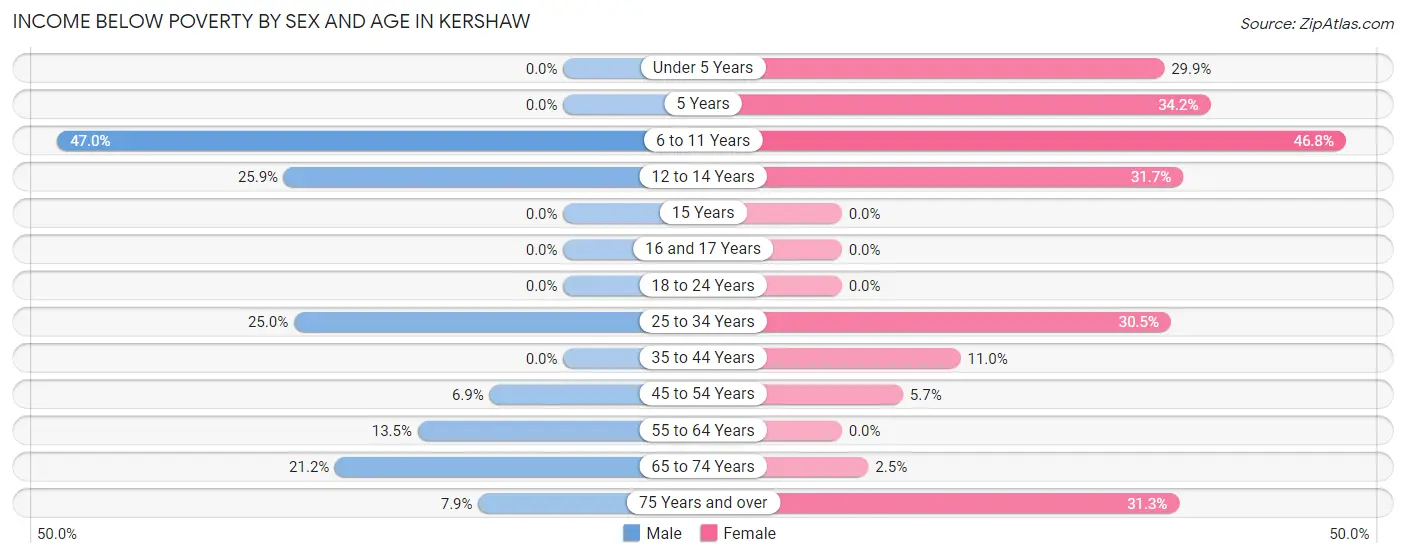
| Age Bracket | Male | Female |
| Under 5 Years | 0 (0.0%) | 38 (29.9%) |
| 5 Years | 0 (0.0%) | 40 (34.2%) |
| 6 to 11 Years | 31 (47.0%) | 58 (46.8%) |
| 12 to 14 Years | 14 (25.9%) | 19 (31.7%) |
| 15 Years | 0 (0.0%) | 0 (0.0%) |
| 16 and 17 Years | 0 (0.0%) | 0 (0.0%) |
| 18 to 24 Years | 0 (0.0%) | 0 (0.0%) |
| 25 to 34 Years | 26 (25.0%) | 58 (30.5%) |
| 35 to 44 Years | 0 (0.0%) | 13 (11.0%) |
| 45 to 54 Years | 10 (6.9%) | 8 (5.7%) |
| 55 to 64 Years | 15 (13.5%) | 0 (0.0%) |
| 65 to 74 Years | 18 (21.2%) | 2 (2.5%) |
| 75 Years and over | 6 (7.9%) | 31 (31.3%) |
| Total | 120 (11.7%) | 267 (21.2%) |
Income Above Poverty by Sex and Age in Kershaw
According to the poverty statistics in Kershaw, males aged under 5 years and females aged 15 years are the age groups that are most secure financially, with 100.0% of males and 100.0% of females in these age groups living above the poverty line.
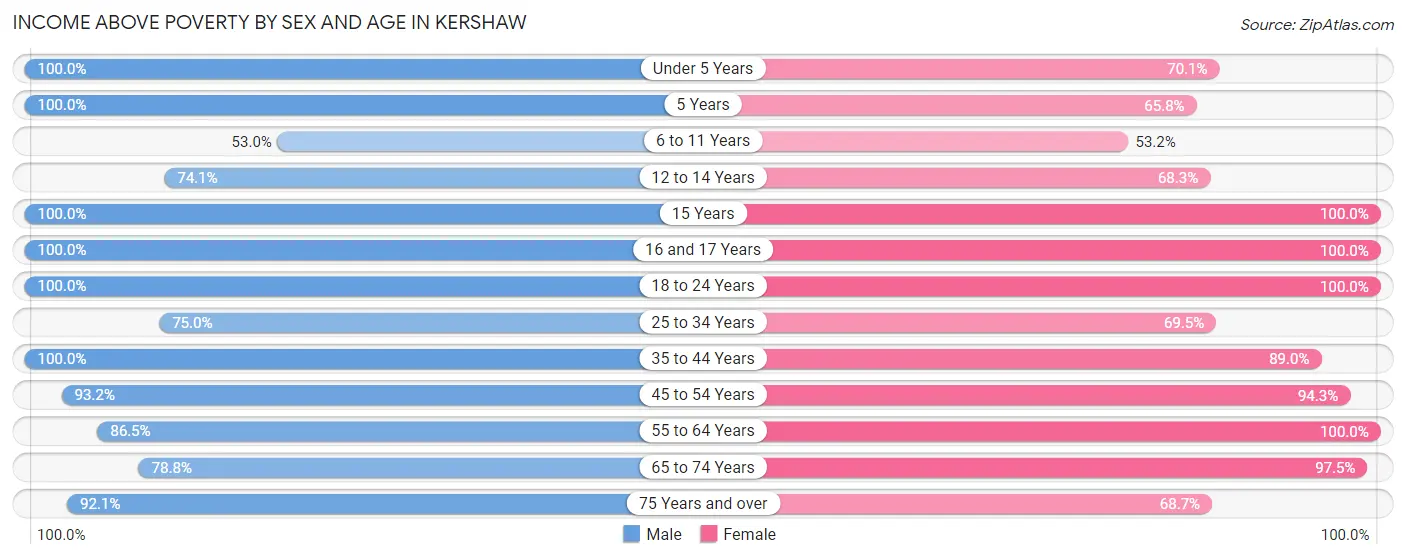
| Age Bracket | Male | Female |
| Under 5 Years | 109 (100.0%) | 89 (70.1%) |
| 5 Years | 9 (100.0%) | 77 (65.8%) |
| 6 to 11 Years | 35 (53.0%) | 66 (53.2%) |
| 12 to 14 Years | 40 (74.1%) | 41 (68.3%) |
| 15 Years | 3 (100.0%) | 18 (100.0%) |
| 16 and 17 Years | 30 (100.0%) | 20 (100.0%) |
| 18 to 24 Years | 94 (100.0%) | 76 (100.0%) |
| 25 to 34 Years | 78 (75.0%) | 132 (69.5%) |
| 35 to 44 Years | 134 (100.0%) | 105 (89.0%) |
| 45 to 54 Years | 136 (93.1%) | 133 (94.3%) |
| 55 to 64 Years | 96 (86.5%) | 90 (100.0%) |
| 65 to 74 Years | 67 (78.8%) | 79 (97.5%) |
| 75 Years and over | 70 (92.1%) | 68 (68.7%) |
| Total | 901 (88.2%) | 994 (78.8%) |
Income Below Poverty Among Married-Couple Families in Kershaw
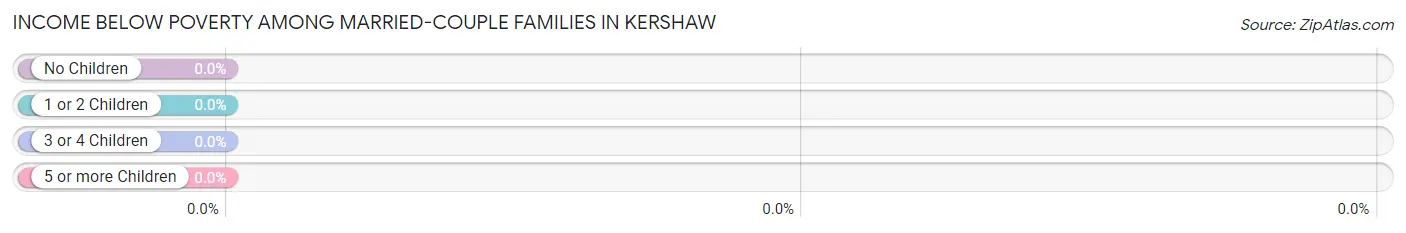
| Children | Above Poverty | Below Poverty |
| No Children | 254 (100.0%) | 0 (0.0%) |
| 1 or 2 Children | 108 (100.0%) | 0 (0.0%) |
| 3 or 4 Children | 22 (100.0%) | 0 (0.0%) |
| 5 or more Children | 0 (0.0%) | 0 (0.0%) |
| Total | 384 (100.0%) | 0 (0.0%) |
Income Below Poverty Among Single-Parent Households in Kershaw
According to the poverty data in Kershaw, 38.8% or 26 single-father households and 44.7% or 68 single-mother households are living below the poverty line. Among single-father households, those with 1 or 2 children have the highest poverty rate, with 26 households (54.2%) experiencing poverty. Likewise, among single-mother households, those with 3 or 4 children have the highest poverty rate, with 20 households (83.3%) falling below the poverty line.
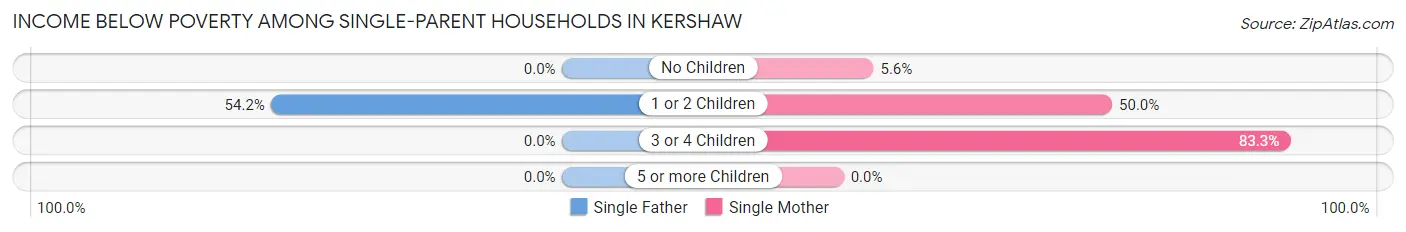
| Children | Single Father | Single Mother |
| No Children | 0 (0.0%) | 2 (5.6%) |
| 1 or 2 Children | 26 (54.2%) | 46 (50.0%) |
| 3 or 4 Children | 0 (0.0%) | 20 (83.3%) |
| 5 or more Children | 0 (0.0%) | 0 (0.0%) |
| Total | 26 (38.8%) | 68 (44.7%) |
Income Below Poverty Among Married-Couple vs Single-Parent Households in Kershaw
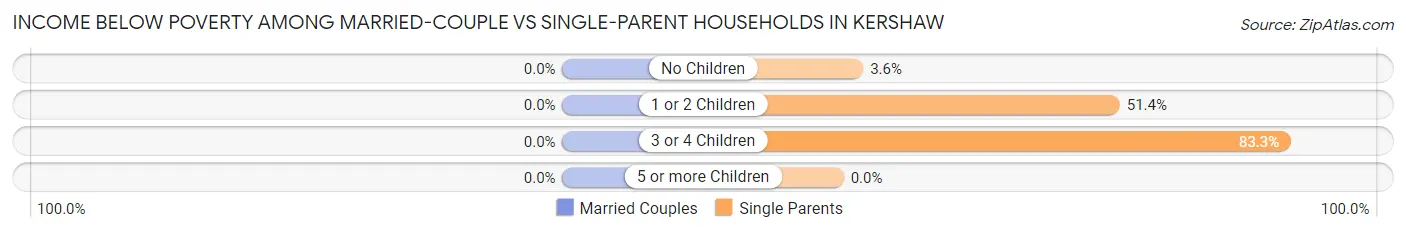
| Children | Married-Couple Families | Single-Parent Households |
| No Children | 0 (0.0%) | 2 (3.6%) |
| 1 or 2 Children | 0 (0.0%) | 72 (51.4%) |
| 3 or 4 Children | 0 (0.0%) | 20 (83.3%) |
| 5 or more Children | 0 (0.0%) | 0 (0.0%) |
| Total | 0 (0.0%) | 94 (42.9%) |
Race in Kershaw
The most populous races in Kershaw are White / Caucasian (1,395 | 60.4%), Black / African American (548 | 23.7%), and Two or more Races (347 | 15.0%).
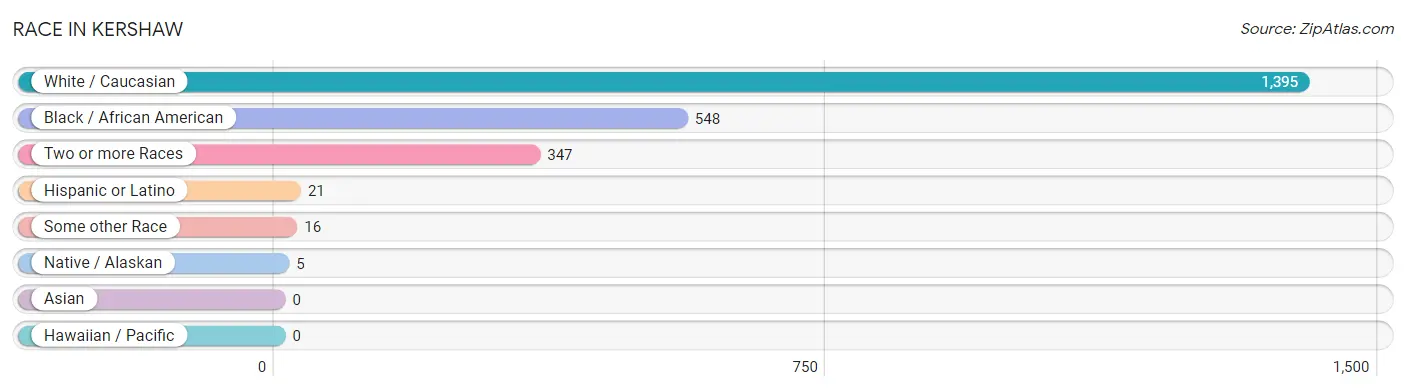
| Race | # Population | % Population |
| Asian | 0 | 0.0% |
| Black / African American | 548 | 23.7% |
| Hawaiian / Pacific | 0 | 0.0% |
| Hispanic or Latino | 21 | 0.9% |
| Native / Alaskan | 5 | 0.2% |
| White / Caucasian | 1,395 | 60.4% |
| Two or more Races | 347 | 15.0% |
| Some other Race | 16 | 0.7% |
| Total | 2,311 | 100.0% |
Ancestry in Kershaw
The most populous ancestries reported in Kershaw are American (379 | 16.4%), Irish (229 | 9.9%), English (193 | 8.4%), German (88 | 3.8%), and Scotch-Irish (75 | 3.3%), together accounting for 41.7% of all Kershaw residents.
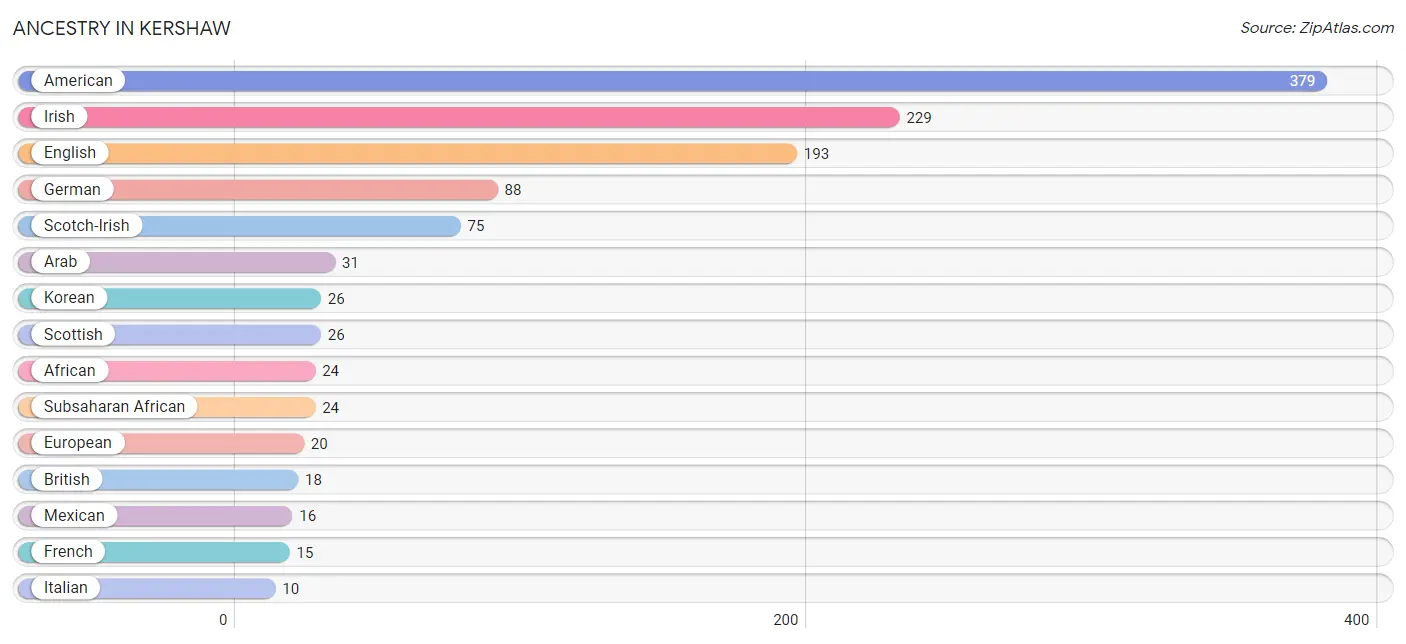
| Ancestry | # Population | % Population |
| African | 24 | 1.0% |
| American | 379 | 16.4% |
| Arab | 31 | 1.3% |
| Arapaho | 1 | 0.0% |
| Argentinean | 5 | 0.2% |
| British | 18 | 0.8% |
| Cherokee | 5 | 0.2% |
| Cheyenne | 1 | 0.0% |
| Dutch | 6 | 0.3% |
| English | 193 | 8.4% |
| European | 20 | 0.9% |
| French | 15 | 0.6% |
| German | 88 | 3.8% |
| Irish | 229 | 9.9% |
| Italian | 10 | 0.4% |
| Korean | 26 | 1.1% |
| Mexican | 16 | 0.7% |
| Scandinavian | 3 | 0.1% |
| Scotch-Irish | 75 | 3.3% |
| Scottish | 26 | 1.1% |
| South American | 5 | 0.2% |
| Subsaharan African | 24 | 1.0% |
| Welsh | 5 | 0.2% | View All 23 Rows |
Immigrants in Kershaw
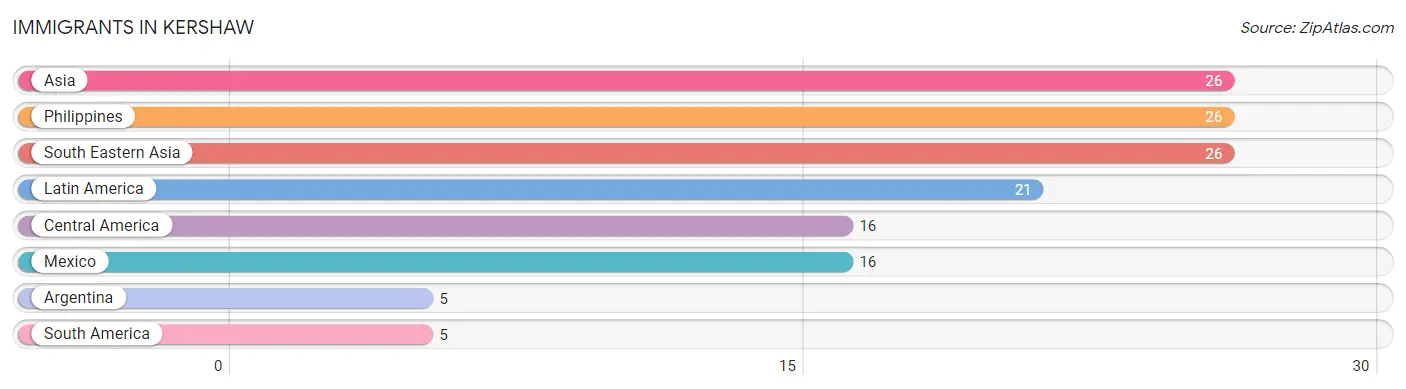
The most numerous immigrant groups reported in Kershaw came from Asia (26 | 1.1%), Philippines (26 | 1.1%), South Eastern Asia (26 | 1.1%), Latin America (21 | 0.9%), and Central America (16 | 0.7%), together accounting for 5.0% of all Kershaw residents.
| Immigration Origin | # Population | % Population |
| Argentina | 5 | 0.2% |
| Asia | 26 | 1.1% |
| Central America | 16 | 0.7% |
| Latin America | 21 | 0.9% |
| Mexico | 16 | 0.7% |
| Philippines | 26 | 1.1% |
| South America | 5 | 0.2% |
| South Eastern Asia | 26 | 1.1% | View All 8 Rows |
Sex and Age in Kershaw
Sex and Age in Kershaw
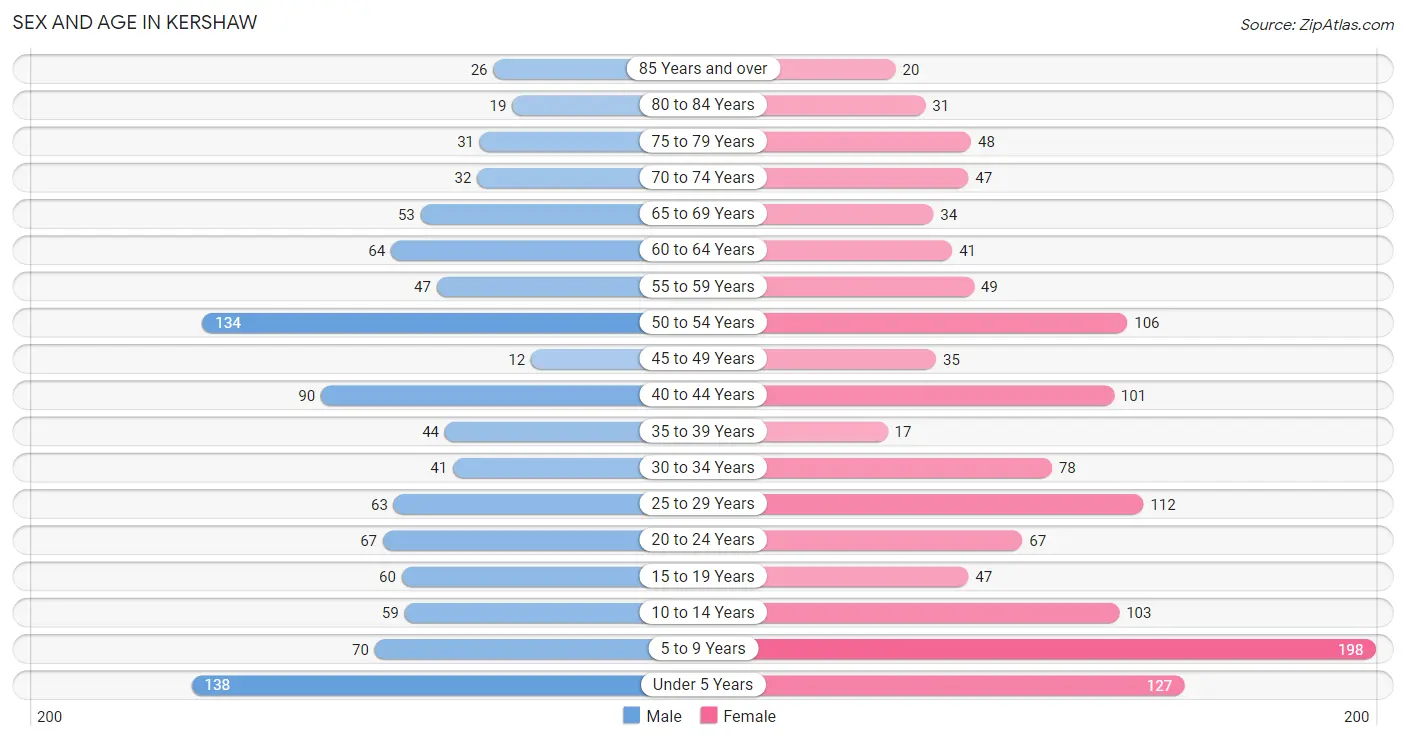
The most populous age groups in Kershaw are Under 5 Years (138 | 13.1%) for men and 5 to 9 Years (198 | 15.7%) for women.
| Age Bracket | Male | Female |
| Under 5 Years | 138 (13.1%) | 127 (10.1%) |
| 5 to 9 Years | 70 (6.7%) | 198 (15.7%) |
| 10 to 14 Years | 59 (5.6%) | 103 (8.2%) |
| 15 to 19 Years | 60 (5.7%) | 47 (3.7%) |
| 20 to 24 Years | 67 (6.4%) | 67 (5.3%) |
| 25 to 29 Years | 63 (6.0%) | 112 (8.9%) |
| 30 to 34 Years | 41 (3.9%) | 78 (6.2%) |
| 35 to 39 Years | 44 (4.2%) | 17 (1.3%) |
| 40 to 44 Years | 90 (8.6%) | 101 (8.0%) |
| 45 to 49 Years | 12 (1.1%) | 35 (2.8%) |
| 50 to 54 Years | 134 (12.8%) | 106 (8.4%) |
| 55 to 59 Years | 47 (4.5%) | 49 (3.9%) |
| 60 to 64 Years | 64 (6.1%) | 41 (3.3%) |
| 65 to 69 Years | 53 (5.1%) | 34 (2.7%) |
| 70 to 74 Years | 32 (3.0%) | 47 (3.7%) |
| 75 to 79 Years | 31 (2.9%) | 48 (3.8%) |
| 80 to 84 Years | 19 (1.8%) | 31 (2.5%) |
| 85 Years and over | 26 (2.5%) | 20 (1.6%) |
| Total | 1,050 (100.0%) | 1,261 (100.0%) |
Families and Households in Kershaw
Median Family Size in Kershaw
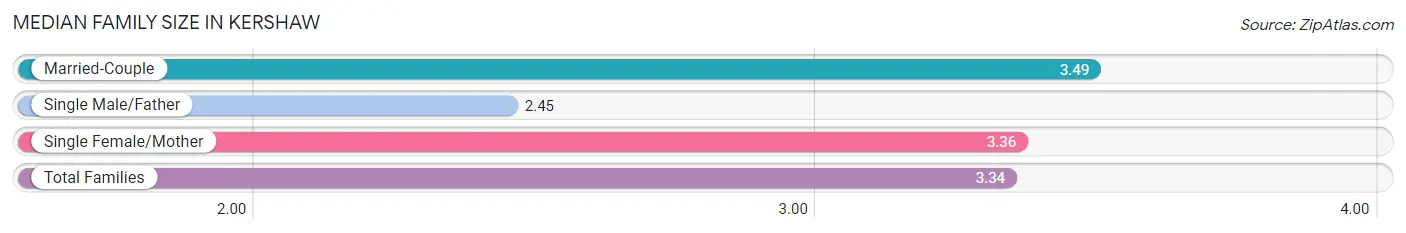
The median family size in Kershaw is 3.34 persons per family, with married-couple families (384 | 63.7%) accounting for the largest median family size of 3.49 persons per family. On the other hand, single male/father families (67 | 11.1%) represent the smallest median family size with 2.45 persons per family.
| Family Type | # Families | Family Size |
| Married-Couple | 384 (63.7%) | 3.49 |
| Single Male/Father | 67 (11.1%) | 2.45 |
| Single Female/Mother | 152 (25.2%) | 3.36 |
| Total Families | 603 (100.0%) | 3.34 |
Median Household Size in Kershaw
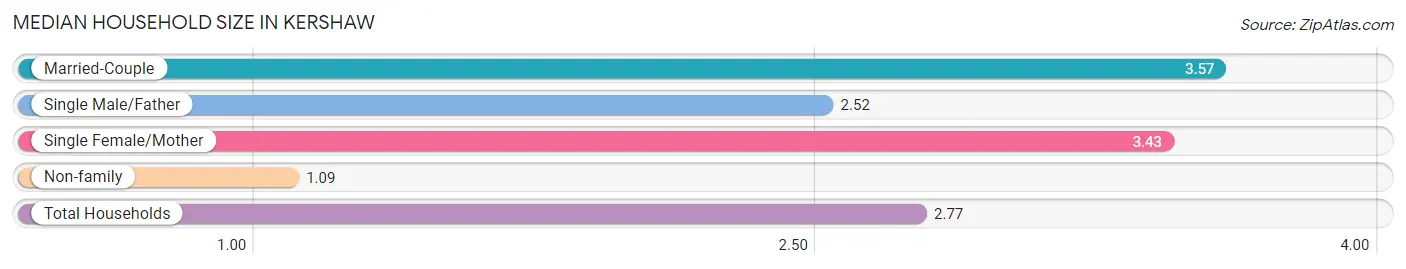
The median household size in Kershaw is 2.77 persons per household, with married-couple households (384 | 46.0%) accounting for the largest median household size of 3.57 persons per household. non-family households (231 | 27.7%) represent the smallest median household size with 1.09 persons per household.
| Household Type | # Households | Household Size |
| Married-Couple | 384 (46.0%) | 3.57 |
| Single Male/Father | 67 (8.0%) | 2.52 |
| Single Female/Mother | 152 (18.2%) | 3.43 |
| Non-family | 231 (27.7%) | 1.09 |
| Total Households | 834 (100.0%) | 2.77 |
Household Size by Marriage Status in Kershaw
Out of a total of 834 households in Kershaw, 603 (72.3%) are family households, while 231 (27.7%) are nonfamily households. The most numerous type of family households are 2-person households, comprising 242, and the most common type of nonfamily households are 1-person households, comprising 213.
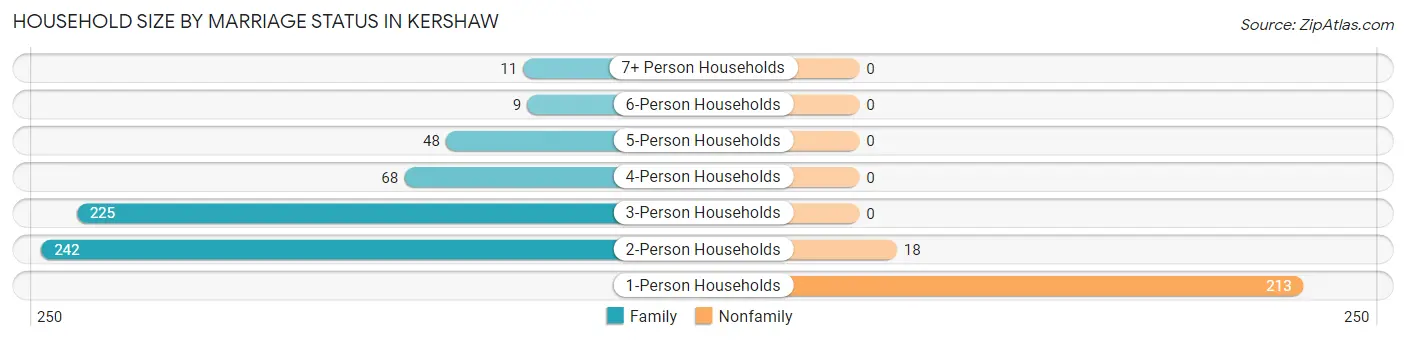
| Household Size | Family Households | Nonfamily Households |
| 1-Person Households | - | 213 (25.5%) |
| 2-Person Households | 242 (29.0%) | 18 (2.2%) |
| 3-Person Households | 225 (27.0%) | 0 (0.0%) |
| 4-Person Households | 68 (8.2%) | 0 (0.0%) |
| 5-Person Households | 48 (5.8%) | 0 (0.0%) |
| 6-Person Households | 9 (1.1%) | 0 (0.0%) |
| 7+ Person Households | 11 (1.3%) | 0 (0.0%) |
| Total | 603 (72.3%) | 231 (27.7%) |
Female Fertility in Kershaw
Fertility by Age in Kershaw
Average fertility rate in Kershaw is 63.0 births per 1,000 women. Women in the age bracket of 20 to 34 years have the highest fertility rate with 117.0 births per 1,000 women. Women in the age bracket of 20 to 34 years acount for 100.0% of all women with births.
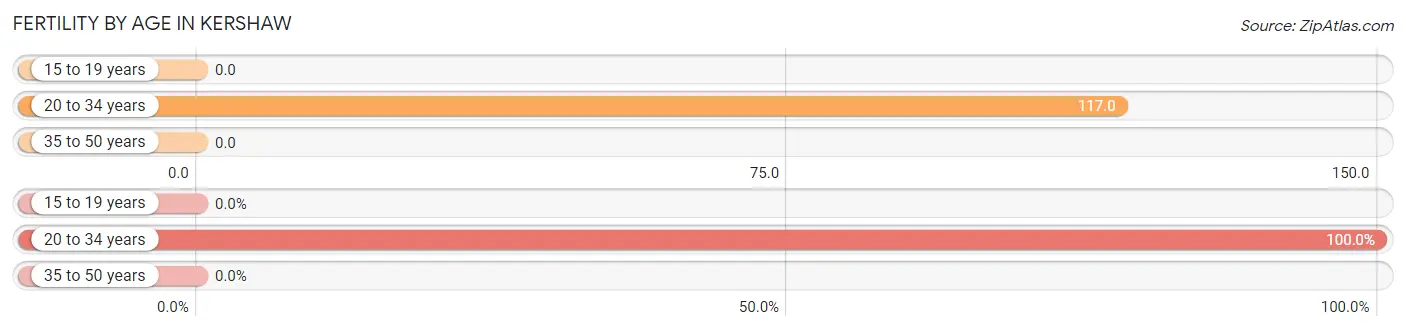
| Age Bracket | Women with Births | Births / 1,000 Women |
| 15 to 19 years | 0 (0.0%) | 0.0 |
| 20 to 34 years | 30 (100.0%) | 117.0 |
| 35 to 50 years | 0 (0.0%) | 0.0 |
| Total | 30 (100.0%) | 63.0 |
Fertility by Age by Marriage Status in Kershaw
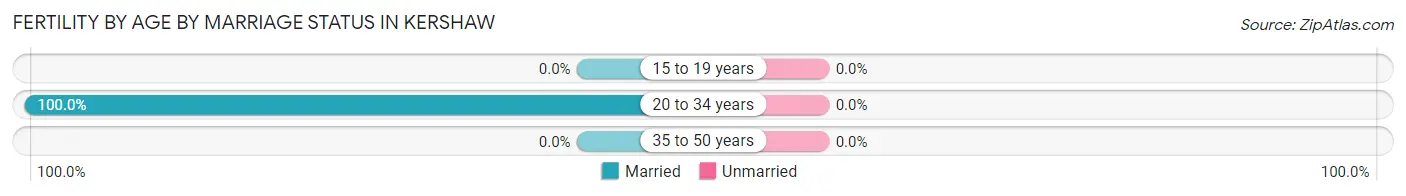
| Age Bracket | Married | Unmarried |
| 15 to 19 years | 0 (0.0%) | 0 (0.0%) |
| 20 to 34 years | 30 (100.0%) | 0 (0.0%) |
| 35 to 50 years | 0 (0.0%) | 0 (0.0%) |
| Total | 30 (100.0%) | 0 (0.0%) |
Fertility by Education in Kershaw
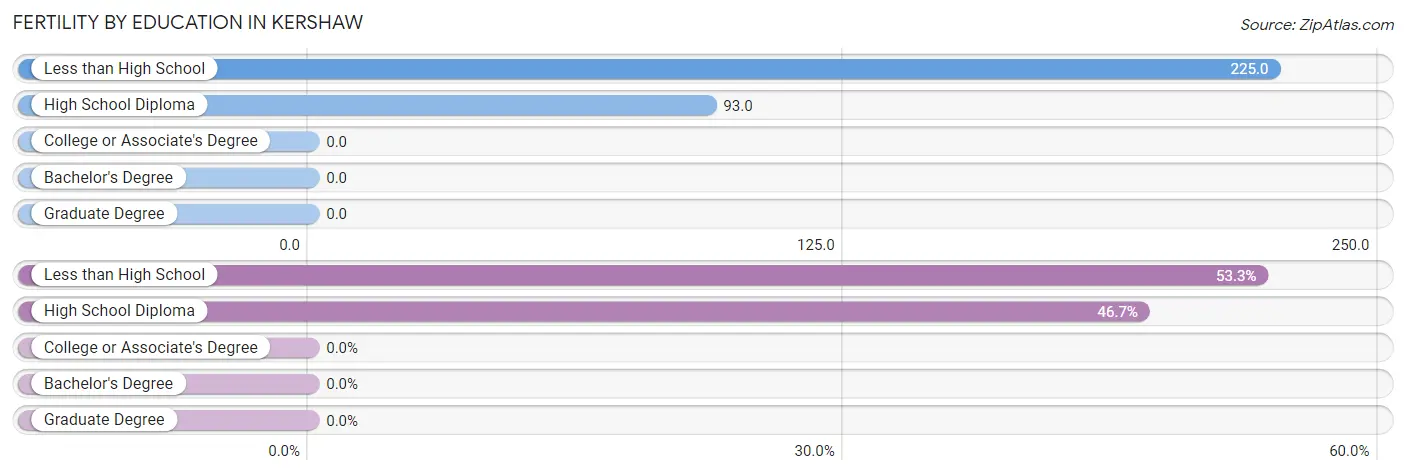
| Educational Attainment | Women with Births | Births / 1,000 Women |
| Less than High School | 16 (53.3%) | 225.0 |
| High School Diploma | 14 (46.7%) | 93.0 |
| College or Associate's Degree | 0 (0.0%) | 0.0 |
| Bachelor's Degree | 0 (0.0%) | 0.0 |
| Graduate Degree | 0 (0.0%) | 0.0 |
| Total | 30 (100.0%) | 63.0 |
Fertility by Education by Marriage Status in Kershaw
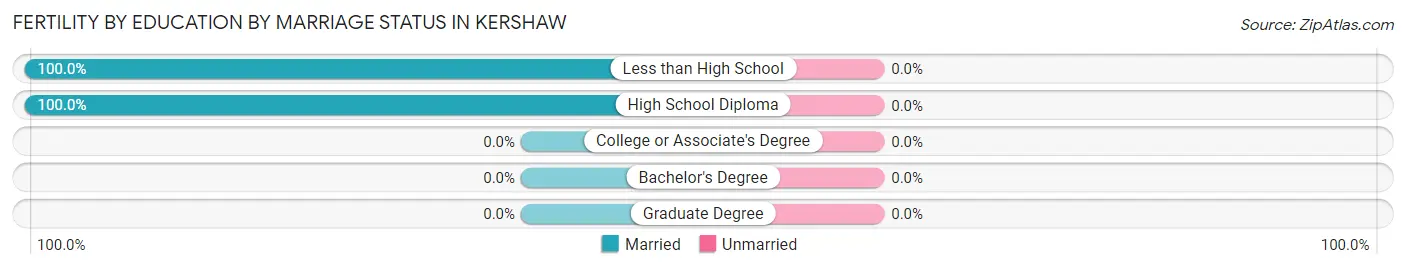
| Educational Attainment | Married | Unmarried |
| Less than High School | 16 (100.0%) | 0 (0.0%) |
| High School Diploma | 14 (100.0%) | 0 (0.0%) |
| College or Associate's Degree | 0 (0.0%) | 0 (0.0%) |
| Bachelor's Degree | 0 (0.0%) | 0 (0.0%) |
| Graduate Degree | 0 (0.0%) | 0 (0.0%) |
| Total | 30 (100.0%) | 0 (0.0%) |
Employment Characteristics in Kershaw
Employment by Class of Employer in Kershaw
Among the 967 employed individuals in Kershaw, private company employees (610 | 63.1%), state government employees (102 | 10.5%), and local government employees (100 | 10.3%) make up the most common classes of employment.
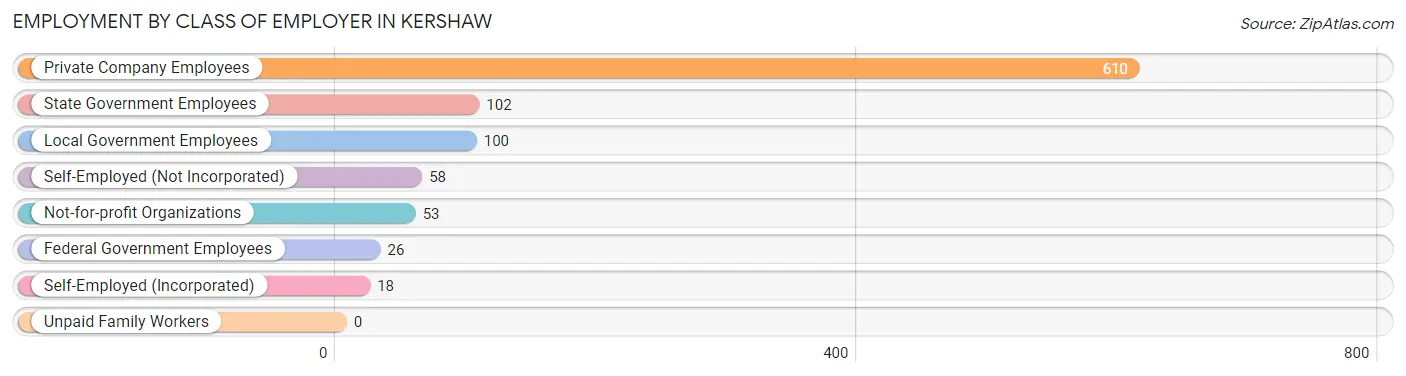
| Employer Class | # Employees | % Employees |
| Private Company Employees | 610 | 63.1% |
| Self-Employed (Incorporated) | 18 | 1.9% |
| Self-Employed (Not Incorporated) | 58 | 6.0% |
| Not-for-profit Organizations | 53 | 5.5% |
| Local Government Employees | 100 | 10.3% |
| State Government Employees | 102 | 10.5% |
| Federal Government Employees | 26 | 2.7% |
| Unpaid Family Workers | 0 | 0.0% |
| Total | 967 | 100.0% |
Employment Status by Age in Kershaw
According to the labor force statistics for Kershaw, out of the total population over 16 years of age (1,595), 62.8% or 1,002 individuals are in the labor force, with 2.8% or 28 of them unemployed. The age group with the highest labor force participation rate is 30 to 34 years, with 94.1% or 112 individuals in the labor force. Within the labor force, the 60 to 64 years age range has the highest percentage of unemployed individuals, with 6.9% or 4 of them being unemployed.
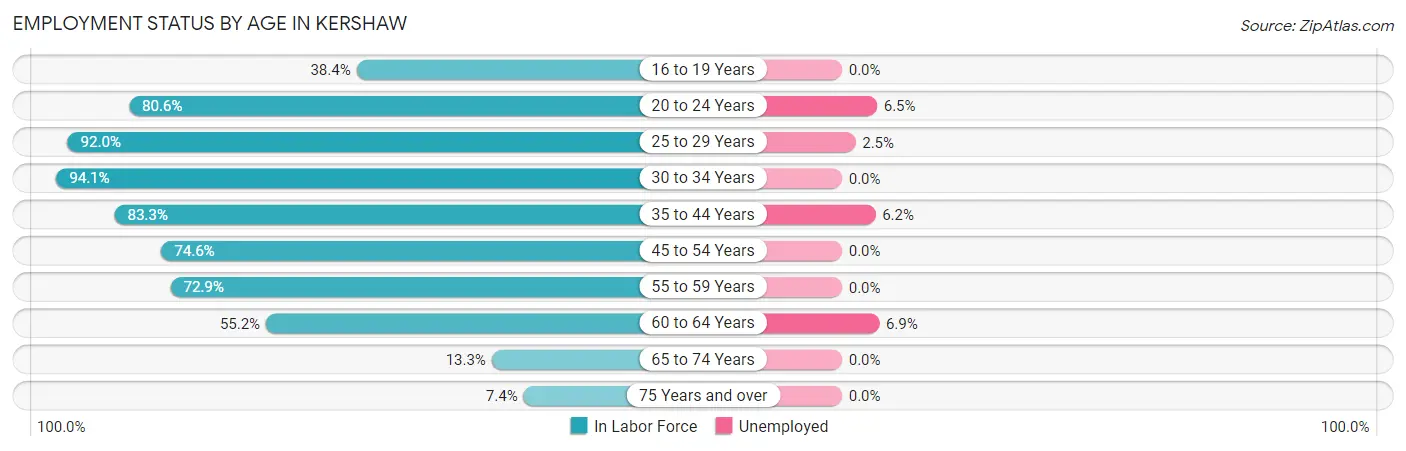
| Age Bracket | In Labor Force | Unemployed |
| 16 to 19 Years | 33 (38.4%) | 0 (0.0%) |
| 20 to 24 Years | 108 (80.6%) | 7 (6.5%) |
| 25 to 29 Years | 161 (92.0%) | 4 (2.5%) |
| 30 to 34 Years | 112 (94.1%) | 0 (0.0%) |
| 35 to 44 Years | 210 (83.3%) | 13 (6.2%) |
| 45 to 54 Years | 214 (74.6%) | 0 (0.0%) |
| 55 to 59 Years | 70 (72.9%) | 0 (0.0%) |
| 60 to 64 Years | 58 (55.2%) | 4 (6.9%) |
| 65 to 74 Years | 22 (13.3%) | 0 (0.0%) |
| 75 Years and over | 13 (7.4%) | 0 (0.0%) |
| Total | 1,002 (62.8%) | 28 (2.8%) |
Employment Status by Educational Attainment in Kershaw
According to labor force statistics for Kershaw, 79.8% of individuals (825) out of the total population between 25 and 64 years of age (1,034) are in the labor force, with 2.6% or 21 of them being unemployed. The group with the highest labor force participation rate are those with the educational attainment of college / associate degree, with 83.8% or 268 individuals in the labor force. Within the labor force, individuals with high school diploma education have the highest percentage of unemployment, with 4.4% or 13 of them being unemployed.
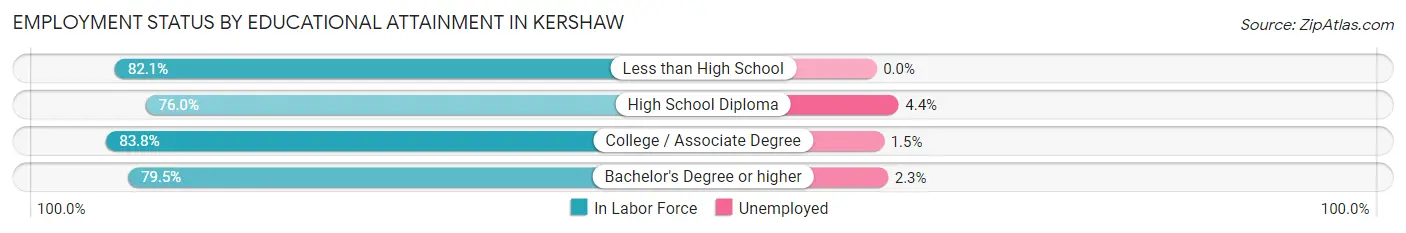
| Educational Attainment | In Labor Force | Unemployed |
| Less than High School | 87 (82.1%) | 0 (0.0%) |
| High School Diploma | 295 (76.0%) | 17 (4.4%) |
| College / Associate Degree | 268 (83.8%) | 5 (1.5%) |
| Bachelor's Degree or higher | 175 (79.5%) | 5 (2.3%) |
| Total | 825 (79.8%) | 27 (2.6%) |
Employment Occupations by Sex in Kershaw
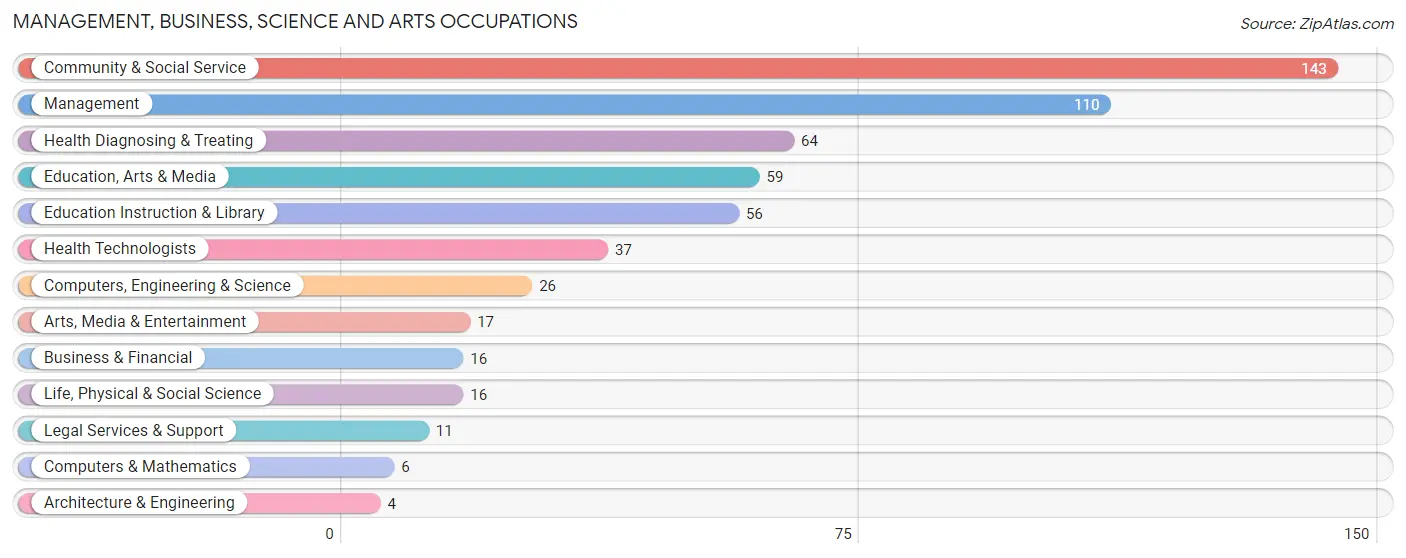
Management, Business, Science and Arts Occupations
The most common Management, Business, Science and Arts occupations in Kershaw are Community & Social Service (143 | 14.8%), Management (110 | 11.4%), Health Diagnosing & Treating (64 | 6.6%), Education, Arts & Media (59 | 6.1%), and Education Instruction & Library (56 | 5.8%).
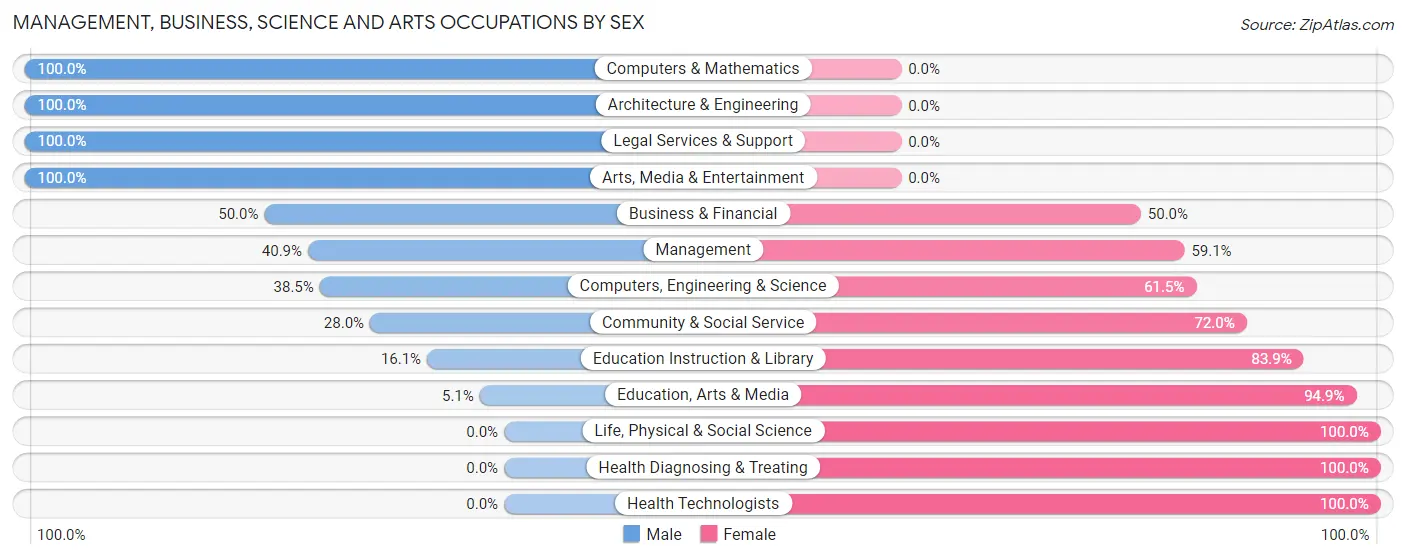
Management, Business, Science and Arts Occupations by Sex
Within the Management, Business, Science and Arts occupations in Kershaw, the most male-oriented occupations are Computers & Mathematics (100.0%), Architecture & Engineering (100.0%), and Legal Services & Support (100.0%), while the most female-oriented occupations are Life, Physical & Social Science (100.0%), Health Diagnosing & Treating (100.0%), and Health Technologists (100.0%).
| Occupation | Male | Female |
| Management | 45 (40.9%) | 65 (59.1%) |
| Business & Financial | 8 (50.0%) | 8 (50.0%) |
| Computers, Engineering & Science | 10 (38.5%) | 16 (61.5%) |
| Computers & Mathematics | 6 (100.0%) | 0 (0.0%) |
| Architecture & Engineering | 4 (100.0%) | 0 (0.0%) |
| Life, Physical & Social Science | 0 (0.0%) | 16 (100.0%) |
| Community & Social Service | 40 (28.0%) | 103 (72.0%) |
| Education, Arts & Media | 3 (5.1%) | 56 (94.9%) |
| Legal Services & Support | 11 (100.0%) | 0 (0.0%) |
| Education Instruction & Library | 9 (16.1%) | 47 (83.9%) |
| Arts, Media & Entertainment | 17 (100.0%) | 0 (0.0%) |
| Health Diagnosing & Treating | 0 (0.0%) | 64 (100.0%) |
| Health Technologists | 0 (0.0%) | 37 (100.0%) |
| Total (Category) | 103 (28.7%) | 256 (71.3%) |
| Total (Overall) | 504 (52.0%) | 465 (48.0%) |
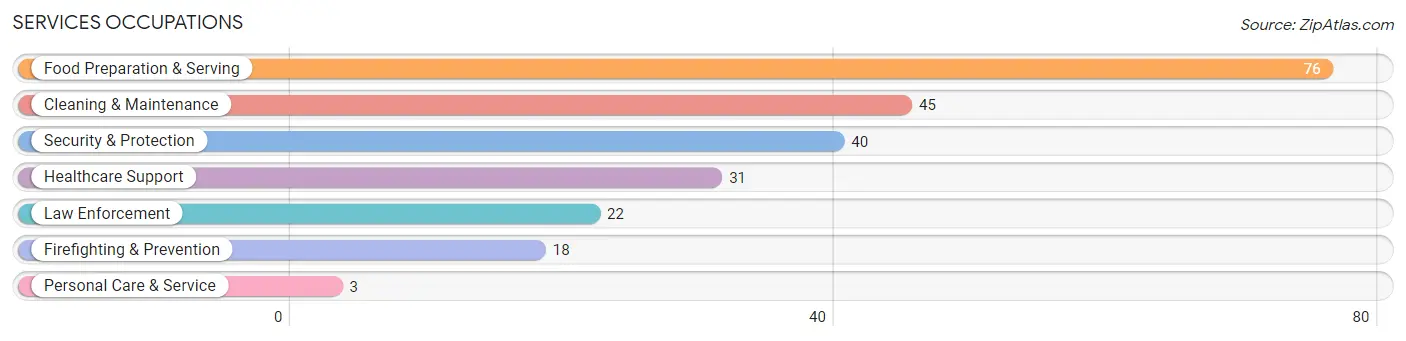
Services Occupations
The most common Services occupations in Kershaw are Food Preparation & Serving (76 | 7.8%), Cleaning & Maintenance (45 | 4.6%), Security & Protection (40 | 4.1%), Healthcare Support (31 | 3.2%), and Law Enforcement (22 | 2.3%).
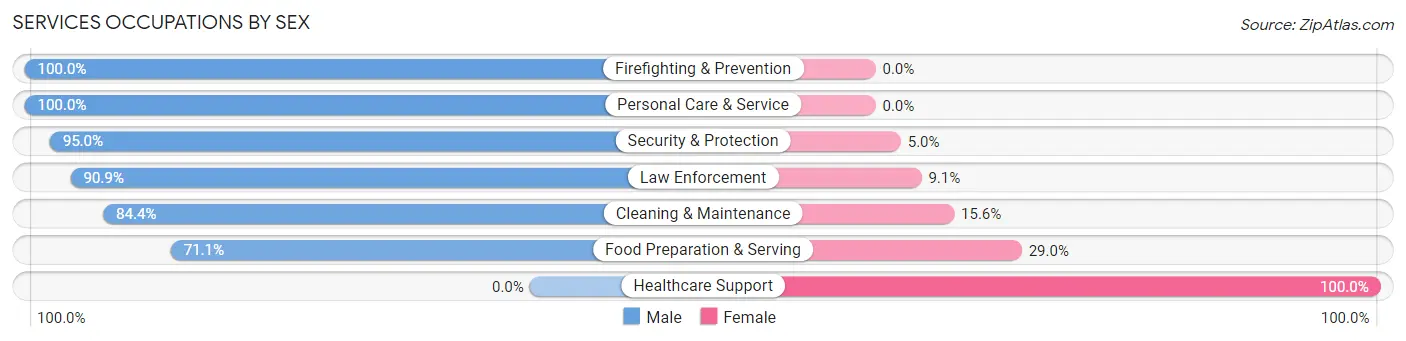
Services Occupations by Sex
Within the Services occupations in Kershaw, the most male-oriented occupations are Firefighting & Prevention (100.0%), Personal Care & Service (100.0%), and Security & Protection (95.0%), while the most female-oriented occupations are Healthcare Support (100.0%), Food Preparation & Serving (28.9%), and Cleaning & Maintenance (15.6%).
| Occupation | Male | Female |
| Healthcare Support | 0 (0.0%) | 31 (100.0%) |
| Security & Protection | 38 (95.0%) | 2 (5.0%) |
| Firefighting & Prevention | 18 (100.0%) | 0 (0.0%) |
| Law Enforcement | 20 (90.9%) | 2 (9.1%) |
| Food Preparation & Serving | 54 (71.1%) | 22 (28.9%) |
| Cleaning & Maintenance | 38 (84.4%) | 7 (15.6%) |
| Personal Care & Service | 3 (100.0%) | 0 (0.0%) |
| Total (Category) | 133 (68.2%) | 62 (31.8%) |
| Total (Overall) | 504 (52.0%) | 465 (48.0%) |
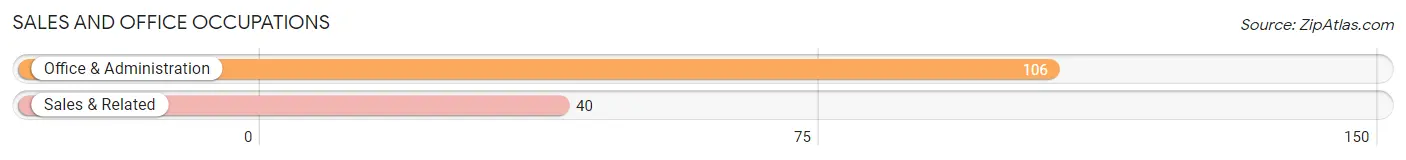
Sales and Office Occupations
The most common Sales and Office occupations in Kershaw are Office & Administration (106 | 10.9%), and Sales & Related (40 | 4.1%).
Sales and Office Occupations by Sex
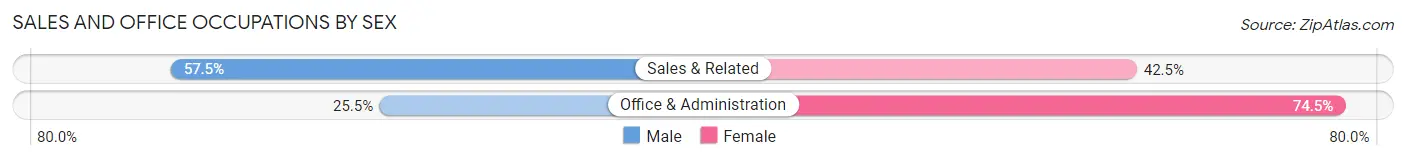
| Occupation | Male | Female |
| Sales & Related | 23 (57.5%) | 17 (42.5%) |
| Office & Administration | 27 (25.5%) | 79 (74.5%) |
| Total (Category) | 50 (34.3%) | 96 (65.7%) |
| Total (Overall) | 504 (52.0%) | 465 (48.0%) |
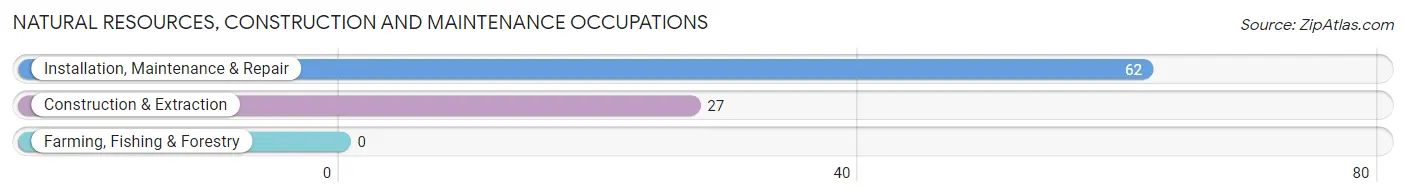
Natural Resources, Construction and Maintenance Occupations
The most common Natural Resources, Construction and Maintenance occupations in Kershaw are Installation, Maintenance & Repair (62 | 6.4%), and Construction & Extraction (27 | 2.8%).
Natural Resources, Construction and Maintenance Occupations by Sex
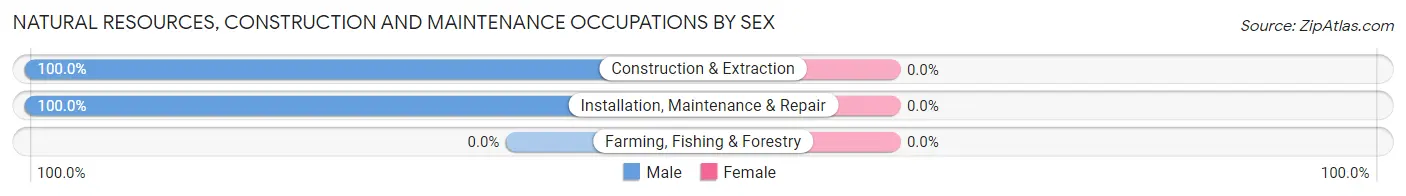
| Occupation | Male | Female |
| Farming, Fishing & Forestry | 0 (0.0%) | 0 (0.0%) |
| Construction & Extraction | 27 (100.0%) | 0 (0.0%) |
| Installation, Maintenance & Repair | 62 (100.0%) | 0 (0.0%) |
| Total (Category) | 89 (100.0%) | 0 (0.0%) |
| Total (Overall) | 504 (52.0%) | 465 (48.0%) |
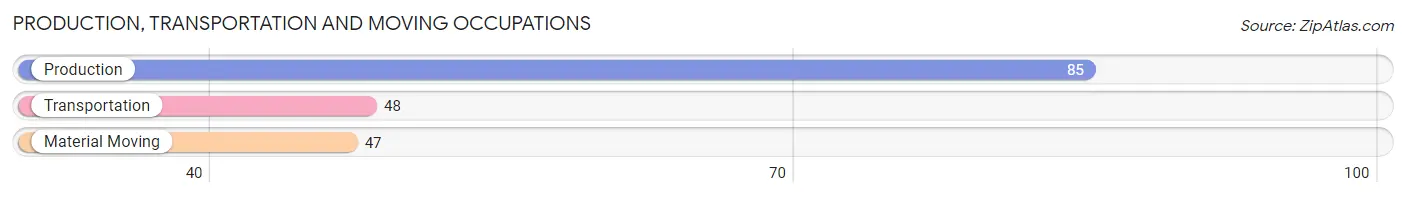
Production, Transportation and Moving Occupations
The most common Production, Transportation and Moving occupations in Kershaw are Production (85 | 8.8%), Transportation (48 | 5.0%), and Material Moving (47 | 4.9%).
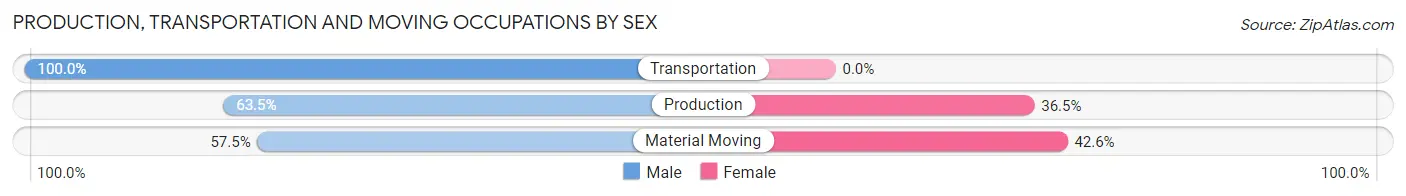
Production, Transportation and Moving Occupations by Sex
| Occupation | Male | Female |
| Production | 54 (63.5%) | 31 (36.5%) |
| Transportation | 48 (100.0%) | 0 (0.0%) |
| Material Moving | 27 (57.5%) | 20 (42.5%) |
| Total (Category) | 129 (71.7%) | 51 (28.3%) |
| Total (Overall) | 504 (52.0%) | 465 (48.0%) |
Employment Industries by Sex in Kershaw
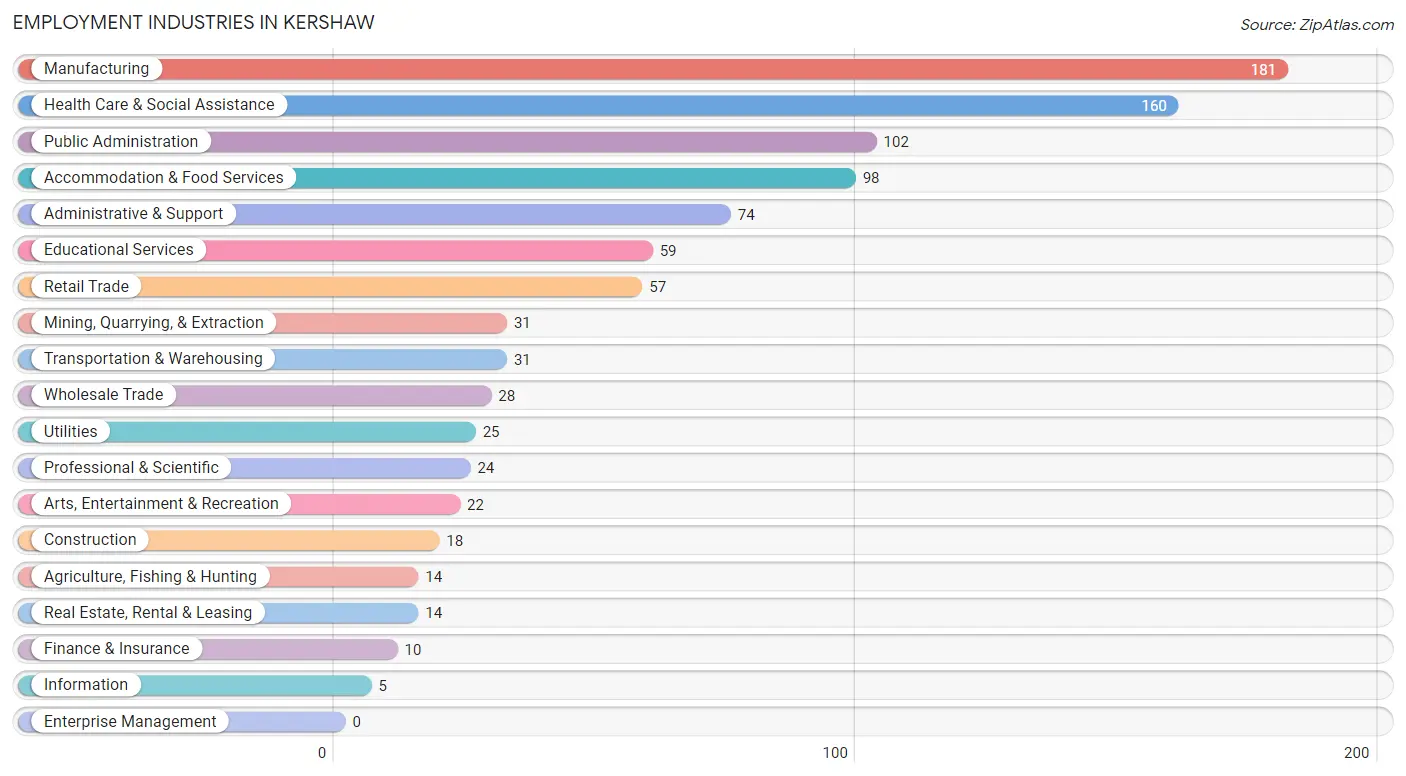
Employment Industries in Kershaw
The major employment industries in Kershaw include Manufacturing (181 | 18.7%), Health Care & Social Assistance (160 | 16.5%), Public Administration (102 | 10.5%), Accommodation & Food Services (98 | 10.1%), and Administrative & Support (74 | 7.6%).
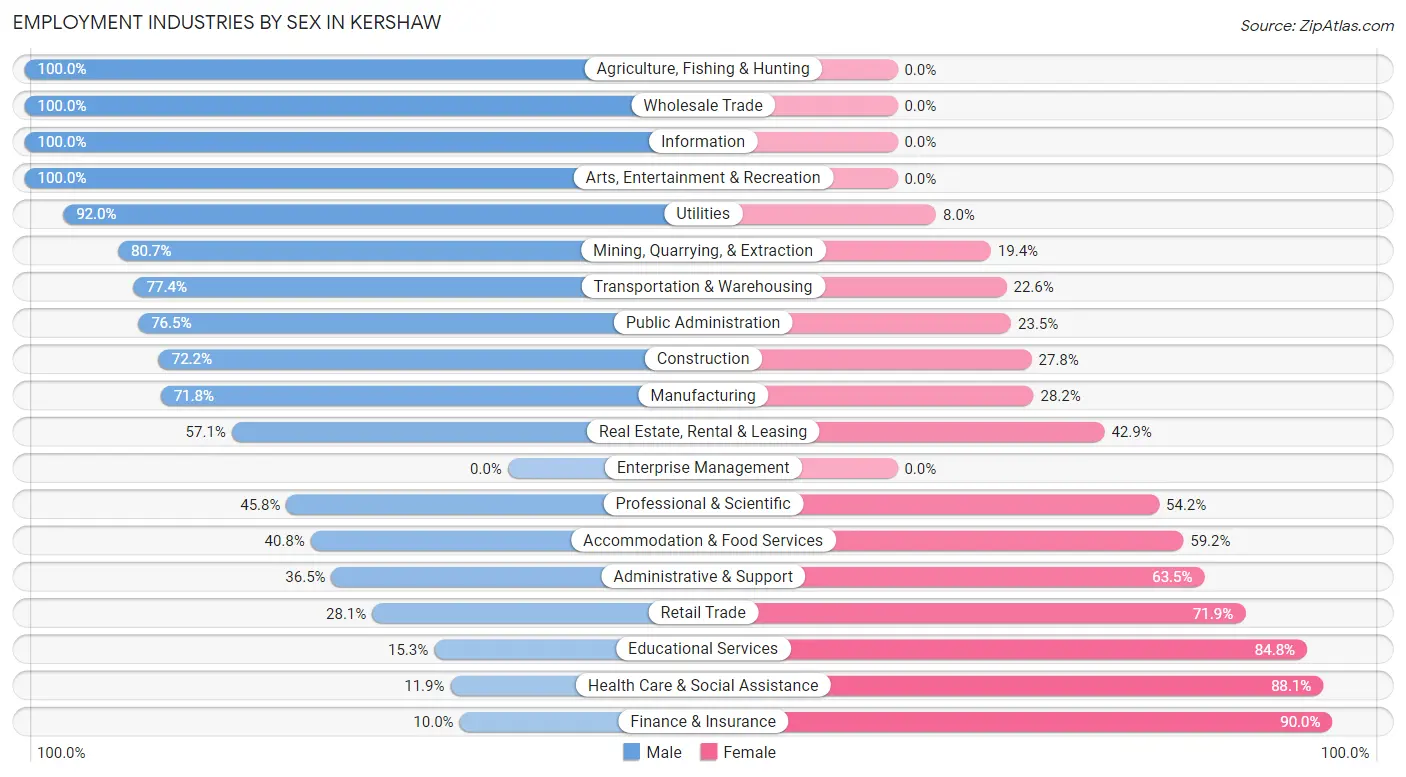
Employment Industries by Sex in Kershaw
The Kershaw industries that see more men than women are Agriculture, Fishing & Hunting (100.0%), Wholesale Trade (100.0%), and Information (100.0%), whereas the industries that tend to have a higher number of women are Finance & Insurance (90.0%), Health Care & Social Assistance (88.1%), and Educational Services (84.8%).
| Industry | Male | Female |
| Agriculture, Fishing & Hunting | 14 (100.0%) | 0 (0.0%) |
| Mining, Quarrying, & Extraction | 25 (80.6%) | 6 (19.4%) |
| Construction | 13 (72.2%) | 5 (27.8%) |
| Manufacturing | 130 (71.8%) | 51 (28.2%) |
| Wholesale Trade | 28 (100.0%) | 0 (0.0%) |
| Retail Trade | 16 (28.1%) | 41 (71.9%) |
| Transportation & Warehousing | 24 (77.4%) | 7 (22.6%) |
| Utilities | 23 (92.0%) | 2 (8.0%) |
| Information | 5 (100.0%) | 0 (0.0%) |
| Finance & Insurance | 1 (10.0%) | 9 (90.0%) |
| Real Estate, Rental & Leasing | 8 (57.1%) | 6 (42.9%) |
| Professional & Scientific | 11 (45.8%) | 13 (54.2%) |
| Enterprise Management | 0 (0.0%) | 0 (0.0%) |
| Administrative & Support | 27 (36.5%) | 47 (63.5%) |
| Educational Services | 9 (15.2%) | 50 (84.8%) |
| Health Care & Social Assistance | 19 (11.9%) | 141 (88.1%) |
| Arts, Entertainment & Recreation | 22 (100.0%) | 0 (0.0%) |
| Accommodation & Food Services | 40 (40.8%) | 58 (59.2%) |
| Public Administration | 78 (76.5%) | 24 (23.5%) |
| Total | 504 (52.0%) | 465 (48.0%) |
Education in Kershaw
School Enrollment in Kershaw
The most common levels of schooling among the 636 students in Kershaw are elementary school (149 | 23.4%), middle school (145 | 22.8%), and kindergarten (109 | 17.1%).
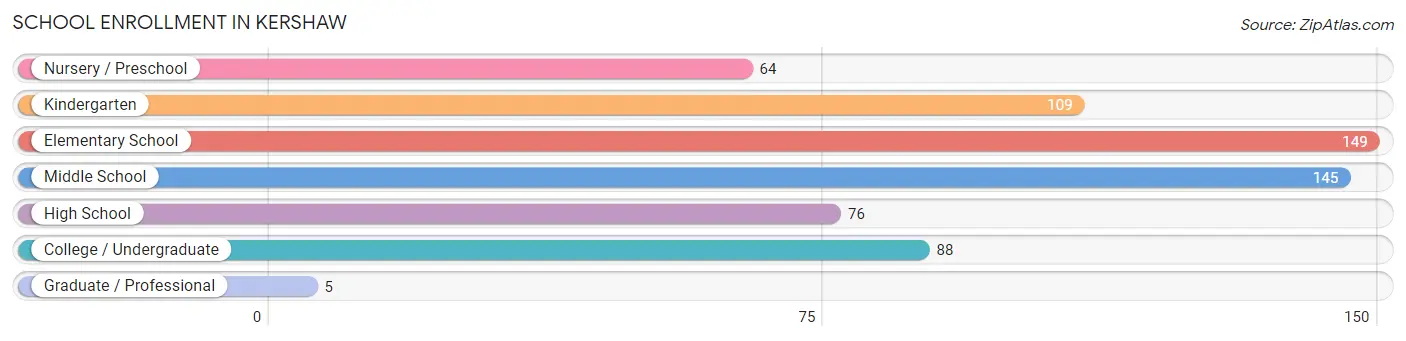
| School Level | # Students | % Students |
| Nursery / Preschool | 64 | 10.1% |
| Kindergarten | 109 | 17.1% |
| Elementary School | 149 | 23.4% |
| Middle School | 145 | 22.8% |
| High School | 76 | 11.9% |
| College / Undergraduate | 88 | 13.8% |
| Graduate / Professional | 5 | 0.8% |
| Total | 636 | 100.0% |
School Enrollment by Age by Funding Source in Kershaw
Out of a total of 636 students who are enrolled in schools in Kershaw, 125 (19.7%) attend a private institution, while the remaining 511 (80.3%) are enrolled in public schools. The age group of 3 to 4 year olds has the highest likelihood of being enrolled in private schools, with 48 (100.0% in the age bracket) enrolled. Conversely, the age group of 10 to 14 year olds has the lowest likelihood of being enrolled in a private school, with 162 (100.0% in the age bracket) attending a public institution.
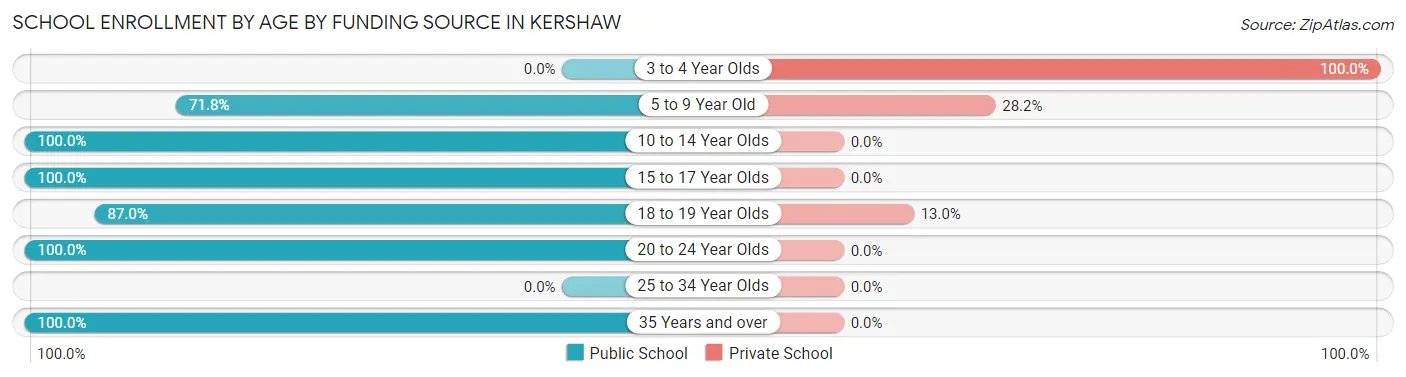
| Age Bracket | Public School | Private School |
| 3 to 4 Year Olds | 0 (0.0%) | 48 (100.0%) |
| 5 to 9 Year Old | 188 (71.8%) | 74 (28.2%) |
| 10 to 14 Year Olds | 162 (100.0%) | 0 (0.0%) |
| 15 to 17 Year Olds | 71 (100.0%) | 0 (0.0%) |
| 18 to 19 Year Olds | 20 (87.0%) | 3 (13.0%) |
| 20 to 24 Year Olds | 36 (100.0%) | 0 (0.0%) |
| 25 to 34 Year Olds | 0 (0.0%) | 0 (0.0%) |
| 35 Years and over | 34 (100.0%) | 0 (0.0%) |
| Total | 511 (80.3%) | 125 (19.7%) |
Educational Attainment by Field of Study in Kershaw
Arts & humanities (76 | 26.9%), education (65 | 23.0%), science & technology (56 | 19.8%), business (30 | 10.6%), and physical & health sciences (14 | 5.0%) are the most common fields of study among 283 individuals in Kershaw who have obtained a bachelor's degree or higher.
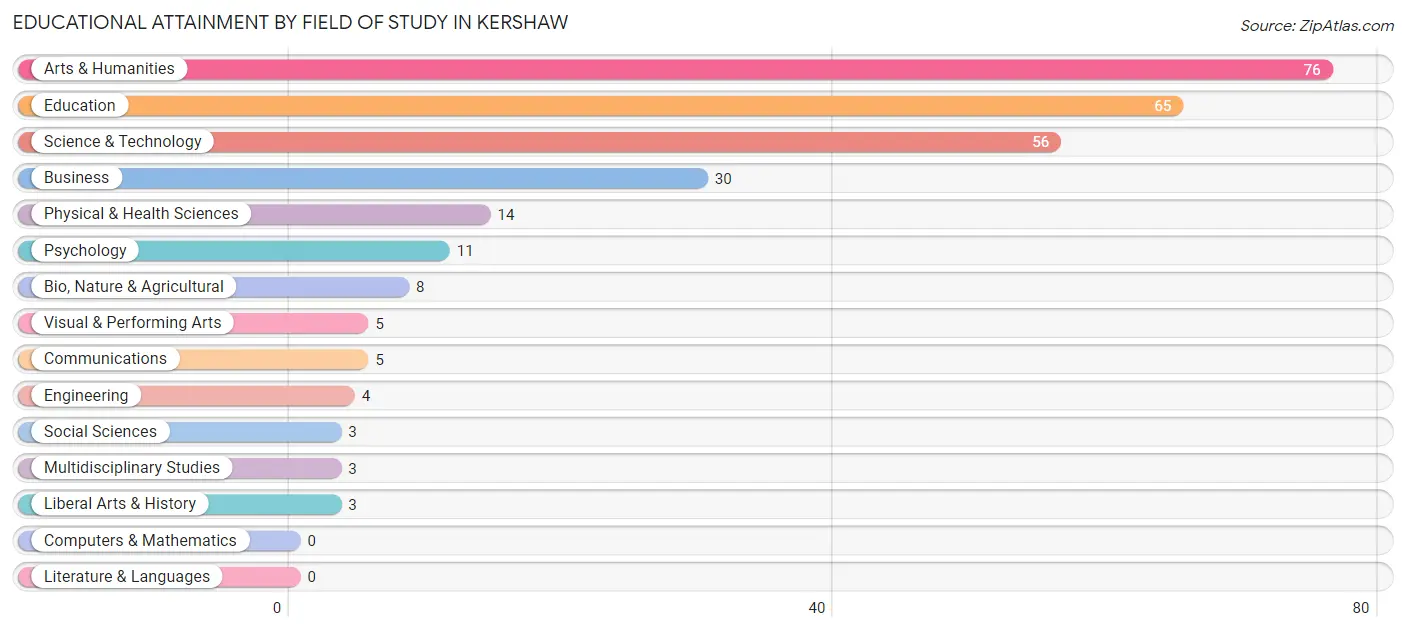
| Field of Study | # Graduates | % Graduates |
| Computers & Mathematics | 0 | 0.0% |
| Bio, Nature & Agricultural | 8 | 2.8% |
| Physical & Health Sciences | 14 | 5.0% |
| Psychology | 11 | 3.9% |
| Social Sciences | 3 | 1.1% |
| Engineering | 4 | 1.4% |
| Multidisciplinary Studies | 3 | 1.1% |
| Science & Technology | 56 | 19.8% |
| Business | 30 | 10.6% |
| Education | 65 | 23.0% |
| Literature & Languages | 0 | 0.0% |
| Liberal Arts & History | 3 | 1.1% |
| Visual & Performing Arts | 5 | 1.8% |
| Communications | 5 | 1.8% |
| Arts & Humanities | 76 | 26.9% |
| Total | 283 | 100.0% |
Transportation & Commute in Kershaw
Vehicle Availability by Sex in Kershaw
The most prevalent vehicle ownership categories in Kershaw are males with 2 vehicles (211, accounting for 41.5%) and females with 2 vehicles (163, making up 46.0%).
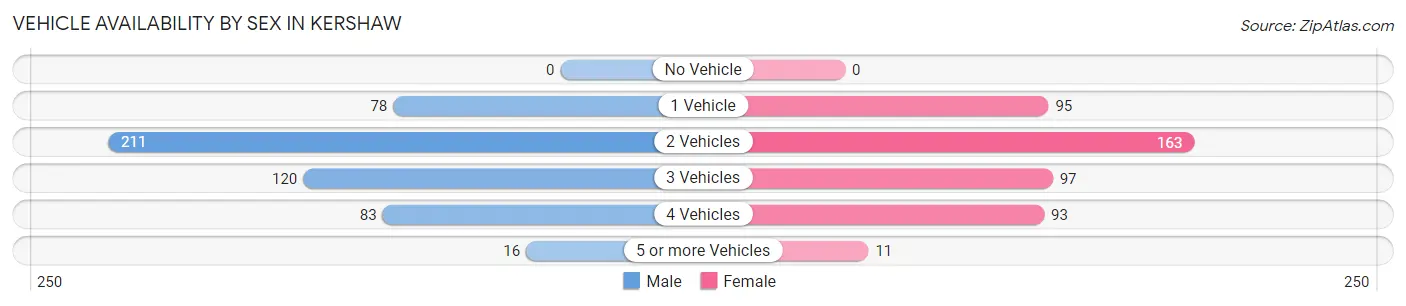
| Vehicles Available | Male | Female |
| No Vehicle | 0 (0.0%) | 0 (0.0%) |
| 1 Vehicle | 78 (15.3%) | 95 (20.7%) |
| 2 Vehicles | 211 (41.5%) | 163 (35.5%) |
| 3 Vehicles | 120 (23.6%) | 97 (21.1%) |
| 4 Vehicles | 83 (16.3%) | 93 (20.3%) |
| 5 or more Vehicles | 16 (3.2%) | 11 (2.4%) |
| Total | 508 (100.0%) | 459 (100.0%) |
Commute Time in Kershaw
The most frequently occuring commute durations in Kershaw are 30 to 34 minutes (249 commuters, 27.0%), 20 to 24 minutes (169 commuters, 18.3%), and 5 to 9 minutes (121 commuters, 13.1%).
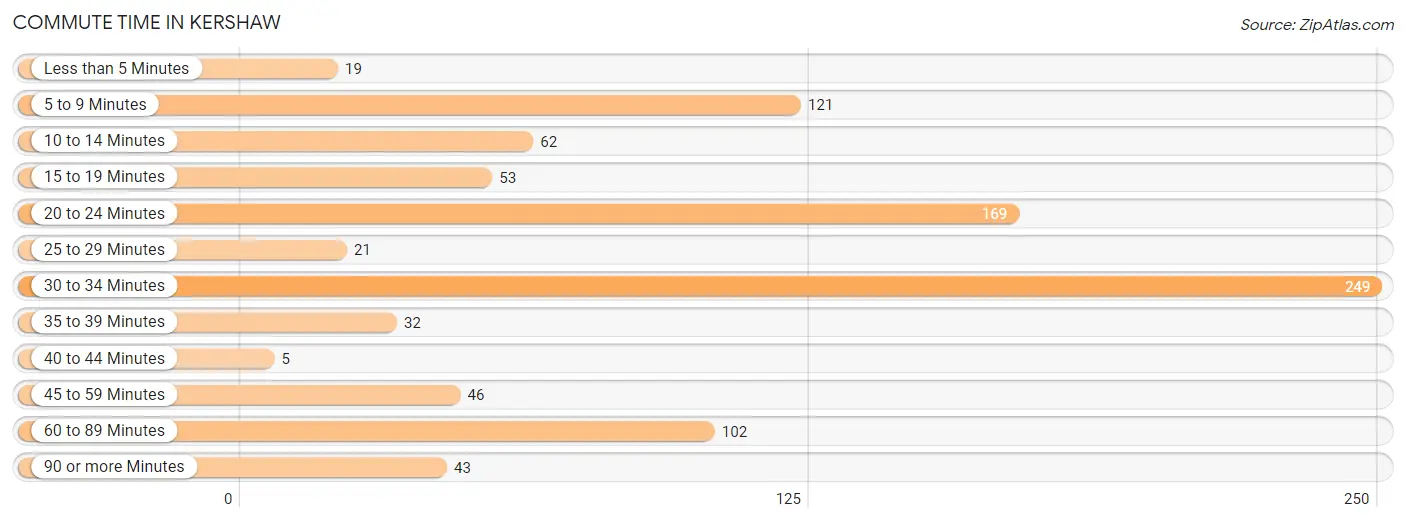
| Commute Time | # Commuters | % Commuters |
| Less than 5 Minutes | 19 | 2.1% |
| 5 to 9 Minutes | 121 | 13.1% |
| 10 to 14 Minutes | 62 | 6.7% |
| 15 to 19 Minutes | 53 | 5.8% |
| 20 to 24 Minutes | 169 | 18.3% |
| 25 to 29 Minutes | 21 | 2.3% |
| 30 to 34 Minutes | 249 | 27.0% |
| 35 to 39 Minutes | 32 | 3.5% |
| 40 to 44 Minutes | 5 | 0.5% |
| 45 to 59 Minutes | 46 | 5.0% |
| 60 to 89 Minutes | 102 | 11.1% |
| 90 or more Minutes | 43 | 4.7% |
Commute Time by Sex in Kershaw
The most common commute times in Kershaw are 30 to 34 minutes (127 commuters, 25.4%) for males and 30 to 34 minutes (122 commuters, 29.0%) for females.
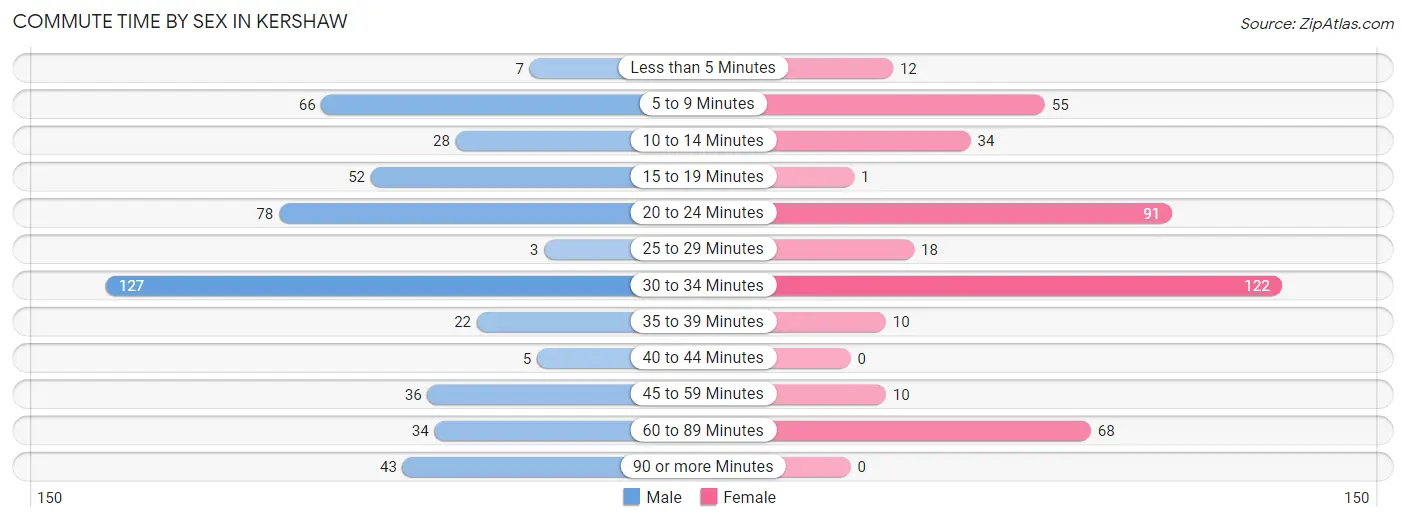
| Commute Time | Male | Female |
| Less than 5 Minutes | 7 (1.4%) | 12 (2.9%) |
| 5 to 9 Minutes | 66 (13.2%) | 55 (13.1%) |
| 10 to 14 Minutes | 28 (5.6%) | 34 (8.1%) |
| 15 to 19 Minutes | 52 (10.4%) | 1 (0.2%) |
| 20 to 24 Minutes | 78 (15.6%) | 91 (21.6%) |
| 25 to 29 Minutes | 3 (0.6%) | 18 (4.3%) |
| 30 to 34 Minutes | 127 (25.4%) | 122 (29.0%) |
| 35 to 39 Minutes | 22 (4.4%) | 10 (2.4%) |
| 40 to 44 Minutes | 5 (1.0%) | 0 (0.0%) |
| 45 to 59 Minutes | 36 (7.2%) | 10 (2.4%) |
| 60 to 89 Minutes | 34 (6.8%) | 68 (16.2%) |
| 90 or more Minutes | 43 (8.6%) | 0 (0.0%) |
Time of Departure to Work by Sex in Kershaw
The most frequent times of departure to work in Kershaw are 6:00 AM to 6:29 AM (68, 13.6%) for males and 8:00 AM to 8:29 AM (107, 25.4%) for females.
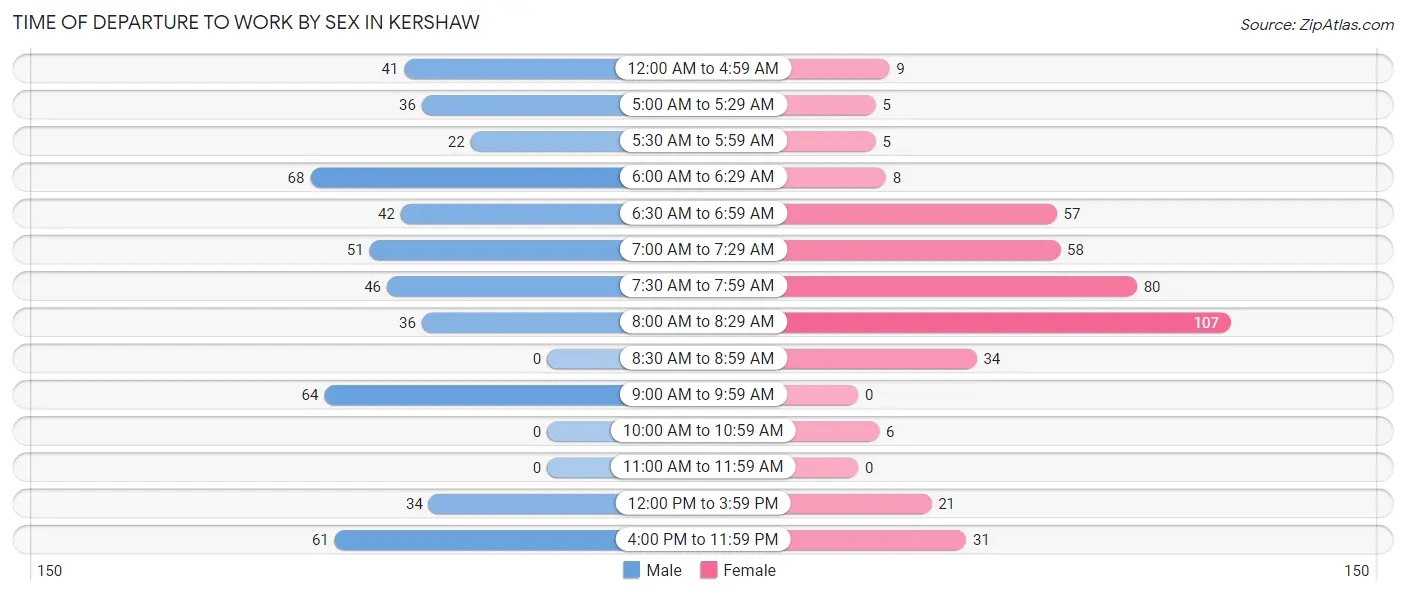
| Time of Departure | Male | Female |
| 12:00 AM to 4:59 AM | 41 (8.2%) | 9 (2.1%) |
| 5:00 AM to 5:29 AM | 36 (7.2%) | 5 (1.2%) |
| 5:30 AM to 5:59 AM | 22 (4.4%) | 5 (1.2%) |
| 6:00 AM to 6:29 AM | 68 (13.6%) | 8 (1.9%) |
| 6:30 AM to 6:59 AM | 42 (8.4%) | 57 (13.5%) |
| 7:00 AM to 7:29 AM | 51 (10.2%) | 58 (13.8%) |
| 7:30 AM to 7:59 AM | 46 (9.2%) | 80 (19.0%) |
| 8:00 AM to 8:29 AM | 36 (7.2%) | 107 (25.4%) |
| 8:30 AM to 8:59 AM | 0 (0.0%) | 34 (8.1%) |
| 9:00 AM to 9:59 AM | 64 (12.8%) | 0 (0.0%) |
| 10:00 AM to 10:59 AM | 0 (0.0%) | 6 (1.4%) |
| 11:00 AM to 11:59 AM | 0 (0.0%) | 0 (0.0%) |
| 12:00 PM to 3:59 PM | 34 (6.8%) | 21 (5.0%) |
| 4:00 PM to 11:59 PM | 61 (12.2%) | 31 (7.4%) |
| Total | 501 (100.0%) | 421 (100.0%) |
Housing Occupancy in Kershaw
Occupancy by Ownership in Kershaw
Of the total 834 dwellings in Kershaw, owner-occupied units account for 556 (66.7%), while renter-occupied units make up 278 (33.3%).
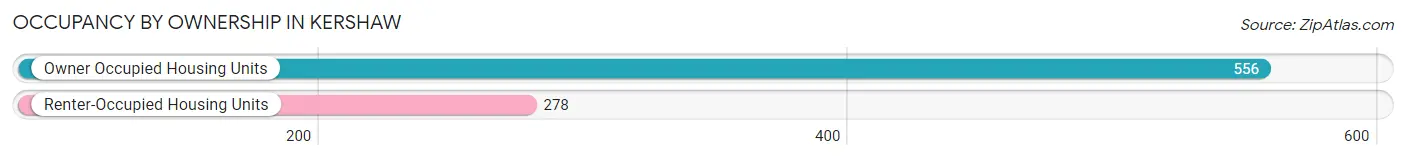
| Occupancy | # Housing Units | % Housing Units |
| Owner Occupied Housing Units | 556 | 66.7% |
| Renter-Occupied Housing Units | 278 | 33.3% |
| Total Occupied Housing Units | 834 | 100.0% |
Occupancy by Household Size in Kershaw
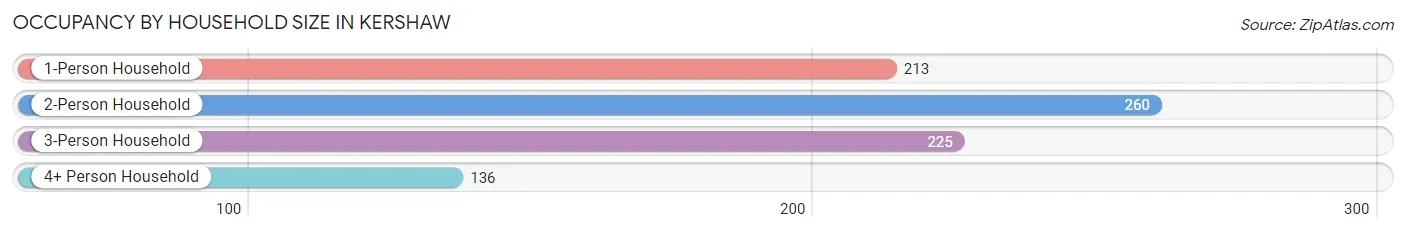
| Household Size | # Housing Units | % Housing Units |
| 1-Person Household | 213 | 25.5% |
| 2-Person Household | 260 | 31.2% |
| 3-Person Household | 225 | 27.0% |
| 4+ Person Household | 136 | 16.3% |
| Total Housing Units | 834 | 100.0% |
Occupancy by Ownership by Household Size in Kershaw
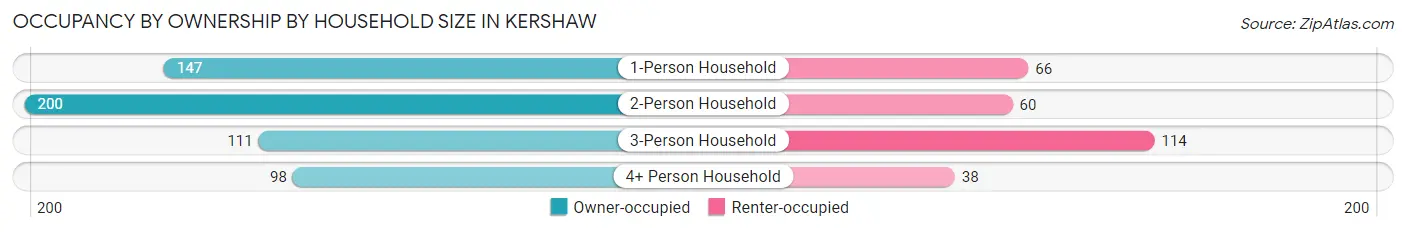
| Household Size | Owner-occupied | Renter-occupied |
| 1-Person Household | 147 (69.0%) | 66 (31.0%) |
| 2-Person Household | 200 (76.9%) | 60 (23.1%) |
| 3-Person Household | 111 (49.3%) | 114 (50.7%) |
| 4+ Person Household | 98 (72.1%) | 38 (27.9%) |
| Total Housing Units | 556 (66.7%) | 278 (33.3%) |
Occupancy by Educational Attainment in Kershaw
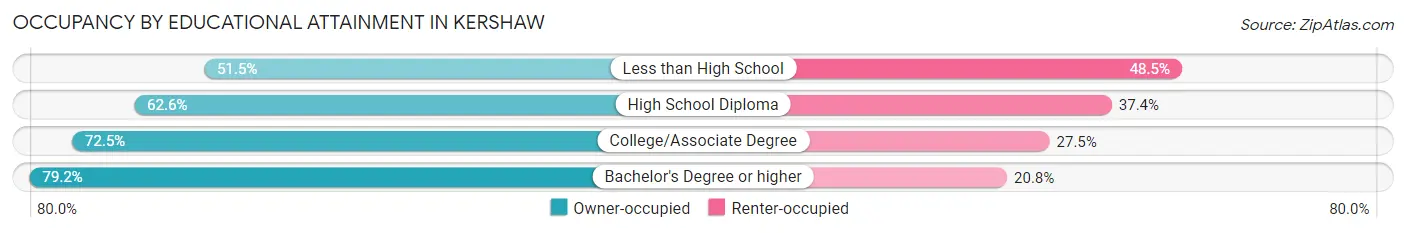
| Household Size | Owner-occupied | Renter-occupied |
| Less than High School | 67 (51.5%) | 63 (48.5%) |
| High School Diploma | 191 (62.6%) | 114 (37.4%) |
| College/Associate Degree | 195 (72.5%) | 74 (27.5%) |
| Bachelor's Degree or higher | 103 (79.2%) | 27 (20.8%) |
Occupancy by Age of Householder in Kershaw
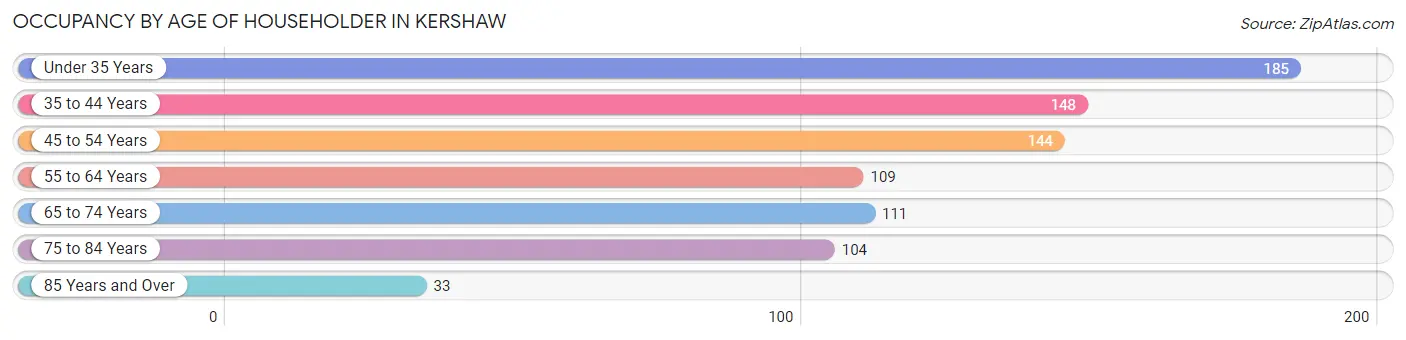
| Age Bracket | # Households | % Households |
| Under 35 Years | 185 | 22.2% |
| 35 to 44 Years | 148 | 17.7% |
| 45 to 54 Years | 144 | 17.3% |
| 55 to 64 Years | 109 | 13.1% |
| 65 to 74 Years | 111 | 13.3% |
| 75 to 84 Years | 104 | 12.5% |
| 85 Years and Over | 33 | 4.0% |
| Total | 834 | 100.0% |
Housing Finances in Kershaw
Median Income by Occupancy in Kershaw
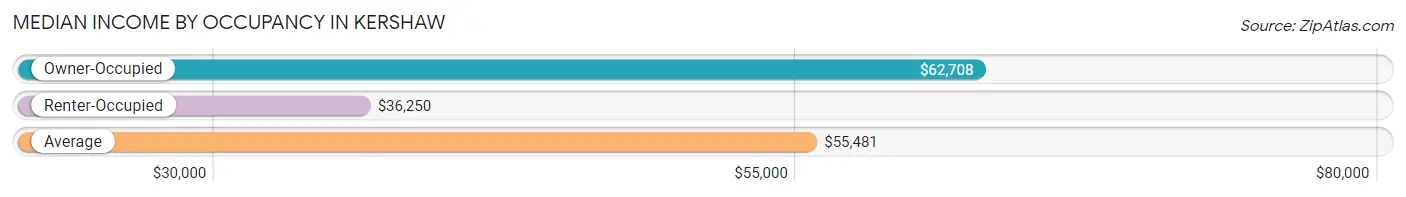
| Occupancy Type | # Households | Median Income |
| Owner-Occupied | 556 (66.7%) | $62,708 |
| Renter-Occupied | 278 (33.3%) | $36,250 |
| Average | 834 (100.0%) | $55,481 |
Occupancy by Householder Income Bracket in Kershaw
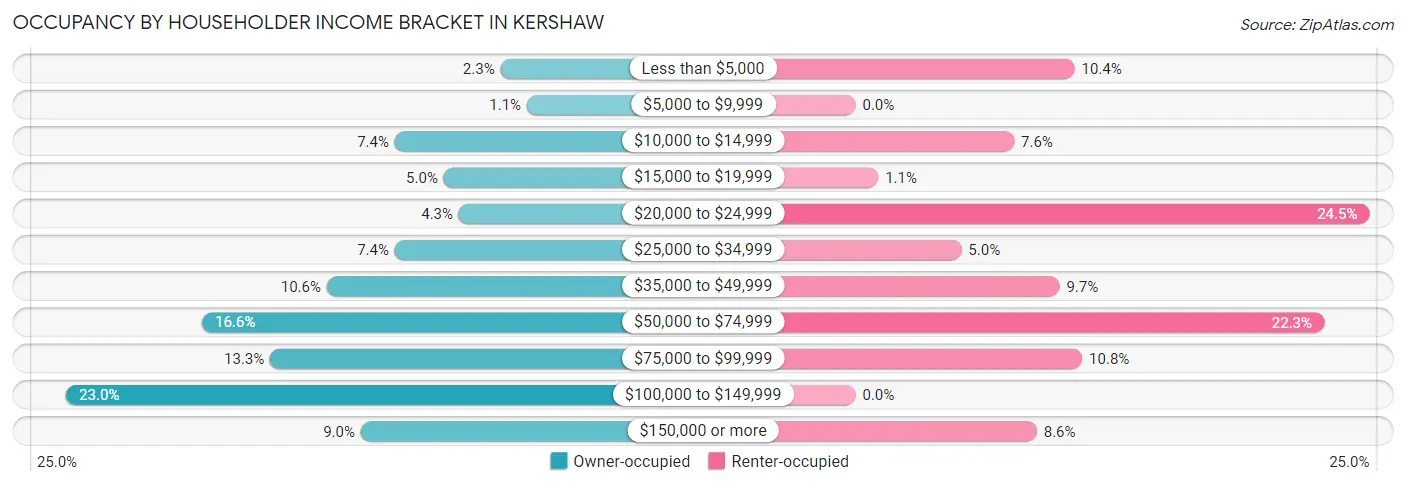
| Income Bracket | Owner-occupied | Renter-occupied |
| Less than $5,000 | 13 (2.3%) | 29 (10.4%) |
| $5,000 to $9,999 | 6 (1.1%) | 0 (0.0%) |
| $10,000 to $14,999 | 41 (7.4%) | 21 (7.5%) |
| $15,000 to $19,999 | 28 (5.0%) | 3 (1.1%) |
| $20,000 to $24,999 | 24 (4.3%) | 68 (24.5%) |
| $25,000 to $34,999 | 41 (7.4%) | 14 (5.0%) |
| $35,000 to $49,999 | 59 (10.6%) | 27 (9.7%) |
| $50,000 to $74,999 | 92 (16.6%) | 62 (22.3%) |
| $75,000 to $99,999 | 74 (13.3%) | 30 (10.8%) |
| $100,000 to $149,999 | 128 (23.0%) | 0 (0.0%) |
| $150,000 or more | 50 (9.0%) | 24 (8.6%) |
| Total | 556 (100.0%) | 278 (100.0%) |
Monthly Housing Cost Tiers in Kershaw
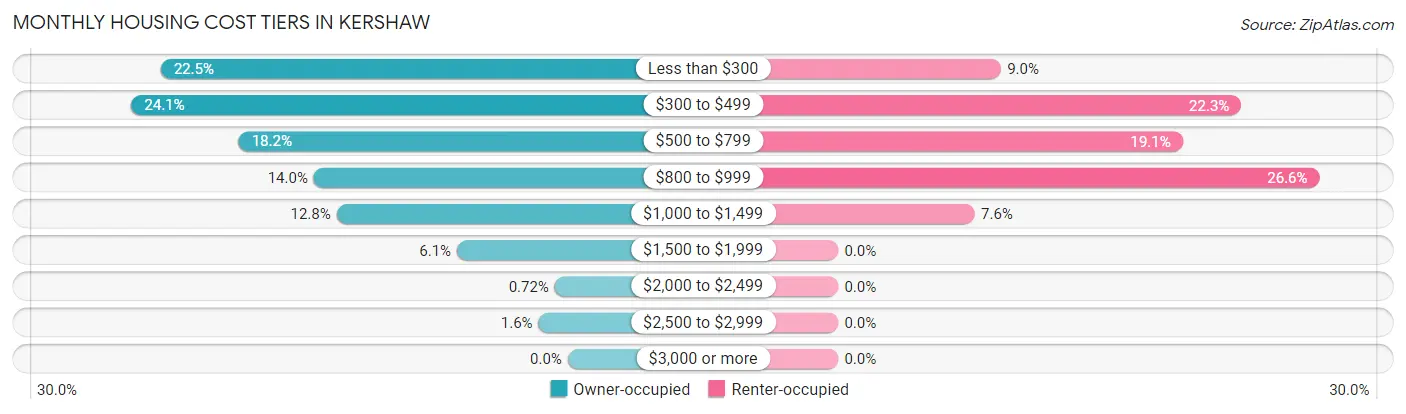
| Monthly Cost | Owner-occupied | Renter-occupied |
| Less than $300 | 125 (22.5%) | 25 (9.0%) |
| $300 to $499 | 134 (24.1%) | 62 (22.3%) |
| $500 to $799 | 101 (18.2%) | 53 (19.1%) |
| $800 to $999 | 78 (14.0%) | 74 (26.6%) |
| $1,000 to $1,499 | 71 (12.8%) | 21 (7.5%) |
| $1,500 to $1,999 | 34 (6.1%) | 0 (0.0%) |
| $2,000 to $2,499 | 4 (0.7%) | 0 (0.0%) |
| $2,500 to $2,999 | 9 (1.6%) | 0 (0.0%) |
| $3,000 or more | 0 (0.0%) | 0 (0.0%) |
| Total | 556 (100.0%) | 278 (100.0%) |
Physical Housing Characteristics in Kershaw
Housing Structures in Kershaw
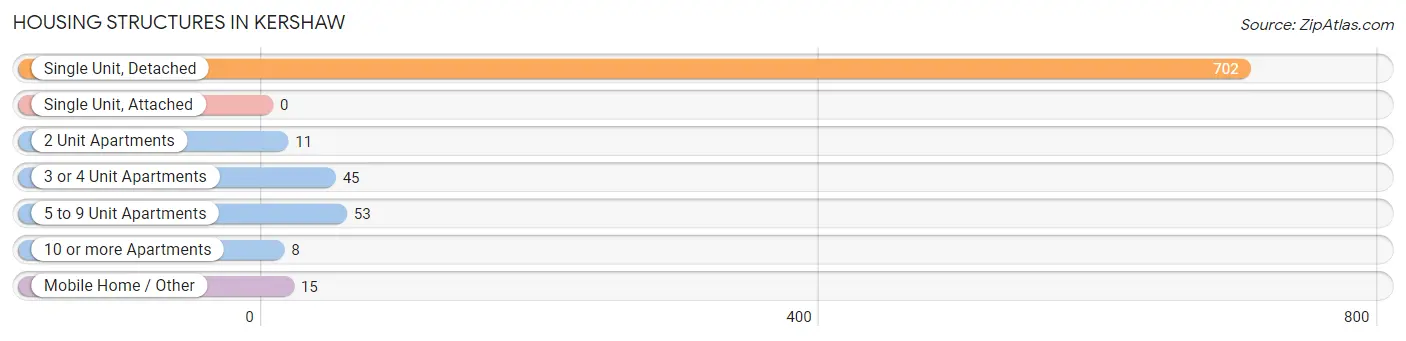
| Structure Type | # Housing Units | % Housing Units |
| Single Unit, Detached | 702 | 84.2% |
| Single Unit, Attached | 0 | 0.0% |
| 2 Unit Apartments | 11 | 1.3% |
| 3 or 4 Unit Apartments | 45 | 5.4% |
| 5 to 9 Unit Apartments | 53 | 6.4% |
| 10 or more Apartments | 8 | 1.0% |
| Mobile Home / Other | 15 | 1.8% |
| Total | 834 | 100.0% |
Housing Structures by Occupancy in Kershaw
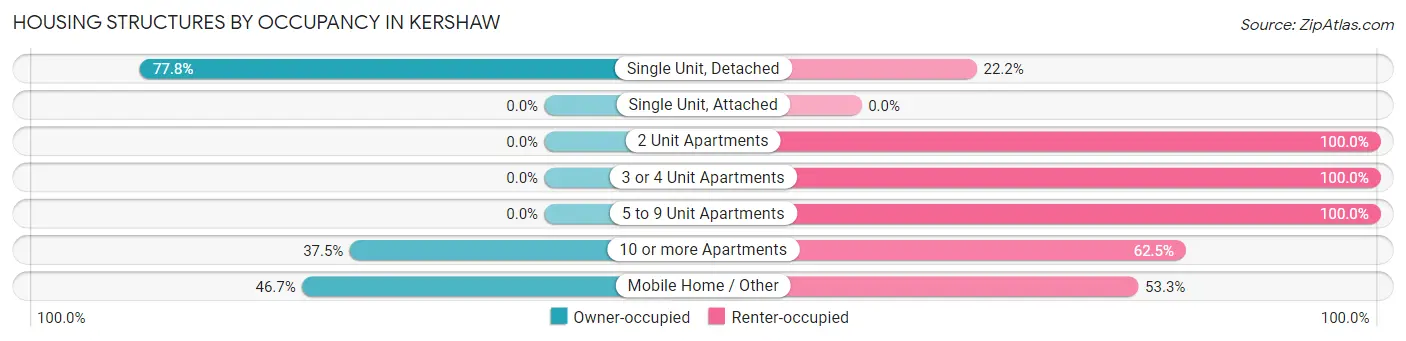
| Structure Type | Owner-occupied | Renter-occupied |
| Single Unit, Detached | 546 (77.8%) | 156 (22.2%) |
| Single Unit, Attached | 0 (0.0%) | 0 (0.0%) |
| 2 Unit Apartments | 0 (0.0%) | 11 (100.0%) |
| 3 or 4 Unit Apartments | 0 (0.0%) | 45 (100.0%) |
| 5 to 9 Unit Apartments | 0 (0.0%) | 53 (100.0%) |
| 10 or more Apartments | 3 (37.5%) | 5 (62.5%) |
| Mobile Home / Other | 7 (46.7%) | 8 (53.3%) |
| Total | 556 (66.7%) | 278 (33.3%) |
Housing Structures by Number of Rooms in Kershaw
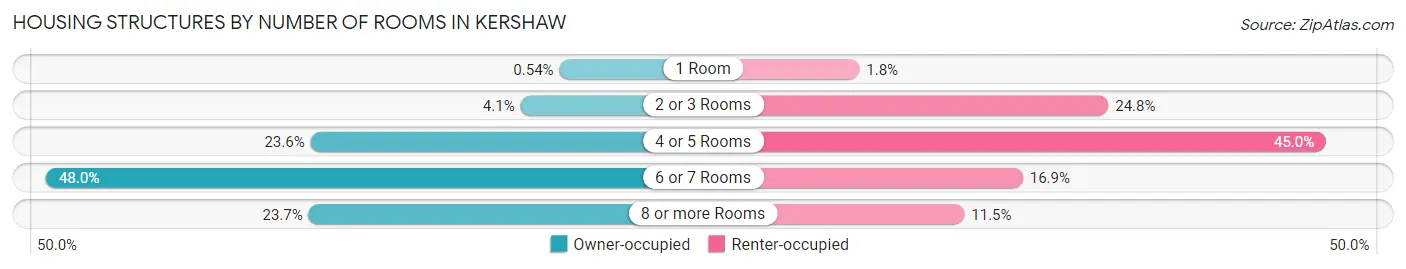
| Number of Rooms | Owner-occupied | Renter-occupied |
| 1 Room | 3 (0.5%) | 5 (1.8%) |
| 2 or 3 Rooms | 23 (4.1%) | 69 (24.8%) |
| 4 or 5 Rooms | 131 (23.6%) | 125 (45.0%) |
| 6 or 7 Rooms | 267 (48.0%) | 47 (16.9%) |
| 8 or more Rooms | 132 (23.7%) | 32 (11.5%) |
| Total | 556 (100.0%) | 278 (100.0%) |
Housing Structure by Heating Type in Kershaw
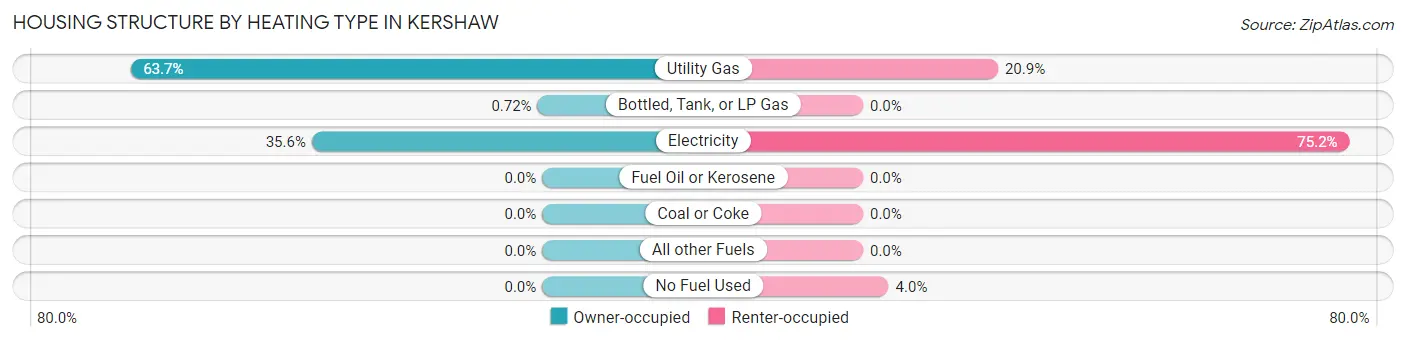
| Heating Type | Owner-occupied | Renter-occupied |
| Utility Gas | 354 (63.7%) | 58 (20.9%) |
| Bottled, Tank, or LP Gas | 4 (0.7%) | 0 (0.0%) |
| Electricity | 198 (35.6%) | 209 (75.2%) |
| Fuel Oil or Kerosene | 0 (0.0%) | 0 (0.0%) |
| Coal or Coke | 0 (0.0%) | 0 (0.0%) |
| All other Fuels | 0 (0.0%) | 0 (0.0%) |
| No Fuel Used | 0 (0.0%) | 11 (4.0%) |
| Total | 556 (100.0%) | 278 (100.0%) |
Household Vehicle Usage in Kershaw
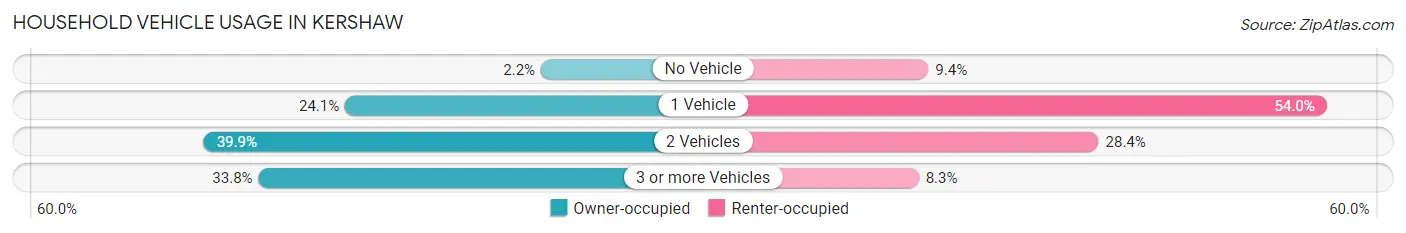
| Vehicles per Household | Owner-occupied | Renter-occupied |
| No Vehicle | 12 (2.2%) | 26 (9.3%) |
| 1 Vehicle | 134 (24.1%) | 150 (54.0%) |
| 2 Vehicles | 222 (39.9%) | 79 (28.4%) |
| 3 or more Vehicles | 188 (33.8%) | 23 (8.3%) |
| Total | 556 (100.0%) | 278 (100.0%) |
Real Estate & Mortgages in Kershaw
Real Estate and Mortgage Overview in Kershaw
| Characteristic | Without Mortgage | With Mortgage |
| Housing Units | 306 | 250 |
| Median Property Value | $123,900 | $149,000 |
| Median Household Income | $52,000 | $35 |
| Monthly Housing Costs | $338 | $0 |
| Real Estate Taxes | $382 | $6 |
Property Value by Mortgage Status in Kershaw
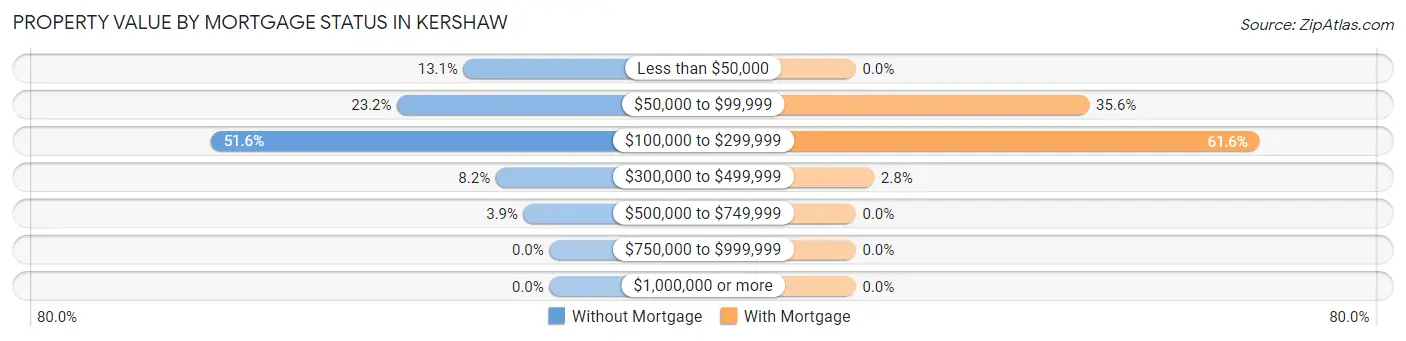
| Property Value | Without Mortgage | With Mortgage |
| Less than $50,000 | 40 (13.1%) | 0 (0.0%) |
| $50,000 to $99,999 | 71 (23.2%) | 89 (35.6%) |
| $100,000 to $299,999 | 158 (51.6%) | 154 (61.6%) |
| $300,000 to $499,999 | 25 (8.2%) | 7 (2.8%) |
| $500,000 to $749,999 | 12 (3.9%) | 0 (0.0%) |
| $750,000 to $999,999 | 0 (0.0%) | 0 (0.0%) |
| $1,000,000 or more | 0 (0.0%) | 0 (0.0%) |
| Total | 306 (100.0%) | 250 (100.0%) |
Household Income by Mortgage Status in Kershaw
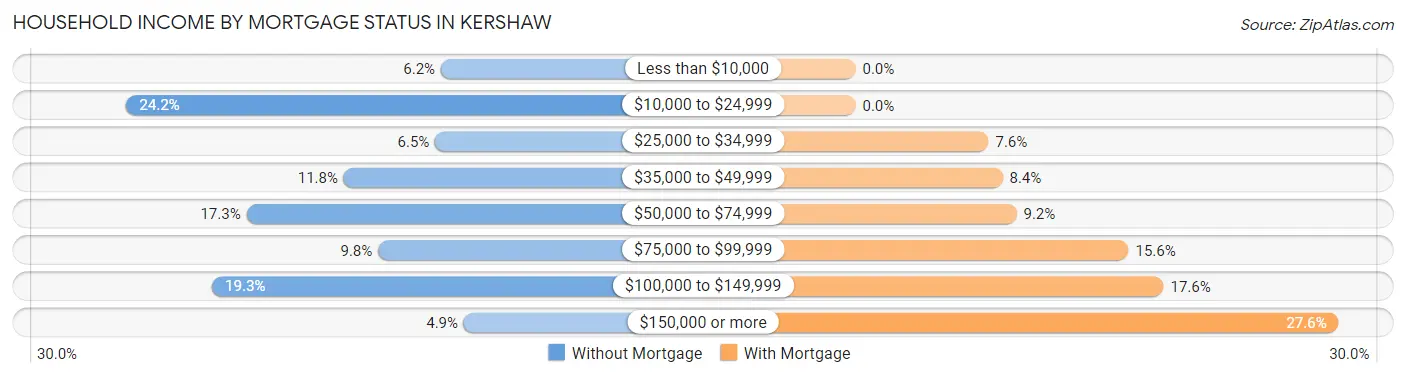
| Household Income | Without Mortgage | With Mortgage |
| Less than $10,000 | 19 (6.2%) | 0 (0.0%) |
| $10,000 to $24,999 | 74 (24.2%) | 0 (0.0%) |
| $25,000 to $34,999 | 20 (6.5%) | 19 (7.6%) |
| $35,000 to $49,999 | 36 (11.8%) | 21 (8.4%) |
| $50,000 to $74,999 | 53 (17.3%) | 23 (9.2%) |
| $75,000 to $99,999 | 30 (9.8%) | 39 (15.6%) |
| $100,000 to $149,999 | 59 (19.3%) | 44 (17.6%) |
| $150,000 or more | 15 (4.9%) | 69 (27.6%) |
| Total | 306 (100.0%) | 250 (100.0%) |
Property Value to Household Income Ratio in Kershaw
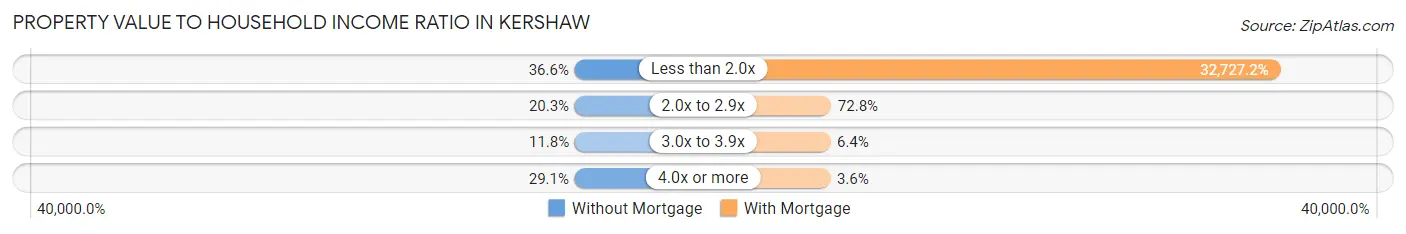
| Value-to-Income Ratio | Without Mortgage | With Mortgage |
| Less than 2.0x | 112 (36.6%) | 81,818 (32,727.2%) |
| 2.0x to 2.9x | 62 (20.3%) | 182 (72.8%) |
| 3.0x to 3.9x | 36 (11.8%) | 16 (6.4%) |
| 4.0x or more | 89 (29.1%) | 9 (3.6%) |
| Total | 306 (100.0%) | 250 (100.0%) |
Real Estate Taxes by Mortgage Status in Kershaw
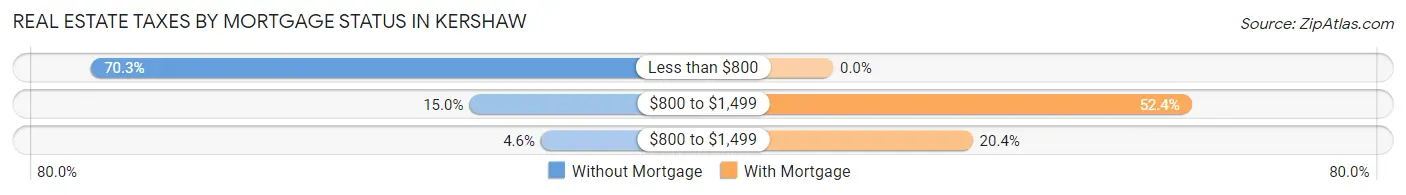
| Property Taxes | Without Mortgage | With Mortgage |
| Less than $800 | 215 (70.3%) | 0 (0.0%) |
| $800 to $1,499 | 46 (15.0%) | 131 (52.4%) |
| $800 to $1,499 | 14 (4.6%) | 51 (20.4%) |
| Total | 306 (100.0%) | 250 (100.0%) |
Health & Disability in Kershaw
Health Insurance Coverage by Age in Kershaw
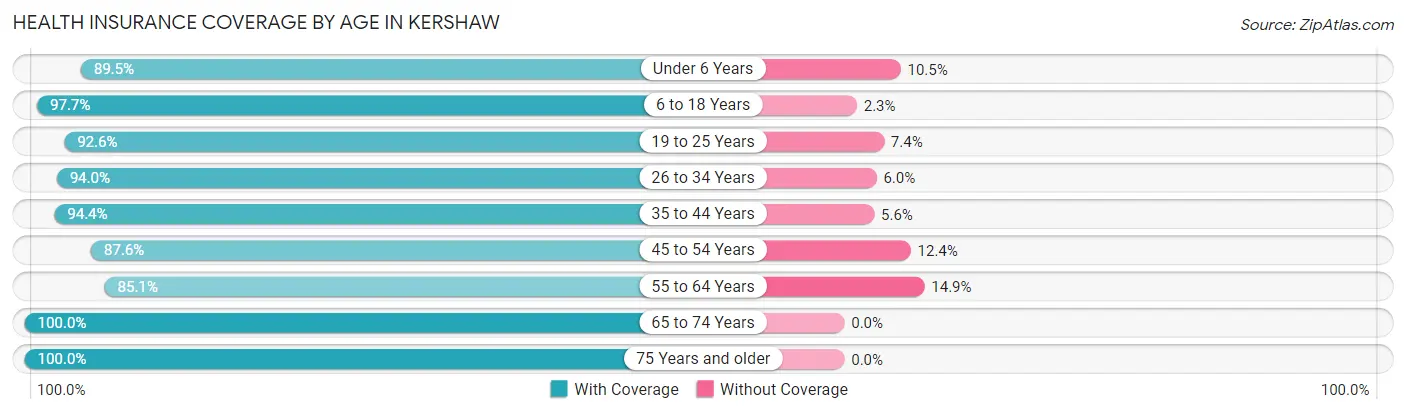
| Age Bracket | With Coverage | Without Coverage |
| Under 6 Years | 350 (89.5%) | 41 (10.5%) |
| 6 to 18 Years | 377 (97.7%) | 9 (2.3%) |
| 19 to 25 Years | 188 (92.6%) | 15 (7.4%) |
| 26 to 34 Years | 235 (94.0%) | 15 (6.0%) |
| 35 to 44 Years | 238 (94.4%) | 14 (5.6%) |
| 45 to 54 Years | 248 (87.6%) | 35 (12.4%) |
| 55 to 64 Years | 171 (85.1%) | 30 (14.9%) |
| 65 to 74 Years | 166 (100.0%) | 0 (0.0%) |
| 75 Years and older | 175 (100.0%) | 0 (0.0%) |
| Total | 2,148 (93.1%) | 159 (6.9%) |
Health Insurance Coverage by Citizenship Status in Kershaw
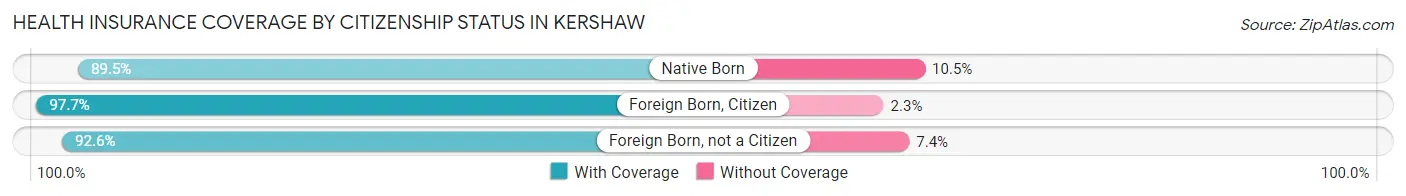
| Citizenship Status | With Coverage | Without Coverage |
| Native Born | 350 (89.5%) | 41 (10.5%) |
| Foreign Born, Citizen | 377 (97.7%) | 9 (2.3%) |
| Foreign Born, not a Citizen | 188 (92.6%) | 15 (7.4%) |
Health Insurance Coverage by Household Income in Kershaw
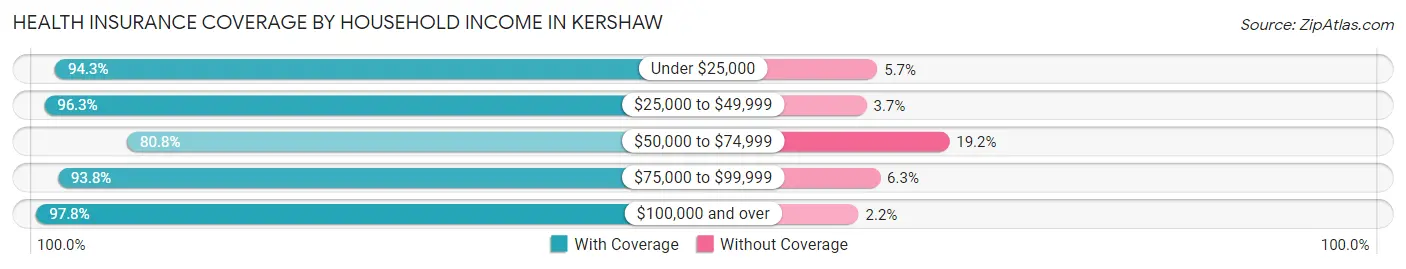
| Household Income | With Coverage | Without Coverage |
| Under $25,000 | 429 (94.3%) | 26 (5.7%) |
| $25,000 to $49,999 | 469 (96.3%) | 18 (3.7%) |
| $50,000 to $74,999 | 345 (80.8%) | 82 (19.2%) |
| $75,000 to $99,999 | 285 (93.8%) | 19 (6.2%) |
| $100,000 and over | 620 (97.8%) | 14 (2.2%) |
Public vs Private Health Insurance Coverage by Age in Kershaw
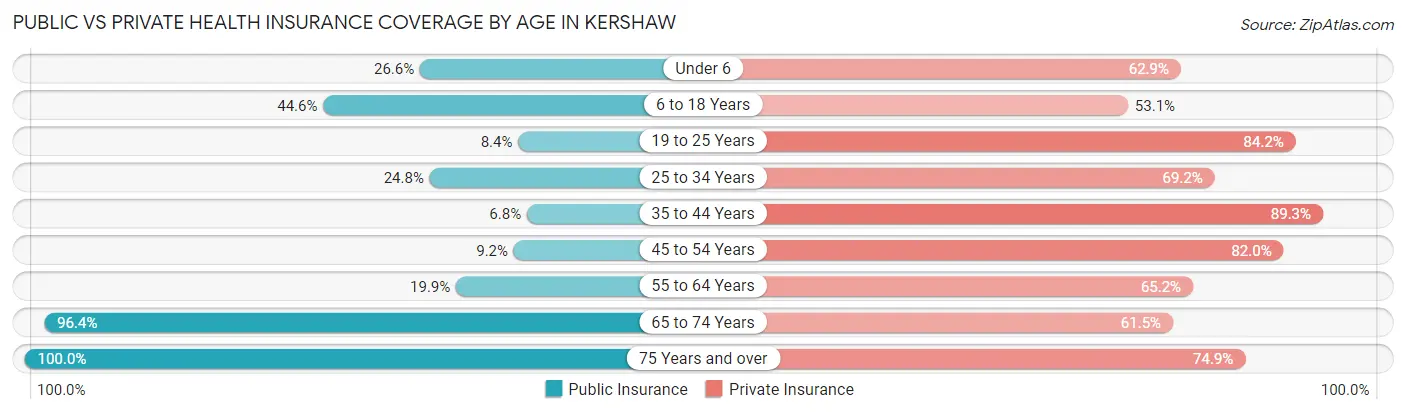
| Age Bracket | Public Insurance | Private Insurance |
| Under 6 | 104 (26.6%) | 246 (62.9%) |
| 6 to 18 Years | 172 (44.6%) | 205 (53.1%) |
| 19 to 25 Years | 17 (8.4%) | 171 (84.2%) |
| 25 to 34 Years | 62 (24.8%) | 173 (69.2%) |
| 35 to 44 Years | 17 (6.8%) | 225 (89.3%) |
| 45 to 54 Years | 26 (9.2%) | 232 (82.0%) |
| 55 to 64 Years | 40 (19.9%) | 131 (65.2%) |
| 65 to 74 Years | 160 (96.4%) | 102 (61.5%) |
| 75 Years and over | 175 (100.0%) | 131 (74.9%) |
| Total | 773 (33.5%) | 1,616 (70.1%) |
Disability Status by Sex by Age in Kershaw
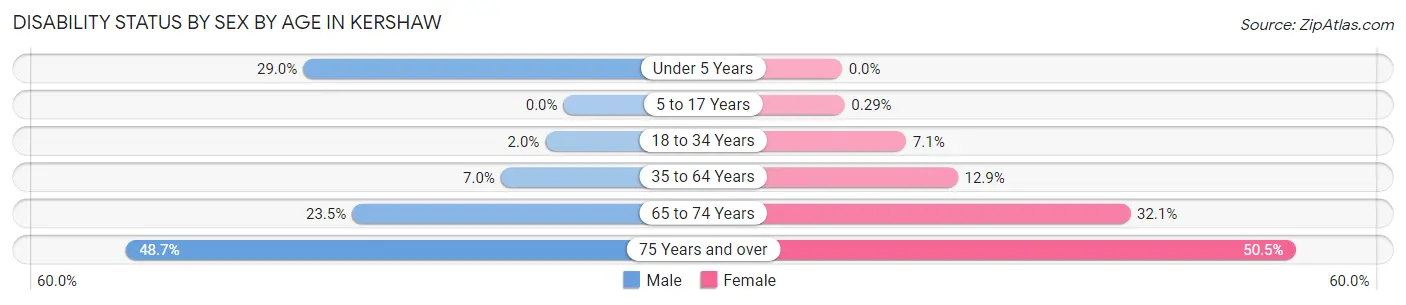
| Age Bracket | Male | Female |
| Under 5 Years | 40 (29.0%) | 0 (0.0%) |
| 5 to 17 Years | 0 (0.0%) | 1 (0.3%) |
| 18 to 34 Years | 4 (2.0%) | 19 (7.1%) |
| 35 to 64 Years | 27 (7.0%) | 45 (12.9%) |
| 65 to 74 Years | 20 (23.5%) | 26 (32.1%) |
| 75 Years and over | 37 (48.7%) | 50 (50.5%) |
Disability Class by Sex by Age in Kershaw
Disability Class: Hearing Difficulty
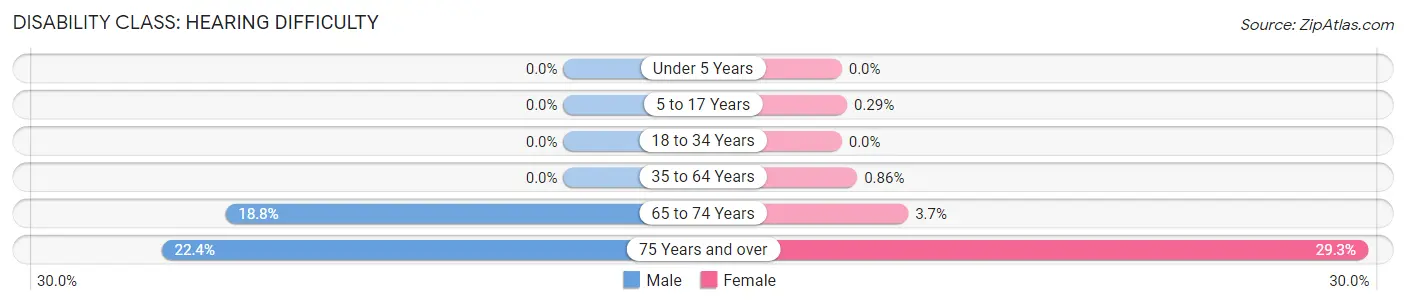
| Age Bracket | Male | Female |
| Under 5 Years | 0 (0.0%) | 0 (0.0%) |
| 5 to 17 Years | 0 (0.0%) | 1 (0.3%) |
| 18 to 34 Years | 0 (0.0%) | 0 (0.0%) |
| 35 to 64 Years | 0 (0.0%) | 3 (0.9%) |
| 65 to 74 Years | 16 (18.8%) | 3 (3.7%) |
| 75 Years and over | 17 (22.4%) | 29 (29.3%) |
Disability Class: Vision Difficulty
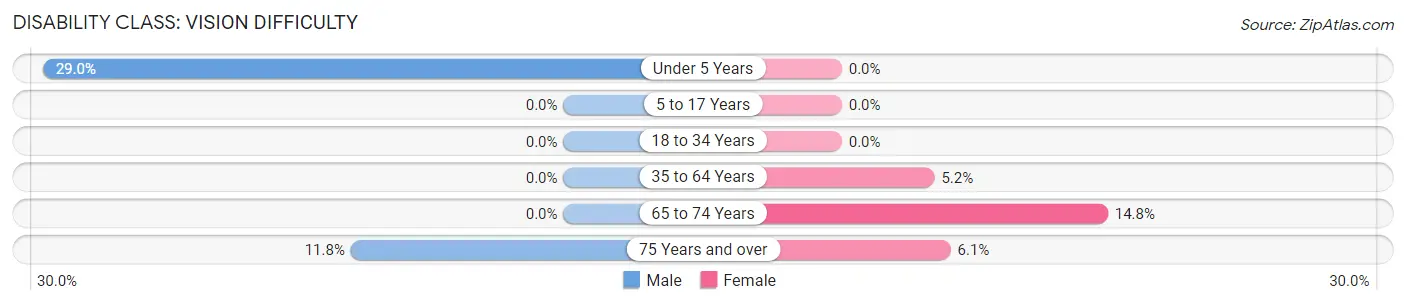
| Age Bracket | Male | Female |
| Under 5 Years | 40 (29.0%) | 0 (0.0%) |
| 5 to 17 Years | 0 (0.0%) | 0 (0.0%) |
| 18 to 34 Years | 0 (0.0%) | 0 (0.0%) |
| 35 to 64 Years | 0 (0.0%) | 18 (5.2%) |
| 65 to 74 Years | 0 (0.0%) | 12 (14.8%) |
| 75 Years and over | 9 (11.8%) | 6 (6.1%) |
Disability Class: Cognitive Difficulty
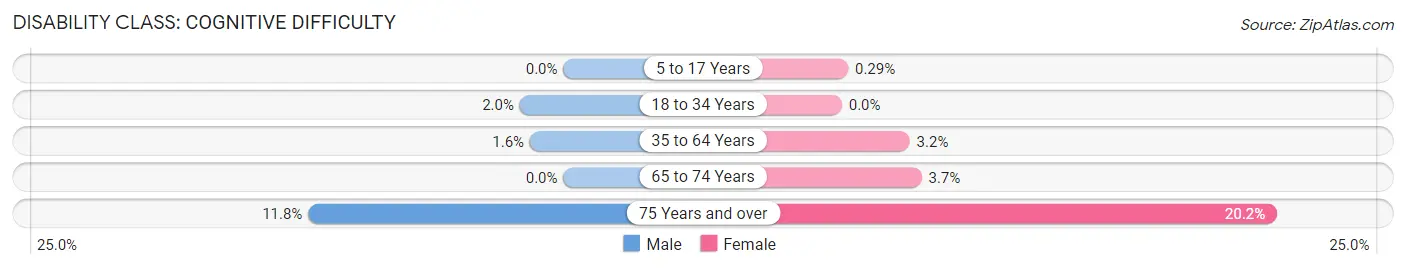
| Age Bracket | Male | Female |
| 5 to 17 Years | 0 (0.0%) | 1 (0.3%) |
| 18 to 34 Years | 4 (2.0%) | 0 (0.0%) |
| 35 to 64 Years | 6 (1.5%) | 11 (3.2%) |
| 65 to 74 Years | 0 (0.0%) | 3 (3.7%) |
| 75 Years and over | 9 (11.8%) | 20 (20.2%) |
Disability Class: Ambulatory Difficulty
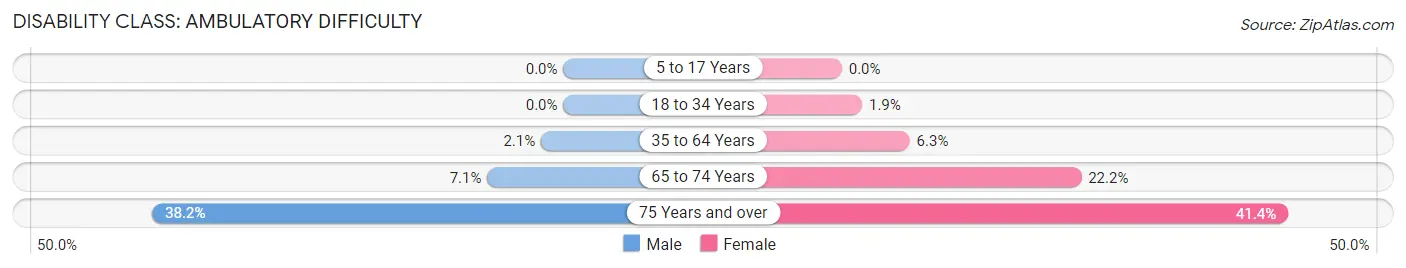
| Age Bracket | Male | Female |
| 5 to 17 Years | 0 (0.0%) | 0 (0.0%) |
| 18 to 34 Years | 0 (0.0%) | 5 (1.9%) |
| 35 to 64 Years | 8 (2.1%) | 22 (6.3%) |
| 65 to 74 Years | 6 (7.1%) | 18 (22.2%) |
| 75 Years and over | 29 (38.2%) | 41 (41.4%) |
Disability Class: Self-Care Difficulty
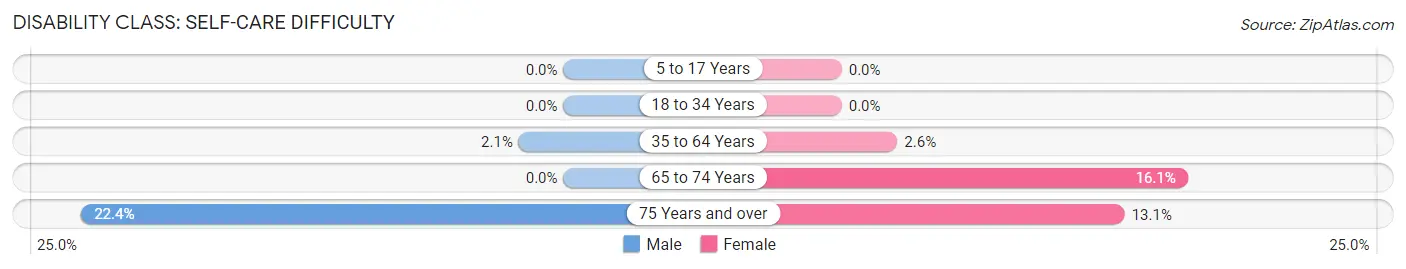
| Age Bracket | Male | Female |
| 5 to 17 Years | 0 (0.0%) | 0 (0.0%) |
| 18 to 34 Years | 0 (0.0%) | 0 (0.0%) |
| 35 to 64 Years | 8 (2.1%) | 9 (2.6%) |
| 65 to 74 Years | 0 (0.0%) | 13 (16.1%) |
| 75 Years and over | 17 (22.4%) | 13 (13.1%) |
Technology Access in Kershaw
Computing Device Access in Kershaw
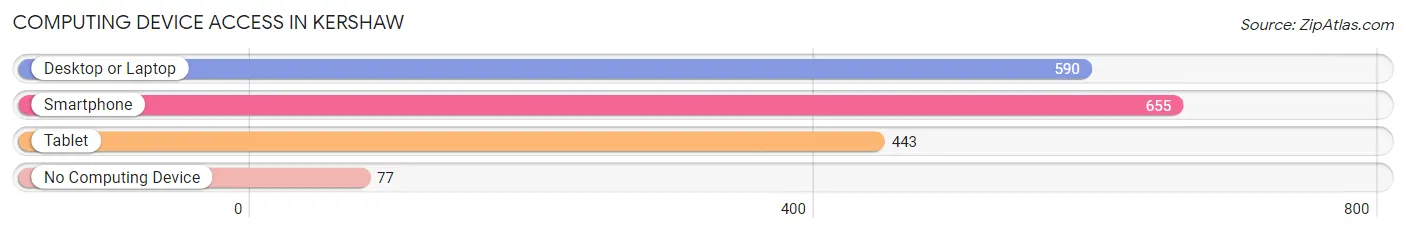
| Device Type | # Households | % Households |
| Desktop or Laptop | 590 | 70.7% |
| Smartphone | 655 | 78.5% |
| Tablet | 443 | 53.1% |
| No Computing Device | 77 | 9.2% |
| Total | 834 | 100.0% |
Internet Access in Kershaw
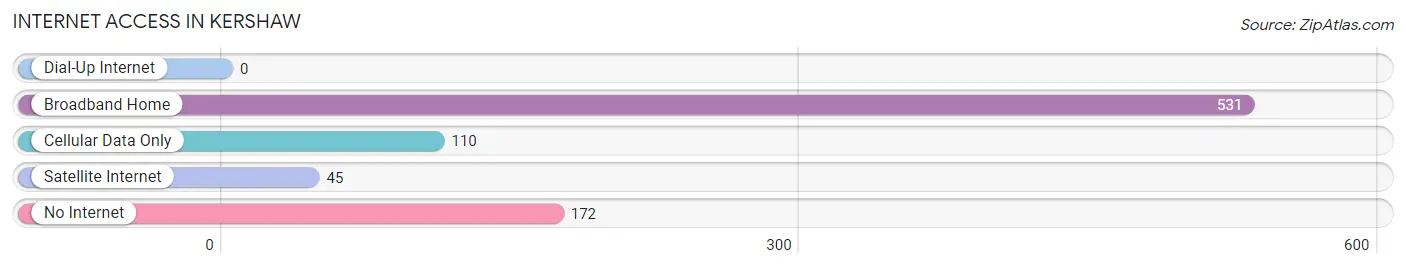
| Internet Type | # Households | % Households |
| Dial-Up Internet | 0 | 0.0% |
| Broadband Home | 531 | 63.7% |
| Cellular Data Only | 110 | 13.2% |
| Satellite Internet | 45 | 5.4% |
| No Internet | 172 | 20.6% |
| Total | 834 | 100.0% |
Kershaw Summary
Kershaw, South Carolina is a small town located in Lancaster County, South Carolina. It is situated approximately 40 miles south of Charlotte, North Carolina and is part of the Charlotte metropolitan area. The town has a population of approximately 2,000 people and is the county seat of Lancaster County.
Geography
Kershaw is located in the Piedmont region of South Carolina, which is characterized by rolling hills and flat plains. The town is situated on the Catawba River, which is a major tributary of the Wateree River. The town is located at an elevation of approximately 500 feet above sea level. The climate in Kershaw is humid subtropical, with hot, humid summers and mild winters.
Economy
Kershaw’s economy is largely based on agriculture and manufacturing. The town is home to several large farms, which produce a variety of crops, including corn, soybeans, cotton, and tobacco. The town is also home to several manufacturing plants, which produce a variety of products, including furniture, textiles, and automotive parts.
Demographics
As of the 2010 census, the population of Kershaw was 2,000 people. The racial makeup of the town was 79.3% White, 17.2% African American, 0.7% Native American, 0.3% Asian, 0.1% Pacific Islander, and 2.4% from other races. The median household income in Kershaw was $31,250, and the median family income was $37,500.
History
Kershaw was founded in 1732 by a group of settlers from Pennsylvania. The town was named after Colonel Joseph Kershaw, who was a prominent local landowner. The town was incorporated in 1825 and was designated as the county seat of Lancaster County in 1826.
Kershaw has a long history of involvement in the Civil War. The town was the site of several battles during the war, including the Battle of Camden in 1780 and the Battle of Hanging Rock in 1781. The town was also the site of the Battle of Wyse Fork in 1865, which was the last major battle of the Civil War.
Kershaw has also been home to several notable figures, including the first African-American mayor of a South Carolina town, John W. Brown, who served from 1868 to 1872. The town is also the birthplace of the late Senator Strom Thurmond, who served as the Governor of South Carolina from 1947 to 1951.
Kershaw is a small town with a rich history and a vibrant economy. The town is home to a diverse population and is a great place to live and work.
Common Questions
What is Per Capita Income in Kershaw?
Per Capita income in Kershaw is $29,054.
What is the Median Family Income in Kershaw?
Median Family Income in Kershaw is $69,293.
What is the Median Household income in Kershaw?
Median Household Income in Kershaw is $55,481.
What is Income or Wage Gap in Kershaw?
Income or Wage Gap in Kershaw is 25.2%.
Women in Kershaw earn 74.8 cents for every dollar earned by a man.
What is Inequality or Gini Index in Kershaw?
Inequality or Gini Index in Kershaw is 0.48.
What is the Total Population of Kershaw?
Total Population of Kershaw is 2,311.
What is the Total Male Population of Kershaw?
Total Male Population of Kershaw is 1,050.
What is the Total Female Population of Kershaw?
Total Female Population of Kershaw is 1,261.
What is the Ratio of Males per 100 Females in Kershaw?
There are 83.27 Males per 100 Females in Kershaw.
What is the Ratio of Females per 100 Males in Kershaw?
There are 120.10 Females per 100 Males in Kershaw.
What is the Median Population Age in Kershaw?
Median Population Age in Kershaw is 31.9 Years.
What is the Average Family Size in Kershaw
Average Family Size in Kershaw is 3.3 People.
What is the Average Household Size in Kershaw
Average Household Size in Kershaw is 2.8 People.
How Large is the Labor Force in Kershaw?
There are 1,002 People in the Labor Forcein in Kershaw.
What is the Percentage of People in the Labor Force in Kershaw?
62.8% of People are in the Labor Force in Kershaw.
What is the Unemployment Rate in Kershaw?
Unemployment Rate in Kershaw is 2.8%.