Mount Croghan, SC Map & Demographics
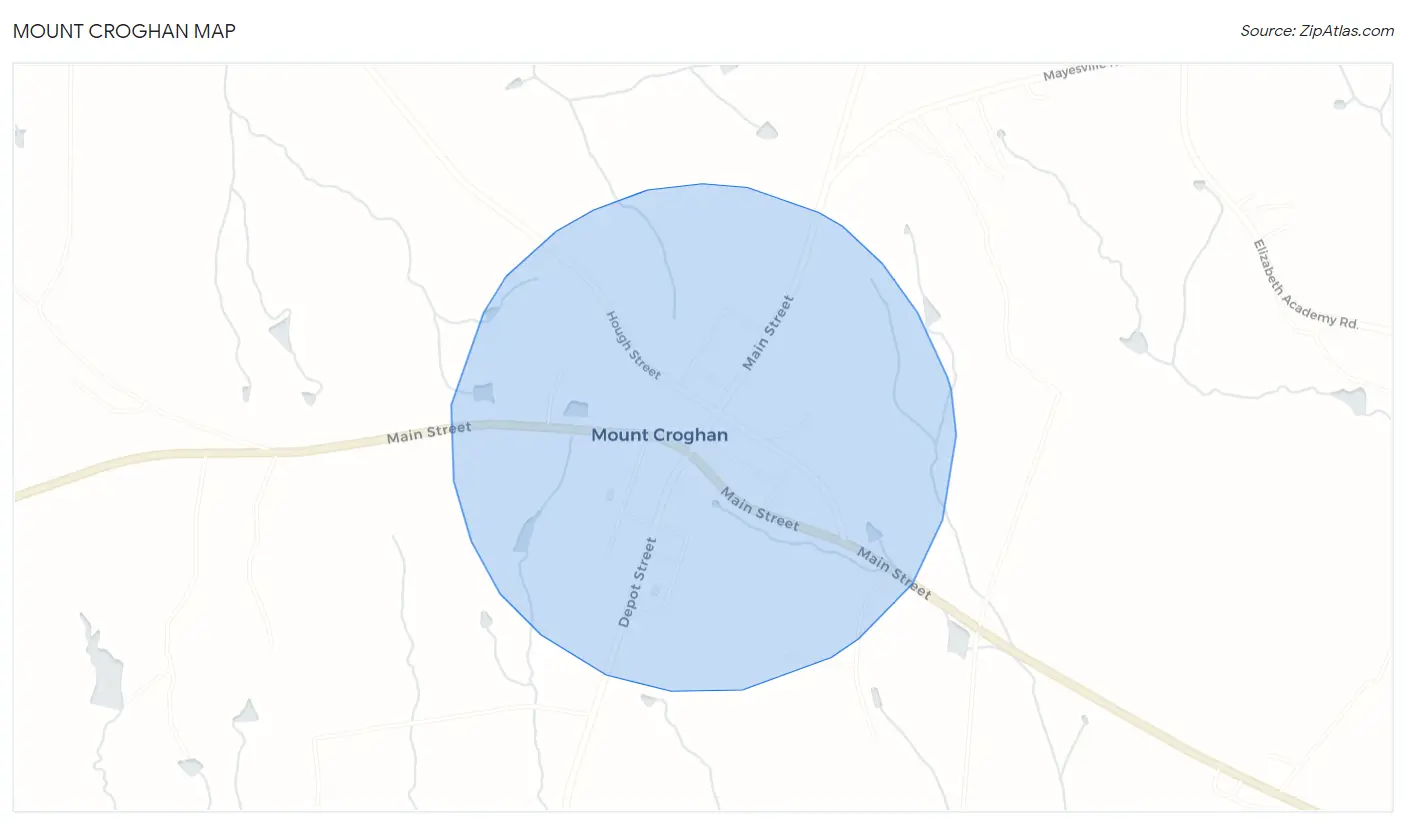
Mount Croghan Map
Mount Croghan Overview
$26,131
PER CAPITA INCOME
$85,602
AVG FAMILY INCOME
$71,875
AVG HOUSEHOLD INCOME
32.0%
WAGE / INCOME GAP [ % ]
68.0¢/ $1
WAGE / INCOME GAP [ $ ]
0.30
INEQUALITY / GINI INDEX
177
TOTAL POPULATION
92
MALE POPULATION
85
FEMALE POPULATION
108.24
MALES / 100 FEMALES
92.39
FEMALES / 100 MALES
49.8
MEDIAN AGE
2.8
AVG FAMILY SIZE
2.3
AVG HOUSEHOLD SIZE
66
LABOR FORCE [ PEOPLE ]
42.0%
PERCENT IN LABOR FORCE
Mount Croghan Zip Codes
Mount Croghan Area Codes
Income in Mount Croghan
Income Overview in Mount Croghan
Per Capita Income in Mount Croghan is $26,131, while median incomes of families and households are $85,602 and $71,875 respectively.
| Characteristic | Number | Measure |
| Per Capita Income | 177 | $26,131 |
| Median Family Income | 55 | $85,602 |
| Mean Family Income | 55 | $71,473 |
| Median Household Income | 77 | $71,875 |
| Mean Household Income | 77 | $62,887 |
| Income Deficit | 55 | $0 |
| Wage / Income Gap (%) | 177 | 31.96% |
| Wage / Income Gap ($) | 177 | 68.04¢ per $1 |
| Gini / Inequality Index | 177 | 0.30 |
Earnings by Sex in Mount Croghan
Average Earnings in Mount Croghan are $40,887, $41,336 for men and $28,125 for women, a difference of 32.0%.
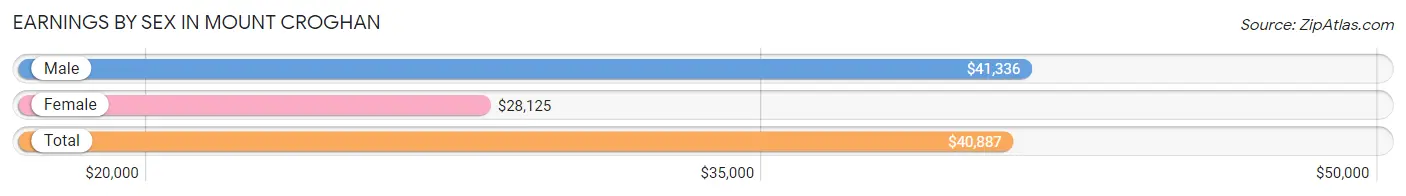
| Sex | Number | Average Earnings |
| Male | 43 (65.1%) | $41,336 |
| Female | 23 (34.8%) | $28,125 |
| Total | 66 (100.0%) | $40,887 |
Earnings by Sex by Income Bracket in Mount Croghan
The most common earnings brackets in Mount Croghan are $40,000 to $44,999 for men (29 | 67.4%) and $25,000 to $29,999 for women (4 | 17.4%).
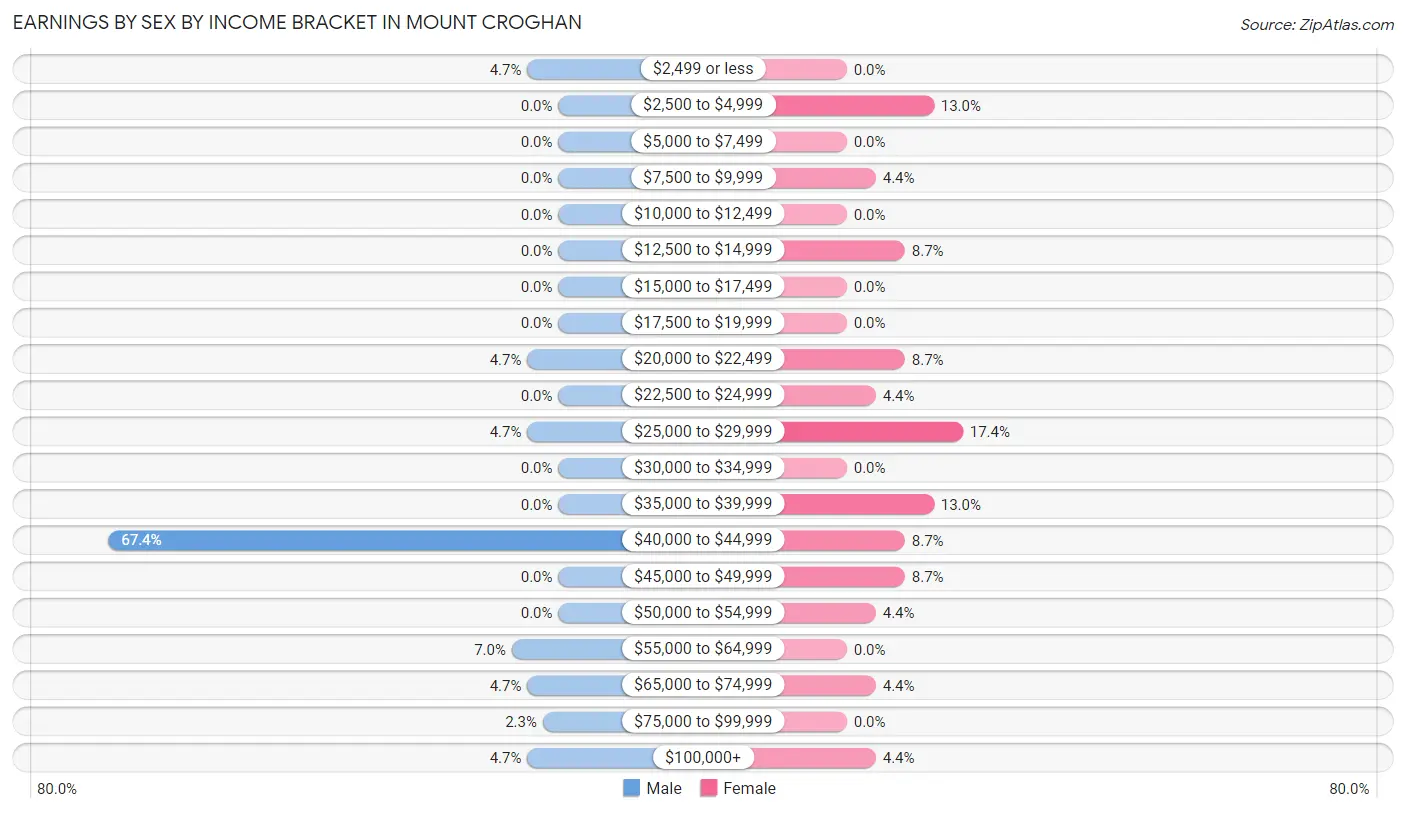
| Income | Male | Female |
| $2,499 or less | 2 (4.6%) | 0 (0.0%) |
| $2,500 to $4,999 | 0 (0.0%) | 3 (13.0%) |
| $5,000 to $7,499 | 0 (0.0%) | 0 (0.0%) |
| $7,500 to $9,999 | 0 (0.0%) | 1 (4.3%) |
| $10,000 to $12,499 | 0 (0.0%) | 0 (0.0%) |
| $12,500 to $14,999 | 0 (0.0%) | 2 (8.7%) |
| $15,000 to $17,499 | 0 (0.0%) | 0 (0.0%) |
| $17,500 to $19,999 | 0 (0.0%) | 0 (0.0%) |
| $20,000 to $22,499 | 2 (4.6%) | 2 (8.7%) |
| $22,500 to $24,999 | 0 (0.0%) | 1 (4.3%) |
| $25,000 to $29,999 | 2 (4.6%) | 4 (17.4%) |
| $30,000 to $34,999 | 0 (0.0%) | 0 (0.0%) |
| $35,000 to $39,999 | 0 (0.0%) | 3 (13.0%) |
| $40,000 to $44,999 | 29 (67.4%) | 2 (8.7%) |
| $45,000 to $49,999 | 0 (0.0%) | 2 (8.7%) |
| $50,000 to $54,999 | 0 (0.0%) | 1 (4.3%) |
| $55,000 to $64,999 | 3 (7.0%) | 0 (0.0%) |
| $65,000 to $74,999 | 2 (4.6%) | 1 (4.3%) |
| $75,000 to $99,999 | 1 (2.3%) | 0 (0.0%) |
| $100,000+ | 2 (4.6%) | 1 (4.3%) |
| Total | 43 (100.0%) | 23 (100.0%) |
Earnings by Sex by Educational Attainment in Mount Croghan
Average earnings in Mount Croghan are $41,422 for men and $29,375 for women, a difference of 29.1%. Men with an educational attainment of high school diploma enjoy the highest average annual earnings of $56,250, while those with college or associate's degree education earn the least with $41,343. Women with an educational attainment of high school diploma earn the most with the average annual earnings of $38,333, while those with college or associate's degree education have the smallest earnings of $23,750.
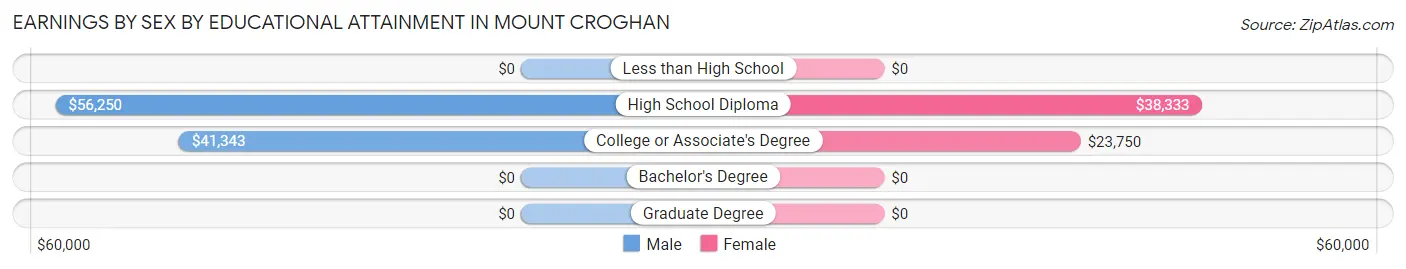
| Educational Attainment | Male Income | Female Income |
| Less than High School | - | - |
| High School Diploma | $56,250 | $38,333 |
| College or Associate's Degree | $41,343 | $23,750 |
| Bachelor's Degree | - | - |
| Graduate Degree | - | - |
| Total | $41,422 | $29,375 |
Family Income in Mount Croghan
Family Income Brackets in Mount Croghan
According to the Mount Croghan family income data, there are 30 families falling into the $75,000 to $99,999 income range, which is the most common income bracket and makes up 54.5% of all families.
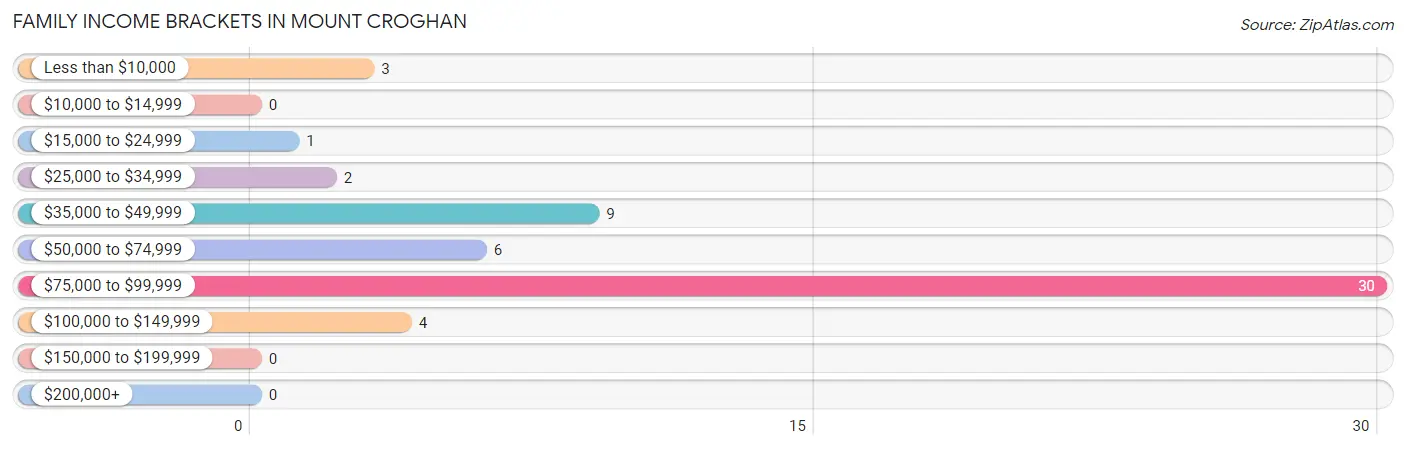
| Income Bracket | # Families | % Families |
| Less than $10,000 | 3 | 5.5% |
| $10,000 to $14,999 | 0 | 0.0% |
| $15,000 to $24,999 | 1 | 1.8% |
| $25,000 to $34,999 | 2 | 3.6% |
| $35,000 to $49,999 | 9 | 16.4% |
| $50,000 to $74,999 | 6 | 10.9% |
| $75,000 to $99,999 | 30 | 54.5% |
| $100,000 to $149,999 | 4 | 7.3% |
| $150,000 to $199,999 | 0 | 0.0% |
| $200,000+ | 0 | 0.0% |
Family Income by Famaliy Size in Mount Croghan
3-person families (32 | 58.2%) account for the highest median family income in Mount Croghan with $86,296 per family, while 3-person families (32 | 58.2%) have the highest median income of $28,765 per family member.
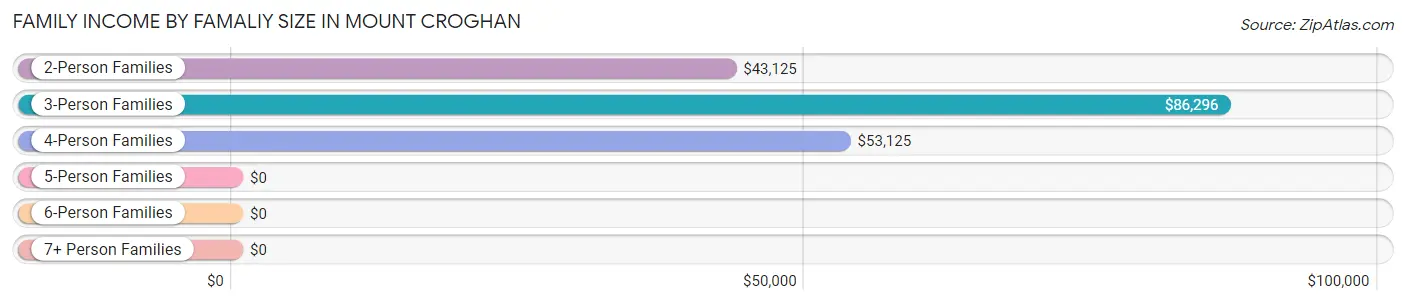
| Income Bracket | # Families | Median Income |
| 2-Person Families | 17 (30.9%) | $43,125 |
| 3-Person Families | 32 (58.2%) | $86,296 |
| 4-Person Families | 5 (9.1%) | $53,125 |
| 5-Person Families | 0 (0.0%) | $0 |
| 6-Person Families | 1 (1.8%) | $0 |
| 7+ Person Families | 0 (0.0%) | $0 |
| Total | 55 (100.0%) | $85,602 |
Family Income by Number of Earners in Mount Croghan
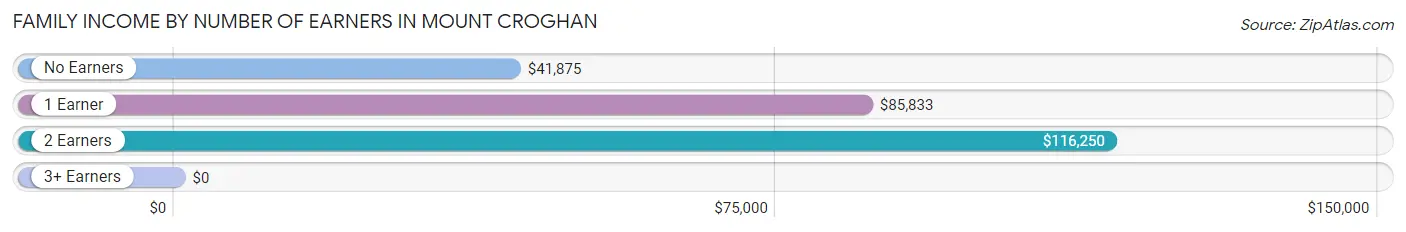
| Number of Earners | # Families | Median Income |
| No Earners | 7 (12.7%) | $41,875 |
| 1 Earner | 42 (76.4%) | $85,833 |
| 2 Earners | 6 (10.9%) | $116,250 |
| 3+ Earners | 0 (0.0%) | $0 |
| Total | 55 (100.0%) | $85,602 |
Household Income in Mount Croghan
Household Income Brackets in Mount Croghan
With 31 households falling in the category, the $75,000 to $99,999 income range is the most frequent in Mount Croghan, accounting for 40.3% of all households.
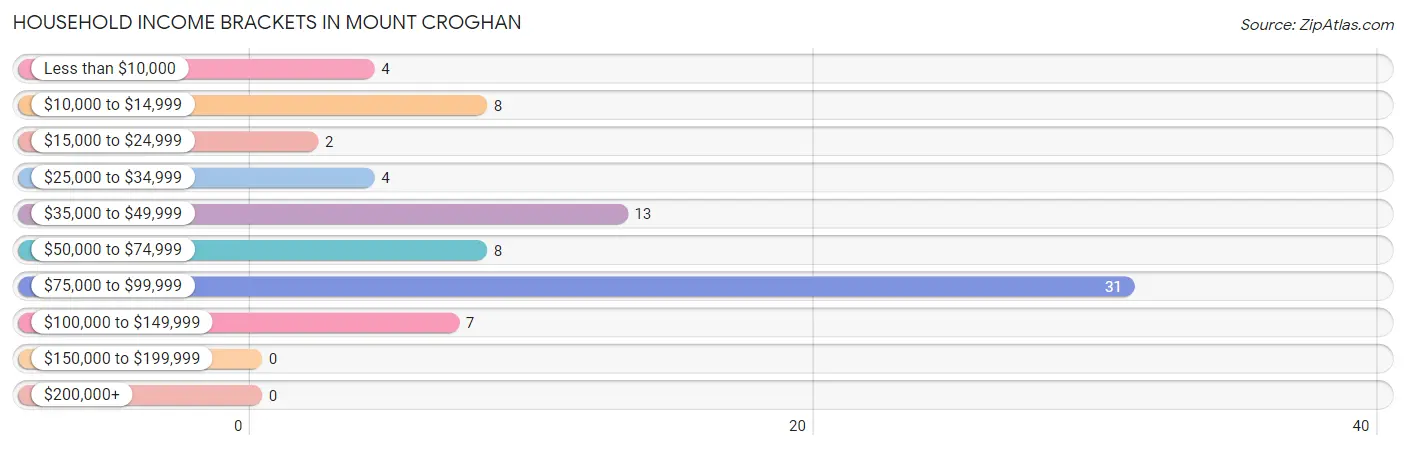
| Income Bracket | # Households | % Households |
| Less than $10,000 | 4 | 5.2% |
| $10,000 to $14,999 | 8 | 10.4% |
| $15,000 to $24,999 | 2 | 2.6% |
| $25,000 to $34,999 | 4 | 5.2% |
| $35,000 to $49,999 | 13 | 16.9% |
| $50,000 to $74,999 | 8 | 10.4% |
| $75,000 to $99,999 | 31 | 40.3% |
| $100,000 to $149,999 | 7 | 9.1% |
| $150,000 to $199,999 | 0 | 0.0% |
| $200,000+ | 0 | 0.0% |
Household Income by Householder Age in Mount Croghan
The median household income in Mount Croghan is $71,875, with the highest median household income of $85,602 found in the 45 to 64 years age bracket for the primary householder. A total of 49 households (63.6%) fall into this category.
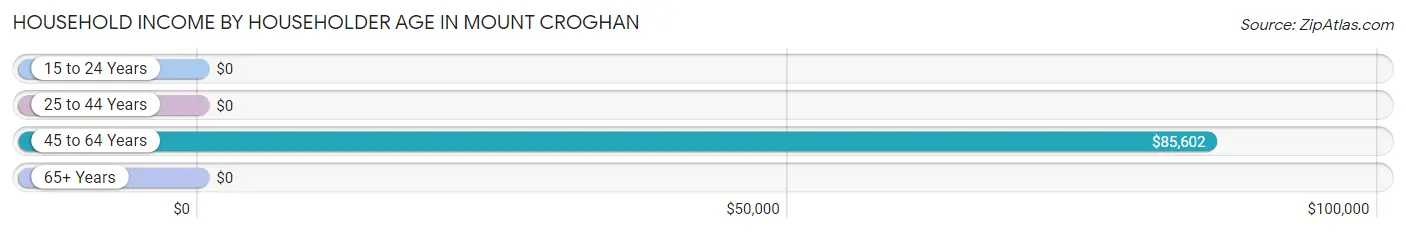
| Income Bracket | # Households | Median Income |
| 15 to 24 Years | 0 (0.0%) | $0 |
| 25 to 44 Years | 8 (10.4%) | $0 |
| 45 to 64 Years | 49 (63.6%) | $85,602 |
| 65+ Years | 20 (26.0%) | $0 |
| Total | 77 (100.0%) | $71,875 |
Poverty in Mount Croghan
Income Below Poverty by Sex and Age in Mount Croghan
With 4.3% poverty level for males and 14.1% for females among the residents of Mount Croghan, 6 to 11 year old males and 75 year old and over females are the most vulnerable to poverty, with 2 males (100.0%) and 9 females (90.0%) in their respective age groups living below the poverty level.
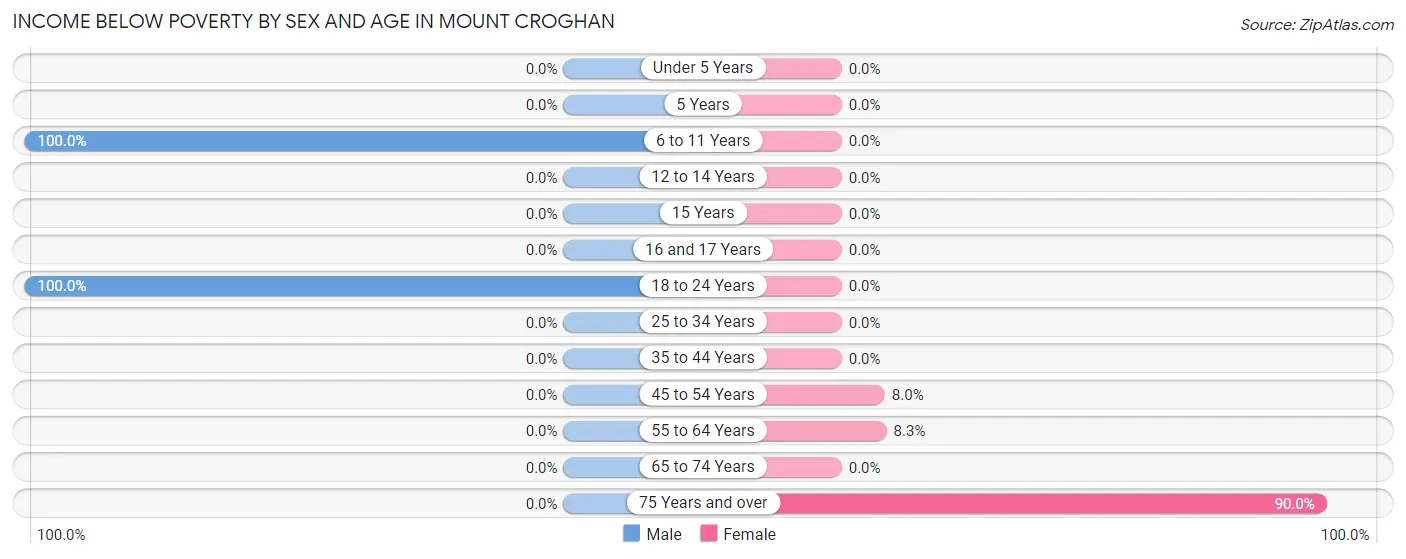
| Age Bracket | Male | Female |
| Under 5 Years | 0 (0.0%) | 0 (0.0%) |
| 5 Years | 0 (0.0%) | 0 (0.0%) |
| 6 to 11 Years | 2 (100.0%) | 0 (0.0%) |
| 12 to 14 Years | 0 (0.0%) | 0 (0.0%) |
| 15 Years | 0 (0.0%) | 0 (0.0%) |
| 16 and 17 Years | 0 (0.0%) | 0 (0.0%) |
| 18 to 24 Years | 2 (100.0%) | 0 (0.0%) |
| 25 to 34 Years | 0 (0.0%) | 0 (0.0%) |
| 35 to 44 Years | 0 (0.0%) | 0 (0.0%) |
| 45 to 54 Years | 0 (0.0%) | 2 (8.0%) |
| 55 to 64 Years | 0 (0.0%) | 1 (8.3%) |
| 65 to 74 Years | 0 (0.0%) | 0 (0.0%) |
| 75 Years and over | 0 (0.0%) | 9 (90.0%) |
| Total | 4 (4.3%) | 12 (14.1%) |
Income Above Poverty by Sex and Age in Mount Croghan
According to the poverty statistics in Mount Croghan, males aged under 5 years and females aged under 5 years are the age groups that are most secure financially, with 100.0% of males and 100.0% of females in these age groups living above the poverty line.
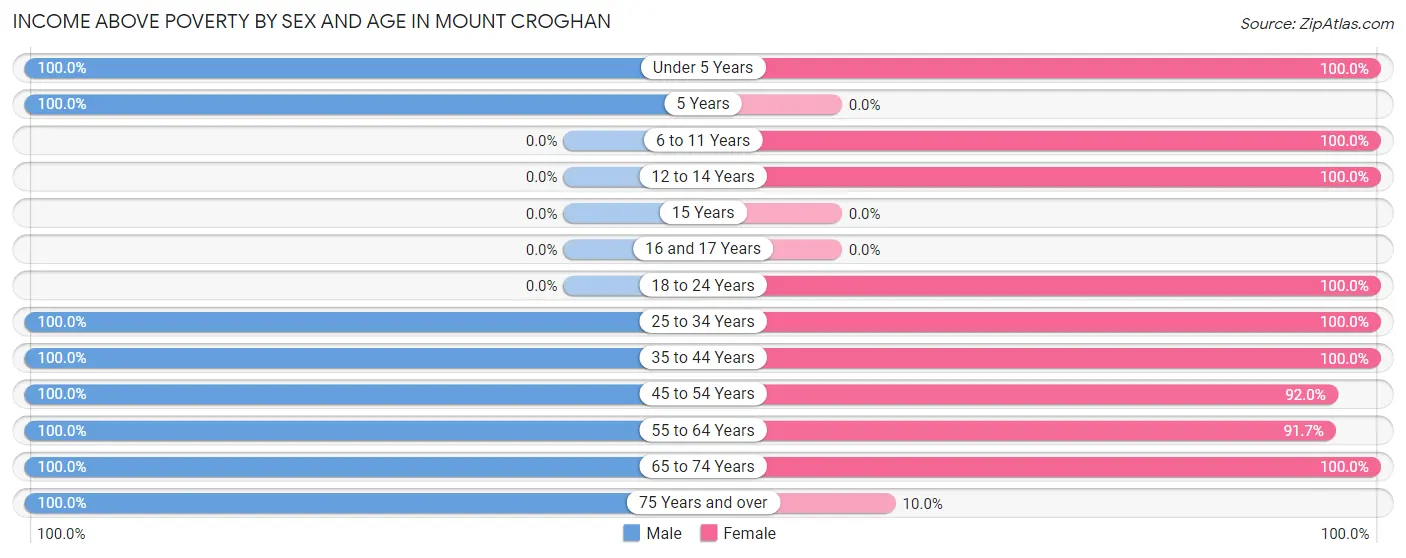
| Age Bracket | Male | Female |
| Under 5 Years | 4 (100.0%) | 4 (100.0%) |
| 5 Years | 3 (100.0%) | 0 (0.0%) |
| 6 to 11 Years | 0 (0.0%) | 5 (100.0%) |
| 12 to 14 Years | 0 (0.0%) | 2 (100.0%) |
| 15 Years | 0 (0.0%) | 0 (0.0%) |
| 16 and 17 Years | 0 (0.0%) | 0 (0.0%) |
| 18 to 24 Years | 0 (0.0%) | 2 (100.0%) |
| 25 to 34 Years | 3 (100.0%) | 8 (100.0%) |
| 35 to 44 Years | 2 (100.0%) | 4 (100.0%) |
| 45 to 54 Years | 30 (100.0%) | 23 (92.0%) |
| 55 to 64 Years | 12 (100.0%) | 11 (91.7%) |
| 65 to 74 Years | 9 (100.0%) | 13 (100.0%) |
| 75 Years and over | 25 (100.0%) | 1 (10.0%) |
| Total | 88 (95.7%) | 73 (85.9%) |
Income Below Poverty Among Married-Couple Families in Mount Croghan
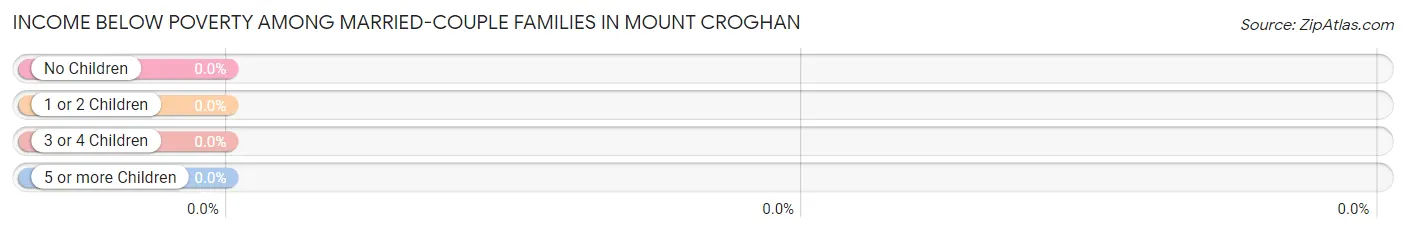
| Children | Above Poverty | Below Poverty |
| No Children | 42 (100.0%) | 0 (0.0%) |
| 1 or 2 Children | 9 (100.0%) | 0 (0.0%) |
| 3 or 4 Children | 1 (100.0%) | 0 (0.0%) |
| 5 or more Children | 0 (0.0%) | 0 (0.0%) |
| Total | 52 (100.0%) | 0 (0.0%) |
Income Below Poverty Among Single-Parent Households in Mount Croghan
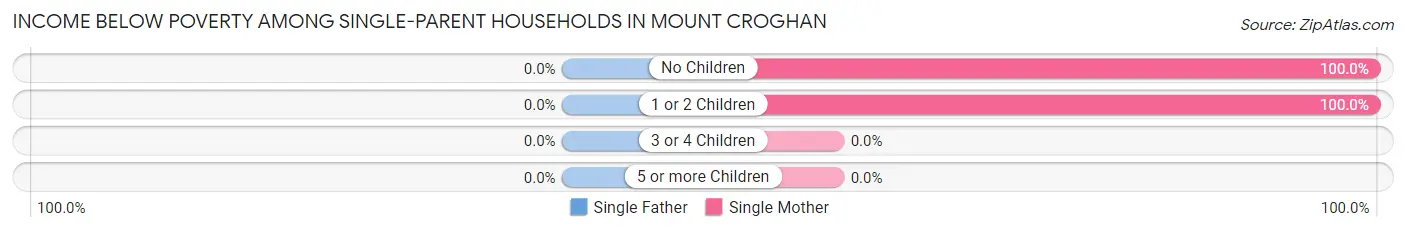
| Children | Single Father | Single Mother |
| No Children | 0 (0.0%) | 1 (100.0%) |
| 1 or 2 Children | 0 (0.0%) | 2 (100.0%) |
| 3 or 4 Children | 0 (0.0%) | 0 (0.0%) |
| 5 or more Children | 0 (0.0%) | 0 (0.0%) |
| Total | 0 (0.0%) | 3 (100.0%) |
Income Below Poverty Among Married-Couple vs Single-Parent Households in Mount Croghan
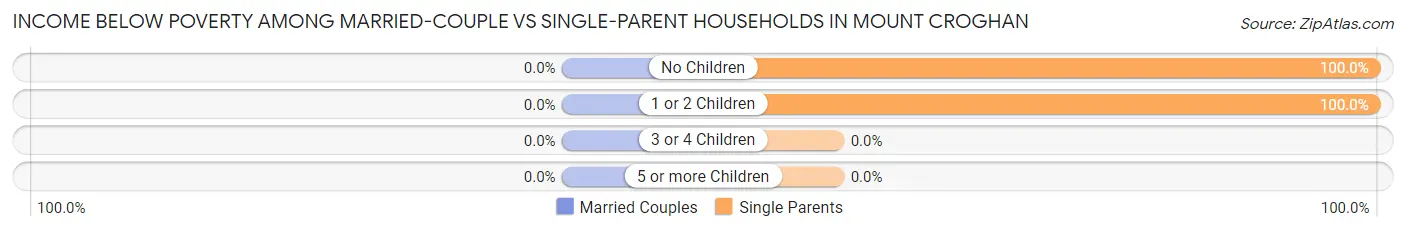
| Children | Married-Couple Families | Single-Parent Households |
| No Children | 0 (0.0%) | 1 (100.0%) |
| 1 or 2 Children | 0 (0.0%) | 2 (100.0%) |
| 3 or 4 Children | 0 (0.0%) | 0 (0.0%) |
| 5 or more Children | 0 (0.0%) | 0 (0.0%) |
| Total | 0 (0.0%) | 3 (100.0%) |
Race in Mount Croghan
The most populous races in Mount Croghan are White / Caucasian (151 | 85.3%), Black / African American (14 | 7.9%), and Hispanic or Latino (8 | 4.5%).
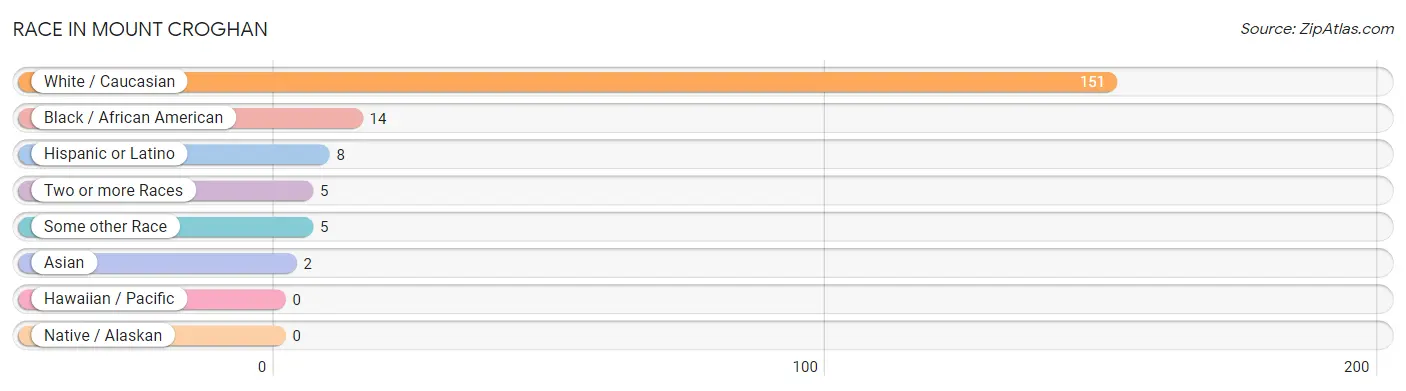
| Race | # Population | % Population |
| Asian | 2 | 1.1% |
| Black / African American | 14 | 7.9% |
| Hawaiian / Pacific | 0 | 0.0% |
| Hispanic or Latino | 8 | 4.5% |
| Native / Alaskan | 0 | 0.0% |
| White / Caucasian | 151 | 85.3% |
| Two or more Races | 5 | 2.8% |
| Some other Race | 5 | 2.8% |
| Total | 177 | 100.0% |
Ancestry in Mount Croghan
The most populous ancestries reported in Mount Croghan are English (36 | 20.3%), German (35 | 19.8%), Irish (9 | 5.1%), European (8 | 4.5%), and American (5 | 2.8%), together accounting for 52.5% of all Mount Croghan residents.
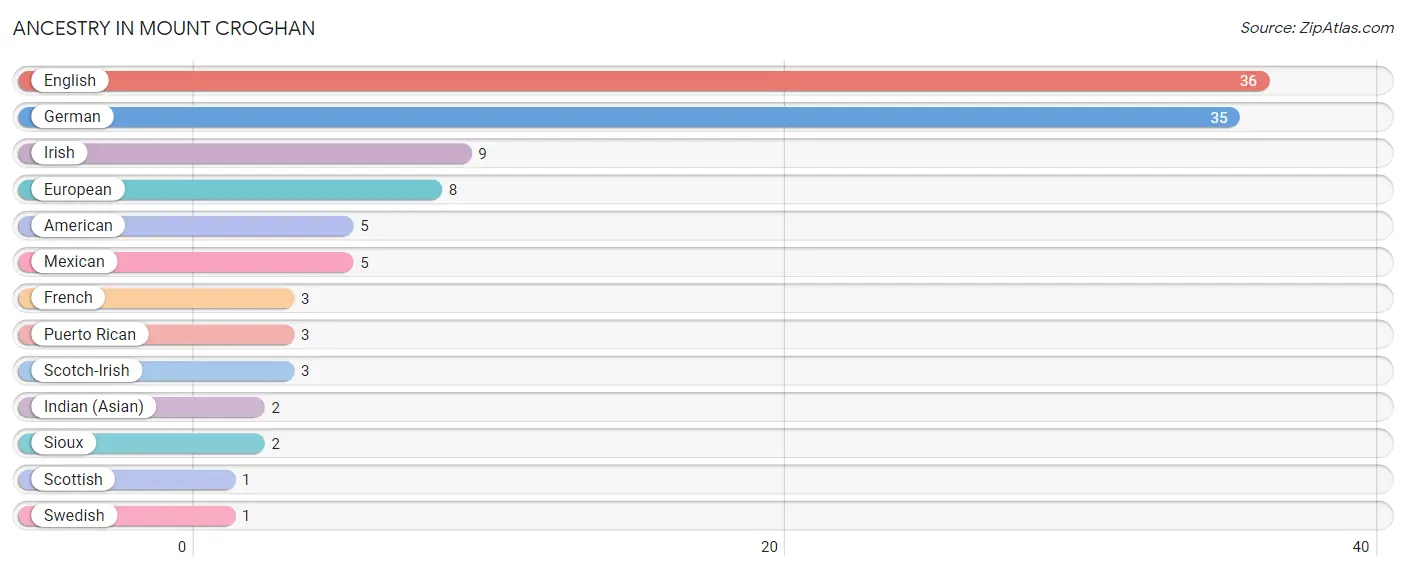
| Ancestry | # Population | % Population |
| American | 5 | 2.8% |
| English | 36 | 20.3% |
| European | 8 | 4.5% |
| French | 3 | 1.7% |
| German | 35 | 19.8% |
| Indian (Asian) | 2 | 1.1% |
| Irish | 9 | 5.1% |
| Mexican | 5 | 2.8% |
| Puerto Rican | 3 | 1.7% |
| Scotch-Irish | 3 | 1.7% |
| Scottish | 1 | 0.6% |
| Sioux | 2 | 1.1% |
| Swedish | 1 | 0.6% | View All 13 Rows |
Immigrants in Mount Croghan
The most numerous immigrant groups reported in Mount Croghan came from Asia (2 | 1.1%), China (2 | 1.1%), and Eastern Asia (2 | 1.1%), together accounting for 3.4% of all Mount Croghan residents.
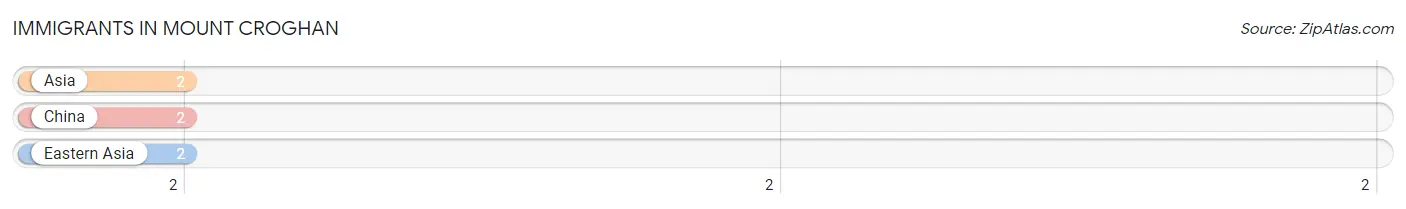
| Immigration Origin | # Population | % Population |
| Asia | 2 | 1.1% |
| China | 2 | 1.1% |
| Eastern Asia | 2 | 1.1% | View All 3 Rows |
Sex and Age in Mount Croghan
Sex and Age in Mount Croghan
The most populous age groups in Mount Croghan are 45 to 49 Years (28 | 30.4%) for men and 45 to 49 Years (24 | 28.2%) for women.
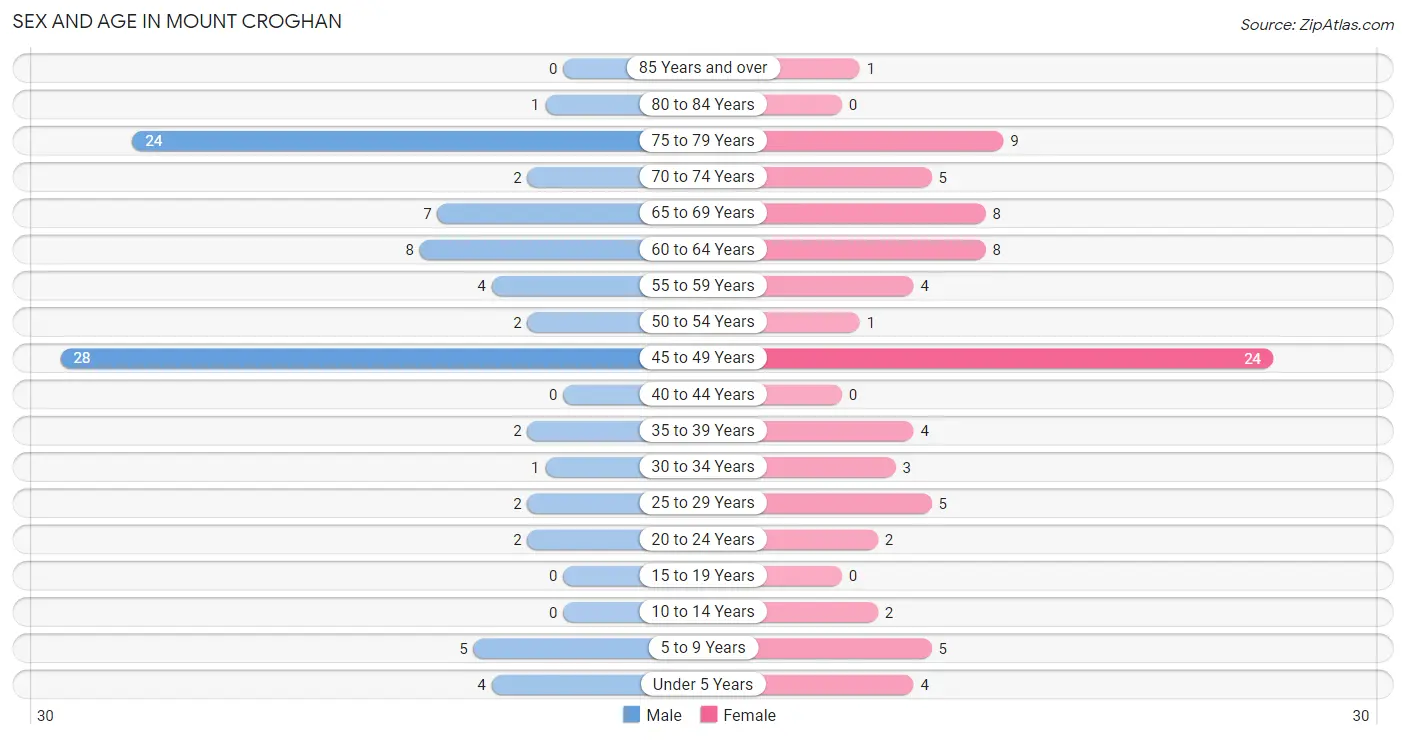
| Age Bracket | Male | Female |
| Under 5 Years | 4 (4.3%) | 4 (4.7%) |
| 5 to 9 Years | 5 (5.4%) | 5 (5.9%) |
| 10 to 14 Years | 0 (0.0%) | 2 (2.4%) |
| 15 to 19 Years | 0 (0.0%) | 0 (0.0%) |
| 20 to 24 Years | 2 (2.2%) | 2 (2.4%) |
| 25 to 29 Years | 2 (2.2%) | 5 (5.9%) |
| 30 to 34 Years | 1 (1.1%) | 3 (3.5%) |
| 35 to 39 Years | 2 (2.2%) | 4 (4.7%) |
| 40 to 44 Years | 0 (0.0%) | 0 (0.0%) |
| 45 to 49 Years | 28 (30.4%) | 24 (28.2%) |
| 50 to 54 Years | 2 (2.2%) | 1 (1.2%) |
| 55 to 59 Years | 4 (4.3%) | 4 (4.7%) |
| 60 to 64 Years | 8 (8.7%) | 8 (9.4%) |
| 65 to 69 Years | 7 (7.6%) | 8 (9.4%) |
| 70 to 74 Years | 2 (2.2%) | 5 (5.9%) |
| 75 to 79 Years | 24 (26.1%) | 9 (10.6%) |
| 80 to 84 Years | 1 (1.1%) | 0 (0.0%) |
| 85 Years and over | 0 (0.0%) | 1 (1.2%) |
| Total | 92 (100.0%) | 85 (100.0%) |
Families and Households in Mount Croghan
Median Family Size in Mount Croghan
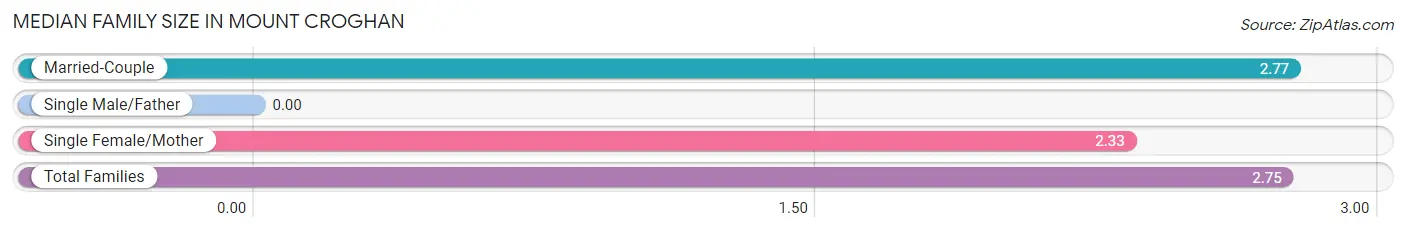
| Family Type | # Families | Family Size |
| Married-Couple | 52 (94.6%) | 2.77 |
| Single Male/Father | 0 (0.0%) | - |
| Single Female/Mother | 3 (5.4%) | 2.33 |
| Total Families | 55 (100.0%) | 2.75 |
Median Household Size in Mount Croghan
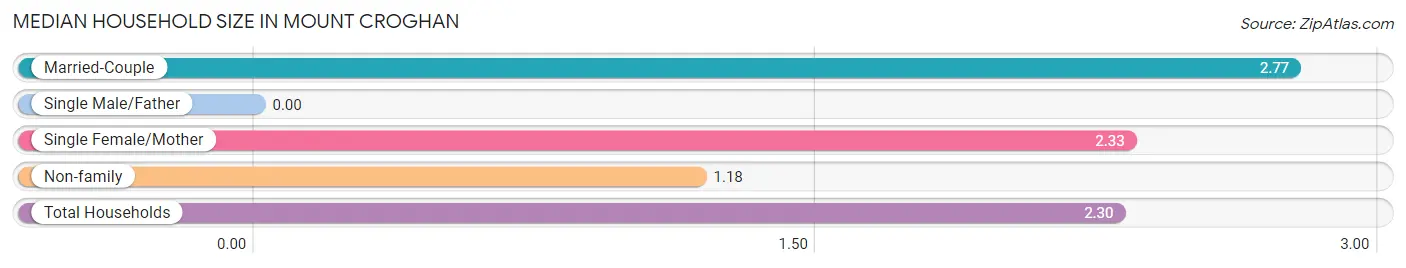
| Household Type | # Households | Household Size |
| Married-Couple | 52 (67.5%) | 2.77 |
| Single Male/Father | 0 (0.0%) | - |
| Single Female/Mother | 3 (3.9%) | 2.33 |
| Non-family | 22 (28.6%) | 1.18 |
| Total Households | 77 (100.0%) | 2.30 |
Household Size by Marriage Status in Mount Croghan
Out of a total of 77 households in Mount Croghan, 55 (71.4%) are family households, while 22 (28.6%) are nonfamily households. The most numerous type of family households are 3-person households, comprising 32, and the most common type of nonfamily households are 1-person households, comprising 17.
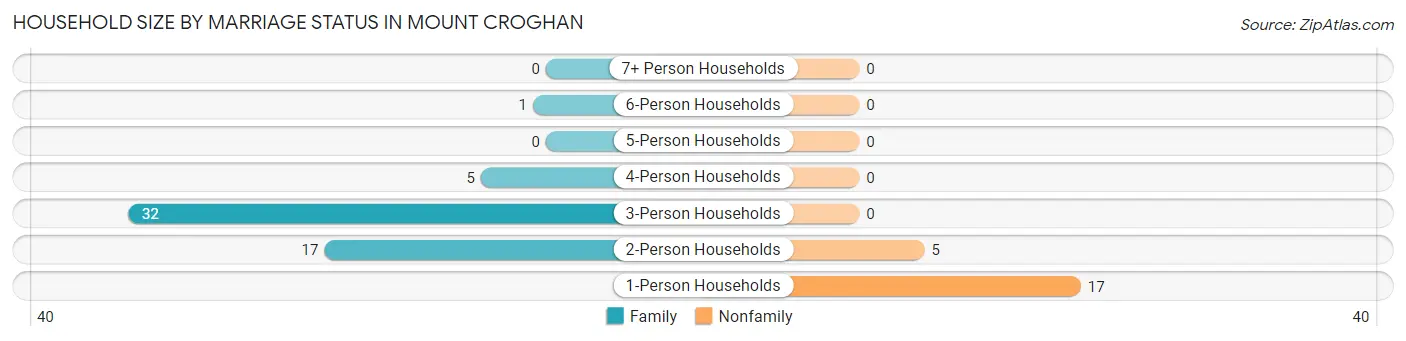
| Household Size | Family Households | Nonfamily Households |
| 1-Person Households | - | 17 (22.1%) |
| 2-Person Households | 17 (22.1%) | 5 (6.5%) |
| 3-Person Households | 32 (41.6%) | 0 (0.0%) |
| 4-Person Households | 5 (6.5%) | 0 (0.0%) |
| 5-Person Households | 0 (0.0%) | 0 (0.0%) |
| 6-Person Households | 1 (1.3%) | 0 (0.0%) |
| 7+ Person Households | 0 (0.0%) | 0 (0.0%) |
| Total | 55 (71.4%) | 22 (28.6%) |
Female Fertility in Mount Croghan
Fertility by Age in Mount Croghan
Average fertility rate in Mount Croghan is 51.0 births per 1,000 women. Women in the age bracket of 20 to 34 years have the highest fertility rate with 200.0 births per 1,000 women. Women in the age bracket of 20 to 34 years acount for 100.0% of all women with births.
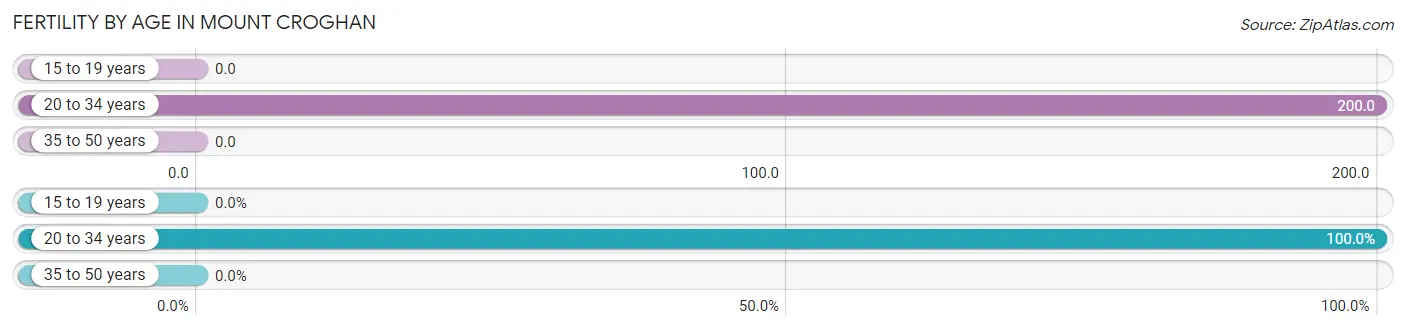
| Age Bracket | Women with Births | Births / 1,000 Women |
| 15 to 19 years | 0 (0.0%) | 0.0 |
| 20 to 34 years | 2 (100.0%) | 200.0 |
| 35 to 50 years | 0 (0.0%) | 0.0 |
| Total | 2 (100.0%) | 51.0 |
Fertility by Age by Marriage Status in Mount Croghan
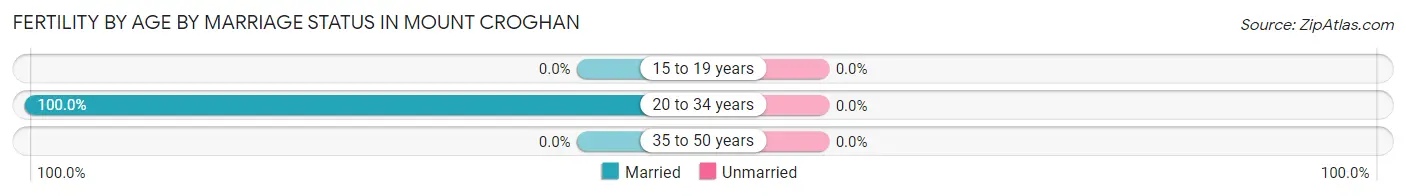
| Age Bracket | Married | Unmarried |
| 15 to 19 years | 0 (0.0%) | 0 (0.0%) |
| 20 to 34 years | 2 (100.0%) | 0 (0.0%) |
| 35 to 50 years | 0 (0.0%) | 0 (0.0%) |
| Total | 2 (100.0%) | 0 (0.0%) |
Fertility by Education in Mount Croghan
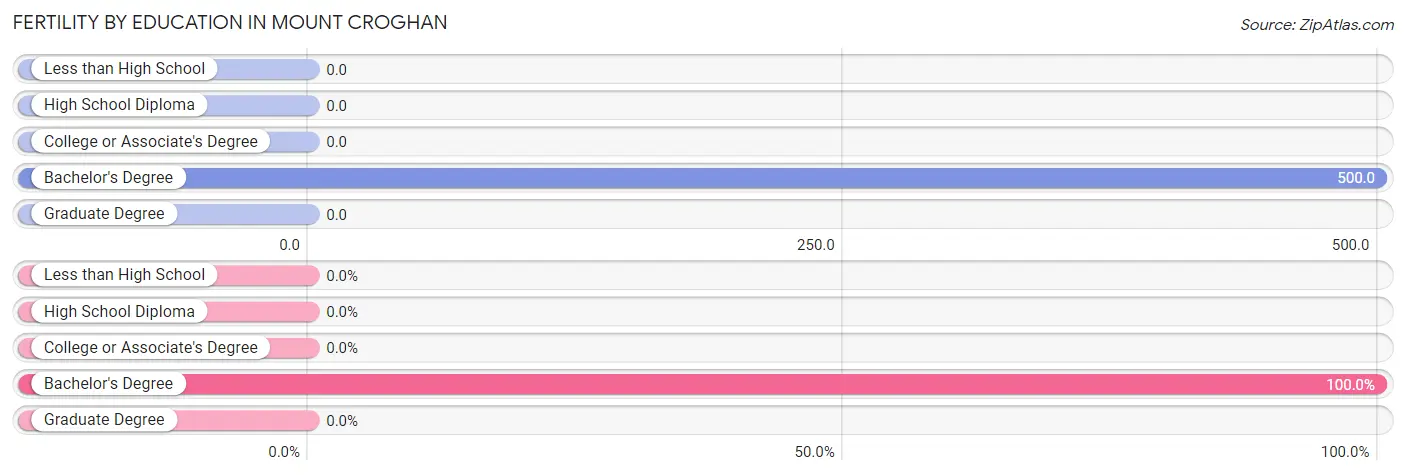
| Educational Attainment | Women with Births | Births / 1,000 Women |
| Less than High School | 0 (0.0%) | 0.0 |
| High School Diploma | 0 (0.0%) | 0.0 |
| College or Associate's Degree | 0 (0.0%) | 0.0 |
| Bachelor's Degree | 2 (100.0%) | 500.0 |
| Graduate Degree | 0 (0.0%) | 0.0 |
| Total | 2 (100.0%) | 51.0 |
Fertility by Education by Marriage Status in Mount Croghan
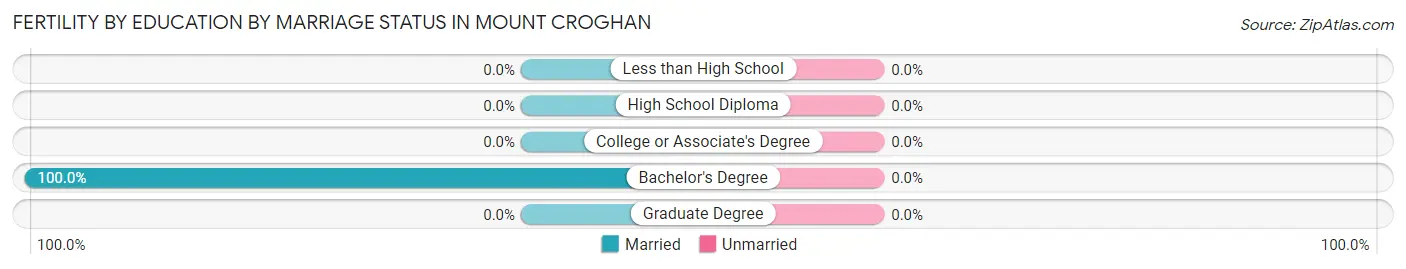
| Educational Attainment | Married | Unmarried |
| Less than High School | 0 (0.0%) | 0 (0.0%) |
| High School Diploma | 0 (0.0%) | 0 (0.0%) |
| College or Associate's Degree | 0 (0.0%) | 0 (0.0%) |
| Bachelor's Degree | 2 (100.0%) | 0 (0.0%) |
| Graduate Degree | 0 (0.0%) | 0 (0.0%) |
| Total | 2 (100.0%) | 0 (0.0%) |
Employment Characteristics in Mount Croghan
Employment by Class of Employer in Mount Croghan
Among the 64 employed individuals in Mount Croghan, private company employees (48 | 75.0%), state government employees (7 | 10.9%), and local government employees (4 | 6.2%) make up the most common classes of employment.
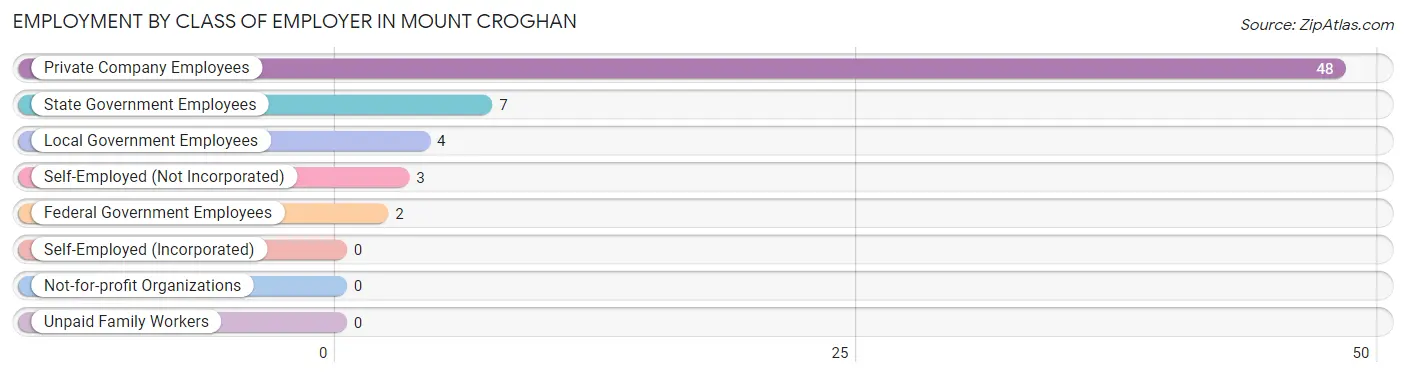
| Employer Class | # Employees | % Employees |
| Private Company Employees | 48 | 75.0% |
| Self-Employed (Incorporated) | 0 | 0.0% |
| Self-Employed (Not Incorporated) | 3 | 4.7% |
| Not-for-profit Organizations | 0 | 0.0% |
| Local Government Employees | 4 | 6.2% |
| State Government Employees | 7 | 10.9% |
| Federal Government Employees | 2 | 3.1% |
| Unpaid Family Workers | 0 | 0.0% |
| Total | 64 | 100.0% |
Employment Status by Age in Mount Croghan
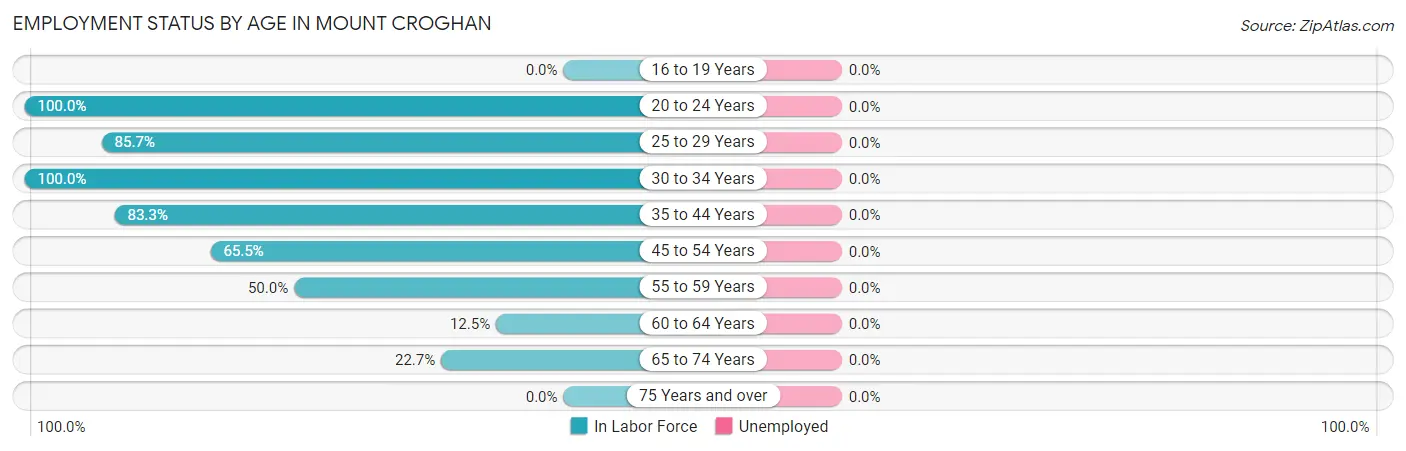
| Age Bracket | In Labor Force | Unemployed |
| 16 to 19 Years | 0 (0.0%) | 0 (0.0%) |
| 20 to 24 Years | 4 (100.0%) | 0 (0.0%) |
| 25 to 29 Years | 6 (85.7%) | 0 (0.0%) |
| 30 to 34 Years | 4 (100.0%) | 0 (0.0%) |
| 35 to 44 Years | 5 (83.3%) | 0 (0.0%) |
| 45 to 54 Years | 36 (65.5%) | 0 (0.0%) |
| 55 to 59 Years | 4 (50.0%) | 0 (0.0%) |
| 60 to 64 Years | 2 (12.5%) | 0 (0.0%) |
| 65 to 74 Years | 5 (22.7%) | 0 (0.0%) |
| 75 Years and over | 0 (0.0%) | 0 (0.0%) |
| Total | 66 (42.0%) | 0 (0.0%) |
Employment Status by Educational Attainment in Mount Croghan
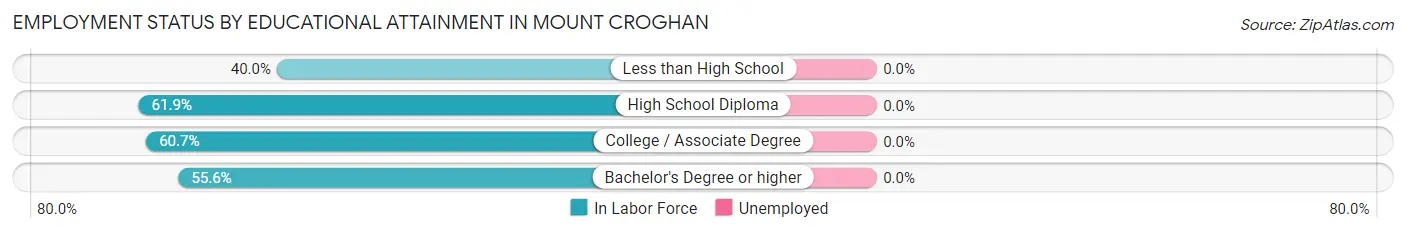
| Educational Attainment | In Labor Force | Unemployed |
| Less than High School | 2 (40.0%) | 0 (0.0%) |
| High School Diploma | 13 (61.9%) | 0 (0.0%) |
| College / Associate Degree | 37 (60.7%) | 0 (0.0%) |
| Bachelor's Degree or higher | 5 (55.6%) | 0 (0.0%) |
| Total | 57 (59.4%) | 0 (0.0%) |
Employment Occupations by Sex in Mount Croghan
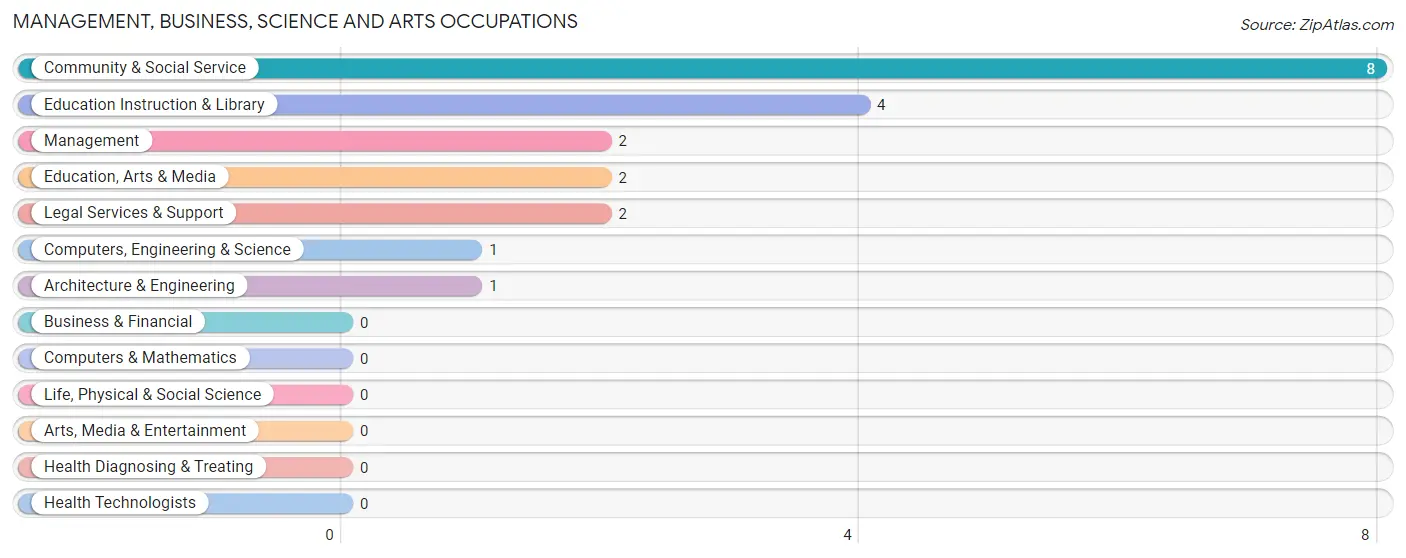
Management, Business, Science and Arts Occupations
The most common Management, Business, Science and Arts occupations in Mount Croghan are Community & Social Service (8 | 12.1%), Education Instruction & Library (4 | 6.1%), Management (2 | 3.0%), Education, Arts & Media (2 | 3.0%), and Legal Services & Support (2 | 3.0%).
Management, Business, Science and Arts Occupations by Sex
Within the Management, Business, Science and Arts occupations in Mount Croghan, the most male-oriented occupations are Computers, Engineering & Science (100.0%), Architecture & Engineering (100.0%), and Management (50.0%), while the most female-oriented occupations are Community & Social Service (100.0%), Education, Arts & Media (100.0%), and Legal Services & Support (100.0%).
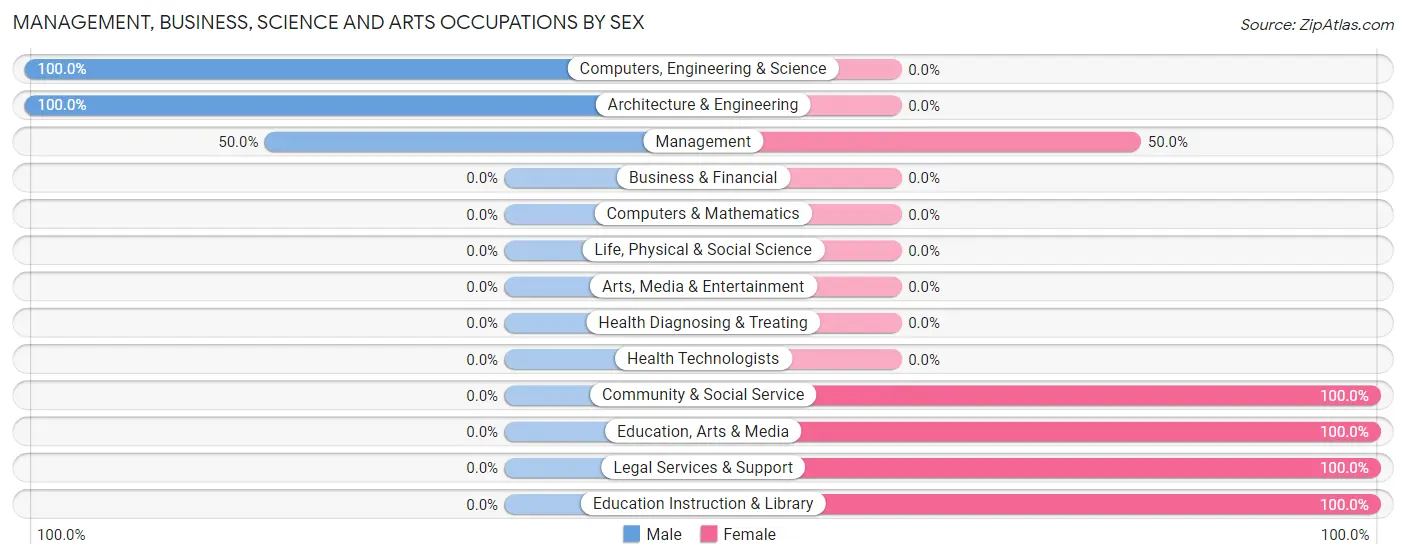
| Occupation | Male | Female |
| Management | 1 (50.0%) | 1 (50.0%) |
| Business & Financial | 0 (0.0%) | 0 (0.0%) |
| Computers, Engineering & Science | 1 (100.0%) | 0 (0.0%) |
| Computers & Mathematics | 0 (0.0%) | 0 (0.0%) |
| Architecture & Engineering | 1 (100.0%) | 0 (0.0%) |
| Life, Physical & Social Science | 0 (0.0%) | 0 (0.0%) |
| Community & Social Service | 0 (0.0%) | 8 (100.0%) |
| Education, Arts & Media | 0 (0.0%) | 2 (100.0%) |
| Legal Services & Support | 0 (0.0%) | 2 (100.0%) |
| Education Instruction & Library | 0 (0.0%) | 4 (100.0%) |
| Arts, Media & Entertainment | 0 (0.0%) | 0 (0.0%) |
| Health Diagnosing & Treating | 0 (0.0%) | 0 (0.0%) |
| Health Technologists | 0 (0.0%) | 0 (0.0%) |
| Total (Category) | 2 (18.2%) | 9 (81.8%) |
| Total (Overall) | 43 (65.1%) | 23 (34.8%) |
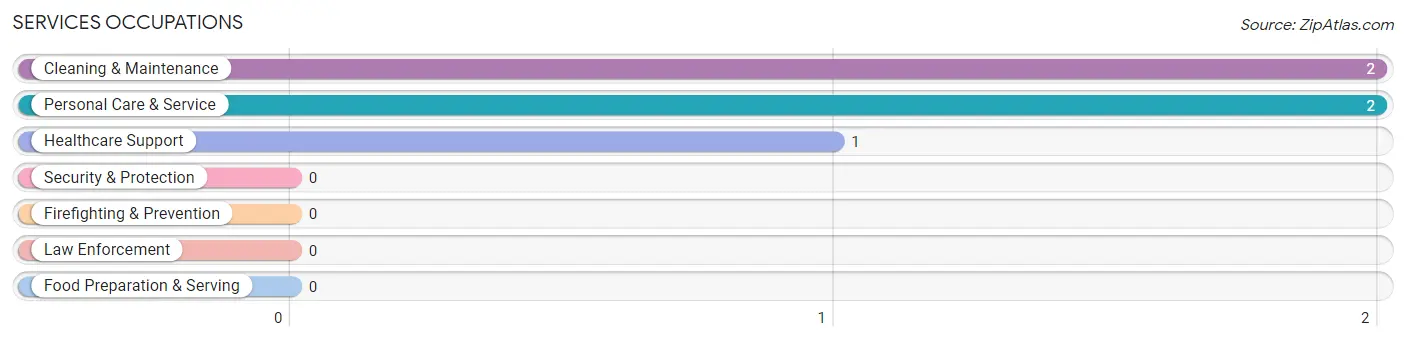
Services Occupations
The most common Services occupations in Mount Croghan are Cleaning & Maintenance (2 | 3.0%), Personal Care & Service (2 | 3.0%), and Healthcare Support (1 | 1.5%).
Services Occupations by Sex
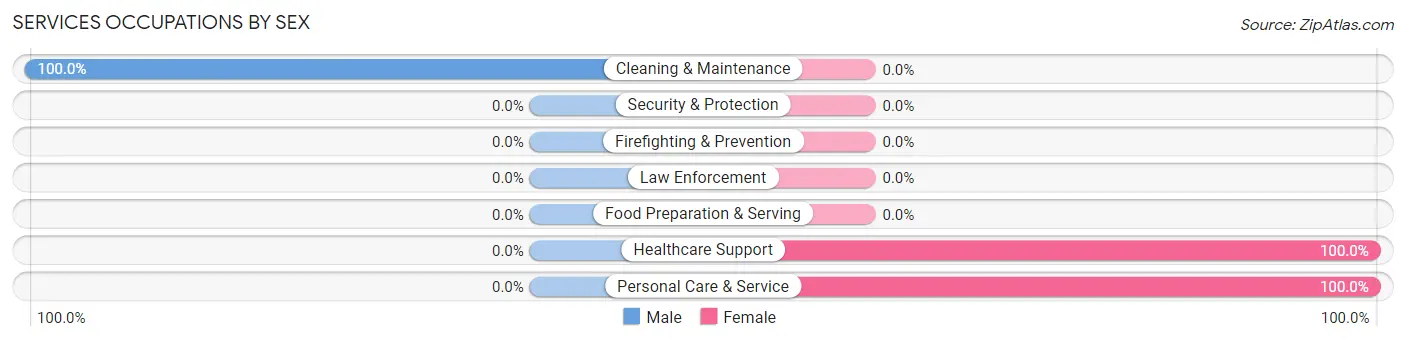
| Occupation | Male | Female |
| Healthcare Support | 0 (0.0%) | 1 (100.0%) |
| Security & Protection | 0 (0.0%) | 0 (0.0%) |
| Firefighting & Prevention | 0 (0.0%) | 0 (0.0%) |
| Law Enforcement | 0 (0.0%) | 0 (0.0%) |
| Food Preparation & Serving | 0 (0.0%) | 0 (0.0%) |
| Cleaning & Maintenance | 2 (100.0%) | 0 (0.0%) |
| Personal Care & Service | 0 (0.0%) | 2 (100.0%) |
| Total (Category) | 2 (40.0%) | 3 (60.0%) |
| Total (Overall) | 43 (65.1%) | 23 (34.8%) |
Sales and Office Occupations
The most common Sales and Office occupations in Mount Croghan are Office & Administration (6 | 9.1%), and Sales & Related (3 | 4.5%).
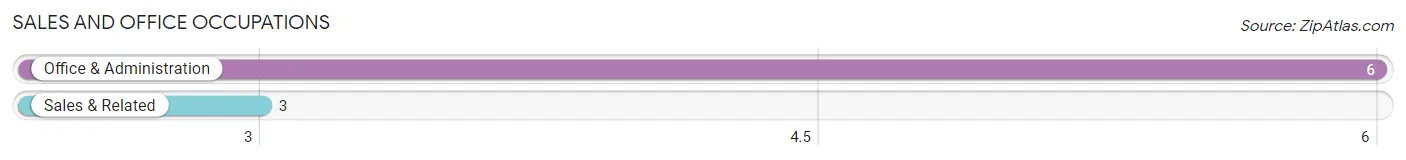
Sales and Office Occupations by Sex
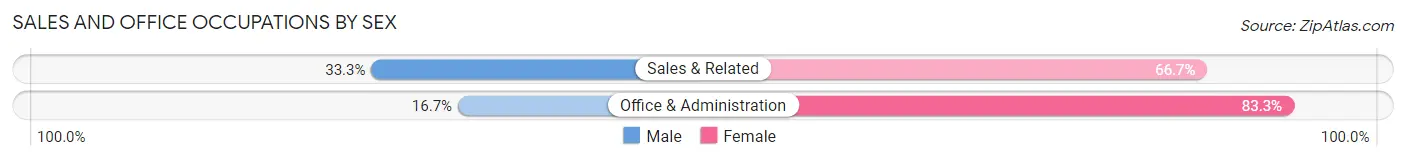
| Occupation | Male | Female |
| Sales & Related | 1 (33.3%) | 2 (66.7%) |
| Office & Administration | 1 (16.7%) | 5 (83.3%) |
| Total (Category) | 2 (22.2%) | 7 (77.8%) |
| Total (Overall) | 43 (65.1%) | 23 (34.8%) |
Natural Resources, Construction and Maintenance Occupations
The most common Natural Resources, Construction and Maintenance occupations in Mount Croghan are Construction & Extraction (6 | 9.1%), Farming, Fishing & Forestry (2 | 3.0%), and Installation, Maintenance & Repair (1 | 1.5%).
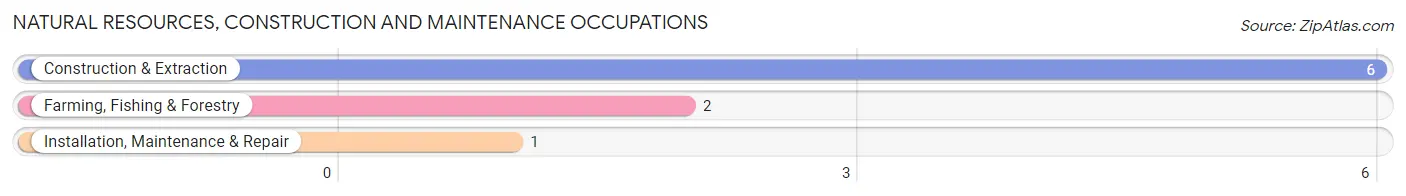
Natural Resources, Construction and Maintenance Occupations by Sex
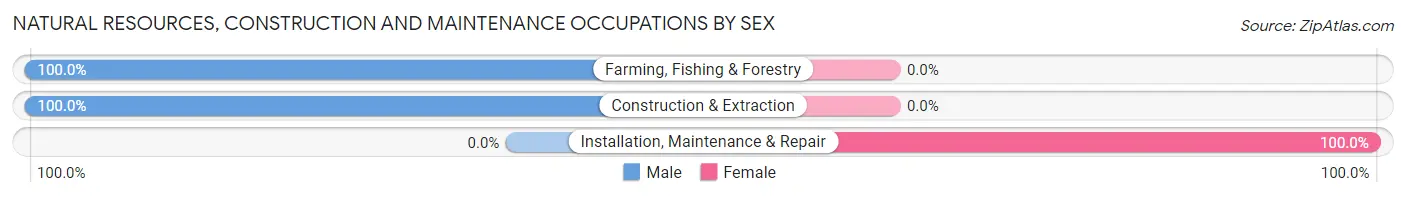
| Occupation | Male | Female |
| Farming, Fishing & Forestry | 2 (100.0%) | 0 (0.0%) |
| Construction & Extraction | 6 (100.0%) | 0 (0.0%) |
| Installation, Maintenance & Repair | 0 (0.0%) | 1 (100.0%) |
| Total (Category) | 8 (88.9%) | 1 (11.1%) |
| Total (Overall) | 43 (65.1%) | 23 (34.8%) |
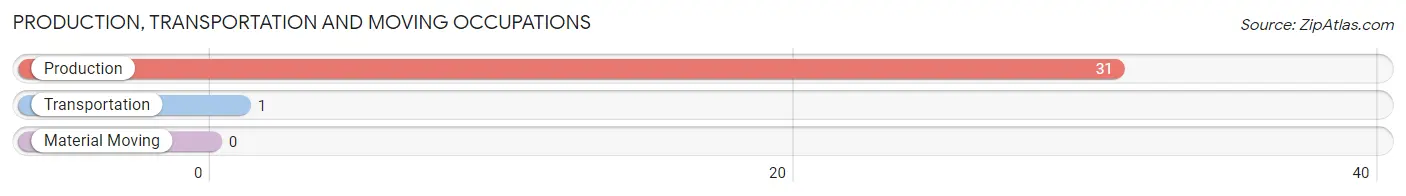
Production, Transportation and Moving Occupations
The most common Production, Transportation and Moving occupations in Mount Croghan are Production (31 | 47.0%), and Transportation (1 | 1.5%).
Production, Transportation and Moving Occupations by Sex
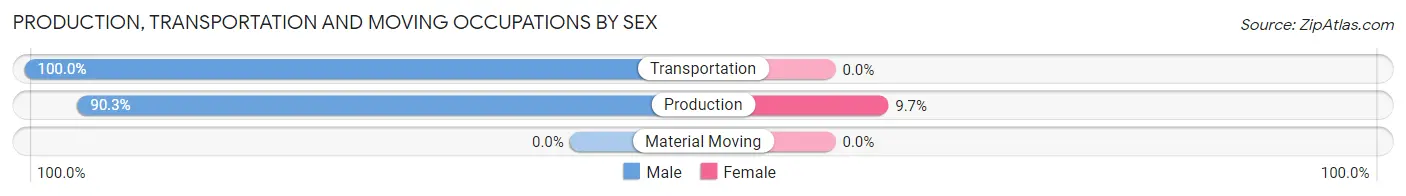
| Occupation | Male | Female |
| Production | 28 (90.3%) | 3 (9.7%) |
| Transportation | 1 (100.0%) | 0 (0.0%) |
| Material Moving | 0 (0.0%) | 0 (0.0%) |
| Total (Category) | 29 (90.6%) | 3 (9.4%) |
| Total (Overall) | 43 (65.1%) | 23 (34.8%) |
Employment Industries by Sex in Mount Croghan
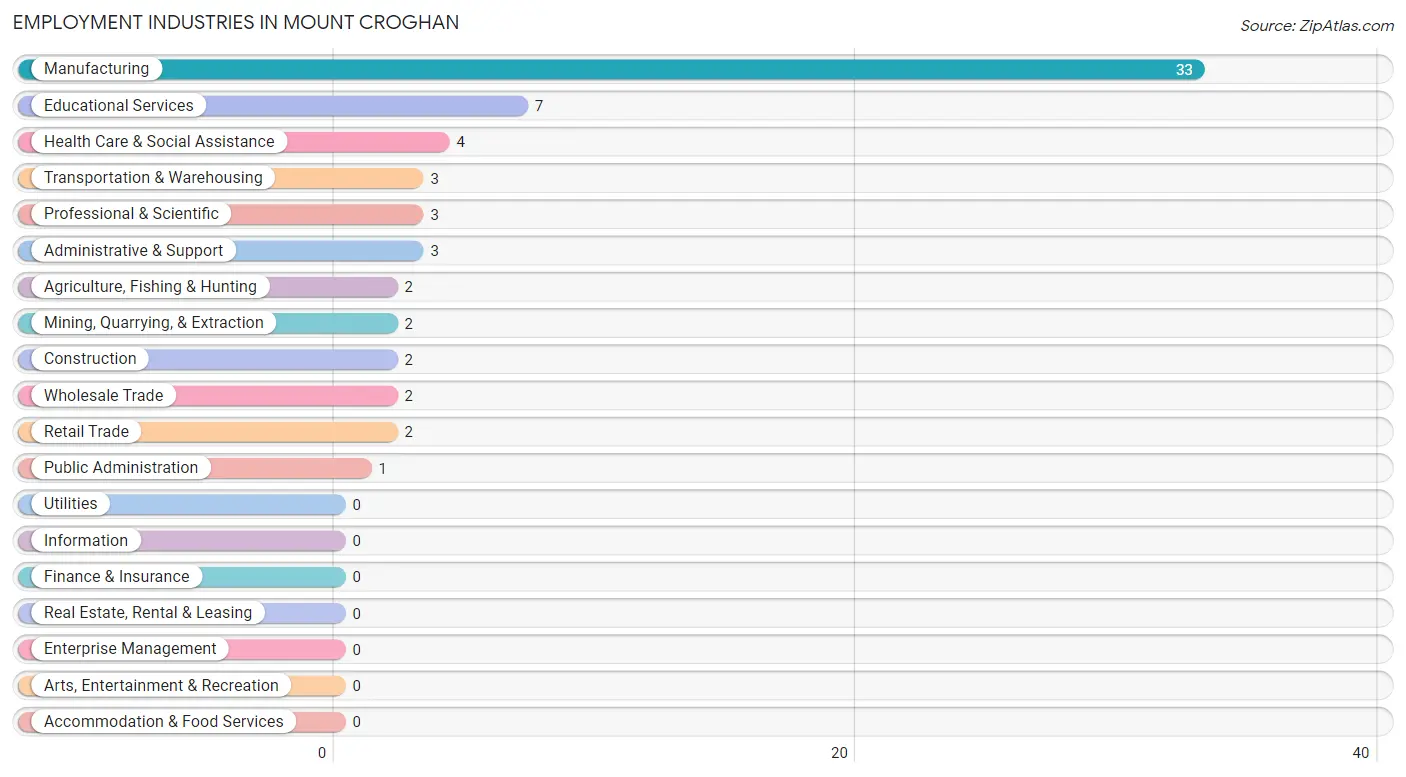
Employment Industries in Mount Croghan
The major employment industries in Mount Croghan include Manufacturing (33 | 50.0%), Educational Services (7 | 10.6%), Health Care & Social Assistance (4 | 6.1%), Transportation & Warehousing (3 | 4.5%), and Professional & Scientific (3 | 4.5%).
Employment Industries by Sex in Mount Croghan
The Mount Croghan industries that see more men than women are Agriculture, Fishing & Hunting (100.0%), Mining, Quarrying, & Extraction (100.0%), and Construction (100.0%), whereas the industries that tend to have a higher number of women are Retail Trade (100.0%), Professional & Scientific (100.0%), and Public Administration (100.0%).
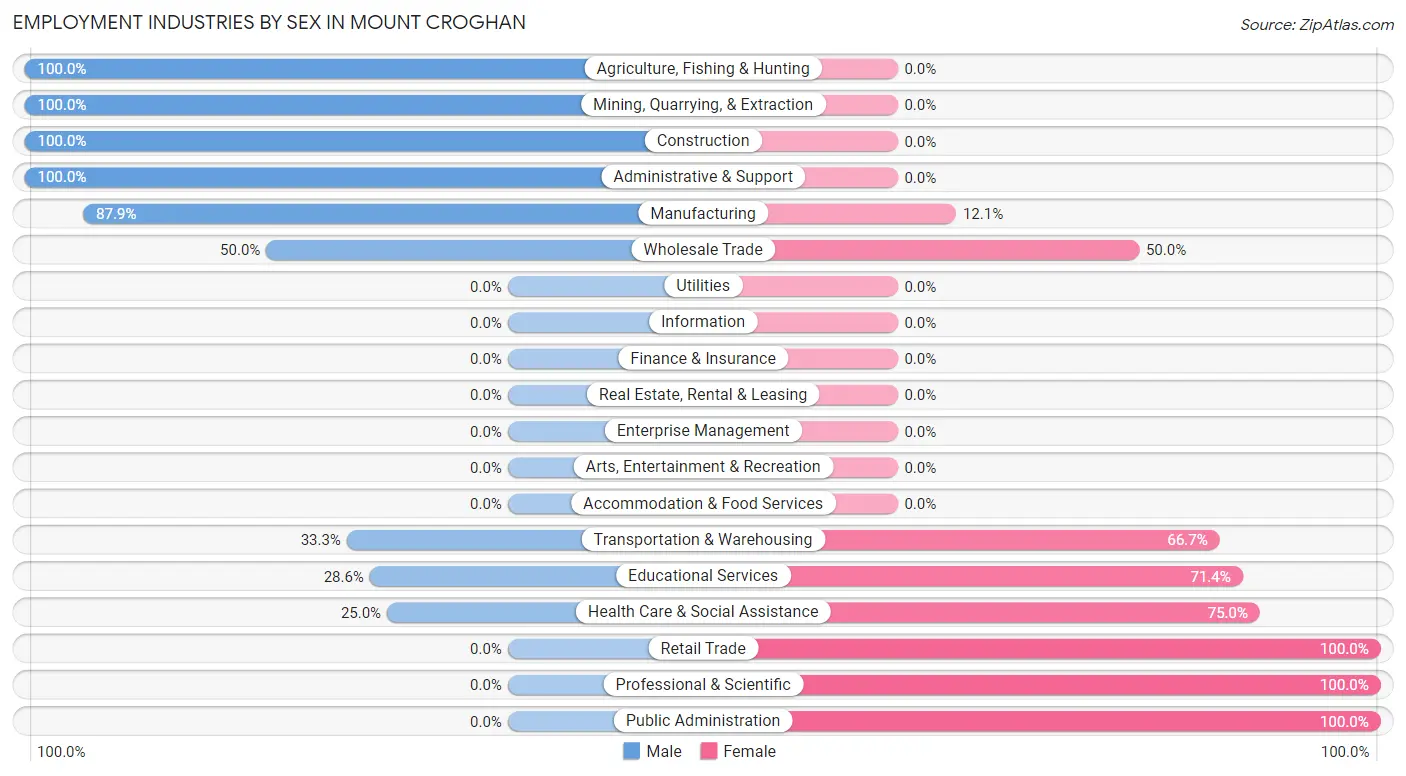
| Industry | Male | Female |
| Agriculture, Fishing & Hunting | 2 (100.0%) | 0 (0.0%) |
| Mining, Quarrying, & Extraction | 2 (100.0%) | 0 (0.0%) |
| Construction | 2 (100.0%) | 0 (0.0%) |
| Manufacturing | 29 (87.9%) | 4 (12.1%) |
| Wholesale Trade | 1 (50.0%) | 1 (50.0%) |
| Retail Trade | 0 (0.0%) | 2 (100.0%) |
| Transportation & Warehousing | 1 (33.3%) | 2 (66.7%) |
| Utilities | 0 (0.0%) | 0 (0.0%) |
| Information | 0 (0.0%) | 0 (0.0%) |
| Finance & Insurance | 0 (0.0%) | 0 (0.0%) |
| Real Estate, Rental & Leasing | 0 (0.0%) | 0 (0.0%) |
| Professional & Scientific | 0 (0.0%) | 3 (100.0%) |
| Enterprise Management | 0 (0.0%) | 0 (0.0%) |
| Administrative & Support | 3 (100.0%) | 0 (0.0%) |
| Educational Services | 2 (28.6%) | 5 (71.4%) |
| Health Care & Social Assistance | 1 (25.0%) | 3 (75.0%) |
| Arts, Entertainment & Recreation | 0 (0.0%) | 0 (0.0%) |
| Accommodation & Food Services | 0 (0.0%) | 0 (0.0%) |
| Public Administration | 0 (0.0%) | 1 (100.0%) |
| Total | 43 (65.1%) | 23 (34.8%) |
Education in Mount Croghan
School Enrollment in Mount Croghan
The most common levels of schooling among the 6 students in Mount Croghan are kindergarten (2 | 33.3%), middle school (2 | 33.3%), and elementary school (1 | 16.7%).
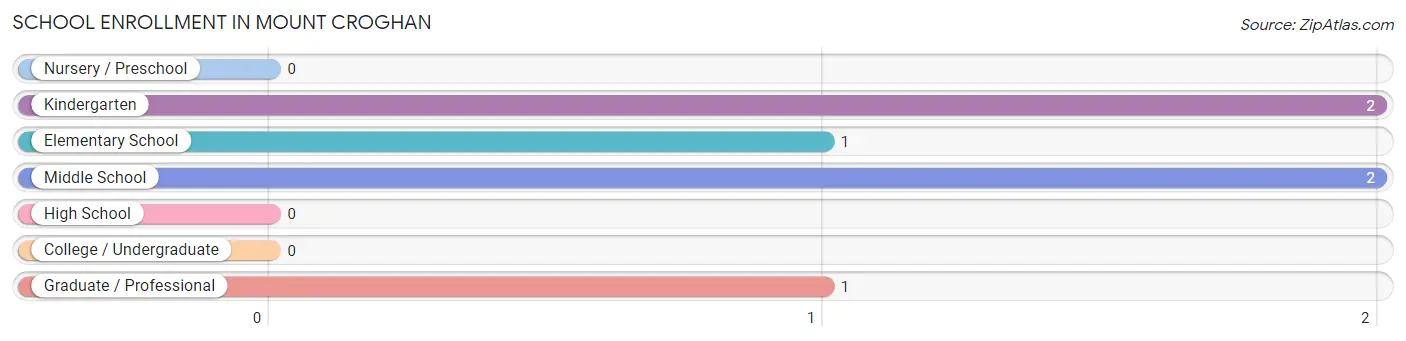
| School Level | # Students | % Students |
| Nursery / Preschool | 0 | 0.0% |
| Kindergarten | 2 | 33.3% |
| Elementary School | 1 | 16.7% |
| Middle School | 2 | 33.3% |
| High School | 0 | 0.0% |
| College / Undergraduate | 0 | 0.0% |
| Graduate / Professional | 1 | 16.7% |
| Total | 6 | 100.0% |
School Enrollment by Age by Funding Source in Mount Croghan
Out of a total of 6 students who are enrolled in schools in Mount Croghan, 1 (16.7%) attend a private institution, while the remaining 5 (83.3%) are enrolled in public schools. The age group of 35 years and over has the highest likelihood of being enrolled in private schools, with 1 (100.0% in the age bracket) enrolled. Conversely, the age group of 5 to 9 year old has the lowest likelihood of being enrolled in a private school, with 3 (100.0% in the age bracket) attending a public institution.
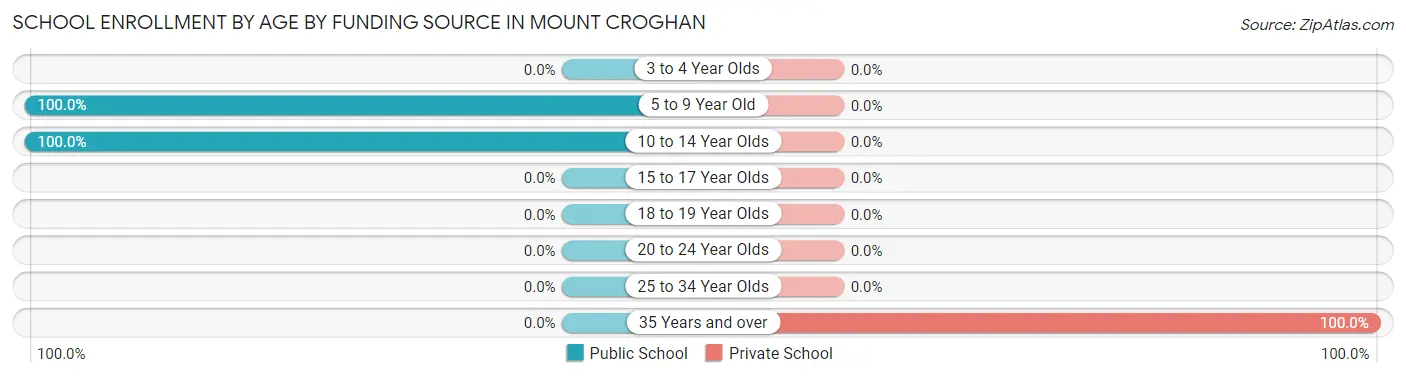
| Age Bracket | Public School | Private School |
| 3 to 4 Year Olds | 0 (0.0%) | 0 (0.0%) |
| 5 to 9 Year Old | 3 (100.0%) | 0 (0.0%) |
| 10 to 14 Year Olds | 2 (100.0%) | 0 (0.0%) |
| 15 to 17 Year Olds | 0 (0.0%) | 0 (0.0%) |
| 18 to 19 Year Olds | 0 (0.0%) | 0 (0.0%) |
| 20 to 24 Year Olds | 0 (0.0%) | 0 (0.0%) |
| 25 to 34 Year Olds | 0 (0.0%) | 0 (0.0%) |
| 35 Years and over | 0 (0.0%) | 1 (100.0%) |
| Total | 5 (83.3%) | 1 (16.7%) |
Educational Attainment by Field of Study in Mount Croghan
Education (7 | 58.3%), and business (5 | 41.7%) are the most common fields of study among 12 individuals in Mount Croghan who have obtained a bachelor's degree or higher.
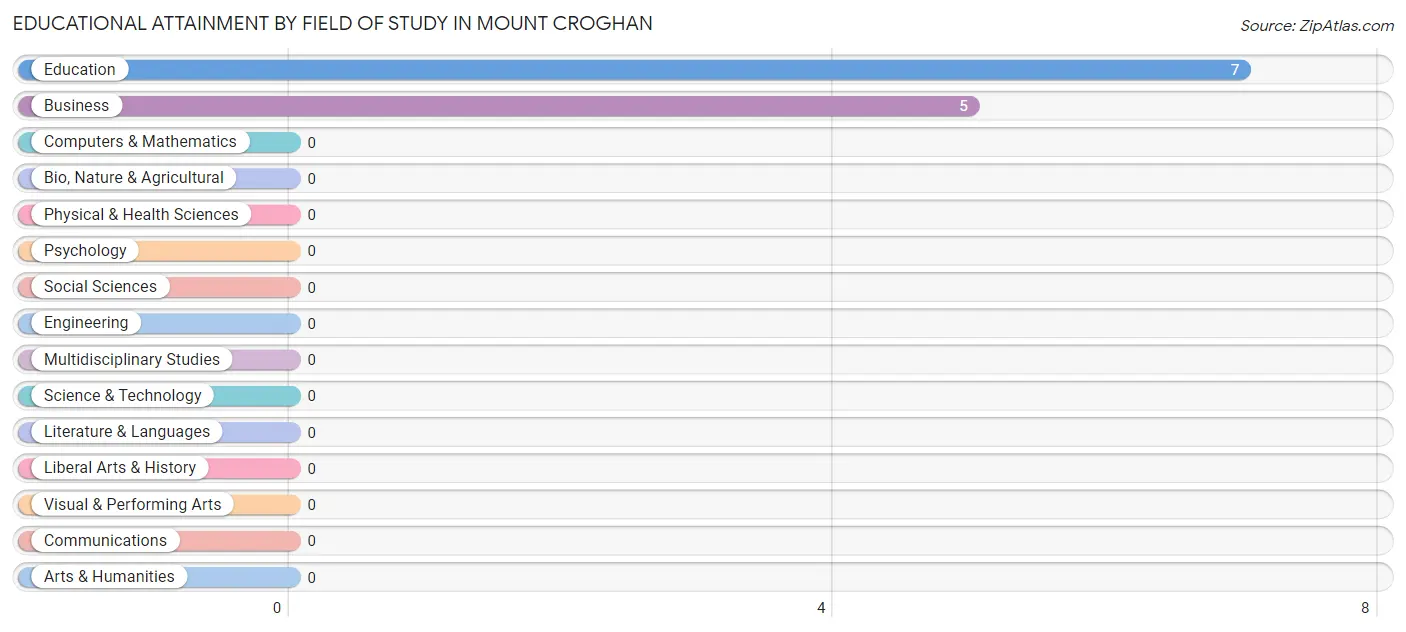
| Field of Study | # Graduates | % Graduates |
| Computers & Mathematics | 0 | 0.0% |
| Bio, Nature & Agricultural | 0 | 0.0% |
| Physical & Health Sciences | 0 | 0.0% |
| Psychology | 0 | 0.0% |
| Social Sciences | 0 | 0.0% |
| Engineering | 0 | 0.0% |
| Multidisciplinary Studies | 0 | 0.0% |
| Science & Technology | 0 | 0.0% |
| Business | 5 | 41.7% |
| Education | 7 | 58.3% |
| Literature & Languages | 0 | 0.0% |
| Liberal Arts & History | 0 | 0.0% |
| Visual & Performing Arts | 0 | 0.0% |
| Communications | 0 | 0.0% |
| Arts & Humanities | 0 | 0.0% |
| Total | 12 | 100.0% |
Transportation & Commute in Mount Croghan
Vehicle Availability by Sex in Mount Croghan
The most prevalent vehicle ownership categories in Mount Croghan are males with 2 vehicles (36, accounting for 87.8%) and females with 2 vehicles (9, making up 156.5%).
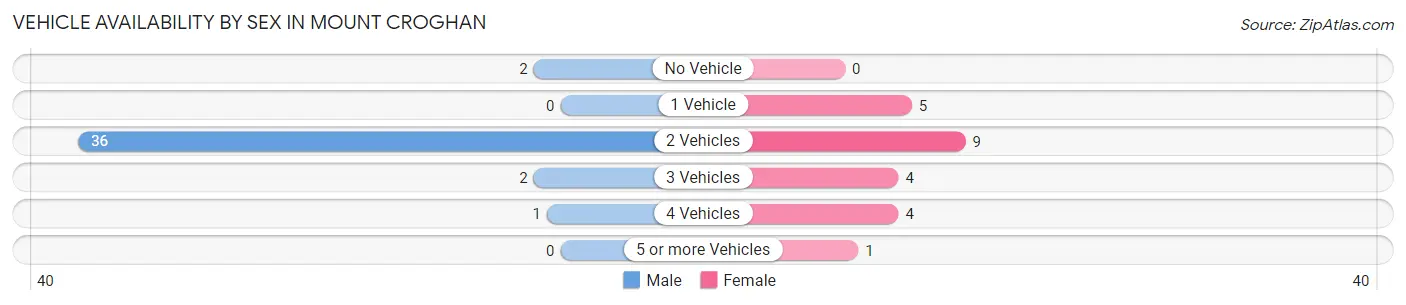
| Vehicles Available | Male | Female |
| No Vehicle | 2 (4.9%) | 0 (0.0%) |
| 1 Vehicle | 0 (0.0%) | 5 (21.7%) |
| 2 Vehicles | 36 (87.8%) | 9 (39.1%) |
| 3 Vehicles | 2 (4.9%) | 4 (17.4%) |
| 4 Vehicles | 1 (2.4%) | 4 (17.4%) |
| 5 or more Vehicles | 0 (0.0%) | 1 (4.3%) |
| Total | 41 (100.0%) | 23 (100.0%) |
Commute Time in Mount Croghan
The most frequently occuring commute durations in Mount Croghan are 30 to 34 minutes (31 commuters, 48.4%), 25 to 29 minutes (8 commuters, 12.5%), and 10 to 14 minutes (7 commuters, 10.9%).
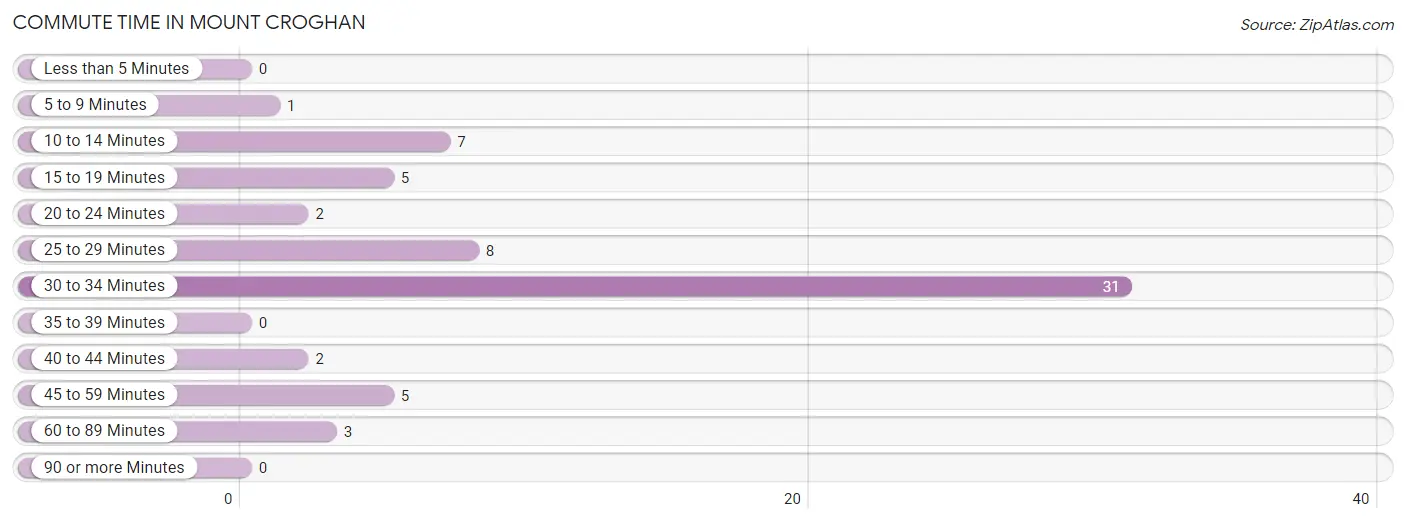
| Commute Time | # Commuters | % Commuters |
| Less than 5 Minutes | 0 | 0.0% |
| 5 to 9 Minutes | 1 | 1.6% |
| 10 to 14 Minutes | 7 | 10.9% |
| 15 to 19 Minutes | 5 | 7.8% |
| 20 to 24 Minutes | 2 | 3.1% |
| 25 to 29 Minutes | 8 | 12.5% |
| 30 to 34 Minutes | 31 | 48.4% |
| 35 to 39 Minutes | 0 | 0.0% |
| 40 to 44 Minutes | 2 | 3.1% |
| 45 to 59 Minutes | 5 | 7.8% |
| 60 to 89 Minutes | 3 | 4.7% |
| 90 or more Minutes | 0 | 0.0% |
Commute Time by Sex in Mount Croghan
The most common commute times in Mount Croghan are 30 to 34 minutes (29 commuters, 70.7%) for males and 25 to 29 minutes (5 commuters, 21.7%) for females.
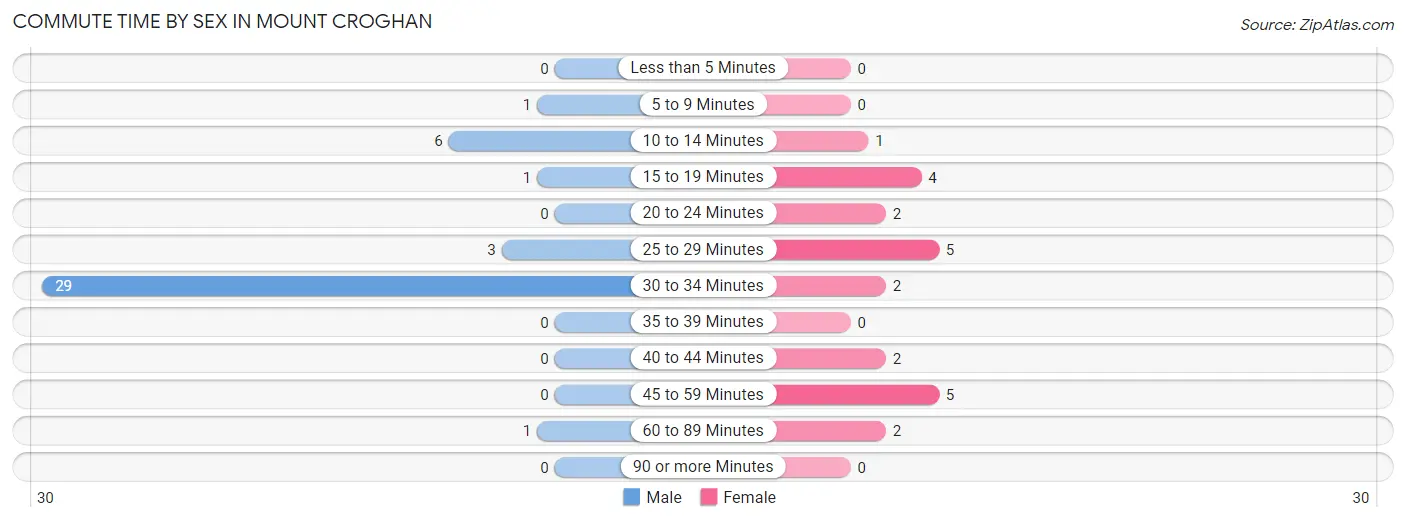
| Commute Time | Male | Female |
| Less than 5 Minutes | 0 (0.0%) | 0 (0.0%) |
| 5 to 9 Minutes | 1 (2.4%) | 0 (0.0%) |
| 10 to 14 Minutes | 6 (14.6%) | 1 (4.3%) |
| 15 to 19 Minutes | 1 (2.4%) | 4 (17.4%) |
| 20 to 24 Minutes | 0 (0.0%) | 2 (8.7%) |
| 25 to 29 Minutes | 3 (7.3%) | 5 (21.7%) |
| 30 to 34 Minutes | 29 (70.7%) | 2 (8.7%) |
| 35 to 39 Minutes | 0 (0.0%) | 0 (0.0%) |
| 40 to 44 Minutes | 0 (0.0%) | 2 (8.7%) |
| 45 to 59 Minutes | 0 (0.0%) | 5 (21.7%) |
| 60 to 89 Minutes | 1 (2.4%) | 2 (8.7%) |
| 90 or more Minutes | 0 (0.0%) | 0 (0.0%) |
Time of Departure to Work by Sex in Mount Croghan
The most frequent times of departure to work in Mount Croghan are 5:30 AM to 5:59 AM (30, 73.2%) for males and 7:30 AM to 7:59 AM (5, 21.7%) for females.
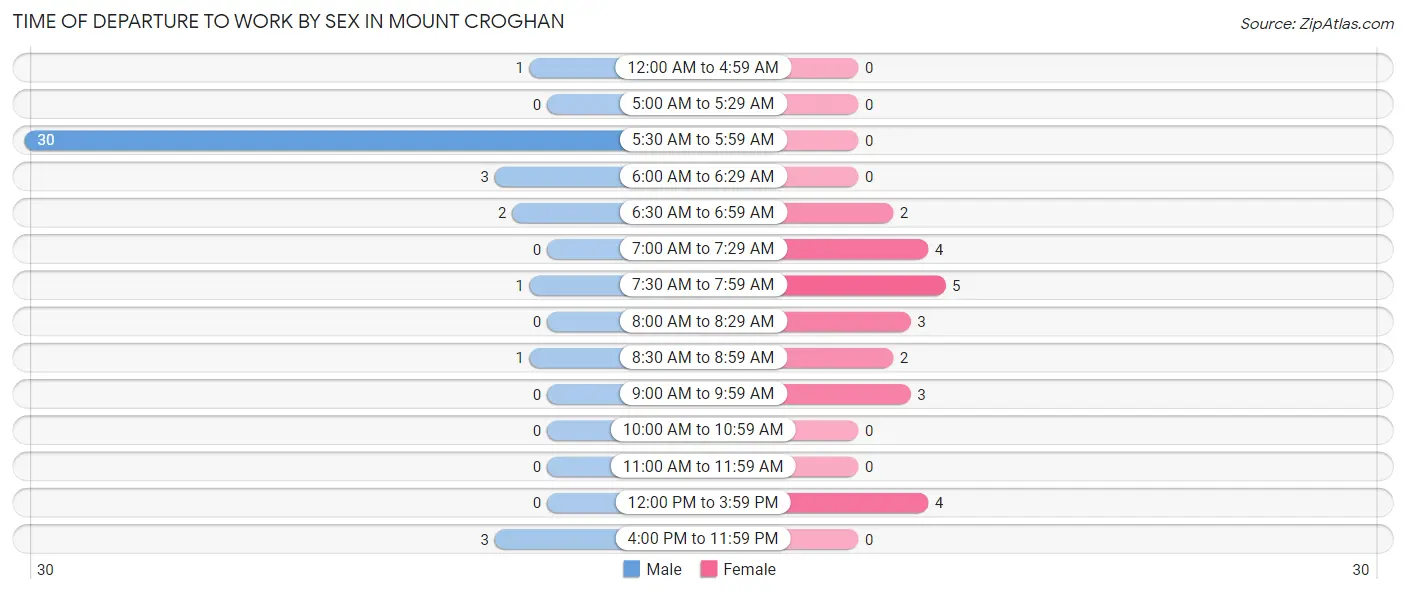
| Time of Departure | Male | Female |
| 12:00 AM to 4:59 AM | 1 (2.4%) | 0 (0.0%) |
| 5:00 AM to 5:29 AM | 0 (0.0%) | 0 (0.0%) |
| 5:30 AM to 5:59 AM | 30 (73.2%) | 0 (0.0%) |
| 6:00 AM to 6:29 AM | 3 (7.3%) | 0 (0.0%) |
| 6:30 AM to 6:59 AM | 2 (4.9%) | 2 (8.7%) |
| 7:00 AM to 7:29 AM | 0 (0.0%) | 4 (17.4%) |
| 7:30 AM to 7:59 AM | 1 (2.4%) | 5 (21.7%) |
| 8:00 AM to 8:29 AM | 0 (0.0%) | 3 (13.0%) |
| 8:30 AM to 8:59 AM | 1 (2.4%) | 2 (8.7%) |
| 9:00 AM to 9:59 AM | 0 (0.0%) | 3 (13.0%) |
| 10:00 AM to 10:59 AM | 0 (0.0%) | 0 (0.0%) |
| 11:00 AM to 11:59 AM | 0 (0.0%) | 0 (0.0%) |
| 12:00 PM to 3:59 PM | 0 (0.0%) | 4 (17.4%) |
| 4:00 PM to 11:59 PM | 3 (7.3%) | 0 (0.0%) |
| Total | 41 (100.0%) | 23 (100.0%) |
Housing Occupancy in Mount Croghan
Occupancy by Ownership in Mount Croghan
Of the total 77 dwellings in Mount Croghan, owner-occupied units account for 69 (89.6%), while renter-occupied units make up 8 (10.4%).
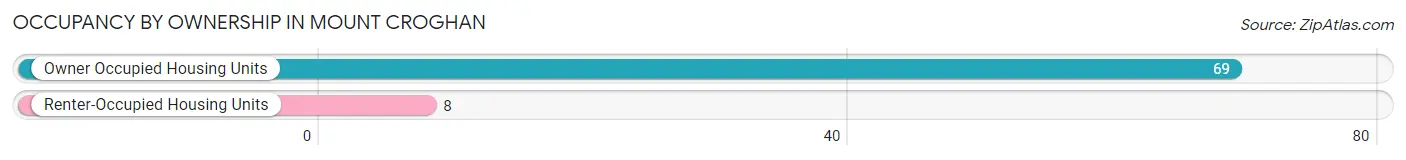
| Occupancy | # Housing Units | % Housing Units |
| Owner Occupied Housing Units | 69 | 89.6% |
| Renter-Occupied Housing Units | 8 | 10.4% |
| Total Occupied Housing Units | 77 | 100.0% |
Occupancy by Household Size in Mount Croghan
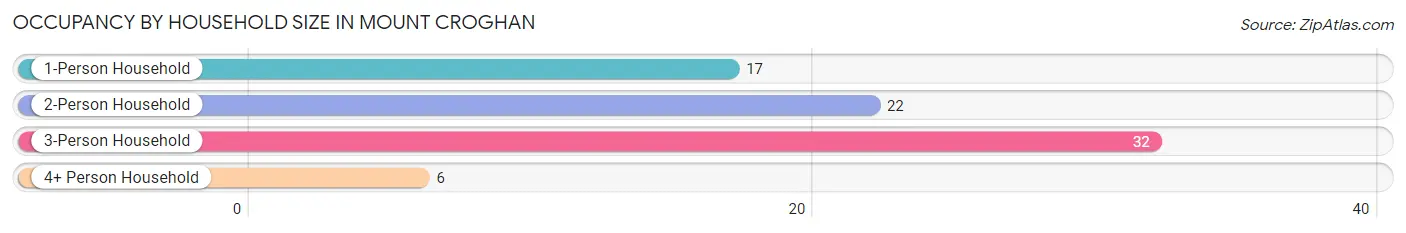
| Household Size | # Housing Units | % Housing Units |
| 1-Person Household | 17 | 22.1% |
| 2-Person Household | 22 | 28.6% |
| 3-Person Household | 32 | 41.6% |
| 4+ Person Household | 6 | 7.8% |
| Total Housing Units | 77 | 100.0% |
Occupancy by Ownership by Household Size in Mount Croghan
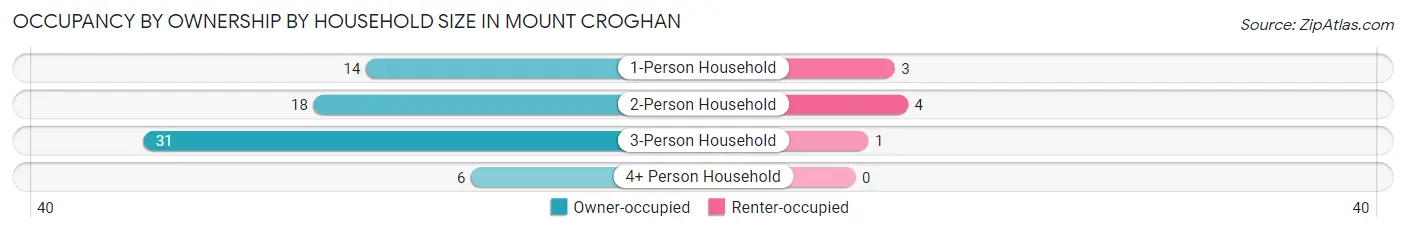
| Household Size | Owner-occupied | Renter-occupied |
| 1-Person Household | 14 (82.4%) | 3 (17.6%) |
| 2-Person Household | 18 (81.8%) | 4 (18.2%) |
| 3-Person Household | 31 (96.9%) | 1 (3.1%) |
| 4+ Person Household | 6 (100.0%) | 0 (0.0%) |
| Total Housing Units | 69 (89.6%) | 8 (10.4%) |
Occupancy by Educational Attainment in Mount Croghan
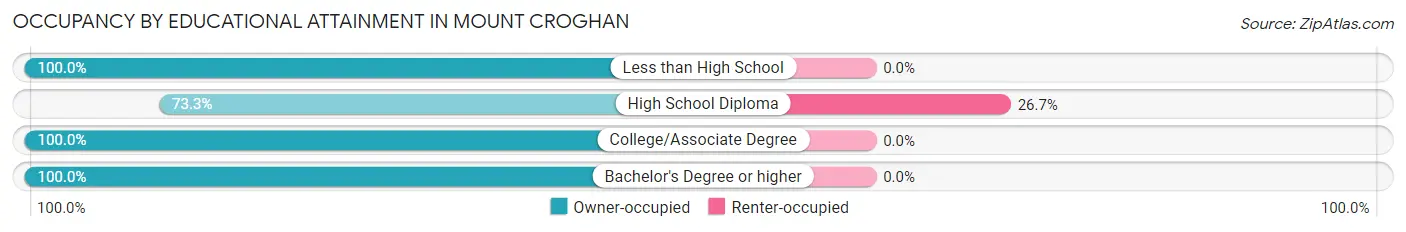
| Household Size | Owner-occupied | Renter-occupied |
| Less than High School | 3 (100.0%) | 0 (0.0%) |
| High School Diploma | 22 (73.3%) | 8 (26.7%) |
| College/Associate Degree | 42 (100.0%) | 0 (0.0%) |
| Bachelor's Degree or higher | 2 (100.0%) | 0 (0.0%) |
Occupancy by Age of Householder in Mount Croghan
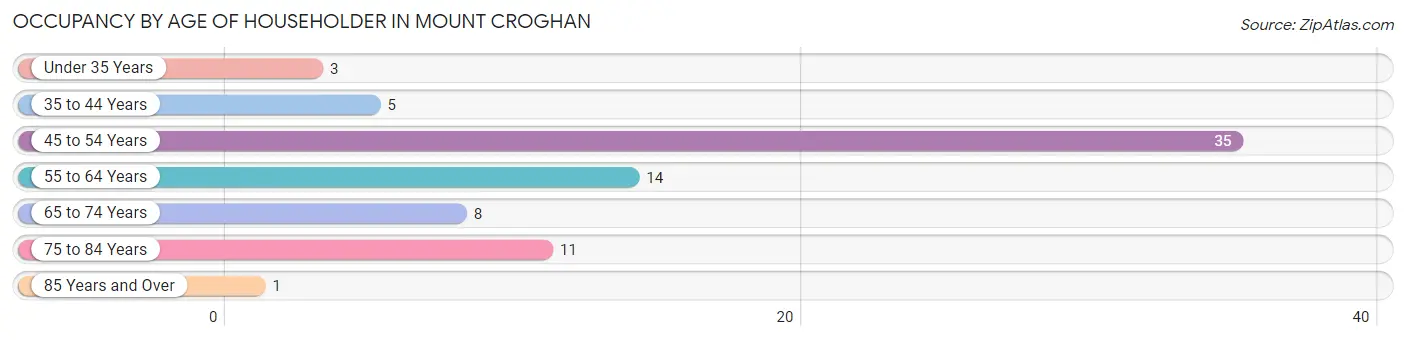
| Age Bracket | # Households | % Households |
| Under 35 Years | 3 | 3.9% |
| 35 to 44 Years | 5 | 6.5% |
| 45 to 54 Years | 35 | 45.5% |
| 55 to 64 Years | 14 | 18.2% |
| 65 to 74 Years | 8 | 10.4% |
| 75 to 84 Years | 11 | 14.3% |
| 85 Years and Over | 1 | 1.3% |
| Total | 77 | 100.0% |
Housing Finances in Mount Croghan
Median Income by Occupancy in Mount Croghan
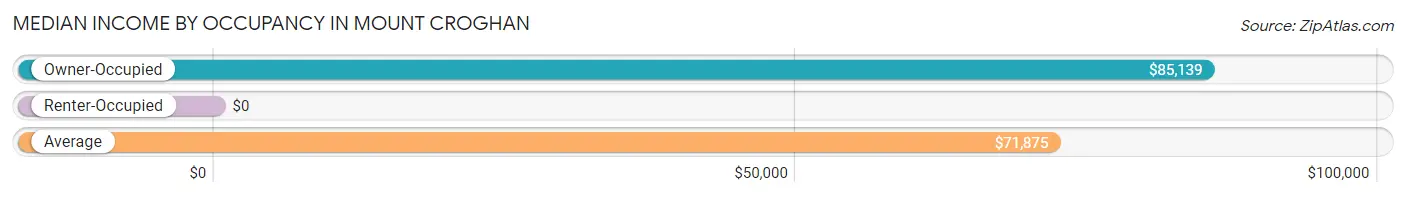
| Occupancy Type | # Households | Median Income |
| Owner-Occupied | 69 (89.6%) | $85,139 |
| Renter-Occupied | 8 (10.4%) | $0 |
| Average | 77 (100.0%) | $71,875 |
Occupancy by Householder Income Bracket in Mount Croghan
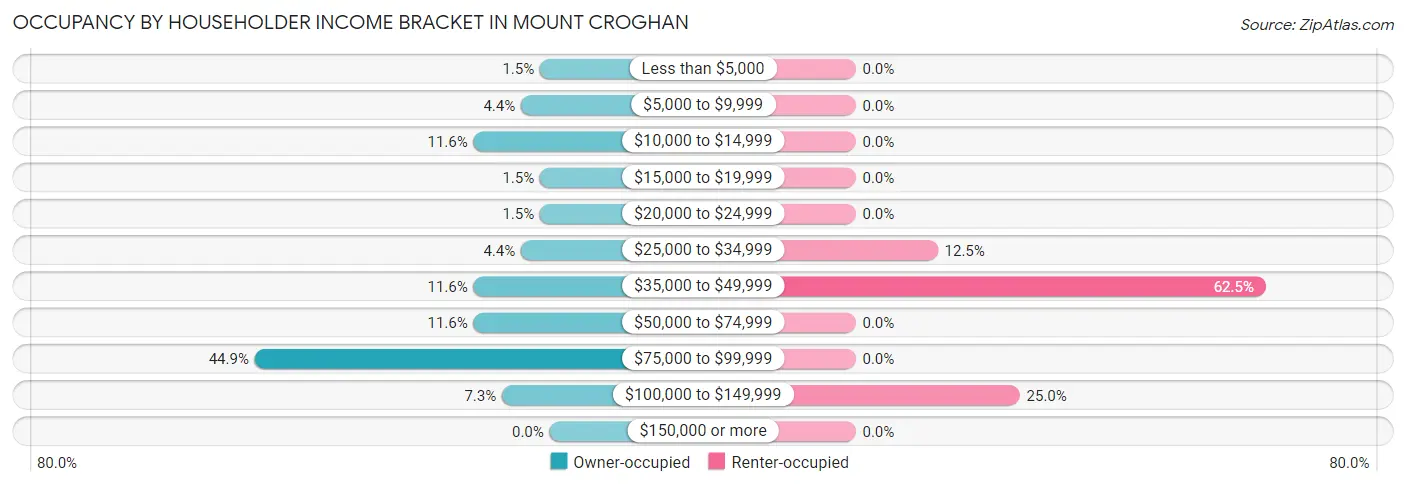
| Income Bracket | Owner-occupied | Renter-occupied |
| Less than $5,000 | 1 (1.5%) | 0 (0.0%) |
| $5,000 to $9,999 | 3 (4.3%) | 0 (0.0%) |
| $10,000 to $14,999 | 8 (11.6%) | 0 (0.0%) |
| $15,000 to $19,999 | 1 (1.5%) | 0 (0.0%) |
| $20,000 to $24,999 | 1 (1.5%) | 0 (0.0%) |
| $25,000 to $34,999 | 3 (4.3%) | 1 (12.5%) |
| $35,000 to $49,999 | 8 (11.6%) | 5 (62.5%) |
| $50,000 to $74,999 | 8 (11.6%) | 0 (0.0%) |
| $75,000 to $99,999 | 31 (44.9%) | 0 (0.0%) |
| $100,000 to $149,999 | 5 (7.2%) | 2 (25.0%) |
| $150,000 or more | 0 (0.0%) | 0 (0.0%) |
| Total | 69 (100.0%) | 8 (100.0%) |
Monthly Housing Cost Tiers in Mount Croghan
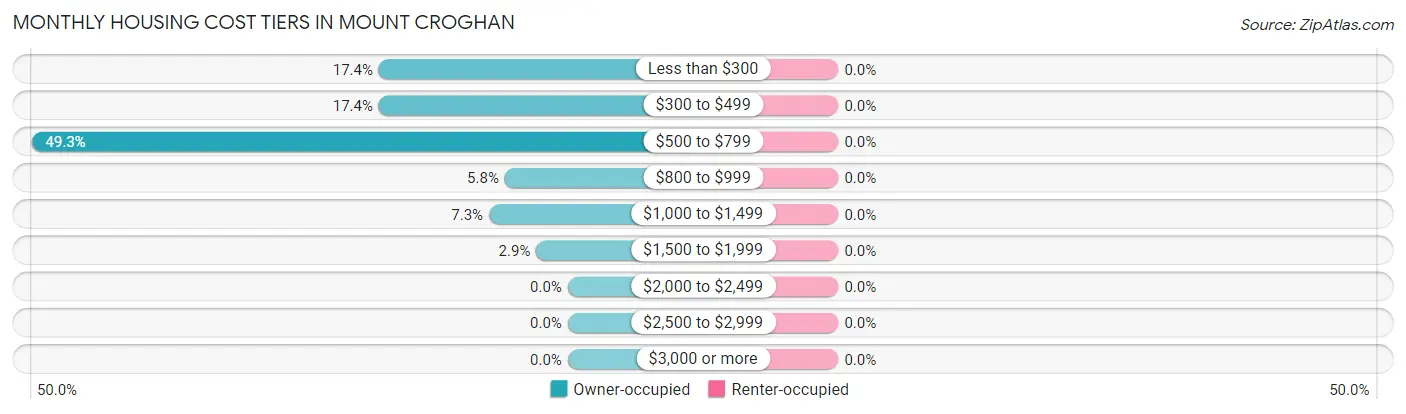
| Monthly Cost | Owner-occupied | Renter-occupied |
| Less than $300 | 12 (17.4%) | 0 (0.0%) |
| $300 to $499 | 12 (17.4%) | 0 (0.0%) |
| $500 to $799 | 34 (49.3%) | 0 (0.0%) |
| $800 to $999 | 4 (5.8%) | 0 (0.0%) |
| $1,000 to $1,499 | 5 (7.2%) | 0 (0.0%) |
| $1,500 to $1,999 | 2 (2.9%) | 0 (0.0%) |
| $2,000 to $2,499 | 0 (0.0%) | 0 (0.0%) |
| $2,500 to $2,999 | 0 (0.0%) | 0 (0.0%) |
| $3,000 or more | 0 (0.0%) | 0 (0.0%) |
| Total | 69 (100.0%) | 8 (100.0%) |
Physical Housing Characteristics in Mount Croghan
Housing Structures in Mount Croghan
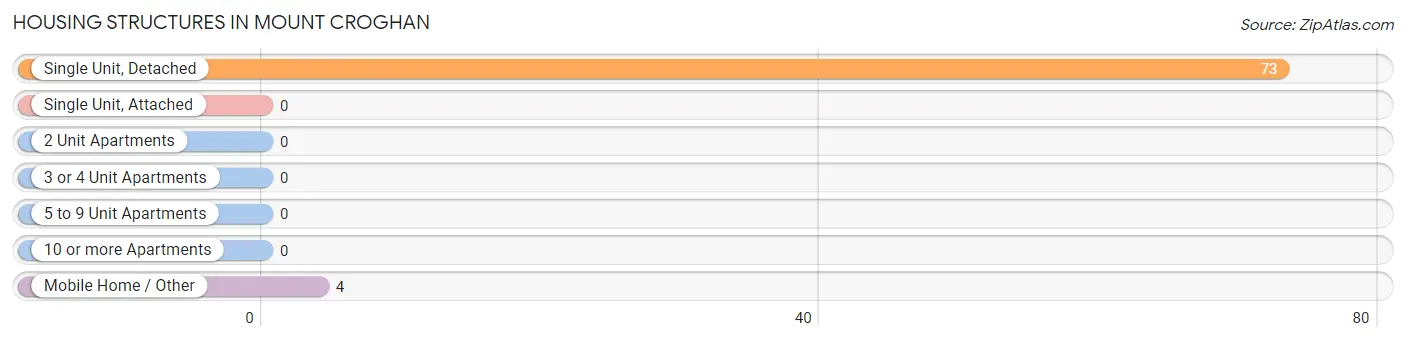
| Structure Type | # Housing Units | % Housing Units |
| Single Unit, Detached | 73 | 94.8% |
| Single Unit, Attached | 0 | 0.0% |
| 2 Unit Apartments | 0 | 0.0% |
| 3 or 4 Unit Apartments | 0 | 0.0% |
| 5 to 9 Unit Apartments | 0 | 0.0% |
| 10 or more Apartments | 0 | 0.0% |
| Mobile Home / Other | 4 | 5.2% |
| Total | 77 | 100.0% |
Housing Structures by Occupancy in Mount Croghan
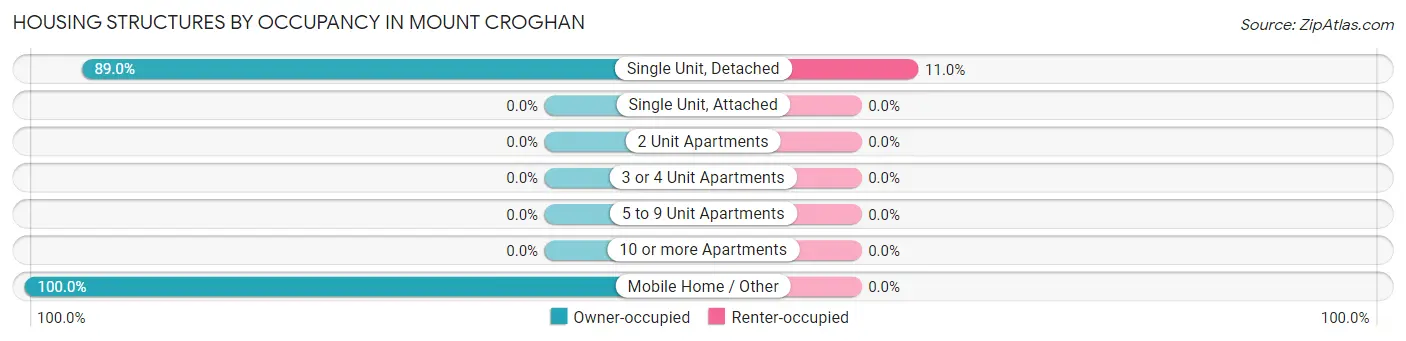
| Structure Type | Owner-occupied | Renter-occupied |
| Single Unit, Detached | 65 (89.0%) | 8 (11.0%) |
| Single Unit, Attached | 0 (0.0%) | 0 (0.0%) |
| 2 Unit Apartments | 0 (0.0%) | 0 (0.0%) |
| 3 or 4 Unit Apartments | 0 (0.0%) | 0 (0.0%) |
| 5 to 9 Unit Apartments | 0 (0.0%) | 0 (0.0%) |
| 10 or more Apartments | 0 (0.0%) | 0 (0.0%) |
| Mobile Home / Other | 4 (100.0%) | 0 (0.0%) |
| Total | 69 (89.6%) | 8 (10.4%) |
Housing Structures by Number of Rooms in Mount Croghan
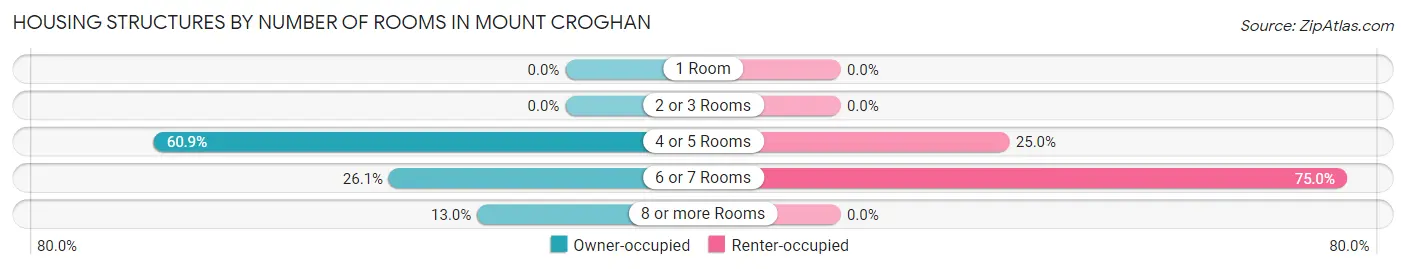
| Number of Rooms | Owner-occupied | Renter-occupied |
| 1 Room | 0 (0.0%) | 0 (0.0%) |
| 2 or 3 Rooms | 0 (0.0%) | 0 (0.0%) |
| 4 or 5 Rooms | 42 (60.9%) | 2 (25.0%) |
| 6 or 7 Rooms | 18 (26.1%) | 6 (75.0%) |
| 8 or more Rooms | 9 (13.0%) | 0 (0.0%) |
| Total | 69 (100.0%) | 8 (100.0%) |
Housing Structure by Heating Type in Mount Croghan
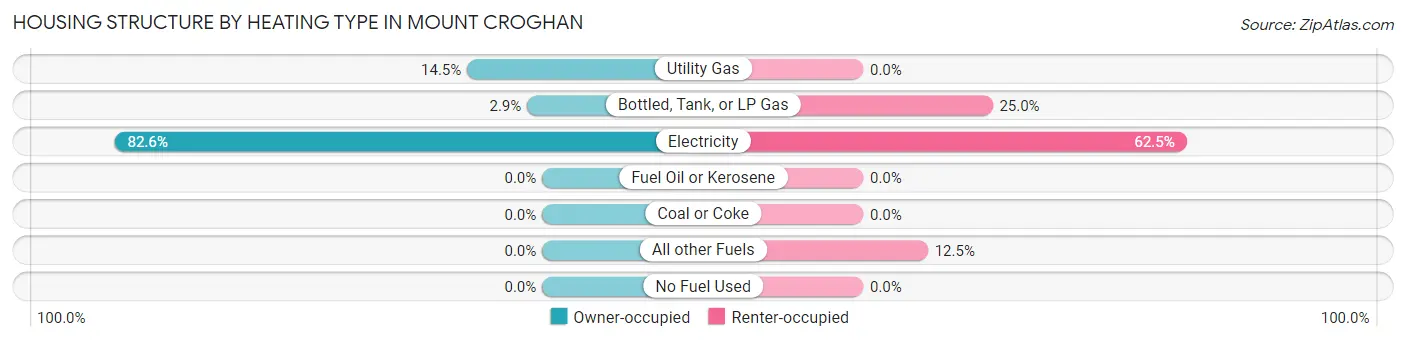
| Heating Type | Owner-occupied | Renter-occupied |
| Utility Gas | 10 (14.5%) | 0 (0.0%) |
| Bottled, Tank, or LP Gas | 2 (2.9%) | 2 (25.0%) |
| Electricity | 57 (82.6%) | 5 (62.5%) |
| Fuel Oil or Kerosene | 0 (0.0%) | 0 (0.0%) |
| Coal or Coke | 0 (0.0%) | 0 (0.0%) |
| All other Fuels | 0 (0.0%) | 1 (12.5%) |
| No Fuel Used | 0 (0.0%) | 0 (0.0%) |
| Total | 69 (100.0%) | 8 (100.0%) |
Household Vehicle Usage in Mount Croghan
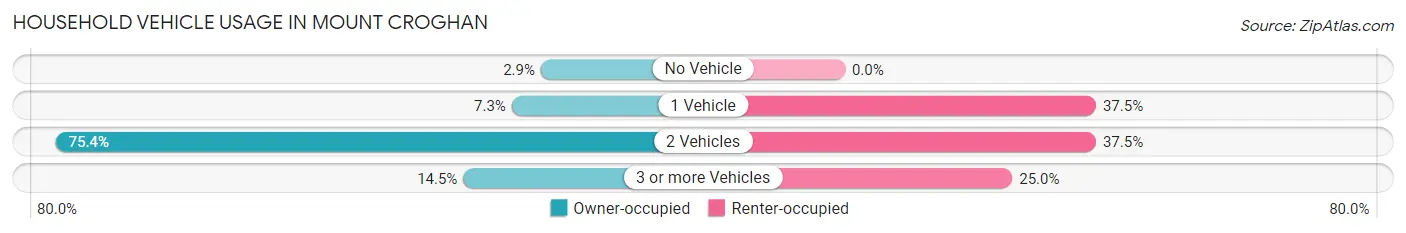
| Vehicles per Household | Owner-occupied | Renter-occupied |
| No Vehicle | 2 (2.9%) | 0 (0.0%) |
| 1 Vehicle | 5 (7.2%) | 3 (37.5%) |
| 2 Vehicles | 52 (75.4%) | 3 (37.5%) |
| 3 or more Vehicles | 10 (14.5%) | 2 (25.0%) |
| Total | 69 (100.0%) | 8 (100.0%) |
Real Estate & Mortgages in Mount Croghan
Real Estate and Mortgage Overview in Mount Croghan
| Characteristic | Without Mortgage | With Mortgage |
| Housing Units | 26 | 43 |
| Median Property Value | $200,000 | $86,100 |
| Median Household Income | - | - |
| Monthly Housing Costs | $317 | $0 |
| Real Estate Taxes | $264 | $0 |
Property Value by Mortgage Status in Mount Croghan
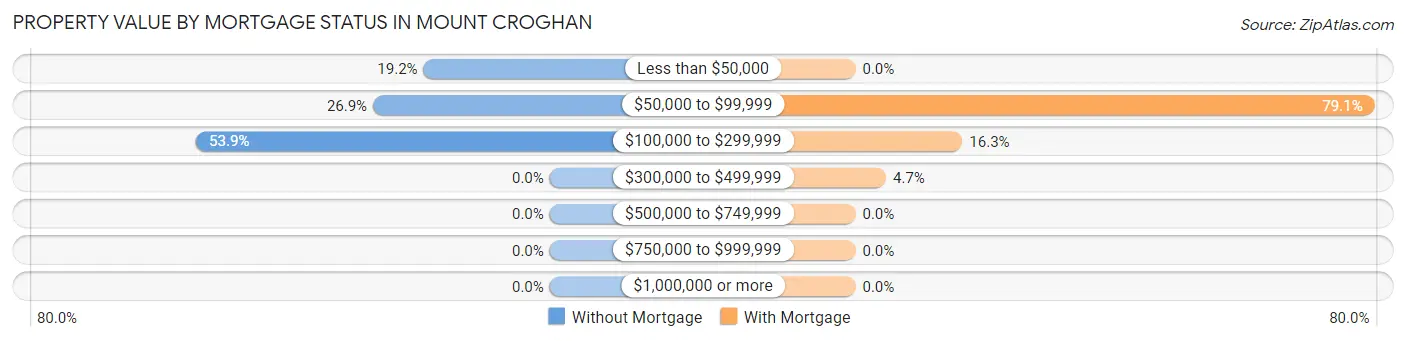
| Property Value | Without Mortgage | With Mortgage |
| Less than $50,000 | 5 (19.2%) | 0 (0.0%) |
| $50,000 to $99,999 | 7 (26.9%) | 34 (79.1%) |
| $100,000 to $299,999 | 14 (53.8%) | 7 (16.3%) |
| $300,000 to $499,999 | 0 (0.0%) | 2 (4.6%) |
| $500,000 to $749,999 | 0 (0.0%) | 0 (0.0%) |
| $750,000 to $999,999 | 0 (0.0%) | 0 (0.0%) |
| $1,000,000 or more | 0 (0.0%) | 0 (0.0%) |
| Total | 26 (100.0%) | 43 (100.0%) |
Household Income by Mortgage Status in Mount Croghan
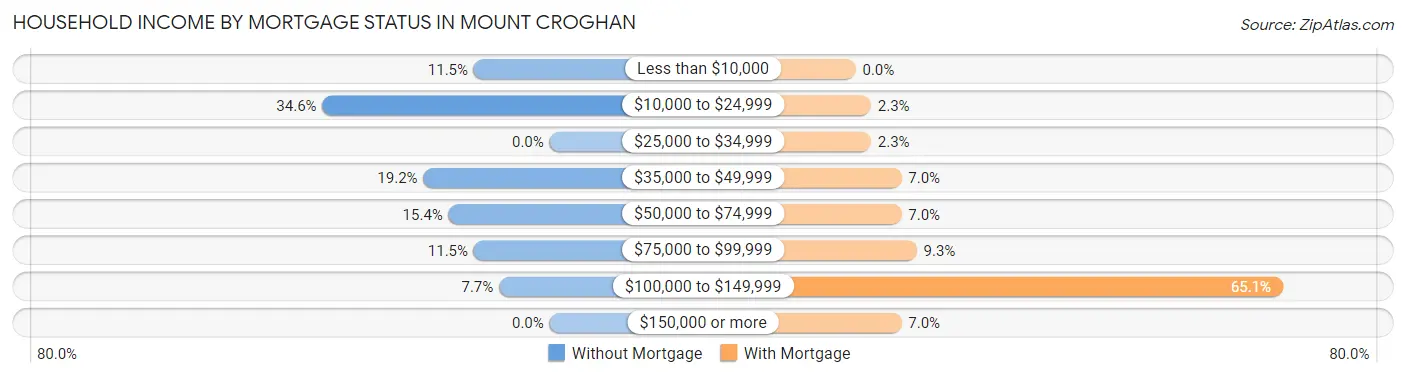
| Household Income | Without Mortgage | With Mortgage |
| Less than $10,000 | 3 (11.5%) | 0 (0.0%) |
| $10,000 to $24,999 | 9 (34.6%) | 1 (2.3%) |
| $25,000 to $34,999 | 0 (0.0%) | 1 (2.3%) |
| $35,000 to $49,999 | 5 (19.2%) | 3 (7.0%) |
| $50,000 to $74,999 | 4 (15.4%) | 3 (7.0%) |
| $75,000 to $99,999 | 3 (11.5%) | 4 (9.3%) |
| $100,000 to $149,999 | 2 (7.7%) | 28 (65.1%) |
| $150,000 or more | 0 (0.0%) | 3 (7.0%) |
| Total | 26 (100.0%) | 43 (100.0%) |
Property Value to Household Income Ratio in Mount Croghan
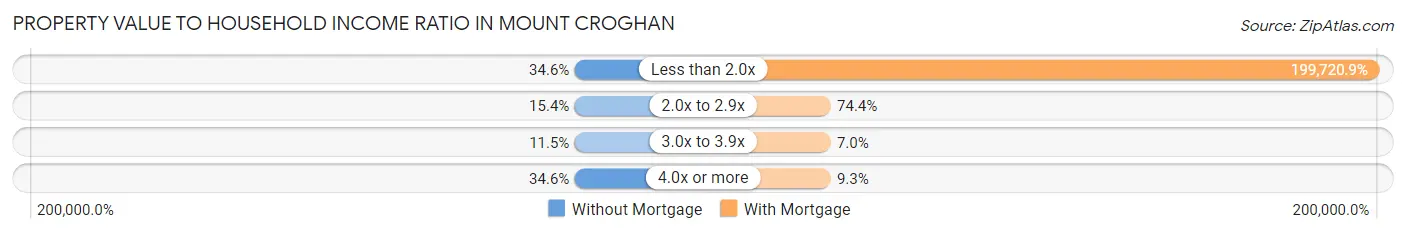
| Value-to-Income Ratio | Without Mortgage | With Mortgage |
| Less than 2.0x | 9 (34.6%) | 85,880 (199,720.9%) |
| 2.0x to 2.9x | 4 (15.4%) | 32 (74.4%) |
| 3.0x to 3.9x | 3 (11.5%) | 3 (7.0%) |
| 4.0x or more | 9 (34.6%) | 4 (9.3%) |
| Total | 26 (100.0%) | 43 (100.0%) |
Real Estate Taxes by Mortgage Status in Mount Croghan
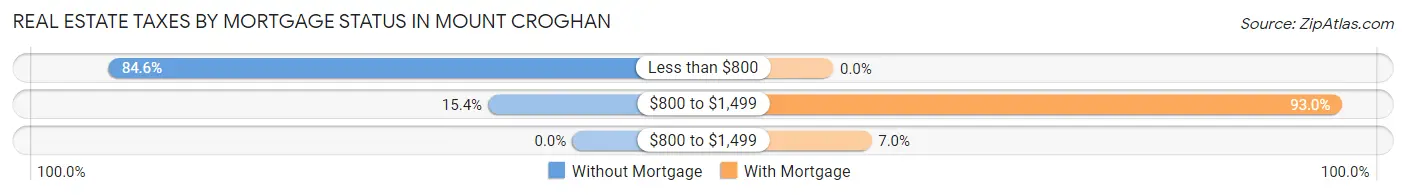
| Property Taxes | Without Mortgage | With Mortgage |
| Less than $800 | 22 (84.6%) | 0 (0.0%) |
| $800 to $1,499 | 4 (15.4%) | 40 (93.0%) |
| $800 to $1,499 | 0 (0.0%) | 3 (7.0%) |
| Total | 26 (100.0%) | 43 (100.0%) |
Health & Disability in Mount Croghan
Health Insurance Coverage by Age in Mount Croghan
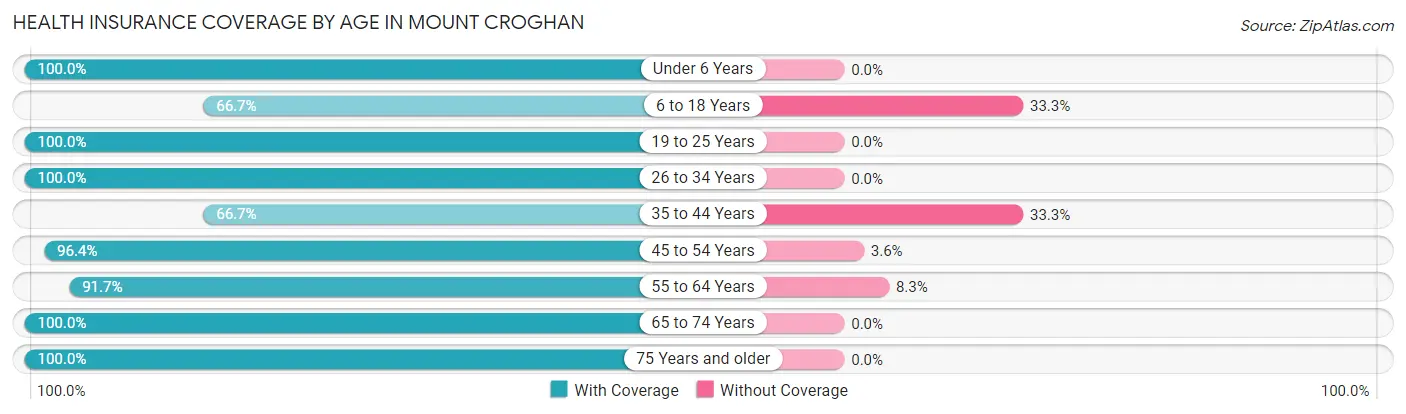
| Age Bracket | With Coverage | Without Coverage |
| Under 6 Years | 11 (100.0%) | 0 (0.0%) |
| 6 to 18 Years | 6 (66.7%) | 3 (33.3%) |
| 19 to 25 Years | 4 (100.0%) | 0 (0.0%) |
| 26 to 34 Years | 11 (100.0%) | 0 (0.0%) |
| 35 to 44 Years | 4 (66.7%) | 2 (33.3%) |
| 45 to 54 Years | 53 (96.4%) | 2 (3.6%) |
| 55 to 64 Years | 22 (91.7%) | 2 (8.3%) |
| 65 to 74 Years | 22 (100.0%) | 0 (0.0%) |
| 75 Years and older | 35 (100.0%) | 0 (0.0%) |
| Total | 168 (94.9%) | 9 (5.1%) |
Health Insurance Coverage by Citizenship Status in Mount Croghan
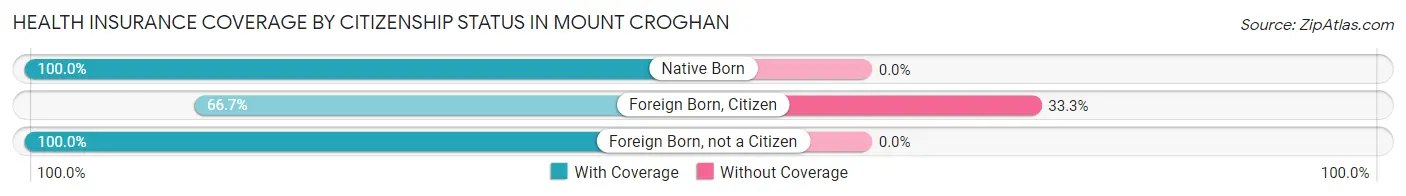
| Citizenship Status | With Coverage | Without Coverage |
| Native Born | 11 (100.0%) | 0 (0.0%) |
| Foreign Born, Citizen | 6 (66.7%) | 3 (33.3%) |
| Foreign Born, not a Citizen | 4 (100.0%) | 0 (0.0%) |
Health Insurance Coverage by Household Income in Mount Croghan

| Household Income | With Coverage | Without Coverage |
| Under $25,000 | 19 (100.0%) | 0 (0.0%) |
| $25,000 to $49,999 | 29 (80.6%) | 7 (19.4%) |
| $50,000 to $74,999 | 21 (100.0%) | 0 (0.0%) |
| $75,000 to $99,999 | 80 (100.0%) | 0 (0.0%) |
| $100,000 and over | 19 (90.5%) | 2 (9.5%) |
Public vs Private Health Insurance Coverage by Age in Mount Croghan
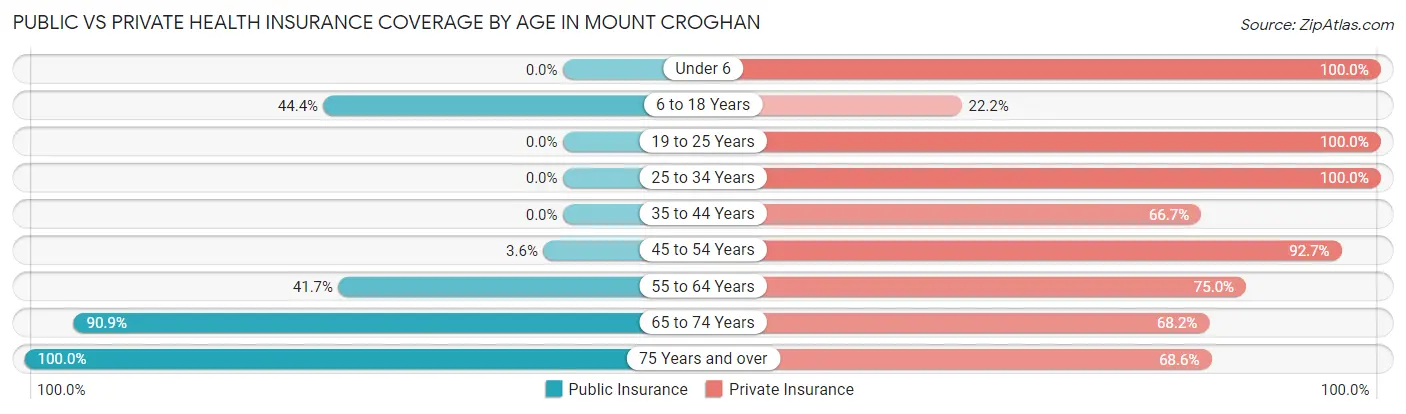
| Age Bracket | Public Insurance | Private Insurance |
| Under 6 | 0 (0.0%) | 11 (100.0%) |
| 6 to 18 Years | 4 (44.4%) | 2 (22.2%) |
| 19 to 25 Years | 0 (0.0%) | 4 (100.0%) |
| 25 to 34 Years | 0 (0.0%) | 11 (100.0%) |
| 35 to 44 Years | 0 (0.0%) | 4 (66.7%) |
| 45 to 54 Years | 2 (3.6%) | 51 (92.7%) |
| 55 to 64 Years | 10 (41.7%) | 18 (75.0%) |
| 65 to 74 Years | 20 (90.9%) | 15 (68.2%) |
| 75 Years and over | 35 (100.0%) | 24 (68.6%) |
| Total | 71 (40.1%) | 140 (79.1%) |
Disability Status by Sex by Age in Mount Croghan
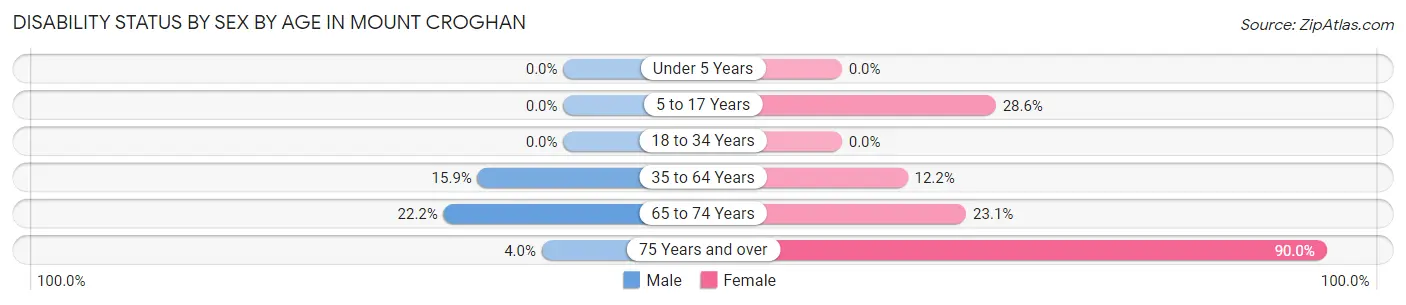
| Age Bracket | Male | Female |
| Under 5 Years | 0 (0.0%) | 0 (0.0%) |
| 5 to 17 Years | 0 (0.0%) | 2 (28.6%) |
| 18 to 34 Years | 0 (0.0%) | 0 (0.0%) |
| 35 to 64 Years | 7 (15.9%) | 5 (12.2%) |
| 65 to 74 Years | 2 (22.2%) | 3 (23.1%) |
| 75 Years and over | 1 (4.0%) | 9 (90.0%) |
Disability Class by Sex by Age in Mount Croghan
Disability Class: Hearing Difficulty
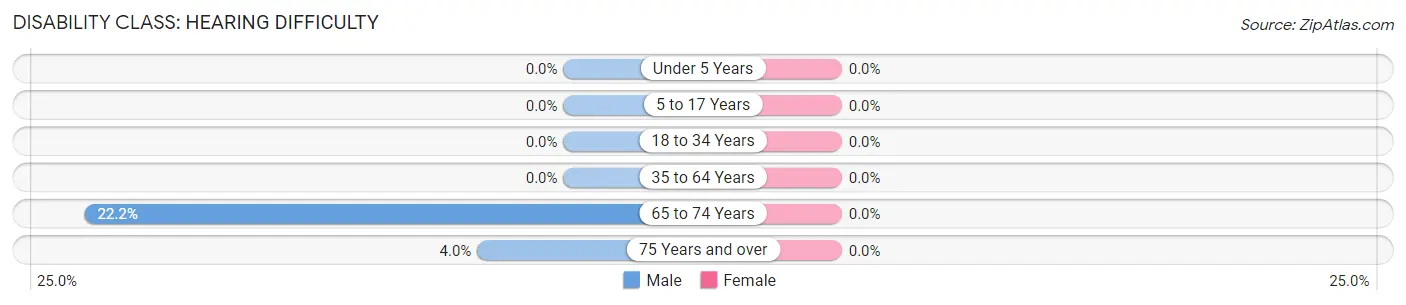
| Age Bracket | Male | Female |
| Under 5 Years | 0 (0.0%) | 0 (0.0%) |
| 5 to 17 Years | 0 (0.0%) | 0 (0.0%) |
| 18 to 34 Years | 0 (0.0%) | 0 (0.0%) |
| 35 to 64 Years | 0 (0.0%) | 0 (0.0%) |
| 65 to 74 Years | 2 (22.2%) | 0 (0.0%) |
| 75 Years and over | 1 (4.0%) | 0 (0.0%) |
Disability Class: Vision Difficulty
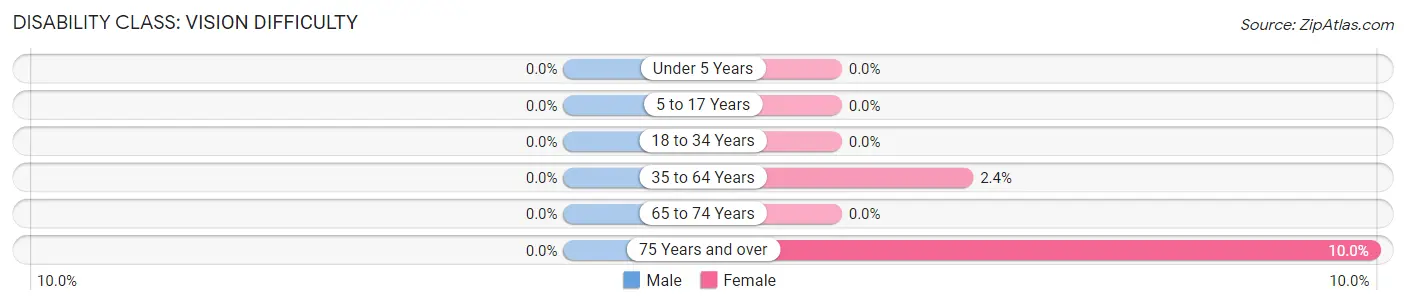
| Age Bracket | Male | Female |
| Under 5 Years | 0 (0.0%) | 0 (0.0%) |
| 5 to 17 Years | 0 (0.0%) | 0 (0.0%) |
| 18 to 34 Years | 0 (0.0%) | 0 (0.0%) |
| 35 to 64 Years | 0 (0.0%) | 1 (2.4%) |
| 65 to 74 Years | 0 (0.0%) | 0 (0.0%) |
| 75 Years and over | 0 (0.0%) | 1 (10.0%) |
Disability Class: Cognitive Difficulty
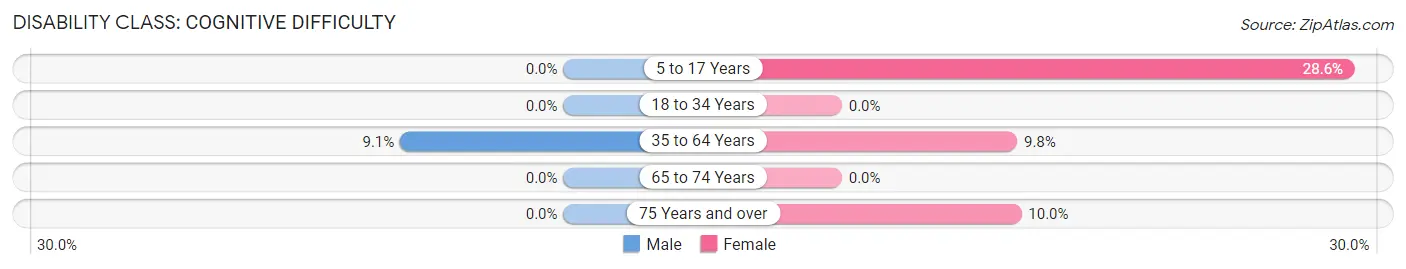
| Age Bracket | Male | Female |
| 5 to 17 Years | 0 (0.0%) | 2 (28.6%) |
| 18 to 34 Years | 0 (0.0%) | 0 (0.0%) |
| 35 to 64 Years | 4 (9.1%) | 4 (9.8%) |
| 65 to 74 Years | 0 (0.0%) | 0 (0.0%) |
| 75 Years and over | 0 (0.0%) | 1 (10.0%) |
Disability Class: Ambulatory Difficulty
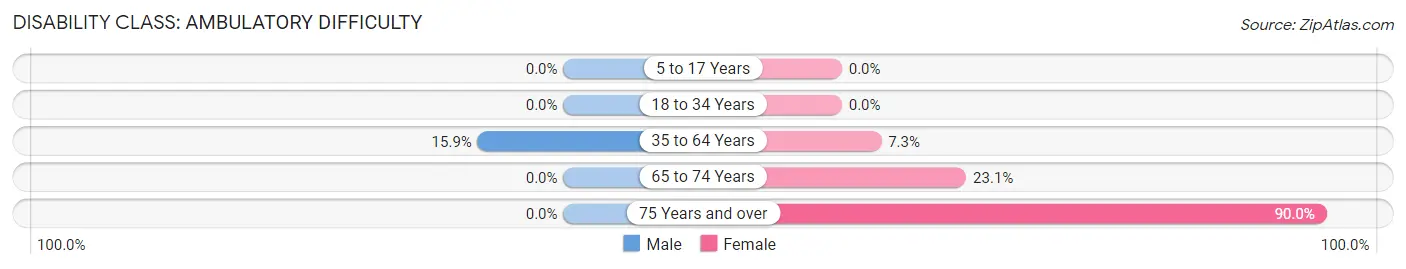
| Age Bracket | Male | Female |
| 5 to 17 Years | 0 (0.0%) | 0 (0.0%) |
| 18 to 34 Years | 0 (0.0%) | 0 (0.0%) |
| 35 to 64 Years | 7 (15.9%) | 3 (7.3%) |
| 65 to 74 Years | 0 (0.0%) | 3 (23.1%) |
| 75 Years and over | 0 (0.0%) | 9 (90.0%) |
Disability Class: Self-Care Difficulty
| Age Bracket | Male | Female |
| 5 to 17 Years | 0 (0.0%) | 0 (0.0%) |
| 18 to 34 Years | 0 (0.0%) | 0 (0.0%) |
| 35 to 64 Years | 4 (9.1%) | 0 (0.0%) |
| 65 to 74 Years | 0 (0.0%) | 1 (7.7%) |
| 75 Years and over | 0 (0.0%) | 0 (0.0%) |
Technology Access in Mount Croghan
Computing Device Access in Mount Croghan
| Device Type | # Households | % Households |
| Desktop or Laptop | 58 | 75.3% |
| Smartphone | 62 | 80.5% |
| Tablet | 53 | 68.8% |
| No Computing Device | 9 | 11.7% |
| Total | 77 | 100.0% |
Internet Access in Mount Croghan
| Internet Type | # Households | % Households |
| Dial-Up Internet | 0 | 0.0% |
| Broadband Home | 64 | 83.1% |
| Cellular Data Only | 2 | 2.6% |
| Satellite Internet | 3 | 3.9% |
| No Internet | 10 | 13.0% |
| Total | 77 | 100.0% |
Mount Croghan Summary
Introduction
Mount Croghan is a small town located in Chesterfield County, South Carolina. It is situated in the Piedmont region of the state, approximately 30 miles south of Charlotte, North Carolina. The town has a population of just over 500 people and is known for its rural charm and small-town atmosphere. The town is home to a variety of businesses, including a grocery store, a hardware store, and a few restaurants.
History
Mount Croghan was founded in 1845 by a group of settlers from North Carolina. The town was named after the nearby mountain, which was named after a local Native American chief. The town was originally a farming community, and the main crops grown were cotton, corn, and tobacco. In the late 19th century, the town began to grow and develop, and by the early 20th century, it had become a thriving community.
In the 1950s, the town began to decline as many of the residents moved away in search of better economic opportunities. The town was further impacted by the construction of Interstate 77, which bypassed the town and caused a decrease in traffic. In the late 1990s, the town began to experience a resurgence as new businesses opened and the population began to grow.
Geography
Mount Croghan is located in the Piedmont region of South Carolina, approximately 30 miles south of Charlotte, North Carolina. The town is situated in a rural area, surrounded by rolling hills and farmland. The town is located near the Catawba River, which provides a source of recreation for the residents.
The town has a total area of 1.2 square miles, all of which is land. The town has a humid subtropical climate, with hot, humid summers and mild winters. The average annual temperature is around 70 degrees Fahrenheit.
Economy
The economy of Mount Croghan is largely based on agriculture and tourism. The town is home to a variety of businesses, including a grocery store, a hardware store, and a few restaurants. The town also has a few small manufacturing businesses.
The town is also home to a variety of tourist attractions, including the Catawba River, which provides a source of recreation for the residents. The town also has a few historic sites, including the Mount Croghan Historic District, which is listed on the National Register of Historic Places.
Demographics
As of the 2010 census, the population of Mount Croghan was 517. The racial makeup of the town was 94.3% White, 3.7% African American, 0.2% Native American, 0.4% Asian, and 1.4% from other races. The median household income was $31,250, and the median family income was $37,500.
Conclusion
Mount Croghan is a small town located in Chesterfield County, South Carolina. The town has a population of just over 500 people and is known for its rural charm and small-town atmosphere. The town is home to a variety of businesses, including a grocery store, a hardware store, and a few restaurants. The economy of the town is largely based on agriculture and tourism. The town has a humid subtropical climate, with hot, humid summers and mild winters. As of the 2010 census, the population of Mount Croghan was 517, with a median household income of $31,250.
Common Questions
What is Per Capita Income in Mount Croghan?
Per Capita income in Mount Croghan is $26,131.
What is the Median Family Income in Mount Croghan?
Median Family Income in Mount Croghan is $85,602.
What is the Median Household income in Mount Croghan?
Median Household Income in Mount Croghan is $71,875.
What is Income or Wage Gap in Mount Croghan?
Income or Wage Gap in Mount Croghan is 32.0%.
Women in Mount Croghan earn 68.0 cents for every dollar earned by a man.
What is Inequality or Gini Index in Mount Croghan?
Inequality or Gini Index in Mount Croghan is 0.30.
What is the Total Population of Mount Croghan?
Total Population of Mount Croghan is 177.
What is the Total Male Population of Mount Croghan?
Total Male Population of Mount Croghan is 92.
What is the Total Female Population of Mount Croghan?
Total Female Population of Mount Croghan is 85.
What is the Ratio of Males per 100 Females in Mount Croghan?
There are 108.24 Males per 100 Females in Mount Croghan.
What is the Ratio of Females per 100 Males in Mount Croghan?
There are 92.39 Females per 100 Males in Mount Croghan.
What is the Median Population Age in Mount Croghan?
Median Population Age in Mount Croghan is 49.8 Years.
What is the Average Family Size in Mount Croghan
Average Family Size in Mount Croghan is 2.8 People.
What is the Average Household Size in Mount Croghan
Average Household Size in Mount Croghan is 2.3 People.
How Large is the Labor Force in Mount Croghan?
There are 66 People in the Labor Forcein in Mount Croghan.
What is the Percentage of People in the Labor Force in Mount Croghan?
42.0% of People are in the Labor Force in Mount Croghan.