Zip Codes with the Highest Percentage of Households with Income Above $200,000 in Oklahoma
RELATED REPORTS & OPTIONS
Household Income | $200k+
Oklahoma
Compare Zip Codes
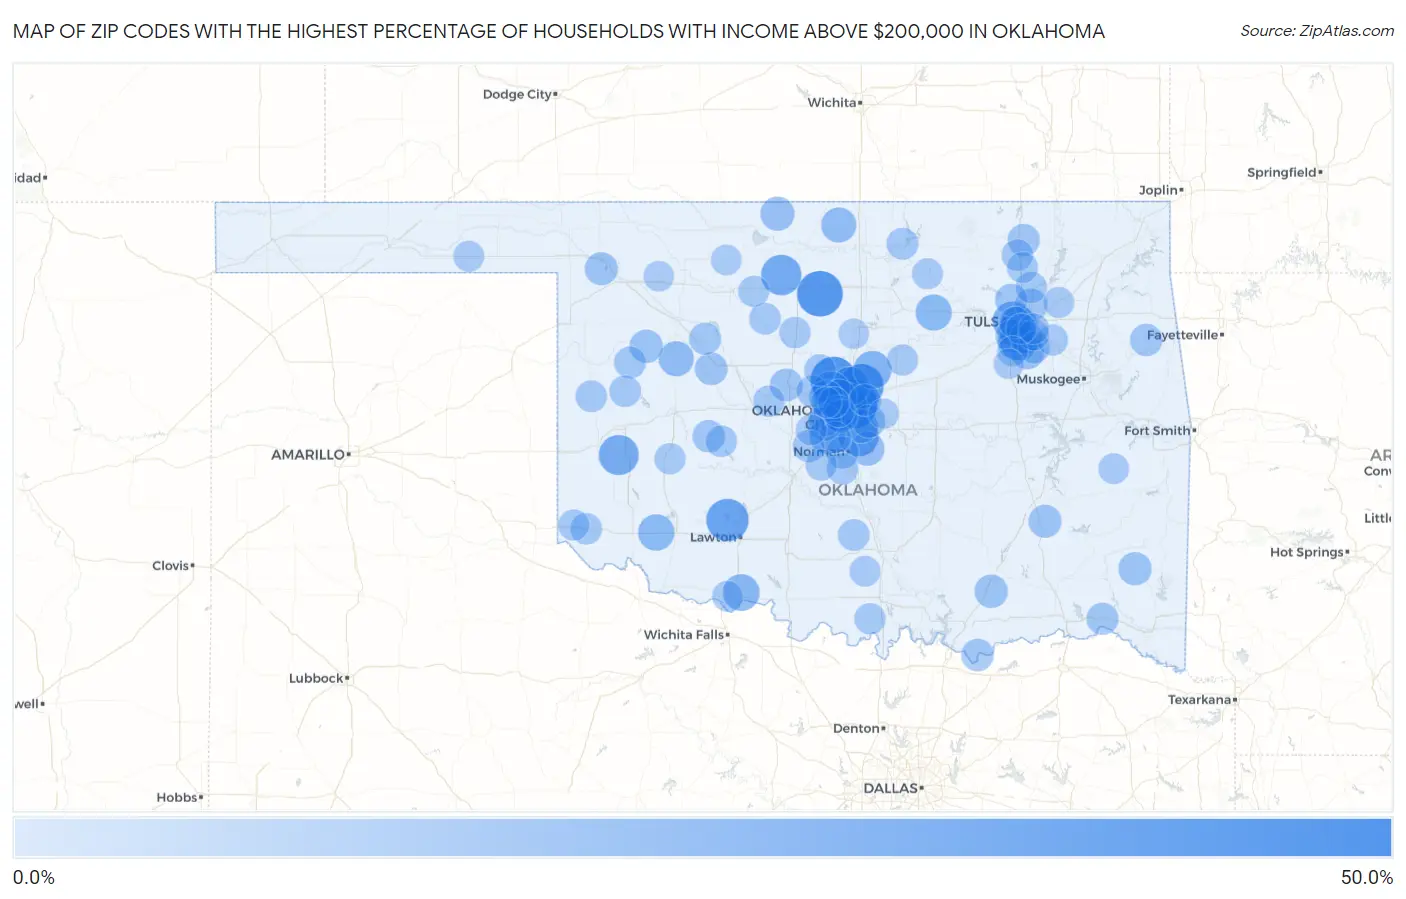
Map of Zip Codes with the Highest Percentage of Households with Income Above $200,000 in Oklahoma
0.0%
50.0%
Zip Codes with the Highest Percentage of Households with Income Above $200,000 in Oklahoma
| Zip Code | Households with Income > $200k | vs State | vs National | |
| 1. | 73151 | 42.5% | 6.3%(+36.2)#1 | 11.4%(+31.1)#527 |
| 2. | 73025 | 36.9% | 6.3%(+30.6)#2 | 11.4%(+25.5)#843 |
| 3. | 73736 | 35.5% | 6.3%(+29.2)#3 | 11.4%(+24.1)#945 |
| 4. | 73007 | 33.5% | 6.3%(+27.2)#4 | 11.4%(+22.1)#1,113 |
| 5. | 73557 | 29.3% | 6.3%(+23.0)#5 | 11.4%(+17.9)#1,548 |
| 6. | 73131 | 26.1% | 6.3%(+19.8)#6 | 11.4%(+14.7)#2,021 |
| 7. | 73727 | 25.5% | 6.3%(+19.2)#7 | 11.4%(+14.1)#2,109 |
| 8. | 73165 | 25.0% | 6.3%(+18.7)#8 | 11.4%(+13.6)#2,192 |
| 9. | 73627 | 24.9% | 6.3%(+18.6)#9 | 11.4%(+13.5)#2,217 |
| 10. | 74103 | 23.9% | 6.3%(+17.6)#10 | 11.4%(+12.5)#2,400 |
| 11. | 73034 | 22.9% | 6.3%(+16.6)#11 | 11.4%(+11.5)#2,567 |
| 12. | 74137 | 22.3% | 6.3%(+16.0)#12 | 11.4%(+10.9)#2,718 |
| 13. | 73116 | 21.4% | 6.3%(+15.1)#13 | 11.4%(+10.00)#2,909 |
| 14. | 73058 | 21.1% | 6.3%(+14.8)#14 | 11.4%(+9.70)#3,013 |
| 15. | 74114 | 20.5% | 6.3%(+14.2)#15 | 11.4%(+9.10)#3,159 |
| 16. | 73012 | 20.1% | 6.3%(+13.8)#16 | 11.4%(+8.70)#3,250 |
| 17. | 73562 | 19.0% | 6.3%(+12.7)#17 | 11.4%(+7.60)#3,577 |
| 18. | 73013 | 18.6% | 6.3%(+12.3)#18 | 11.4%(+7.20)#3,665 |
| 19. | 73549 | 18.3% | 6.3%(+12.0)#19 | 11.4%(+6.90)#3,765 |
| 20. | 74045 | 17.8% | 6.3%(+11.5)#20 | 11.4%(+6.40)#3,926 |
| 21. | 73173 | 17.7% | 6.3%(+11.4)#21 | 11.4%(+6.30)#3,943 |
| 22. | 74636 | 16.1% | 6.3%(+9.80)#22 | 11.4%(+4.70)#4,547 |
| 23. | 73659 | 16.0% | 6.3%(+9.70)#23 | 11.4%(+4.60)#4,594 |
| 24. | 74105 | 15.9% | 6.3%(+9.60)#24 | 11.4%(+4.50)#4,605 |
| 25. | 73142 | 15.0% | 6.3%(+8.70)#25 | 11.4%(+3.60)#4,985 |
| 26. | 73179 | 14.6% | 6.3%(+8.30)#26 | 11.4%(+3.20)#5,193 |
| 27. | 74037 | 14.2% | 6.3%(+7.90)#27 | 11.4%(+2.80)#5,357 |
| 28. | 73026 | 14.1% | 6.3%(+7.80)#28 | 11.4%(+2.70)#5,422 |
| 29. | 73758 | 14.1% | 6.3%(+7.80)#29 | 11.4%(+2.70)#5,452 |
| 30. | 73150 | 13.5% | 6.3%(+7.20)#30 | 11.4%(+2.10)#5,753 |
| 31. | 74132 | 13.4% | 6.3%(+7.10)#31 | 11.4%(+2.00)#5,804 |
| 32. | 74008 | 13.0% | 6.3%(+6.70)#32 | 11.4%(+1.60)#6,004 |
| 33. | 73835 | 12.8% | 6.3%(+6.50)#33 | 11.4%(+1.40)#6,186 |
| 34. | 73103 | 12.7% | 6.3%(+6.40)#34 | 11.4%(+1.30)#6,220 |
| 35. | 74533 | 12.7% | 6.3%(+6.40)#35 | 11.4%(+1.30)#6,232 |
| 36. | 73020 | 12.6% | 6.3%(+6.30)#36 | 11.4%(+1.20)#6,267 |
| 37. | 74722 | 12.5% | 6.3%(+6.20)#37 | 11.4%(+1.10)#6,390 |
| 38. | 73104 | 12.4% | 6.3%(+6.10)#38 | 11.4%(+1.000)#6,432 |
| 39. | 73841 | 12.2% | 6.3%(+5.90)#39 | 11.4%(+0.800)#6,565 |
| 40. | 74528 | 12.2% | 6.3%(+5.90)#40 | 11.4%(+0.800)#6,581 |
| 41. | 73762 | 11.9% | 6.3%(+5.60)#41 | 11.4%(+0.500)#6,761 |
| 42. | 74055 | 11.6% | 6.3%(+5.30)#42 | 11.4%(+0.200)#6,925 |
| 43. | 73646 | 11.6% | 6.3%(+5.30)#43 | 11.4%(+0.200)#6,995 |
| 44. | 74133 | 11.3% | 6.3%(+5.00)#44 | 11.4%(-0.100)#7,140 |
| 45. | 74073 | 11.2% | 6.3%(+4.90)#45 | 11.4%(-0.200)#7,252 |
| 46. | 74747 | 11.2% | 6.3%(+4.90)#46 | 11.4%(-0.200)#7,291 |
| 47. | 73021 | 11.1% | 6.3%(+4.80)#47 | 11.4%(-0.300)#7,373 |
| 48. | 73128 | 11.0% | 6.3%(+4.70)#48 | 11.4%(-0.400)#7,431 |
| 49. | 74457 | 11.0% | 6.3%(+4.70)#49 | 11.4%(-0.400)#7,470 |
| 50. | 74006 | 10.9% | 6.3%(+4.60)#50 | 11.4%(-0.500)#7,483 |
| 51. | 73072 | 10.7% | 6.3%(+4.40)#51 | 11.4%(-0.700)#7,602 |
| 52. | 73170 | 10.7% | 6.3%(+4.40)#52 | 11.4%(-0.700)#7,610 |
| 53. | 74011 | 10.6% | 6.3%(+4.30)#53 | 11.4%(-0.800)#7,696 |
| 54. | 73118 | 10.5% | 6.3%(+4.20)#54 | 11.4%(-0.900)#7,794 |
| 55. | 74761 | 10.5% | 6.3%(+4.20)#55 | 11.4%(-0.900)#7,854 |
| 56. | 73089 | 10.4% | 6.3%(+4.10)#56 | 11.4%(-1.000)#7,884 |
| 57. | 73724 | 10.4% | 6.3%(+4.10)#57 | 11.4%(-1.000)#7,922 |
| 58. | 74120 | 10.2% | 6.3%(+3.90)#58 | 11.4%(-1.20)#8,085 |
| 59. | 73654 | 10.2% | 6.3%(+3.90)#59 | 11.4%(-1.20)#8,112 |
| 60. | 73078 | 10.1% | 6.3%(+3.80)#60 | 11.4%(-1.30)#8,162 |
| 61. | 73049 | 10.1% | 6.3%(+3.80)#61 | 11.4%(-1.30)#8,171 |
| 62. | 74604 | 10.0% | 6.3%(+3.70)#62 | 11.4%(-1.40)#8,268 |
| 63. | 73093 | 10.0% | 6.3%(+3.70)#63 | 11.4%(-1.40)#8,288 |
| 64. | 73016 | 10.0% | 6.3%(+3.70)#64 | 11.4%(-1.40)#8,293 |
| 65. | 73433 | 9.9% | 6.3%(+3.60)#65 | 11.4%(-1.50)#8,392 |
| 66. | 73628 | 9.8% | 6.3%(+3.50)#66 | 11.4%(-1.60)#8,507 |
| 67. | 73718 | 9.8% | 6.3%(+3.50)#67 | 11.4%(-1.60)#8,523 |
| 68. | 74021 | 9.7% | 6.3%(+3.40)#68 | 11.4%(-1.70)#8,557 |
| 69. | 73650 | 9.6% | 6.3%(+3.30)#69 | 11.4%(-1.80)#8,686 |
| 70. | 73544 | 9.6% | 6.3%(+3.30)#70 | 11.4%(-1.80)#8,700 |
| 71. | 74051 | 9.4% | 6.3%(+3.10)#71 | 11.4%(-2.00)#8,893 |
| 72. | 73033 | 9.4% | 6.3%(+3.10)#72 | 11.4%(-2.00)#8,912 |
| 73. | 73014 | 9.3% | 6.3%(+3.00)#73 | 11.4%(-2.10)#8,990 |
| 74. | 73120 | 9.2% | 6.3%(+2.90)#74 | 11.4%(-2.20)#9,035 |
| 75. | 73010 | 9.2% | 6.3%(+2.90)#75 | 11.4%(-2.20)#9,046 |
| 76. | 73742 | 9.2% | 6.3%(+2.90)#76 | 11.4%(-2.20)#9,079 |
| 77. | 73768 | 9.1% | 6.3%(+2.80)#77 | 11.4%(-2.30)#9,175 |
| 78. | 73453 | 9.0% | 6.3%(+2.70)#78 | 11.4%(-2.40)#9,298 |
| 79. | 74875 | 8.9% | 6.3%(+2.60)#79 | 11.4%(-2.50)#9,385 |
| 80. | 73661 | 8.9% | 6.3%(+2.60)#80 | 11.4%(-2.50)#9,388 |
| 81. | 74061 | 8.8% | 6.3%(+2.50)#81 | 11.4%(-2.60)#9,471 |
| 82. | 73550 | 8.8% | 6.3%(+2.50)#82 | 11.4%(-2.60)#9,476 |
| 83. | 74014 | 8.7% | 6.3%(+2.40)#83 | 11.4%(-2.70)#9,517 |
| 84. | 73064 | 8.6% | 6.3%(+2.30)#84 | 11.4%(-2.80)#9,642 |
| 85. | 74019 | 8.6% | 6.3%(+2.30)#85 | 11.4%(-2.80)#9,646 |
| 86. | 74650 | 8.6% | 6.3%(+2.30)#86 | 11.4%(-2.80)#9,724 |
| 87. | 74012 | 8.4% | 6.3%(+2.10)#87 | 11.4%(-3.00)#9,851 |
| 88. | 73458 | 8.4% | 6.3%(+2.10)#88 | 11.4%(-3.00)#9,951 |
| 89. | 73162 | 8.3% | 6.3%(+2.00)#89 | 11.4%(-3.10)#10,001 |
| 90. | 74134 | 8.2% | 6.3%(+1.90)#90 | 11.4%(-3.20)#10,118 |
| 91. | 73931 | 8.2% | 6.3%(+1.90)#91 | 11.4%(-3.20)#10,191 |
| 92. | 73531 | 8.1% | 6.3%(+1.80)#92 | 11.4%(-3.30)#10,331 |
| 93. | 74943 | 8.1% | 6.3%(+1.80)#93 | 11.4%(-3.30)#10,339 |
| 94. | 74135 | 8.0% | 6.3%(+1.70)#94 | 11.4%(-3.40)#10,372 |
| 95. | 73726 | 8.0% | 6.3%(+1.70)#95 | 11.4%(-3.40)#10,456 |
| 96. | 74033 | 7.9% | 6.3%(+1.60)#96 | 11.4%(-3.50)#10,514 |
| 97. | 73852 | 7.9% | 6.3%(+1.60)#97 | 11.4%(-3.50)#10,561 |
| 98. | 74047 | 7.7% | 6.3%(+1.40)#98 | 11.4%(-3.70)#10,799 |
| 99. | 73063 | 7.7% | 6.3%(+1.40)#99 | 11.4%(-3.70)#10,859 |
| 100. | 73045 | 7.6% | 6.3%(+1.30)#100 | 11.4%(-3.80)#10,936 |
Common Questions
What are the Top 10 Zip Codes with the Highest Percentage of Households with Income Above $200,000 in Oklahoma?
Top 10 Zip Codes with the Highest Percentage of Households with Income Above $200,000 in Oklahoma are:
What zip code has the Highest Percentage of Households with Income Above $200,000 in Oklahoma?
73151 has the Highest Percentage of Households with Income Above $200,000 in Oklahoma with 42.5%.
What is the Percentage of Households with Income Above $200,000 in the State of Oklahoma?
Percentage of Households with Income Above $200,000 in Oklahoma is 6.3%.
What is the Percentage of Households with Income Above $200,000 in the United States?
Percentage of Households with Income Above $200,000 in the United States is 11.4%.