Zip Codes with the Highest Percentage of Households with Income Above $200,000 in Iowa
RELATED REPORTS & OPTIONS
Household Income | $200k+
Iowa
Compare Zip Codes
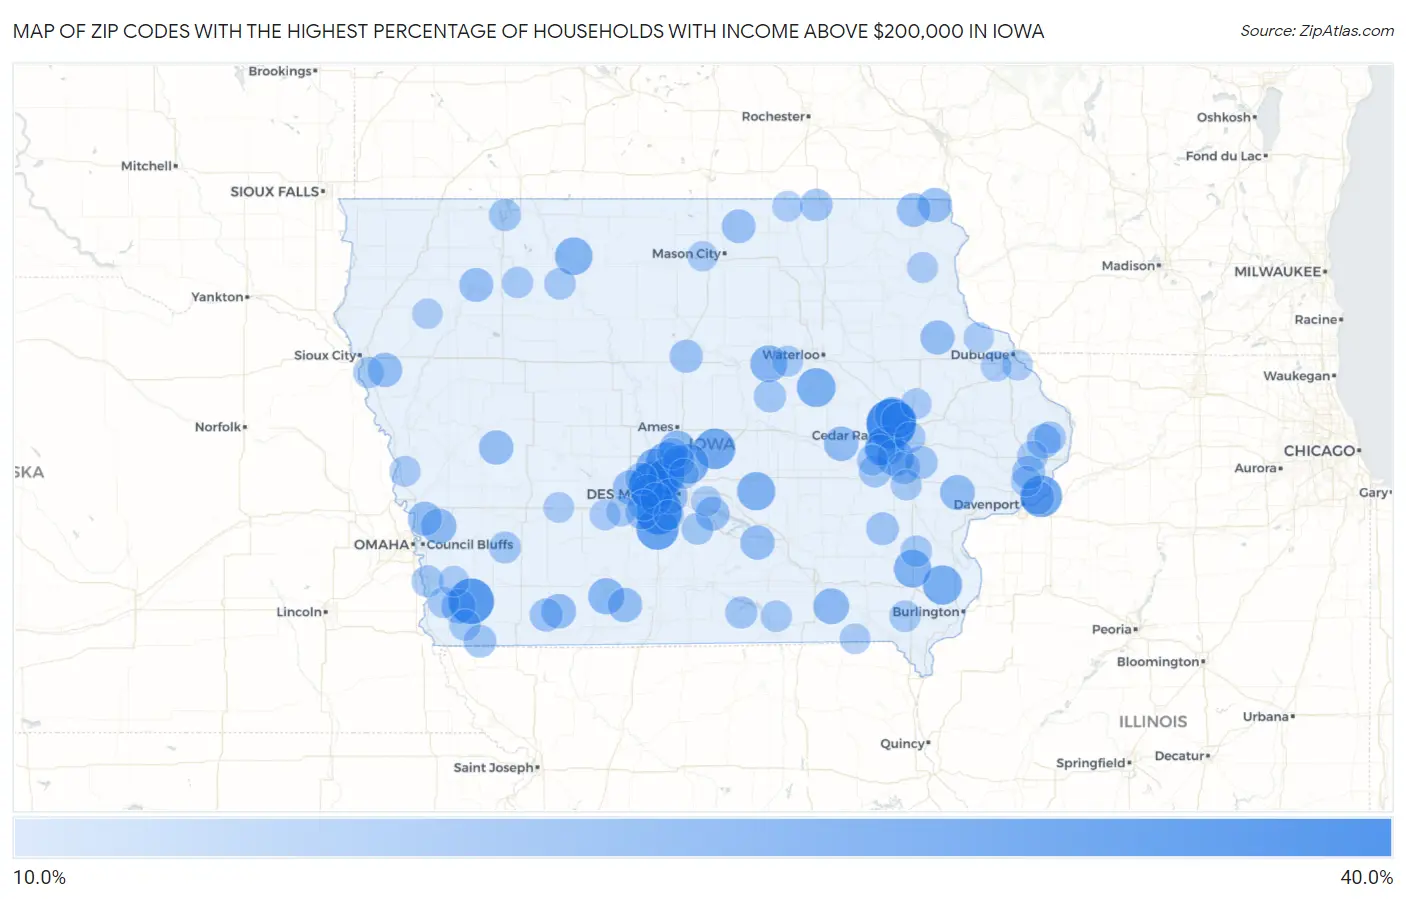
Map of Zip Codes with the Highest Percentage of Households with Income Above $200,000 in Iowa
10.0%
40.0%
Zip Codes with the Highest Percentage of Households with Income Above $200,000 in Iowa
| Zip Code | Households with Income > $200k | vs State | vs National | |
| 1. | 50323 | 39.1% | 7.1%(+32.0)#1 | 11.4%(+27.7)#699 |
| 2. | 52411 | 39.0% | 7.1%(+31.9)#2 | 11.4%(+27.6)#709 |
| 3. | 50061 | 34.5% | 7.1%(+27.4)#3 | 11.4%(+23.1)#1,017 |
| 4. | 51645 | 33.3% | 7.1%(+26.2)#4 | 11.4%(+21.9)#1,134 |
| 5. | 50033 | 28.6% | 7.1%(+21.5)#5 | 11.4%(+17.2)#1,642 |
| 6. | 52767 | 27.8% | 7.1%(+20.7)#6 | 11.4%(+16.4)#1,766 |
| 7. | 50055 | 26.4% | 7.1%(+19.3)#7 | 11.4%(+15.0)#1,971 |
| 8. | 50226 | 26.2% | 7.1%(+19.1)#8 | 11.4%(+14.8)#2,006 |
| 9. | 50073 | 25.0% | 7.1%(+17.9)#9 | 11.4%(+13.6)#2,196 |
| 10. | 52228 | 24.4% | 7.1%(+17.3)#10 | 11.4%(+13.0)#2,303 |
| 11. | 52660 | 24.4% | 7.1%(+17.3)#11 | 11.4%(+13.0)#2,307 |
| 12. | 50612 | 23.7% | 7.1%(+16.6)#12 | 11.4%(+12.3)#2,439 |
| 13. | 50325 | 22.9% | 7.1%(+15.8)#13 | 11.4%(+11.5)#2,576 |
| 14. | 50137 | 22.9% | 7.1%(+15.8)#14 | 11.4%(+11.5)#2,591 |
| 15. | 50109 | 22.6% | 7.1%(+15.5)#15 | 11.4%(+11.2)#2,666 |
| 16. | 52652 | 22.2% | 7.1%(+15.1)#16 | 11.4%(+10.8)#2,745 |
| 17. | 50528 | 22.0% | 7.1%(+14.9)#17 | 11.4%(+10.6)#2,790 |
| 18. | 50131 | 21.2% | 7.1%(+14.1)#18 | 11.4%(+9.80)#2,963 |
| 19. | 52338 | 21.2% | 7.1%(+14.1)#19 | 11.4%(+9.80)#2,977 |
| 20. | 50642 | 21.1% | 7.1%(+14.0)#20 | 11.4%(+9.70)#3,012 |
| 21. | 50124 | 20.2% | 7.1%(+13.1)#21 | 11.4%(+8.80)#3,240 |
| 22. | 50861 | 20.0% | 7.1%(+12.9)#22 | 11.4%(+8.60)#3,295 |
| 23. | 52341 | 19.7% | 7.1%(+12.6)#23 | 11.4%(+8.30)#3,380 |
| 24. | 52560 | 19.6% | 7.1%(+12.5)#24 | 11.4%(+8.20)#3,417 |
| 25. | 51576 | 18.9% | 7.1%(+11.8)#25 | 11.4%(+7.50)#3,599 |
| 26. | 50312 | 18.7% | 7.1%(+11.6)#26 | 11.4%(+7.30)#3,651 |
| 27. | 52328 | 18.6% | 7.1%(+11.5)#27 | 11.4%(+7.20)#3,687 |
| 28. | 52720 | 18.4% | 7.1%(+11.3)#28 | 11.4%(+7.00)#3,736 |
| 29. | 50862 | 17.8% | 7.1%(+10.7)#29 | 11.4%(+6.40)#3,929 |
| 30. | 52257 | 17.7% | 7.1%(+10.6)#30 | 11.4%(+6.30)#3,951 |
| 31. | 50003 | 17.6% | 7.1%(+10.5)#31 | 11.4%(+6.20)#3,976 |
| 32. | 51454 | 17.6% | 7.1%(+10.5)#32 | 11.4%(+6.20)#3,990 |
| 33. | 50256 | 17.6% | 7.1%(+10.5)#33 | 11.4%(+6.20)#3,993 |
| 34. | 51649 | 17.6% | 7.1%(+10.5)#34 | 11.4%(+6.20)#3,994 |
| 35. | 51007 | 17.5% | 7.1%(+10.4)#35 | 11.4%(+6.10)#4,032 |
| 36. | 50074 | 17.5% | 7.1%(+10.4)#36 | 11.4%(+6.10)#4,035 |
| 37. | 52160 | 17.4% | 7.1%(+10.3)#37 | 11.4%(+6.00)#4,052 |
| 38. | 52750 | 17.4% | 7.1%(+10.3)#38 | 11.4%(+6.00)#4,055 |
| 39. | 52050 | 17.3% | 7.1%(+10.2)#39 | 11.4%(+5.90)#4,090 |
| 40. | 51542 | 17.2% | 7.1%(+10.1)#40 | 11.4%(+5.80)#4,132 |
| 41. | 52722 | 17.1% | 7.1%(+10.0)#41 | 11.4%(+5.70)#4,140 |
| 42. | 50261 | 17.1% | 7.1%(+10.0)#42 | 11.4%(+5.70)#4,163 |
| 43. | 51047 | 17.0% | 7.1%(+9.90)#43 | 11.4%(+5.60)#4,205 |
| 44. | 50252 | 16.8% | 7.1%(+9.70)#44 | 11.4%(+5.40)#4,279 |
| 45. | 52140 | 16.7% | 7.1%(+9.60)#45 | 11.4%(+5.30)#4,311 |
| 46. | 50440 | 16.6% | 7.1%(+9.50)#46 | 11.4%(+5.20)#4,355 |
| 47. | 52756 | 16.1% | 7.1%(+9.00)#47 | 11.4%(+4.70)#4,538 |
| 48. | 50271 | 16.0% | 7.1%(+8.90)#48 | 11.4%(+4.60)#4,588 |
| 49. | 50263 | 15.8% | 7.1%(+8.70)#49 | 11.4%(+4.40)#4,646 |
| 50. | 50848 | 15.8% | 7.1%(+8.70)#50 | 11.4%(+4.40)#4,673 |
| 51. | 52333 | 15.5% | 7.1%(+8.40)#51 | 11.4%(+4.10)#4,773 |
| 52. | 52359 | 15.4% | 7.1%(+8.30)#52 | 11.4%(+4.00)#4,829 |
| 53. | 52317 | 15.3% | 7.1%(+8.20)#53 | 11.4%(+3.90)#4,852 |
| 54. | 51647 | 15.2% | 7.1%(+8.10)#54 | 11.4%(+3.80)#4,923 |
| 55. | 52134 | 15.0% | 7.1%(+7.90)#55 | 11.4%(+3.60)#5,015 |
| 56. | 50063 | 14.9% | 7.1%(+7.80)#56 | 11.4%(+3.50)#5,051 |
| 57. | 50609 | 14.9% | 7.1%(+7.80)#57 | 11.4%(+3.50)#5,062 |
| 58. | 50266 | 14.7% | 7.1%(+7.60)#58 | 11.4%(+3.30)#5,118 |
| 59. | 52236 | 14.7% | 7.1%(+7.60)#59 | 11.4%(+3.30)#5,163 |
| 60. | 50007 | 14.5% | 7.1%(+7.40)#60 | 11.4%(+3.10)#5,240 |
| 61. | 52581 | 14.5% | 7.1%(+7.40)#61 | 11.4%(+3.10)#5,243 |
| 62. | 51355 | 14.3% | 7.1%(+7.20)#62 | 11.4%(+2.90)#5,332 |
| 63. | 50001 | 14.2% | 7.1%(+7.10)#63 | 11.4%(+2.80)#5,392 |
| 64. | 51561 | 14.1% | 7.1%(+7.00)#64 | 11.4%(+2.70)#5,446 |
| 65. | 52727 | 14.1% | 7.1%(+7.00)#65 | 11.4%(+2.70)#5,449 |
| 66. | 51535 | 14.0% | 7.1%(+6.90)#66 | 11.4%(+2.60)#5,490 |
| 67. | 50244 | 13.8% | 7.1%(+6.70)#67 | 11.4%(+2.40)#5,593 |
| 68. | 50562 | 13.8% | 7.1%(+6.70)#68 | 11.4%(+2.40)#5,602 |
| 69. | 52621 | 13.7% | 7.1%(+6.60)#69 | 11.4%(+2.30)#5,658 |
| 70. | 51639 | 13.6% | 7.1%(+6.50)#70 | 11.4%(+2.20)#5,714 |
| 71. | 50038 | 13.6% | 7.1%(+6.50)#71 | 11.4%(+2.20)#5,719 |
| 72. | 52631 | 13.6% | 7.1%(+6.50)#72 | 11.4%(+2.20)#5,721 |
| 73. | 52593 | 13.4% | 7.1%(+6.30)#73 | 11.4%(+2.00)#5,836 |
| 74. | 51054 | 13.3% | 7.1%(+6.20)#74 | 11.4%(+1.90)#5,860 |
| 75. | 51366 | 13.3% | 7.1%(+6.20)#75 | 11.4%(+1.90)#5,883 |
| 76. | 52351 | 13.2% | 7.1%(+6.10)#76 | 11.4%(+1.80)#5,930 |
| 77. | 52403 | 13.0% | 7.1%(+5.90)#77 | 11.4%(+1.60)#6,011 |
| 78. | 52246 | 13.0% | 7.1%(+5.90)#78 | 11.4%(+1.60)#6,013 |
| 79. | 52203 | 13.0% | 7.1%(+5.90)#79 | 11.4%(+1.60)#6,036 |
| 80. | 50624 | 13.0% | 7.1%(+5.90)#80 | 11.4%(+1.60)#6,044 |
| 81. | 51653 | 13.0% | 7.1%(+5.90)#81 | 11.4%(+1.60)#6,046 |
| 82. | 52003 | 12.8% | 7.1%(+5.70)#82 | 11.4%(+1.40)#6,138 |
| 83. | 52742 | 12.8% | 7.1%(+5.70)#83 | 11.4%(+1.40)#6,147 |
| 84. | 51557 | 12.8% | 7.1%(+5.70)#84 | 11.4%(+1.40)#6,176 |
| 85. | 52156 | 12.8% | 7.1%(+5.70)#85 | 11.4%(+1.40)#6,179 |
| 86. | 52068 | 12.6% | 7.1%(+5.50)#86 | 11.4%(+1.20)#6,293 |
| 87. | 51551 | 12.6% | 7.1%(+5.50)#87 | 11.4%(+1.20)#6,301 |
| 88. | 50070 | 12.6% | 7.1%(+5.50)#88 | 11.4%(+1.20)#6,306 |
| 89. | 52748 | 12.5% | 7.1%(+5.40)#89 | 11.4%(+1.10)#6,352 |
| 90. | 52214 | 12.5% | 7.1%(+5.40)#90 | 11.4%(+1.10)#6,371 |
| 91. | 50002 | 12.5% | 7.1%(+5.40)#91 | 11.4%(+1.10)#6,376 |
| 92. | 50072 | 12.3% | 7.1%(+5.20)#92 | 11.4%(+0.900)#6,501 |
| 93. | 52542 | 12.3% | 7.1%(+5.20)#93 | 11.4%(+0.900)#6,517 |
| 94. | 50455 | 12.2% | 7.1%(+5.10)#94 | 11.4%(+0.800)#6,580 |
| 95. | 50021 | 12.1% | 7.1%(+5.00)#95 | 11.4%(+0.700)#6,600 |
| 96. | 50237 | 12.1% | 7.1%(+5.00)#96 | 11.4%(+0.700)#6,624 |
| 97. | 51035 | 12.1% | 7.1%(+5.00)#97 | 11.4%(+0.700)#6,631 |
| 98. | 52053 | 12.1% | 7.1%(+5.00)#98 | 11.4%(+0.700)#6,635 |
| 99. | 50211 | 12.0% | 7.1%(+4.90)#99 | 11.4%(+0.600)#6,676 |
| 100. | 50428 | 12.0% | 7.1%(+4.90)#100 | 11.4%(+0.600)#6,683 |
Common Questions
What are the Top 10 Zip Codes with the Highest Percentage of Households with Income Above $200,000 in Iowa?
Top 10 Zip Codes with the Highest Percentage of Households with Income Above $200,000 in Iowa are:
What zip code has the Highest Percentage of Households with Income Above $200,000 in Iowa?
50323 has the Highest Percentage of Households with Income Above $200,000 in Iowa with 39.1%.
What is the Percentage of Households with Income Above $200,000 in the State of Iowa?
Percentage of Households with Income Above $200,000 in Iowa is 7.1%.
What is the Percentage of Households with Income Above $200,000 in the United States?
Percentage of Households with Income Above $200,000 in the United States is 11.4%.