Zip Codes with the Highest Percentage of Households with Income Above $200,000 in Idaho
RELATED REPORTS & OPTIONS
Household Income | $200k+
Idaho
Compare Zip Codes
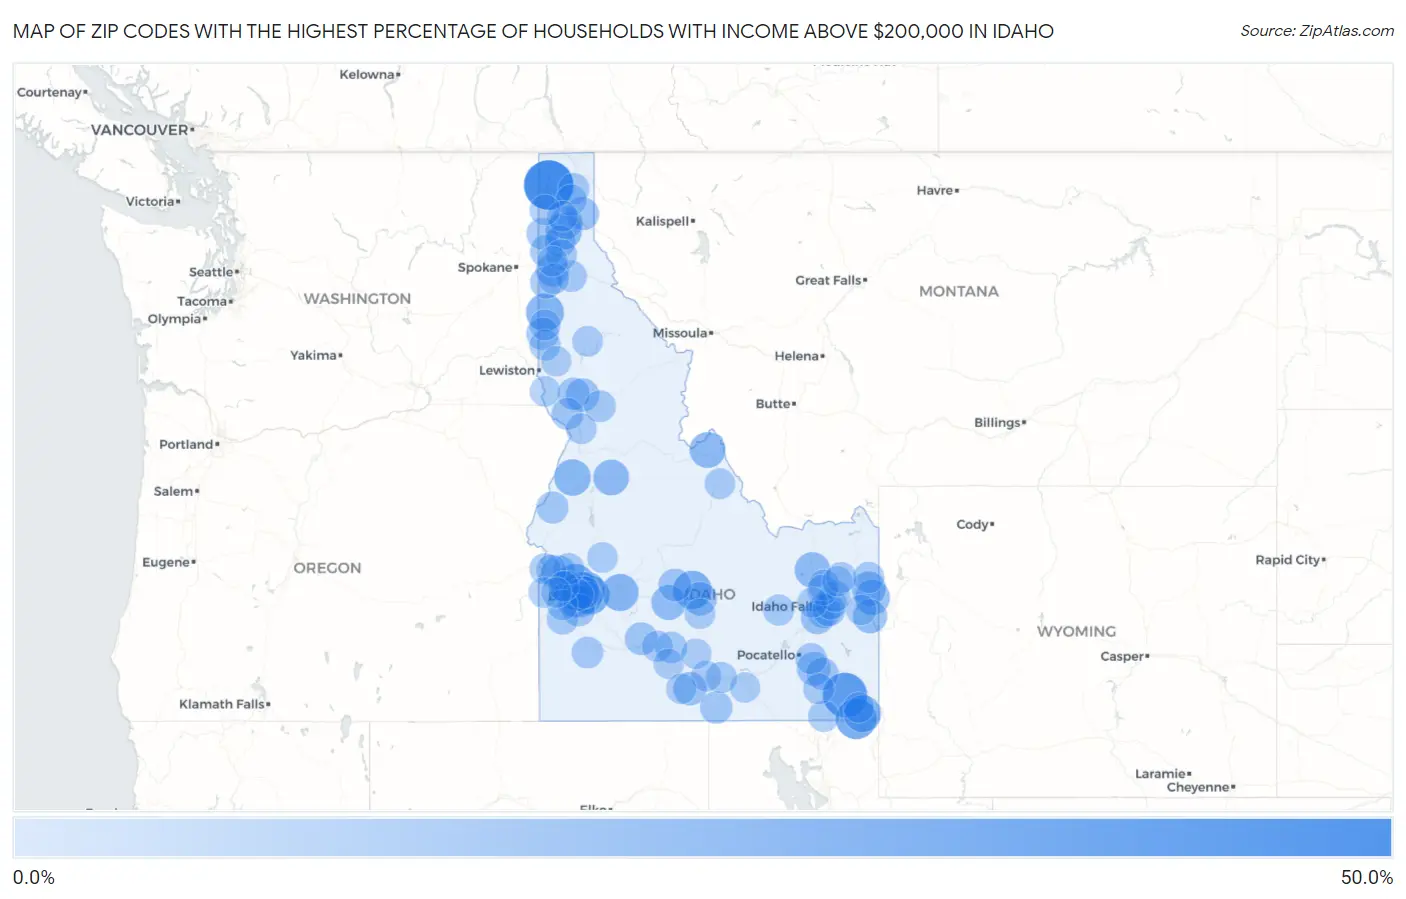
Map of Zip Codes with the Highest Percentage of Households with Income Above $200,000 in Idaho
0.0%
50.0%
Zip Codes with the Highest Percentage of Households with Income Above $200,000 in Idaho
| Zip Code | Households with Income > $200k | vs State | vs National | |
| 1. | 83821 | 46.3% | 7.3%(+39.0)#1 | 11.4%(+34.9)#379 |
| 2. | 83283 | 34.9% | 7.3%(+27.6)#2 | 11.4%(+23.5)#991 |
| 3. | 83287 | 27.0% | 7.3%(+19.7)#3 | 11.4%(+15.6)#1,890 |
| 4. | 83616 | 24.8% | 7.3%(+17.5)#4 | 11.4%(+13.4)#2,222 |
| 5. | 83712 | 23.3% | 7.3%(+16.0)#5 | 11.4%(+11.9)#2,500 |
| 6. | 83353 | 22.0% | 7.3%(+14.7)#6 | 11.4%(+10.6)#2,788 |
| 7. | 83824 | 20.8% | 7.3%(+13.5)#7 | 11.4%(+9.40)#3,095 |
| 8. | 83272 | 19.2% | 7.3%(+11.9)#8 | 11.4%(+7.80)#3,526 |
| 9. | 83716 | 19.1% | 7.3%(+11.8)#9 | 11.4%(+7.70)#3,539 |
| 10. | 83654 | 17.8% | 7.3%(+10.5)#10 | 11.4%(+6.40)#3,923 |
| 11. | 83809 | 17.3% | 7.3%(+10.0)#11 | 11.4%(+5.90)#4,089 |
| 12. | 83702 | 16.6% | 7.3%(+9.30)#12 | 11.4%(+5.20)#4,334 |
| 13. | 83466 | 16.4% | 7.3%(+9.10)#13 | 11.4%(+5.00)#4,440 |
| 14. | 83638 | 16.1% | 7.3%(+8.80)#14 | 11.4%(+4.70)#4,529 |
| 15. | 83425 | 15.7% | 7.3%(+8.40)#15 | 11.4%(+4.30)#4,706 |
| 16. | 83455 | 14.7% | 7.3%(+7.40)#16 | 11.4%(+3.30)#5,142 |
| 17. | 83327 | 14.5% | 7.3%(+7.20)#17 | 11.4%(+3.10)#5,239 |
| 18. | 83422 | 13.6% | 7.3%(+6.30)#18 | 11.4%(+2.20)#5,700 |
| 19. | 83714 | 13.5% | 7.3%(+6.20)#19 | 11.4%(+2.10)#5,736 |
| 20. | 83428 | 13.2% | 7.3%(+5.90)#20 | 11.4%(+1.80)#5,936 |
| 21. | 83646 | 13.1% | 7.3%(+5.80)#21 | 11.4%(+1.70)#5,942 |
| 22. | 83642 | 13.1% | 7.3%(+5.80)#22 | 11.4%(+1.70)#5,944 |
| 23. | 83636 | 12.1% | 7.3%(+4.80)#23 | 11.4%(+0.700)#6,644 |
| 24. | 83333 | 11.9% | 7.3%(+4.60)#24 | 11.4%(+0.500)#6,740 |
| 25. | 83669 | 11.8% | 7.3%(+4.50)#25 | 11.4%(+0.400)#6,810 |
| 26. | 83250 | 11.7% | 7.3%(+4.40)#26 | 11.4%(+0.300)#6,891 |
| 27. | 83404 | 11.6% | 7.3%(+4.30)#27 | 11.4%(+0.200)#6,937 |
| 28. | 83341 | 11.6% | 7.3%(+4.30)#28 | 11.4%(+0.200)#6,951 |
| 29. | 83274 | 11.3% | 7.3%(+4.00)#29 | 11.4%(-0.100)#7,169 |
| 30. | 83533 | 11.0% | 7.3%(+3.70)#30 | 11.4%(-0.400)#7,469 |
| 31. | 83836 | 10.8% | 7.3%(+3.50)#31 | 11.4%(-0.600)#7,583 |
| 32. | 83814 | 10.7% | 7.3%(+3.40)#32 | 11.4%(-0.700)#7,619 |
| 33. | 83860 | 10.3% | 7.3%(+3.00)#33 | 11.4%(-1.10)#7,981 |
| 34. | 83633 | 10.0% | 7.3%(+2.70)#34 | 11.4%(-1.40)#8,322 |
| 35. | 83340 | 9.9% | 7.3%(+2.60)#35 | 11.4%(-1.50)#8,380 |
| 36. | 83709 | 9.8% | 7.3%(+2.50)#36 | 11.4%(-1.60)#8,431 |
| 37. | 83706 | 9.6% | 7.3%(+2.30)#37 | 11.4%(-1.80)#8,629 |
| 38. | 83406 | 9.6% | 7.3%(+2.30)#38 | 11.4%(-1.80)#8,641 |
| 39. | 83634 | 9.4% | 7.3%(+2.10)#39 | 11.4%(-2.00)#8,842 |
| 40. | 83703 | 9.3% | 7.3%(+2.00)#40 | 11.4%(-2.10)#8,945 |
| 41. | 83346 | 9.2% | 7.3%(+1.90)#41 | 11.4%(-2.20)#9,093 |
| 42. | 83872 | 9.2% | 7.3%(+1.90)#42 | 11.4%(-2.20)#9,100 |
| 43. | 83246 | 9.1% | 7.3%(+1.80)#43 | 11.4%(-2.30)#9,181 |
| 44. | 83858 | 9.0% | 7.3%(+1.70)#44 | 11.4%(-2.40)#9,227 |
| 45. | 83526 | 8.9% | 7.3%(+1.60)#45 | 11.4%(-2.50)#9,402 |
| 46. | 83713 | 8.7% | 7.3%(+1.40)#46 | 11.4%(-2.70)#9,527 |
| 47. | 83876 | 8.7% | 7.3%(+1.40)#47 | 11.4%(-2.70)#9,592 |
| 48. | 83610 | 8.4% | 7.3%(+1.10)#48 | 11.4%(-3.00)#9,947 |
| 49. | 83804 | 8.3% | 7.3%(+1.00)#49 | 11.4%(-3.10)#10,067 |
| 50. | 83522 | 8.0% | 7.3%(+0.700)#50 | 11.4%(-3.40)#10,428 |
| 51. | 83330 | 7.8% | 7.3%(+0.500)#51 | 11.4%(-3.60)#10,661 |
| 52. | 83401 | 7.7% | 7.3%(+0.400)#52 | 11.4%(-3.70)#10,744 |
| 53. | 83552 | 7.6% | 7.3%(+0.300)#53 | 11.4%(-3.80)#11,006 |
| 54. | 83624 | 7.5% | 7.3%(+0.200)#54 | 11.4%(-3.90)#11,118 |
| 55. | 83641 | 7.3% | 7.3%(=0.000)#55 | 11.4%(-4.10)#11,395 |
| 56. | 83801 | 7.2% | 7.3%(-0.100)#56 | 11.4%(-4.20)#11,534 |
| 57. | 83245 | 7.1% | 7.3%(-0.200)#57 | 11.4%(-4.30)#11,689 |
| 58. | 83810 | 7.0% | 7.3%(-0.300)#58 | 11.4%(-4.40)#11,846 |
| 59. | 83847 | 7.0% | 7.3%(-0.300)#59 | 11.4%(-4.40)#11,849 |
| 60. | 83617 | 6.9% | 7.3%(-0.400)#60 | 11.4%(-4.50)#11,929 |
| 61. | 83835 | 6.8% | 7.3%(-0.500)#61 | 11.4%(-4.60)#12,081 |
| 62. | 83286 | 6.7% | 7.3%(-0.600)#62 | 11.4%(-4.70)#12,321 |
| 63. | 83442 | 6.6% | 7.3%(-0.700)#63 | 11.4%(-4.80)#12,414 |
| 64. | 83864 | 6.6% | 7.3%(-0.700)#64 | 11.4%(-4.80)#12,422 |
| 65. | 83452 | 6.6% | 7.3%(-0.700)#65 | 11.4%(-4.80)#12,489 |
| 66. | 83336 | 6.5% | 7.3%(-0.800)#66 | 11.4%(-4.90)#12,605 |
| 67. | 83314 | 6.5% | 7.3%(-0.800)#67 | 11.4%(-4.90)#12,676 |
| 68. | 83843 | 6.4% | 7.3%(-0.900)#68 | 11.4%(-5.00)#12,736 |
| 69. | 83619 | 6.4% | 7.3%(-0.900)#69 | 11.4%(-5.00)#12,773 |
| 70. | 83855 | 6.3% | 7.3%(-1.000)#70 | 11.4%(-5.10)#13,005 |
| 71. | 83234 | 6.3% | 7.3%(-1.000)#71 | 11.4%(-5.10)#13,012 |
| 72. | 83215 | 6.3% | 7.3%(-1.000)#72 | 11.4%(-5.10)#13,062 |
| 73. | 83825 | 6.0% | 7.3%(-1.30)#73 | 11.4%(-5.40)#13,610 |
| 74. | 83856 | 5.7% | 7.3%(-1.60)#74 | 11.4%(-5.70)#14,135 |
| 75. | 83434 | 5.7% | 7.3%(-1.60)#75 | 11.4%(-5.70)#14,190 |
| 76. | 83431 | 5.7% | 7.3%(-1.60)#76 | 11.4%(-5.70)#14,222 |
| 77. | 83554 | 5.7% | 7.3%(-1.60)#77 | 11.4%(-5.70)#14,240 |
| 78. | 83335 | 5.6% | 7.3%(-1.70)#78 | 11.4%(-5.80)#14,372 |
| 79. | 83833 | 5.6% | 7.3%(-1.70)#79 | 11.4%(-5.80)#14,395 |
| 80. | 83827 | 5.6% | 7.3%(-1.70)#80 | 11.4%(-5.80)#14,462 |
| 81. | 83467 | 5.5% | 7.3%(-1.80)#81 | 11.4%(-5.90)#14,544 |
| 82. | 83686 | 5.4% | 7.3%(-1.90)#82 | 11.4%(-6.00)#14,651 |
| 83. | 83448 | 5.4% | 7.3%(-1.90)#83 | 11.4%(-6.00)#14,768 |
| 84. | 83655 | 5.3% | 7.3%(-2.00)#84 | 11.4%(-6.10)#14,959 |
| 85. | 83313 | 5.3% | 7.3%(-2.00)#85 | 11.4%(-6.10)#14,968 |
| 86. | 83223 | 5.3% | 7.3%(-2.00)#86 | 11.4%(-6.10)#15,047 |
| 87. | 83501 | 5.2% | 7.3%(-2.10)#87 | 11.4%(-6.20)#15,080 |
| 88. | 83676 | 5.2% | 7.3%(-2.10)#88 | 11.4%(-6.20)#15,168 |
| 89. | 83449 | 5.2% | 7.3%(-2.10)#89 | 11.4%(-6.20)#15,281 |
| 90. | 83815 | 5.1% | 7.3%(-2.20)#90 | 11.4%(-6.30)#15,301 |
| 91. | 83644 | 5.1% | 7.3%(-2.20)#91 | 11.4%(-6.30)#15,348 |
| 92. | 83622 | 5.1% | 7.3%(-2.20)#92 | 11.4%(-6.30)#15,442 |
| 93. | 83440 | 5.0% | 7.3%(-2.30)#93 | 11.4%(-6.40)#15,558 |
| 94. | 83607 | 5.0% | 7.3%(-2.30)#94 | 11.4%(-6.40)#15,573 |
| 95. | 83402 | 5.0% | 7.3%(-2.30)#95 | 11.4%(-6.40)#15,581 |
| 96. | 83355 | 5.0% | 7.3%(-2.30)#96 | 11.4%(-6.40)#15,664 |
| 97. | 83324 | 5.0% | 7.3%(-2.30)#97 | 11.4%(-6.40)#15,765 |
| 98. | 83301 | 4.9% | 7.3%(-2.40)#98 | 11.4%(-6.50)#15,797 |
| 99. | 83323 | 4.9% | 7.3%(-2.40)#99 | 11.4%(-6.50)#15,961 |
| 100. | 83535 | 4.9% | 7.3%(-2.40)#100 | 11.4%(-6.50)#15,979 |
Common Questions
What are the Top 10 Zip Codes with the Highest Percentage of Households with Income Above $200,000 in Idaho?
Top 10 Zip Codes with the Highest Percentage of Households with Income Above $200,000 in Idaho are:
What zip code has the Highest Percentage of Households with Income Above $200,000 in Idaho?
83821 has the Highest Percentage of Households with Income Above $200,000 in Idaho with 46.3%.
What is the Percentage of Households with Income Above $200,000 in the State of Idaho?
Percentage of Households with Income Above $200,000 in Idaho is 7.3%.
What is the Percentage of Households with Income Above $200,000 in the United States?
Percentage of Households with Income Above $200,000 in the United States is 11.4%.