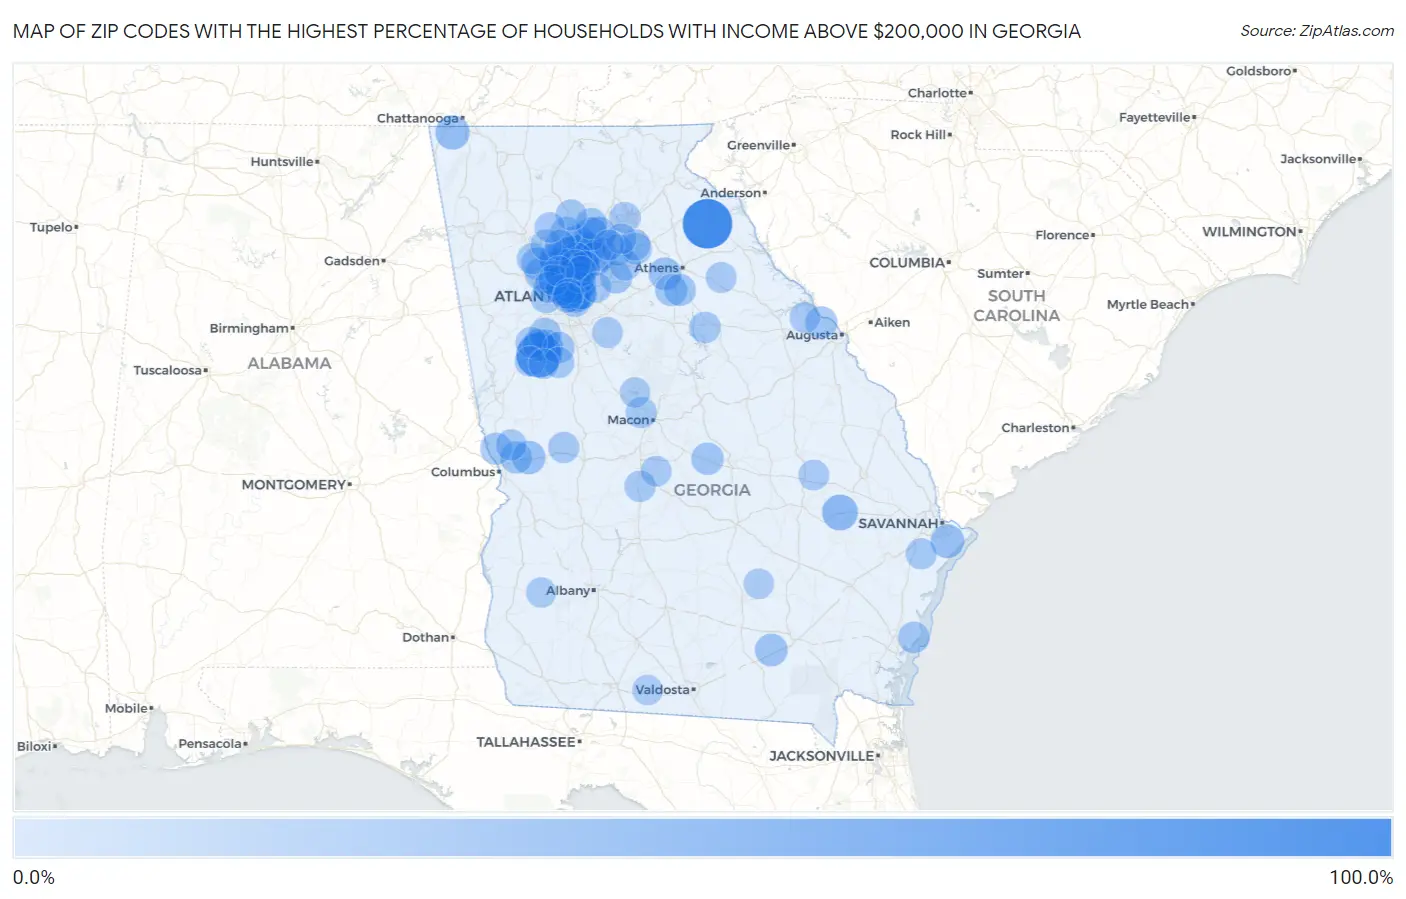
Zip Codes with the Highest Percentage of Households with Income Above $200,000 in Georgia
RELATED REPORTS & OPTIONS
Household Income | $200k+
Georgia
Compare Zip Codes
Map of Zip Codes with the Highest Percentage of Households with Income Above $200,000 in Georgia
0.0%
100.0%
Zip Codes with the Highest Percentage of Households with Income Above $200,000 in Georgia
| Zip Code | Households with Income > $200k | vs State | vs National | |
| 1. | 30639 | 100.0% | 10.0%(+90.0)#1 | 11.4%(+88.6)#17 |
| 2. | 30289 | 78.3% | 10.0%(+68.3)#2 | 11.4%(+66.9)#38 |
| 3. | 30327 | 45.8% | 10.0%(+35.8)#3 | 11.4%(+34.4)#395 |
| 4. | 30005 | 38.9% | 10.0%(+28.9)#4 | 11.4%(+27.5)#713 |
| 5. | 30414 | 36.8% | 10.0%(+26.8)#5 | 11.4%(+25.4)#854 |
| 6. | 30075 | 35.7% | 10.0%(+25.7)#6 | 11.4%(+24.3)#921 |
| 7. | 30068 | 34.8% | 10.0%(+24.8)#7 | 11.4%(+23.4)#997 |
| 8. | 30307 | 32.7% | 10.0%(+22.7)#8 | 11.4%(+21.3)#1,179 |
| 9. | 30009 | 32.6% | 10.0%(+22.6)#9 | 11.4%(+21.2)#1,190 |
| 10. | 30319 | 32.3% | 10.0%(+22.3)#10 | 11.4%(+20.9)#1,221 |
| 11. | 30022 | 32.2% | 10.0%(+22.2)#11 | 11.4%(+20.8)#1,227 |
| 12. | 30342 | 32.0% | 10.0%(+22.0)#12 | 11.4%(+20.6)#1,243 |
| 13. | 30004 | 31.7% | 10.0%(+21.7)#13 | 11.4%(+20.3)#1,266 |
| 14. | 30338 | 31.0% | 10.0%(+21.0)#14 | 11.4%(+19.6)#1,347 |
| 15. | 30306 | 30.6% | 10.0%(+20.6)#15 | 11.4%(+19.2)#1,386 |
| 16. | 30305 | 30.5% | 10.0%(+20.5)#16 | 11.4%(+19.1)#1,397 |
| 17. | 30030 | 30.0% | 10.0%(+20.0)#17 | 11.4%(+18.6)#1,453 |
| 18. | 30750 | 29.6% | 10.0%(+19.6)#18 | 11.4%(+18.2)#1,512 |
| 19. | 30041 | 29.4% | 10.0%(+19.4)#19 | 11.4%(+18.0)#1,528 |
| 20. | 30363 | 29.4% | 10.0%(+19.4)#20 | 11.4%(+18.0)#1,541 |
| 21. | 30024 | 28.3% | 10.0%(+18.3)#21 | 11.4%(+16.9)#1,675 |
| 22. | 30097 | 28.3% | 10.0%(+18.3)#22 | 11.4%(+16.9)#1,677 |
| 23. | 31411 | 27.4% | 10.0%(+17.4)#23 | 11.4%(+16.0)#1,815 |
| 24. | 30269 | 26.2% | 10.0%(+16.2)#24 | 11.4%(+14.8)#1,997 |
| 25. | 30317 | 26.2% | 10.0%(+16.2)#25 | 11.4%(+14.8)#2,002 |
| 26. | 31829 | 26.2% | 10.0%(+16.2)#26 | 11.4%(+14.8)#2,008 |
| 27. | 30062 | 25.1% | 10.0%(+15.1)#27 | 11.4%(+13.7)#2,165 |
| 28. | 30040 | 24.8% | 10.0%(+14.8)#28 | 11.4%(+13.4)#2,218 |
| 29. | 30064 | 23.0% | 10.0%(+13.0)#29 | 11.4%(+11.6)#2,548 |
| 30. | 30152 | 22.9% | 10.0%(+12.9)#30 | 11.4%(+11.5)#2,568 |
| 31. | 30622 | 22.8% | 10.0%(+12.8)#31 | 11.4%(+11.4)#2,606 |
| 32. | 31550 | 22.7% | 10.0%(+12.7)#32 | 11.4%(+11.3)#2,640 |
| 33. | 30076 | 22.6% | 10.0%(+12.6)#33 | 11.4%(+11.2)#2,648 |
| 34. | 30345 | 22.2% | 10.0%(+12.2)#34 | 11.4%(+10.8)#2,732 |
| 35. | 31065 | 21.7% | 10.0%(+11.7)#35 | 11.4%(+10.3)#2,860 |
| 36. | 30309 | 21.4% | 10.0%(+11.4)#36 | 11.4%(+10.00)#2,902 |
| 37. | 30328 | 21.3% | 10.0%(+11.3)#37 | 11.4%(+9.90)#2,927 |
| 38. | 30809 | 20.5% | 10.0%(+10.5)#38 | 11.4%(+9.10)#3,149 |
| 39. | 30621 | 20.4% | 10.0%(+10.4)#39 | 11.4%(+9.00)#3,184 |
| 40. | 30277 | 20.3% | 10.0%(+10.3)#40 | 11.4%(+8.90)#3,203 |
| 41. | 31820 | 20.1% | 10.0%(+10.1)#41 | 11.4%(+8.70)#3,259 |
| 42. | 30082 | 19.8% | 10.0%(+9.80)#42 | 11.4%(+8.40)#3,341 |
| 43. | 30290 | 19.7% | 10.0%(+9.70)#43 | 11.4%(+8.30)#3,374 |
| 44. | 30017 | 19.6% | 10.0%(+9.60)#44 | 11.4%(+8.20)#3,399 |
| 45. | 31808 | 19.5% | 10.0%(+9.50)#45 | 11.4%(+8.10)#3,440 |
| 46. | 30677 | 19.0% | 10.0%(+9.00)#46 | 11.4%(+7.60)#3,565 |
| 47. | 30326 | 18.8% | 10.0%(+8.80)#47 | 11.4%(+7.40)#3,623 |
| 48. | 30066 | 18.6% | 10.0%(+8.60)#48 | 11.4%(+7.20)#3,663 |
| 49. | 30215 | 18.6% | 10.0%(+8.60)#49 | 11.4%(+7.20)#3,669 |
| 50. | 30033 | 18.3% | 10.0%(+8.30)#50 | 11.4%(+6.90)#3,746 |
| 51. | 30115 | 17.9% | 10.0%(+7.90)#51 | 11.4%(+6.50)#3,868 |
| 52. | 30316 | 17.7% | 10.0%(+7.70)#52 | 11.4%(+6.30)#3,936 |
| 53. | 30028 | 17.6% | 10.0%(+7.60)#53 | 11.4%(+6.20)#3,960 |
| 54. | 31522 | 17.6% | 10.0%(+7.60)#54 | 11.4%(+6.20)#3,972 |
| 55. | 30642 | 17.2% | 10.0%(+7.20)#55 | 11.4%(+5.80)#4,110 |
| 56. | 30002 | 17.1% | 10.0%(+7.10)#56 | 11.4%(+5.70)#4,160 |
| 57. | 30336 | 16.9% | 10.0%(+6.90)#57 | 11.4%(+5.50)#4,241 |
| 58. | 30548 | 16.8% | 10.0%(+6.80)#58 | 11.4%(+5.40)#4,258 |
| 59. | 30339 | 16.6% | 10.0%(+6.60)#59 | 11.4%(+5.20)#4,326 |
| 60. | 31025 | 16.6% | 10.0%(+6.60)#60 | 11.4%(+5.20)#4,348 |
| 61. | 31812 | 16.6% | 10.0%(+6.60)#61 | 11.4%(+5.20)#4,352 |
| 62. | 30519 | 16.5% | 10.0%(+6.50)#62 | 11.4%(+5.10)#4,359 |
| 63. | 30265 | 16.5% | 10.0%(+6.50)#63 | 11.4%(+5.10)#4,368 |
| 64. | 30101 | 16.4% | 10.0%(+6.40)#64 | 11.4%(+5.00)#4,402 |
| 65. | 30189 | 16.4% | 10.0%(+6.40)#65 | 11.4%(+5.00)#4,404 |
| 66. | 30019 | 16.3% | 10.0%(+6.30)#66 | 11.4%(+4.90)#4,442 |
| 67. | 31210 | 16.3% | 10.0%(+6.30)#67 | 11.4%(+4.90)#4,445 |
| 68. | 30107 | 16.3% | 10.0%(+6.30)#68 | 11.4%(+4.90)#4,455 |
| 69. | 30324 | 16.0% | 10.0%(+6.00)#69 | 11.4%(+4.60)#4,558 |
| 70. | 30517 | 15.9% | 10.0%(+5.90)#70 | 11.4%(+4.50)#4,610 |
| 71. | 31804 | 15.9% | 10.0%(+5.90)#71 | 11.4%(+4.50)#4,620 |
| 72. | 30205 | 15.8% | 10.0%(+5.80)#72 | 11.4%(+4.40)#4,662 |
| 73. | 30126 | 15.7% | 10.0%(+5.70)#73 | 11.4%(+4.30)#4,683 |
| 74. | 31324 | 15.5% | 10.0%(+5.50)#74 | 11.4%(+4.10)#4,753 |
| 75. | 30318 | 15.4% | 10.0%(+5.40)#75 | 11.4%(+4.00)#4,799 |
| 76. | 30080 | 15.4% | 10.0%(+5.40)#76 | 11.4%(+4.00)#4,801 |
| 77. | 30506 | 15.0% | 10.0%(+5.00)#77 | 11.4%(+3.60)#4,975 |
| 78. | 30341 | 14.6% | 10.0%(+4.60)#78 | 11.4%(+3.20)#5,176 |
| 79. | 30188 | 14.5% | 10.0%(+4.50)#79 | 11.4%(+3.10)#5,207 |
| 80. | 31047 | 14.5% | 10.0%(+4.50)#80 | 11.4%(+3.10)#5,220 |
| 81. | 30648 | 14.4% | 10.0%(+4.40)#81 | 11.4%(+3.00)#5,280 |
| 82. | 30092 | 14.2% | 10.0%(+4.20)#82 | 11.4%(+2.80)#5,350 |
| 83. | 30252 | 14.1% | 10.0%(+4.10)#83 | 11.4%(+2.70)#5,404 |
| 84. | 30542 | 14.1% | 10.0%(+4.10)#84 | 11.4%(+2.70)#5,407 |
| 85. | 30350 | 14.0% | 10.0%(+4.00)#85 | 11.4%(+2.60)#5,461 |
| 86. | 30259 | 14.0% | 10.0%(+4.00)#86 | 11.4%(+2.60)#5,481 |
| 87. | 30464 | 14.0% | 10.0%(+4.00)#87 | 11.4%(+2.60)#5,501 |
| 88. | 30518 | 13.8% | 10.0%(+3.80)#88 | 11.4%(+2.40)#5,556 |
| 89. | 30360 | 13.8% | 10.0%(+3.80)#89 | 11.4%(+2.40)#5,571 |
| 90. | 30114 | 13.6% | 10.0%(+3.60)#90 | 11.4%(+2.20)#5,670 |
| 91. | 30067 | 13.5% | 10.0%(+3.50)#91 | 11.4%(+2.10)#5,724 |
| 92. | 30802 | 13.4% | 10.0%(+3.40)#92 | 11.4%(+2.00)#5,813 |
| 93. | 30308 | 13.3% | 10.0%(+3.30)#93 | 11.4%(+1.90)#5,846 |
| 94. | 30087 | 12.8% | 10.0%(+2.80)#94 | 11.4%(+1.40)#6,121 |
| 95. | 31629 | 12.8% | 10.0%(+2.80)#95 | 11.4%(+1.40)#6,173 |
| 96. | 30312 | 12.6% | 10.0%(+2.60)#96 | 11.4%(+1.20)#6,264 |
| 97. | 30276 | 12.5% | 10.0%(+2.50)#97 | 11.4%(+1.10)#6,342 |
| 98. | 31046 | 12.5% | 10.0%(+2.50)#98 | 11.4%(+1.10)#6,367 |
| 99. | 39866 | 12.4% | 10.0%(+2.40)#99 | 11.4%(+1.000)#6,440 |
| 100. | 31567 | 12.4% | 10.0%(+2.40)#100 | 11.4%(+1.000)#6,443 |
Common Questions
What are the Top 10 Zip Codes with the Highest Percentage of Households with Income Above $200,000 in Georgia?
Top 10 Zip Codes with the Highest Percentage of Households with Income Above $200,000 in Georgia are:
What zip code has the Highest Percentage of Households with Income Above $200,000 in Georgia?
30639 has the Highest Percentage of Households with Income Above $200,000 in Georgia with 100.0%.
What is the Percentage of Households with Income Above $200,000 in the State of Georgia?
Percentage of Households with Income Above $200,000 in Georgia is 10.0%.
What is the Percentage of Households with Income Above $200,000 in the United States?
Percentage of Households with Income Above $200,000 in the United States is 11.4%.