Zip Codes with the Highest Percentage of Households with Income Above $200,000 in Texas
RELATED REPORTS & OPTIONS
Household Income | $200k+
Texas
Compare Zip Codes
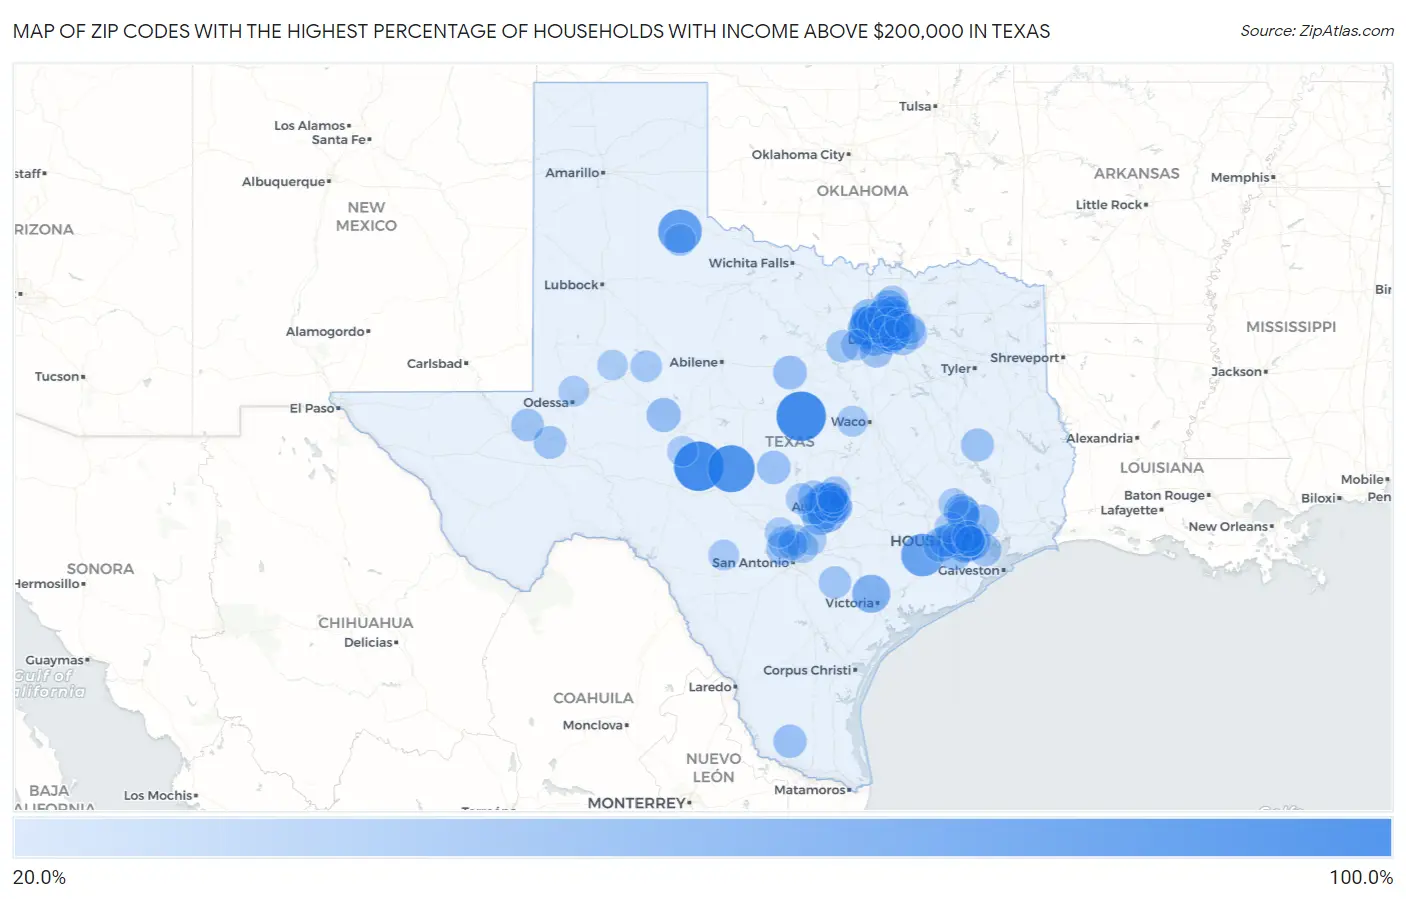
Map of Zip Codes with the Highest Percentage of Households with Income Above $200,000 in Texas
20.0%
100.0%
Zip Codes with the Highest Percentage of Households with Income Above $200,000 in Texas
| Zip Code | Households with Income > $200k | vs State | vs National | |
| 1. | 76841 | 100.0% | 10.6%(+89.4)#1 | 11.4%(+88.6)#4 |
| 2. | 76565 | 100.0% | 10.6%(+89.4)#2 | 11.4%(+88.6)#15 |
| 3. | 76848 | 90.0% | 10.6%(+79.4)#3 | 11.4%(+78.6)#30 |
| 4. | 79259 | 76.2% | 10.6%(+65.6)#4 | 11.4%(+64.8)#41 |
| 5. | 77454 | 72.7% | 10.6%(+62.1)#5 | 11.4%(+61.3)#49 |
| 6. | 76092 | 64.3% | 10.6%(+53.7)#6 | 11.4%(+52.9)#86 |
| 7. | 77010 | 55.2% | 10.6%(+44.6)#7 | 11.4%(+43.8)#174 |
| 8. | 77976 | 54.5% | 10.6%(+43.9)#8 | 11.4%(+43.1)#187 |
| 9. | 77401 | 53.4% | 10.6%(+42.8)#9 | 11.4%(+42.0)#205 |
| 10. | 77005 | 52.1% | 10.6%(+41.5)#10 | 11.4%(+40.7)#230 |
| 11. | 78739 | 51.7% | 10.6%(+41.1)#11 | 11.4%(+40.3)#237 |
| 12. | 76034 | 49.3% | 10.6%(+38.7)#12 | 11.4%(+37.9)#302 |
| 13. | 78733 | 48.4% | 10.6%(+37.8)#13 | 11.4%(+37.0)#316 |
| 14. | 76005 | 48.1% | 10.6%(+37.5)#14 | 11.4%(+36.7)#324 |
| 15. | 75205 | 46.4% | 10.6%(+35.8)#15 | 11.4%(+35.0)#376 |
| 16. | 75225 | 46.0% | 10.6%(+35.4)#16 | 11.4%(+34.6)#388 |
| 17. | 75022 | 45.6% | 10.6%(+35.0)#17 | 11.4%(+34.2)#405 |
| 18. | 78746 | 44.1% | 10.6%(+33.5)#18 | 11.4%(+32.7)#457 |
| 19. | 78732 | 43.5% | 10.6%(+32.9)#19 | 11.4%(+32.1)#478 |
| 20. | 78619 | 43.5% | 10.6%(+32.9)#20 | 11.4%(+32.1)#484 |
| 21. | 75078 | 41.1% | 10.6%(+30.5)#21 | 11.4%(+29.7)#592 |
| 22. | 77382 | 41.0% | 10.6%(+30.4)#22 | 11.4%(+29.6)#598 |
| 23. | 77094 | 40.9% | 10.6%(+30.3)#23 | 11.4%(+29.5)#604 |
| 24. | 78738 | 39.7% | 10.6%(+29.1)#24 | 11.4%(+28.3)#661 |
| 25. | 76248 | 39.6% | 10.6%(+29.0)#25 | 11.4%(+28.2)#665 |
| 26. | 76226 | 39.3% | 10.6%(+28.7)#26 | 11.4%(+27.9)#682 |
| 27. | 76958 | 39.3% | 10.6%(+28.7)#27 | 11.4%(+27.9)#687 |
| 28. | 78737 | 39.2% | 10.6%(+28.6)#28 | 11.4%(+27.8)#690 |
| 29. | 77441 | 38.6% | 10.6%(+28.0)#29 | 11.4%(+27.2)#733 |
| 30. | 76445 | 38.0% | 10.6%(+27.4)#30 | 11.4%(+26.6)#774 |
| 31. | 77024 | 37.7% | 10.6%(+27.1)#31 | 11.4%(+26.3)#787 |
| 32. | 75033 | 37.4% | 10.6%(+26.8)#32 | 11.4%(+26.0)#808 |
| 33. | 77008 | 37.4% | 10.6%(+26.8)#33 | 11.4%(+26.0)#809 |
| 34. | 76885 | 36.8% | 10.6%(+26.2)#34 | 11.4%(+25.4)#853 |
| 35. | 78591 | 36.1% | 10.6%(+25.5)#35 | 11.4%(+24.7)#902 |
| 36. | 78730 | 36.0% | 10.6%(+25.4)#36 | 11.4%(+24.6)#905 |
| 37. | 77345 | 35.7% | 10.6%(+25.1)#37 | 11.4%(+24.3)#923 |
| 38. | 78703 | 35.5% | 10.6%(+24.9)#38 | 11.4%(+24.1)#940 |
| 39. | 75856 | 35.3% | 10.6%(+24.7)#39 | 11.4%(+23.9)#958 |
| 40. | 77007 | 34.8% | 10.6%(+24.2)#40 | 11.4%(+23.4)#995 |
| 41. | 75182 | 34.8% | 10.6%(+24.2)#41 | 11.4%(+23.4)#1,000 |
| 42. | 77479 | 34.5% | 10.6%(+23.9)#42 | 11.4%(+23.1)#1,009 |
| 43. | 75035 | 34.4% | 10.6%(+23.8)#43 | 11.4%(+23.0)#1,019 |
| 44. | 75013 | 34.4% | 10.6%(+23.8)#44 | 11.4%(+23.0)#1,020 |
| 45. | 77381 | 34.4% | 10.6%(+23.8)#45 | 11.4%(+23.0)#1,022 |
| 46. | 75209 | 34.3% | 10.6%(+23.7)#46 | 11.4%(+22.9)#1,035 |
| 47. | 78255 | 34.1% | 10.6%(+23.5)#47 | 11.4%(+22.7)#1,050 |
| 48. | 79743 | 33.7% | 10.6%(+23.1)#48 | 11.4%(+22.3)#1,098 |
| 49. | 77059 | 33.6% | 10.6%(+23.0)#49 | 11.4%(+22.2)#1,104 |
| 50. | 75054 | 33.4% | 10.6%(+22.8)#50 | 11.4%(+22.0)#1,118 |
| 51. | 79777 | 33.3% | 10.6%(+22.7)#51 | 11.4%(+21.9)#1,136 |
| 52. | 76008 | 32.7% | 10.6%(+22.1)#52 | 11.4%(+21.3)#1,178 |
| 53. | 75214 | 32.6% | 10.6%(+22.0)#53 | 11.4%(+21.2)#1,187 |
| 54. | 77389 | 32.5% | 10.6%(+21.9)#54 | 11.4%(+21.1)#1,202 |
| 55. | 78116 | 32.4% | 10.6%(+21.8)#55 | 11.4%(+21.0)#1,219 |
| 56. | 75230 | 31.9% | 10.6%(+21.3)#56 | 11.4%(+20.5)#1,249 |
| 57. | 77019 | 31.7% | 10.6%(+21.1)#57 | 11.4%(+20.3)#1,272 |
| 58. | 75019 | 31.5% | 10.6%(+20.9)#58 | 11.4%(+20.1)#1,293 |
| 59. | 78734 | 31.5% | 10.6%(+20.9)#59 | 11.4%(+20.1)#1,296 |
| 60. | 78701 | 31.4% | 10.6%(+20.8)#60 | 11.4%(+20.0)#1,308 |
| 61. | 78620 | 31.1% | 10.6%(+20.5)#61 | 11.4%(+19.7)#1,338 |
| 62. | 76262 | 30.9% | 10.6%(+20.3)#62 | 11.4%(+19.5)#1,356 |
| 63. | 78717 | 30.6% | 10.6%(+20.0)#63 | 11.4%(+19.2)#1,383 |
| 64. | 79223 | 30.4% | 10.6%(+19.8)#64 | 11.4%(+19.0)#1,415 |
| 65. | 75032 | 30.1% | 10.6%(+19.5)#65 | 11.4%(+18.7)#1,442 |
| 66. | 78015 | 29.9% | 10.6%(+19.3)#66 | 11.4%(+18.5)#1,468 |
| 67. | 75025 | 29.7% | 10.6%(+19.1)#67 | 11.4%(+18.3)#1,493 |
| 68. | 77494 | 29.4% | 10.6%(+18.8)#68 | 11.4%(+18.0)#1,526 |
| 69. | 75072 | 29.2% | 10.6%(+18.6)#69 | 11.4%(+17.8)#1,550 |
| 70. | 79565 | 29.1% | 10.6%(+18.5)#70 | 11.4%(+17.7)#1,577 |
| 71. | 75028 | 28.8% | 10.6%(+18.2)#71 | 11.4%(+17.4)#1,604 |
| 72. | 78669 | 28.8% | 10.6%(+18.2)#72 | 11.4%(+17.4)#1,610 |
| 73. | 75036 | 28.5% | 10.6%(+17.9)#73 | 11.4%(+17.1)#1,646 |
| 74. | 75048 | 28.4% | 10.6%(+17.8)#74 | 11.4%(+17.0)#1,664 |
| 75. | 75093 | 28.3% | 10.6%(+17.7)#75 | 11.4%(+16.9)#1,676 |
| 76. | 75009 | 28.0% | 10.6%(+17.4)#76 | 11.4%(+16.6)#1,722 |
| 77. | 78163 | 27.8% | 10.6%(+17.2)#77 | 11.4%(+16.4)#1,758 |
| 78. | 78266 | 27.7% | 10.6%(+17.1)#78 | 11.4%(+16.3)#1,780 |
| 79. | 75229 | 27.4% | 10.6%(+16.8)#79 | 11.4%(+16.0)#1,807 |
| 80. | 75218 | 27.1% | 10.6%(+16.5)#80 | 11.4%(+15.7)#1,860 |
| 81. | 75094 | 26.9% | 10.6%(+16.3)#81 | 11.4%(+15.5)#1,895 |
| 82. | 76638 | 26.9% | 10.6%(+16.3)#82 | 11.4%(+15.5)#1,900 |
| 83. | 78735 | 26.7% | 10.6%(+16.1)#83 | 11.4%(+15.3)#1,915 |
| 84. | 77433 | 26.6% | 10.6%(+16.0)#84 | 11.4%(+15.2)#1,926 |
| 85. | 76109 | 26.6% | 10.6%(+16.0)#85 | 11.4%(+15.2)#1,932 |
| 86. | 78663 | 26.6% | 10.6%(+16.0)#86 | 11.4%(+15.2)#1,942 |
| 87. | 78838 | 26.6% | 10.6%(+16.0)#87 | 11.4%(+15.2)#1,943 |
| 88. | 78731 | 26.5% | 10.6%(+15.9)#88 | 11.4%(+15.1)#1,944 |
| 89. | 77079 | 26.1% | 10.6%(+15.5)#89 | 11.4%(+14.7)#2,013 |
| 90. | 77316 | 26.0% | 10.6%(+15.4)#90 | 11.4%(+14.6)#2,025 |
| 91. | 77018 | 26.0% | 10.6%(+15.4)#91 | 11.4%(+14.6)#2,026 |
| 92. | 76935 | 26.0% | 10.6%(+15.4)#92 | 11.4%(+14.6)#2,032 |
| 93. | 79758 | 25.7% | 10.6%(+15.1)#93 | 11.4%(+14.3)#2,070 |
| 94. | 78750 | 25.6% | 10.6%(+15.0)#94 | 11.4%(+14.2)#2,080 |
| 95. | 78132 | 25.3% | 10.6%(+14.7)#95 | 11.4%(+13.9)#2,125 |
| 96. | 79748 | 25.3% | 10.6%(+14.7)#96 | 11.4%(+13.9)#2,139 |
| 97. | 78260 | 25.1% | 10.6%(+14.5)#97 | 11.4%(+13.7)#2,168 |
| 98. | 78006 | 24.9% | 10.6%(+14.3)#98 | 11.4%(+13.5)#2,207 |
| 99. | 75087 | 24.5% | 10.6%(+13.9)#99 | 11.4%(+13.1)#2,275 |
| 100. | 77006 | 24.5% | 10.6%(+13.9)#100 | 11.4%(+13.1)#2,278 |
Common Questions
What are the Top 10 Zip Codes with the Highest Percentage of Households with Income Above $200,000 in Texas?
Top 10 Zip Codes with the Highest Percentage of Households with Income Above $200,000 in Texas are:
What zip code has the Highest Percentage of Households with Income Above $200,000 in Texas?
76841 has the Highest Percentage of Households with Income Above $200,000 in Texas with 100.0%.
What is the Percentage of Households with Income Above $200,000 in the State of Texas?
Percentage of Households with Income Above $200,000 in Texas is 10.6%.
What is the Percentage of Households with Income Above $200,000 in the United States?
Percentage of Households with Income Above $200,000 in the United States is 11.4%.