Zip Codes with the Highest Percentage of Households with Income Above $200,000 in Vermont
RELATED REPORTS & OPTIONS
Household Income | $200k+
Vermont
Compare Zip Codes
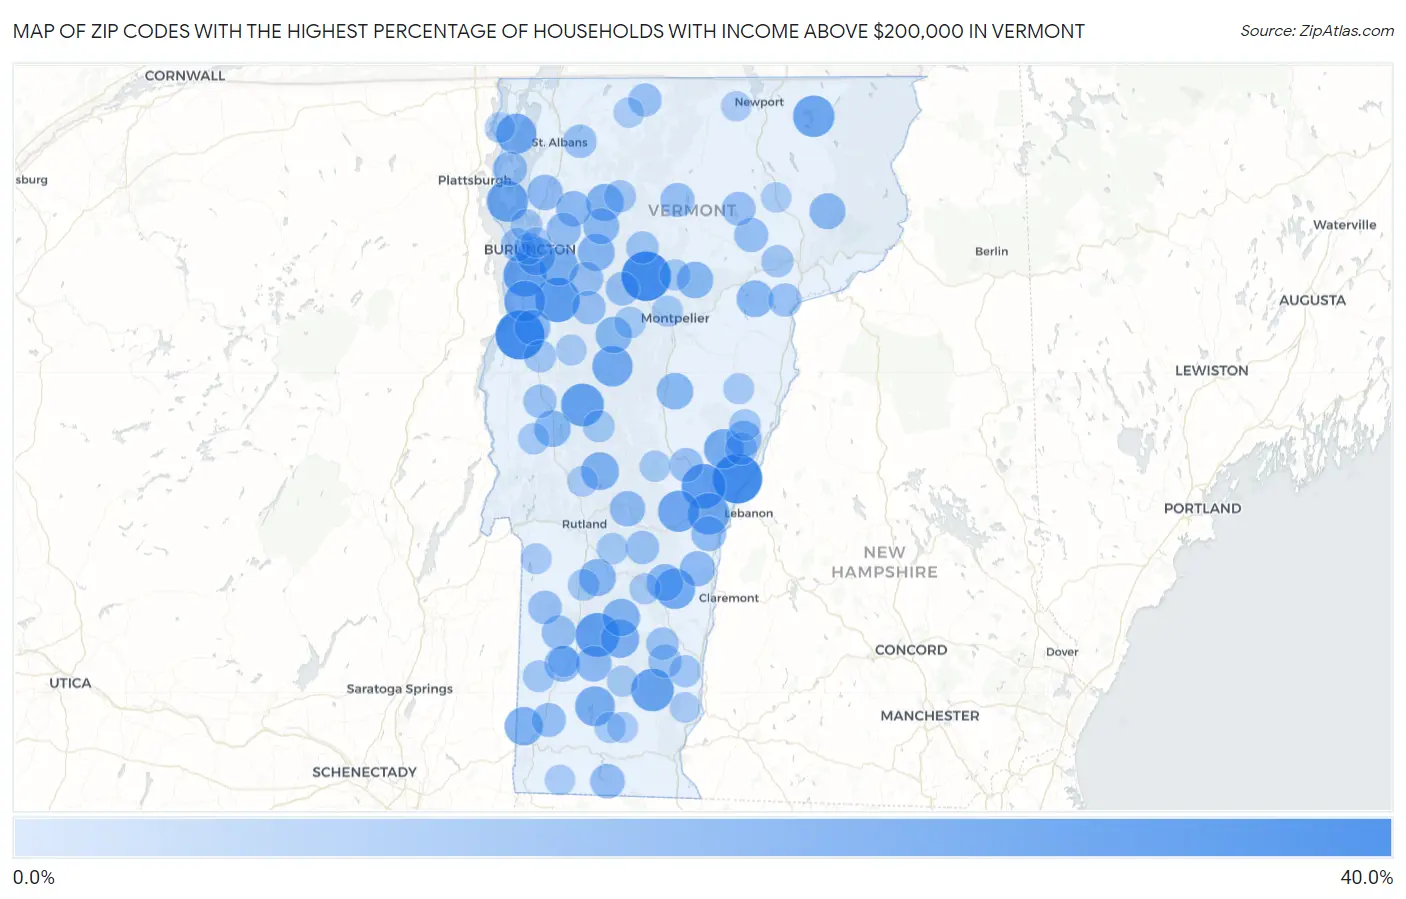
Map of Zip Codes with the Highest Percentage of Households with Income Above $200,000 in Vermont
0.0%
40.0%
Zip Codes with the Highest Percentage of Households with Income Above $200,000 in Vermont
| Zip Code | Households with Income > $200k | vs State | vs National | |
| 1. | 05055 | 31.0% | 8.9%(+22.1)#1 | 11.4%(+19.6)#1,353 |
| 2. | 05677 | 30.8% | 8.9%(+21.9)#2 | 11.4%(+19.4)#1,371 |
| 3. | 05456 | 30.2% | 8.9%(+21.3)#3 | 11.4%(+18.8)#1,439 |
| 4. | 05461 | 24.7% | 8.9%(+15.8)#4 | 11.4%(+13.3)#2,250 |
| 5. | 05084 | 24.5% | 8.9%(+15.6)#5 | 11.4%(+13.1)#2,288 |
| 6. | 05152 | 24.1% | 8.9%(+15.2)#6 | 11.4%(+12.7)#2,361 |
| 7. | 05482 | 23.1% | 8.9%(+14.2)#7 | 11.4%(+11.7)#2,538 |
| 8. | 05766 | 22.7% | 8.9%(+13.8)#8 | 11.4%(+11.3)#2,641 |
| 9. | 05353 | 22.4% | 8.9%(+13.5)#9 | 11.4%(+11.0)#2,705 |
| 10. | 05059 | 21.2% | 8.9%(+12.3)#10 | 11.4%(+9.80)#2,981 |
| 11. | 05853 | 21.1% | 8.9%(+12.2)#11 | 11.4%(+9.70)#3,011 |
| 12. | 05486 | 20.9% | 8.9%(+12.0)#12 | 11.4%(+9.50)#3,066 |
| 13. | 05091 | 20.8% | 8.9%(+11.9)#13 | 11.4%(+9.40)#3,089 |
| 14. | 05445 | 20.5% | 8.9%(+11.6)#14 | 11.4%(+9.10)#3,166 |
| 15. | 05674 | 19.7% | 8.9%(+10.8)#15 | 11.4%(+8.30)#3,377 |
| 16. | 05142 | 19.7% | 8.9%(+10.8)#16 | 11.4%(+8.30)#3,383 |
| 17. | 05474 | 19.5% | 8.9%(+10.6)#17 | 11.4%(+8.10)#3,450 |
| 18. | 05360 | 19.0% | 8.9%(+10.1)#18 | 11.4%(+7.60)#3,579 |
| 19. | 05070 | 18.7% | 8.9%(+9.80)#19 | 11.4%(+7.30)#3,661 |
| 20. | 05495 | 18.1% | 8.9%(+9.20)#20 | 11.4%(+6.70)#3,823 |
| 21. | 05148 | 17.3% | 8.9%(+8.40)#21 | 11.4%(+5.90)#4,085 |
| 22. | 05257 | 17.2% | 8.9%(+8.30)#22 | 11.4%(+5.80)#4,127 |
| 23. | 05403 | 17.0% | 8.9%(+8.10)#23 | 11.4%(+5.60)#4,190 |
| 24. | 05737 | 16.7% | 8.9%(+7.80)#24 | 11.4%(+5.30)#4,308 |
| 25. | 05444 | 16.1% | 8.9%(+7.20)#25 | 11.4%(+4.70)#4,537 |
| 26. | 05161 | 16.1% | 8.9%(+7.20)#26 | 11.4%(+4.70)#4,541 |
| 27. | 05465 | 15.7% | 8.9%(+6.80)#27 | 11.4%(+4.30)#4,697 |
| 28. | 05742 | 15.6% | 8.9%(+6.70)#28 | 11.4%(+4.20)#4,745 |
| 29. | 05153 | 15.5% | 8.9%(+6.60)#29 | 11.4%(+4.10)#4,792 |
| 30. | 05862 | 15.2% | 8.9%(+6.30)#30 | 11.4%(+3.80)#4,921 |
| 31. | 05648 | 15.1% | 8.9%(+6.20)#31 | 11.4%(+3.70)#4,966 |
| 32. | 05673 | 15.0% | 8.9%(+6.10)#32 | 11.4%(+3.60)#4,997 |
| 33. | 05769 | 15.0% | 8.9%(+6.10)#33 | 11.4%(+3.60)#5,007 |
| 34. | 05036 | 14.9% | 8.9%(+6.00)#34 | 11.4%(+3.50)#5,057 |
| 35. | 05832 | 14.3% | 8.9%(+5.40)#35 | 11.4%(+2.90)#5,330 |
| 36. | 05254 | 14.3% | 8.9%(+5.40)#36 | 11.4%(+2.90)#5,333 |
| 37. | 05489 | 14.2% | 8.9%(+5.30)#37 | 11.4%(+2.80)#5,377 |
| 38. | 05340 | 14.2% | 8.9%(+5.30)#38 | 11.4%(+2.80)#5,390 |
| 39. | 05058 | 14.1% | 8.9%(+5.20)#39 | 11.4%(+2.70)#5,455 |
| 40. | 05473 | 13.9% | 8.9%(+5.00)#40 | 11.4%(+2.50)#5,542 |
| 41. | 05468 | 13.7% | 8.9%(+4.80)#41 | 11.4%(+2.30)#5,633 |
| 42. | 05494 | 13.6% | 8.9%(+4.70)#42 | 11.4%(+2.20)#5,706 |
| 43. | 05751 | 13.6% | 8.9%(+4.70)#43 | 11.4%(+2.20)#5,713 |
| 44. | 05037 | 13.5% | 8.9%(+4.60)#44 | 11.4%(+2.10)#5,767 |
| 45. | 05048 | 13.1% | 8.9%(+4.20)#45 | 11.4%(+1.70)#5,977 |
| 46. | 05361 | 12.8% | 8.9%(+3.90)#46 | 11.4%(+1.40)#6,174 |
| 47. | 05452 | 12.5% | 8.9%(+3.60)#47 | 11.4%(+1.10)#6,336 |
| 48. | 05458 | 12.3% | 8.9%(+3.40)#48 | 11.4%(+0.900)#6,506 |
| 49. | 05836 | 12.2% | 8.9%(+3.30)#49 | 11.4%(+0.800)#6,563 |
| 50. | 05655 | 12.1% | 8.9%(+3.20)#50 | 11.4%(+0.700)#6,625 |
| 51. | 05251 | 12.1% | 8.9%(+3.20)#51 | 11.4%(+0.700)#6,634 |
| 52. | 05262 | 12.0% | 8.9%(+3.10)#52 | 11.4%(+0.600)#6,697 |
| 53. | 05477 | 11.9% | 8.9%(+3.00)#53 | 11.4%(+0.500)#6,756 |
| 54. | 05068 | 11.8% | 8.9%(+2.90)#54 | 11.4%(+0.400)#6,822 |
| 55. | 05462 | 11.7% | 8.9%(+2.80)#55 | 11.4%(+0.300)#6,896 |
| 56. | 05841 | 11.7% | 8.9%(+2.80)#56 | 11.4%(+0.300)#6,916 |
| 57. | 05676 | 11.5% | 8.9%(+2.60)#57 | 11.4%(+0.100)#7,039 |
| 58. | 05761 | 11.5% | 8.9%(+2.60)#58 | 11.4%(+0.100)#7,053 |
| 59. | 05753 | 11.3% | 8.9%(+2.40)#59 | 11.4%(-0.100)#7,168 |
| 60. | 05408 | 11.2% | 8.9%(+2.30)#60 | 11.4%(-0.200)#7,243 |
| 61. | 05455 | 11.2% | 8.9%(+2.30)#61 | 11.4%(-0.200)#7,276 |
| 62. | 05821 | 11.2% | 8.9%(+2.30)#62 | 11.4%(-0.200)#7,283 |
| 63. | 05146 | 11.2% | 8.9%(+2.30)#63 | 11.4%(-0.200)#7,288 |
| 64. | 05056 | 11.2% | 8.9%(+2.30)#64 | 11.4%(-0.200)#7,290 |
| 65. | 05447 | 11.1% | 8.9%(+2.20)#65 | 11.4%(-0.300)#7,378 |
| 66. | 05143 | 10.5% | 8.9%(+1.60)#66 | 11.4%(-0.900)#7,804 |
| 67. | 05075 | 10.2% | 8.9%(+1.30)#67 | 11.4%(-1.20)#8,107 |
| 68. | 05672 | 10.1% | 8.9%(+1.20)#68 | 11.4%(-1.30)#8,175 |
| 69. | 05472 | 10.0% | 8.9%(+1.10)#69 | 11.4%(-1.40)#8,305 |
| 70. | 05464 | 9.8% | 8.9%(+0.900)#70 | 11.4%(-1.60)#8,490 |
| 71. | 05828 | 9.8% | 8.9%(+0.900)#71 | 11.4%(-1.60)#8,499 |
| 72. | 05154 | 9.7% | 8.9%(+0.800)#72 | 11.4%(-1.70)#8,608 |
| 73. | 05748 | 9.4% | 8.9%(+0.500)#73 | 11.4%(-2.00)#8,916 |
| 74. | 05401 | 9.3% | 8.9%(+0.400)#74 | 11.4%(-2.10)#8,931 |
| 75. | 05446 | 9.2% | 8.9%(+0.300)#75 | 11.4%(-2.20)#9,052 |
| 76. | 05250 | 9.2% | 8.9%(+0.300)#76 | 11.4%(-2.20)#9,078 |
| 77. | 05773 | 9.2% | 8.9%(+0.300)#77 | 11.4%(-2.20)#9,086 |
| 78. | 05660 | 9.0% | 8.9%(+0.100)#78 | 11.4%(-2.40)#9,274 |
| 79. | 05738 | 9.0% | 8.9%(+0.100)#79 | 11.4%(-2.40)#9,282 |
| 80. | 05083 | 9.0% | 8.9%(+0.100)#80 | 11.4%(-2.40)#9,300 |
| 81. | 05255 | 8.9% | 8.9%(=0.000)#81 | 11.4%(-2.50)#9,358 |
| 82. | 05778 | 8.8% | 8.9%(-0.100)#82 | 11.4%(-2.60)#9,484 |
| 83. | 05602 | 8.7% | 8.9%(-0.200)#83 | 11.4%(-2.70)#9,554 |
| 84. | 05682 | 8.7% | 8.9%(-0.200)#84 | 11.4%(-2.70)#9,600 |
| 85. | 05032 | 8.6% | 8.9%(-0.300)#85 | 11.4%(-2.80)#9,688 |
| 86. | 05356 | 8.6% | 8.9%(-0.300)#86 | 11.4%(-2.80)#9,720 |
| 87. | 05149 | 8.5% | 8.9%(-0.400)#87 | 11.4%(-2.90)#9,810 |
| 88. | 05343 | 8.3% | 8.9%(-0.600)#88 | 11.4%(-3.10)#10,079 |
| 89. | 05039 | 8.3% | 8.9%(-0.600)#89 | 11.4%(-3.10)#10,080 |
| 90. | 05443 | 8.2% | 8.9%(-0.700)#90 | 11.4%(-3.20)#10,135 |
| 91. | 05764 | 8.2% | 8.9%(-0.700)#91 | 11.4%(-3.20)#10,153 |
| 92. | 05341 | 8.2% | 8.9%(-0.700)#92 | 11.4%(-3.20)#10,189 |
| 93. | 05404 | 8.0% | 8.9%(-0.900)#93 | 11.4%(-3.40)#10,397 |
| 94. | 05763 | 8.0% | 8.9%(-0.900)#94 | 11.4%(-3.40)#10,425 |
| 95. | 05346 | 7.8% | 8.9%(-1.10)#95 | 11.4%(-3.60)#10,668 |
| 96. | 05450 | 7.7% | 8.9%(-1.20)#96 | 11.4%(-3.70)#10,803 |
| 97. | 05352 | 7.7% | 8.9%(-1.20)#97 | 11.4%(-3.70)#10,853 |
| 98. | 05463 | 7.7% | 8.9%(-1.20)#98 | 11.4%(-3.70)#10,867 |
| 99. | 05866 | 7.6% | 8.9%(-1.30)#99 | 11.4%(-3.80)#11,007 |
| 100. | 05857 | 7.5% | 8.9%(-1.40)#100 | 11.4%(-3.90)#11,123 |
Common Questions
What are the Top 10 Zip Codes with the Highest Percentage of Households with Income Above $200,000 in Vermont?
Top 10 Zip Codes with the Highest Percentage of Households with Income Above $200,000 in Vermont are:
What zip code has the Highest Percentage of Households with Income Above $200,000 in Vermont?
05055 has the Highest Percentage of Households with Income Above $200,000 in Vermont with 31.0%.
What is the Percentage of Households with Income Above $200,000 in the State of Vermont?
Percentage of Households with Income Above $200,000 in Vermont is 8.9%.
What is the Percentage of Households with Income Above $200,000 in the United States?
Percentage of Households with Income Above $200,000 in the United States is 11.4%.