Zip Codes with the Highest Percentage of Households with Income Above $200,000 in Virginia
RELATED REPORTS & OPTIONS
Household Income | $200k+
Virginia
Compare Zip Codes
Map of Zip Codes with the Highest Percentage of Households with Income Above $200,000 in Virginia
20.0%
100.0%
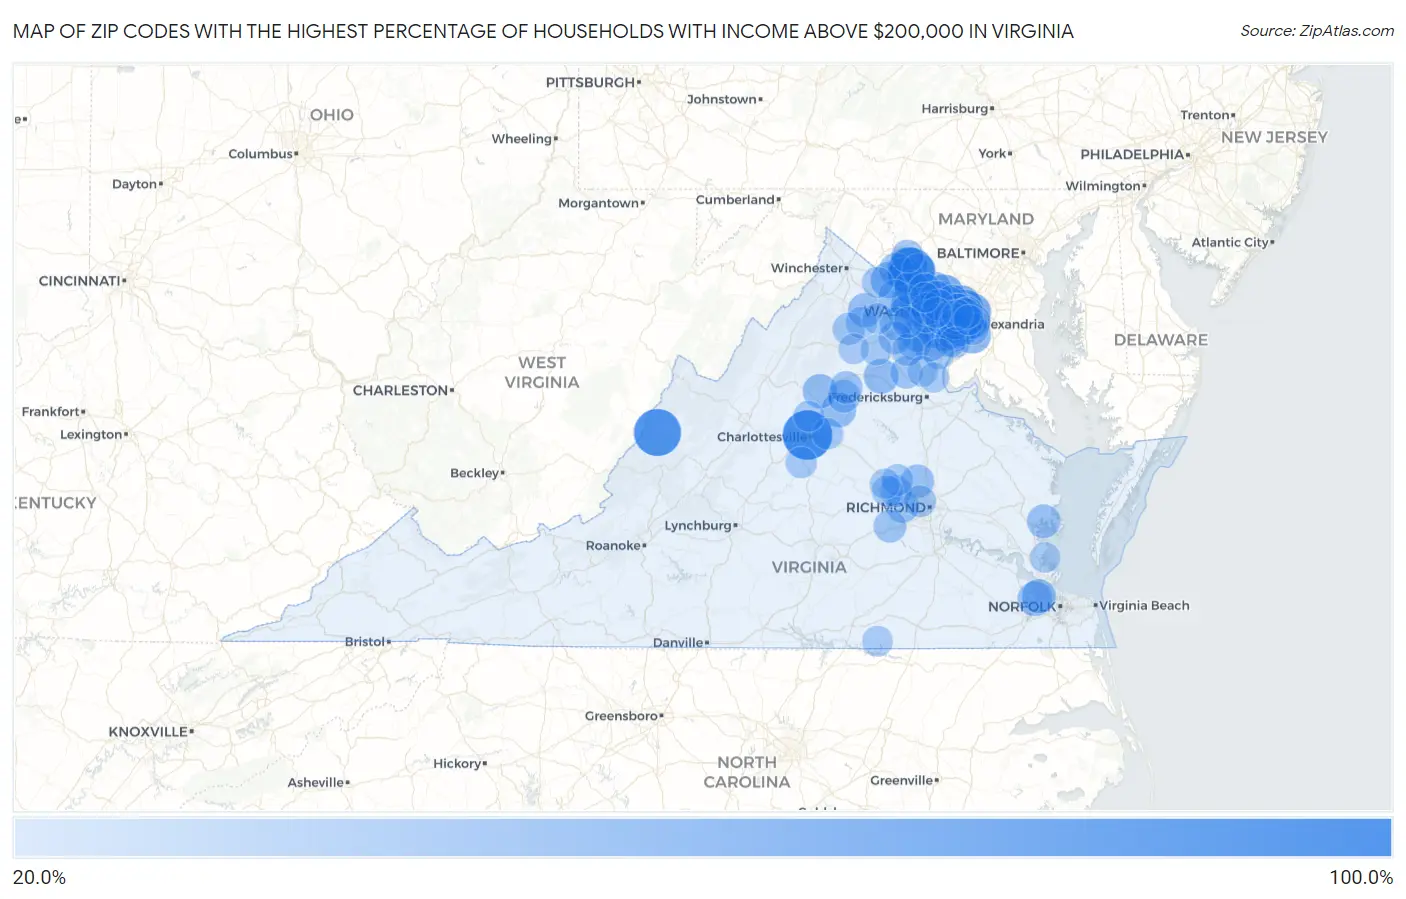
Zip Codes with the Highest Percentage of Households with Income Above $200,000 in Virginia
| Zip Code | Households with Income > $200k | vs State | vs National | |
| 1. | 22904 | 100.0% | 15.6%(+84.4)#1 | 11.4%(+88.6)#1 |
| 2. | 24412 | 90.4% | 15.6%(+74.8)#2 | 11.4%(+79.0)#29 |
| 3. | 20129 | 89.0% | 15.6%(+73.4)#3 | 11.4%(+77.6)#31 |
| 4. | 22027 | 69.6% | 15.6%(+54.0)#4 | 11.4%(+58.2)#56 |
| 5. | 22066 | 65.5% | 15.6%(+49.9)#5 | 11.4%(+54.1)#75 |
| 6. | 22039 | 62.4% | 15.6%(+46.8)#6 | 11.4%(+51.0)#97 |
| 7. | 22211 | 60.7% | 15.6%(+45.1)#7 | 11.4%(+49.3)#112 |
| 8. | 22101 | 60.1% | 15.6%(+44.5)#8 | 11.4%(+48.7)#115 |
| 9. | 22207 | 56.3% | 15.6%(+40.7)#9 | 11.4%(+44.9)#151 |
| 10. | 20148 | 56.2% | 15.6%(+40.6)#10 | 11.4%(+44.8)#154 |
| 11. | 20197 | 55.7% | 15.6%(+40.1)#11 | 11.4%(+44.3)#167 |
| 12. | 20124 | 53.1% | 15.6%(+37.5)#12 | 11.4%(+41.7)#211 |
| 13. | 22205 | 52.1% | 15.6%(+36.5)#13 | 11.4%(+40.7)#231 |
| 14. | 22213 | 50.7% | 15.6%(+35.1)#14 | 11.4%(+39.3)#261 |
| 15. | 22182 | 50.6% | 15.6%(+35.0)#15 | 11.4%(+39.2)#262 |
| 16. | 22308 | 50.6% | 15.6%(+35.0)#16 | 11.4%(+39.2)#264 |
| 17. | 22124 | 50.4% | 15.6%(+34.8)#17 | 11.4%(+39.0)#268 |
| 18. | 22181 | 49.5% | 15.6%(+33.9)#18 | 11.4%(+38.1)#296 |
| 19. | 20105 | 49.3% | 15.6%(+33.7)#19 | 11.4%(+37.9)#301 |
| 20. | 20141 | 46.6% | 15.6%(+31.0)#20 | 11.4%(+35.2)#368 |
| 21. | 22301 | 46.0% | 15.6%(+30.4)#21 | 11.4%(+34.6)#389 |
| 22. | 20152 | 45.3% | 15.6%(+29.7)#22 | 11.4%(+33.9)#415 |
| 23. | 20169 | 45.2% | 15.6%(+29.6)#23 | 11.4%(+33.8)#420 |
| 24. | 22180 | 44.2% | 15.6%(+28.6)#24 | 11.4%(+32.8)#454 |
| 25. | 20158 | 43.6% | 15.6%(+28.0)#25 | 11.4%(+32.2)#477 |
| 26. | 22046 | 42.5% | 15.6%(+26.9)#26 | 11.4%(+31.1)#525 |
| 27. | 20112 | 42.2% | 15.6%(+26.6)#27 | 11.4%(+30.8)#536 |
| 28. | 22741 | 42.0% | 15.6%(+26.4)#28 | 11.4%(+30.6)#552 |
| 29. | 22972 | 41.9% | 15.6%(+26.3)#29 | 11.4%(+30.5)#557 |
| 30. | 23436 | 41.7% | 15.6%(+26.1)#30 | 11.4%(+30.3)#564 |
| 31. | 22723 | 40.7% | 15.6%(+25.1)#31 | 11.4%(+29.3)#620 |
| 32. | 20132 | 40.0% | 15.6%(+24.4)#32 | 11.4%(+28.6)#648 |
| 33. | 23433 | 39.3% | 15.6%(+23.7)#33 | 11.4%(+27.9)#686 |
| 34. | 20194 | 38.9% | 15.6%(+23.3)#34 | 11.4%(+27.5)#715 |
| 35. | 22643 | 38.8% | 15.6%(+23.2)#35 | 11.4%(+27.4)#726 |
| 36. | 20165 | 38.5% | 15.6%(+22.9)#36 | 11.4%(+27.1)#741 |
| 37. | 22032 | 38.5% | 15.6%(+22.9)#37 | 11.4%(+27.1)#742 |
| 38. | 20175 | 38.4% | 15.6%(+22.8)#38 | 11.4%(+27.0)#749 |
| 39. | 20171 | 37.8% | 15.6%(+22.2)#39 | 11.4%(+26.4)#781 |
| 40. | 23128 | 37.4% | 15.6%(+21.8)#40 | 11.4%(+26.0)#814 |
| 41. | 22015 | 36.9% | 15.6%(+21.3)#41 | 11.4%(+25.5)#839 |
| 42. | 20176 | 36.8% | 15.6%(+21.2)#42 | 11.4%(+25.4)#848 |
| 43. | 20136 | 36.7% | 15.6%(+21.1)#43 | 11.4%(+25.3)#857 |
| 44. | 20181 | 36.7% | 15.6%(+21.1)#44 | 11.4%(+25.3)#860 |
| 45. | 20117 | 36.6% | 15.6%(+21.0)#45 | 11.4%(+25.2)#870 |
| 46. | 20147 | 36.5% | 15.6%(+20.9)#46 | 11.4%(+25.1)#872 |
| 47. | 23059 | 36.5% | 15.6%(+20.9)#47 | 11.4%(+25.1)#874 |
| 48. | 22153 | 36.2% | 15.6%(+20.6)#48 | 11.4%(+24.8)#892 |
| 49. | 20170 | 35.6% | 15.6%(+20.0)#49 | 11.4%(+24.2)#926 |
| 50. | 22102 | 35.3% | 15.6%(+19.7)#50 | 11.4%(+23.9)#952 |
| 51. | 23113 | 35.2% | 15.6%(+19.6)#51 | 11.4%(+23.8)#962 |
| 52. | 20137 | 35.2% | 15.6%(+19.6)#52 | 11.4%(+23.8)#966 |
| 53. | 22310 | 34.9% | 15.6%(+19.3)#53 | 11.4%(+23.5)#985 |
| 54. | 20120 | 34.5% | 15.6%(+18.9)#54 | 11.4%(+23.1)#1,012 |
| 55. | 22043 | 34.4% | 15.6%(+18.8)#55 | 11.4%(+23.0)#1,024 |
| 56. | 22732 | 34.4% | 15.6%(+18.8)#56 | 11.4%(+23.0)#1,029 |
| 57. | 20180 | 34.3% | 15.6%(+18.7)#57 | 11.4%(+22.9)#1,037 |
| 58. | 22730 | 34.0% | 15.6%(+18.4)#58 | 11.4%(+22.6)#1,070 |
| 59. | 22314 | 33.9% | 15.6%(+18.3)#59 | 11.4%(+22.5)#1,072 |
| 60. | 23120 | 33.9% | 15.6%(+18.3)#60 | 11.4%(+22.5)#1,074 |
| 61. | 22315 | 33.8% | 15.6%(+18.2)#61 | 11.4%(+22.4)#1,078 |
| 62. | 20187 | 33.8% | 15.6%(+18.2)#62 | 11.4%(+22.4)#1,079 |
| 63. | 20151 | 33.3% | 15.6%(+17.7)#63 | 11.4%(+21.9)#1,126 |
| 64. | 22307 | 32.7% | 15.6%(+17.1)#64 | 11.4%(+21.3)#1,183 |
| 65. | 22627 | 32.3% | 15.6%(+16.7)#65 | 11.4%(+20.9)#1,226 |
| 66. | 22720 | 32.2% | 15.6%(+16.6)#66 | 11.4%(+20.8)#1,238 |
| 67. | 23103 | 31.3% | 15.6%(+15.7)#67 | 11.4%(+19.9)#1,320 |
| 68. | 23226 | 30.5% | 15.6%(+14.9)#68 | 11.4%(+19.1)#1,401 |
| 69. | 20119 | 30.5% | 15.6%(+14.9)#69 | 11.4%(+19.1)#1,405 |
| 70. | 22030 | 29.7% | 15.6%(+14.1)#70 | 11.4%(+18.3)#1,492 |
| 71. | 22152 | 29.7% | 15.6%(+14.1)#71 | 11.4%(+18.3)#1,494 |
| 72. | 22947 | 29.6% | 15.6%(+14.0)#72 | 11.4%(+18.2)#1,511 |
| 73. | 23146 | 29.6% | 15.6%(+14.0)#73 | 11.4%(+18.2)#1,513 |
| 74. | 22031 | 29.5% | 15.6%(+13.9)#74 | 11.4%(+18.1)#1,515 |
| 75. | 22639 | 29.5% | 15.6%(+13.9)#75 | 11.4%(+18.1)#1,524 |
| 76. | 22003 | 29.1% | 15.6%(+13.5)#76 | 11.4%(+17.7)#1,569 |
| 77. | 22946 | 28.9% | 15.6%(+13.3)#77 | 11.4%(+17.5)#1,602 |
| 78. | 22125 | 28.7% | 15.6%(+13.1)#78 | 11.4%(+17.3)#1,625 |
| 79. | 20191 | 28.5% | 15.6%(+12.9)#79 | 11.4%(+17.1)#1,647 |
| 80. | 22151 | 28.5% | 15.6%(+12.9)#80 | 11.4%(+17.1)#1,651 |
| 81. | 23039 | 28.5% | 15.6%(+12.9)#81 | 11.4%(+17.1)#1,659 |
| 82. | 20155 | 28.4% | 15.6%(+12.8)#82 | 11.4%(+17.0)#1,662 |
| 83. | 22201 | 28.3% | 15.6%(+12.7)#83 | 11.4%(+16.9)#1,678 |
| 84. | 22203 | 28.3% | 15.6%(+12.7)#84 | 11.4%(+16.9)#1,681 |
| 85. | 20115 | 28.1% | 15.6%(+12.5)#85 | 11.4%(+16.7)#1,709 |
| 86. | 20135 | 28.0% | 15.6%(+12.4)#86 | 11.4%(+16.6)#1,732 |
| 87. | 22936 | 27.4% | 15.6%(+11.8)#87 | 11.4%(+16.0)#1,817 |
| 88. | 22724 | 27.4% | 15.6%(+11.8)#88 | 11.4%(+16.0)#1,819 |
| 89. | 22042 | 26.9% | 15.6%(+11.3)#89 | 11.4%(+15.5)#1,892 |
| 90. | 22079 | 26.8% | 15.6%(+11.2)#90 | 11.4%(+15.4)#1,904 |
| 91. | 22025 | 26.7% | 15.6%(+11.1)#91 | 11.4%(+15.3)#1,916 |
| 92. | 22033 | 26.4% | 15.6%(+10.8)#92 | 11.4%(+15.0)#1,962 |
| 93. | 22716 | 26.2% | 15.6%(+10.6)#93 | 11.4%(+14.8)#2,009 |
| 94. | 23857 | 26.1% | 15.6%(+10.5)#94 | 11.4%(+14.7)#2,022 |
| 95. | 22302 | 25.5% | 15.6%(+9.90)#95 | 11.4%(+14.1)#2,100 |
| 96. | 22556 | 25.4% | 15.6%(+9.80)#96 | 11.4%(+14.0)#2,114 |
| 97. | 23696 | 25.2% | 15.6%(+9.60)#97 | 11.4%(+13.8)#2,156 |
| 98. | 22554 | 25.0% | 15.6%(+9.40)#98 | 11.4%(+13.6)#2,181 |
| 99. | 20166 | 24.9% | 15.6%(+9.30)#99 | 11.4%(+13.5)#2,213 |
| 100. | 23102 | 24.8% | 15.6%(+9.20)#100 | 11.4%(+13.4)#2,232 |
Common Questions
What are the Top 10 Zip Codes with the Highest Percentage of Households with Income Above $200,000 in Virginia?
Top 10 Zip Codes with the Highest Percentage of Households with Income Above $200,000 in Virginia are:
What zip code has the Highest Percentage of Households with Income Above $200,000 in Virginia?
22904 has the Highest Percentage of Households with Income Above $200,000 in Virginia with 100.0%.
What is the Percentage of Households with Income Above $200,000 in the State of Virginia?
Percentage of Households with Income Above $200,000 in Virginia is 15.6%.
What is the Percentage of Households with Income Above $200,000 in the United States?
Percentage of Households with Income Above $200,000 in the United States is 11.4%.