Zip Codes with the Highest Percentage of Households with Income Above $200,000 in California
RELATED REPORTS & OPTIONS
Household Income | $200k+
California
Compare Zip Codes
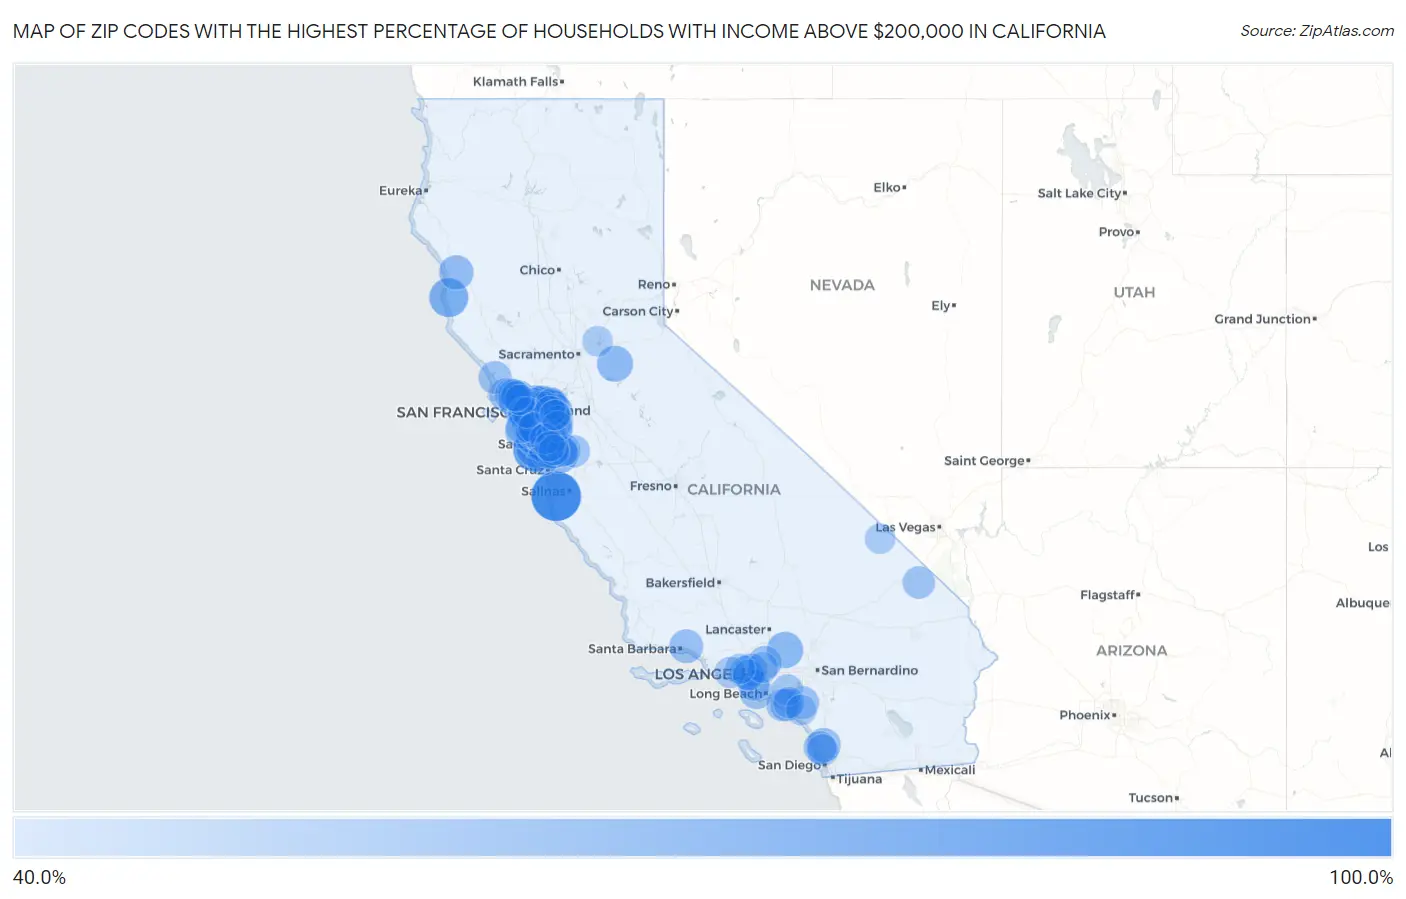
Map of Zip Codes with the Highest Percentage of Households with Income Above $200,000 in California
40.0%
100.0%
Zip Codes with the Highest Percentage of Households with Income Above $200,000 in California
| Zip Code | Households with Income > $200k | vs State | vs National | |
| 1. | 93943 | 100.0% | 17.9%(+82.1)#1 | 11.4%(+88.6)#25 |
| 2. | 94021 | 82.0% | 17.9%(+64.1)#2 | 11.4%(+70.6)#36 |
| 3. | 94020 | 73.1% | 17.9%(+55.2)#3 | 11.4%(+61.7)#48 |
| 4. | 95420 | 68.7% | 17.9%(+50.8)#4 | 11.4%(+57.3)#60 |
| 5. | 94027 | 68.2% | 17.9%(+50.3)#5 | 11.4%(+56.8)#61 |
| 6. | 94024 | 66.2% | 17.9%(+48.3)#6 | 11.4%(+54.8)#71 |
| 7. | 94507 | 65.9% | 17.9%(+48.0)#7 | 11.4%(+54.5)#73 |
| 8. | 94105 | 64.6% | 17.9%(+46.7)#8 | 11.4%(+53.2)#83 |
| 9. | 94957 | 63.6% | 17.9%(+45.7)#9 | 11.4%(+52.2)#90 |
| 10. | 94022 | 63.3% | 17.9%(+45.4)#10 | 11.4%(+51.9)#92 |
| 11. | 94129 | 62.8% | 17.9%(+44.9)#11 | 11.4%(+51.4)#96 |
| 12. | 94563 | 61.0% | 17.9%(+43.1)#12 | 11.4%(+49.6)#106 |
| 13. | 93563 | 61.0% | 17.9%(+43.1)#13 | 11.4%(+49.6)#108 |
| 14. | 95120 | 60.8% | 17.9%(+42.9)#14 | 11.4%(+49.4)#109 |
| 15. | 95699 | 60.0% | 17.9%(+42.1)#15 | 11.4%(+48.6)#118 |
| 16. | 94028 | 58.0% | 17.9%(+40.1)#16 | 11.4%(+46.6)#129 |
| 17. | 95070 | 57.9% | 17.9%(+40.0)#17 | 11.4%(+46.5)#130 |
| 18. | 94528 | 57.8% | 17.9%(+39.9)#18 | 11.4%(+46.4)#137 |
| 19. | 94506 | 57.4% | 17.9%(+39.5)#19 | 11.4%(+46.0)#141 |
| 20. | 95030 | 57.3% | 17.9%(+39.4)#20 | 11.4%(+45.9)#142 |
| 21. | 94018 | 56.2% | 17.9%(+38.3)#21 | 11.4%(+44.8)#158 |
| 22. | 94062 | 55.8% | 17.9%(+37.9)#22 | 11.4%(+44.4)#166 |
| 23. | 95417 | 55.6% | 17.9%(+37.7)#23 | 11.4%(+44.2)#169 |
| 24. | 94539 | 55.4% | 17.9%(+37.5)#24 | 11.4%(+44.0)#173 |
| 25. | 94708 | 54.9% | 17.9%(+37.0)#25 | 11.4%(+43.5)#177 |
| 26. | 92067 | 54.3% | 17.9%(+36.4)#26 | 11.4%(+42.9)#189 |
| 27. | 95014 | 54.2% | 17.9%(+36.3)#27 | 11.4%(+42.8)#191 |
| 28. | 94549 | 54.0% | 17.9%(+36.1)#28 | 11.4%(+42.6)#193 |
| 29. | 94123 | 54.0% | 17.9%(+36.1)#29 | 11.4%(+42.6)#194 |
| 30. | 93108 | 53.8% | 17.9%(+35.9)#30 | 11.4%(+42.4)#198 |
| 31. | 94925 | 53.6% | 17.9%(+35.7)#31 | 11.4%(+42.2)#202 |
| 32. | 94070 | 53.4% | 17.9%(+35.5)#32 | 11.4%(+42.0)#204 |
| 33. | 94950 | 53.3% | 17.9%(+35.4)#33 | 11.4%(+41.9)#209 |
| 34. | 90272 | 52.8% | 17.9%(+34.9)#34 | 11.4%(+41.4)#218 |
| 35. | 94920 | 52.5% | 17.9%(+34.6)#35 | 11.4%(+41.1)#224 |
| 36. | 91011 | 52.4% | 17.9%(+34.5)#36 | 11.4%(+41.0)#226 |
| 37. | 94301 | 51.8% | 17.9%(+33.9)#37 | 11.4%(+40.4)#233 |
| 38. | 94552 | 51.7% | 17.9%(+33.8)#38 | 11.4%(+40.3)#238 |
| 39. | 92679 | 51.6% | 17.9%(+33.7)#39 | 11.4%(+40.2)#240 |
| 40. | 90274 | 51.5% | 17.9%(+33.6)#40 | 11.4%(+40.1)#242 |
| 41. | 94502 | 51.5% | 17.9%(+33.6)#41 | 11.4%(+40.1)#244 |
| 42. | 94065 | 51.3% | 17.9%(+33.4)#42 | 11.4%(+39.9)#246 |
| 43. | 94555 | 51.1% | 17.9%(+33.2)#43 | 11.4%(+39.7)#247 |
| 44. | 94941 | 51.1% | 17.9%(+33.2)#44 | 11.4%(+39.7)#248 |
| 45. | 90077 | 51.1% | 17.9%(+33.2)#45 | 11.4%(+39.7)#249 |
| 46. | 94929 | 51.1% | 17.9%(+33.2)#46 | 11.4%(+39.7)#250 |
| 47. | 94963 | 51.0% | 17.9%(+33.1)#47 | 11.4%(+39.6)#252 |
| 48. | 94582 | 50.9% | 17.9%(+33.0)#48 | 11.4%(+39.5)#253 |
| 49. | 94025 | 50.7% | 17.9%(+32.8)#49 | 11.4%(+39.3)#258 |
| 50. | 94618 | 50.5% | 17.9%(+32.6)#50 | 11.4%(+39.1)#266 |
| 51. | 92014 | 50.3% | 17.9%(+32.4)#51 | 11.4%(+38.9)#270 |
| 52. | 94526 | 50.1% | 17.9%(+32.2)#52 | 11.4%(+38.7)#276 |
| 53. | 94306 | 50.0% | 17.9%(+32.1)#53 | 11.4%(+38.6)#277 |
| 54. | 94127 | 50.0% | 17.9%(+32.1)#54 | 11.4%(+38.6)#278 |
| 55. | 92364 | 50.0% | 17.9%(+32.1)#55 | 11.4%(+38.6)#285 |
| 56. | 92661 | 49.9% | 17.9%(+32.0)#56 | 11.4%(+38.5)#288 |
| 57. | 94087 | 49.5% | 17.9%(+31.6)#57 | 11.4%(+38.1)#294 |
| 58. | 95135 | 49.5% | 17.9%(+31.6)#58 | 11.4%(+38.1)#295 |
| 59. | 92657 | 49.5% | 17.9%(+31.6)#59 | 11.4%(+38.1)#298 |
| 60. | 94131 | 49.4% | 17.9%(+31.5)#60 | 11.4%(+38.0)#299 |
| 61. | 94556 | 49.1% | 17.9%(+31.2)#61 | 11.4%(+37.7)#305 |
| 62. | 94568 | 48.2% | 17.9%(+30.3)#62 | 11.4%(+36.8)#320 |
| 63. | 94002 | 48.0% | 17.9%(+30.1)#63 | 11.4%(+36.6)#326 |
| 64. | 95138 | 47.8% | 17.9%(+29.9)#64 | 11.4%(+36.4)#334 |
| 65. | 94158 | 47.7% | 17.9%(+29.8)#65 | 11.4%(+36.3)#335 |
| 66. | 95032 | 47.6% | 17.9%(+29.7)#66 | 11.4%(+36.2)#336 |
| 67. | 94114 | 47.5% | 17.9%(+29.6)#67 | 11.4%(+36.1)#338 |
| 68. | 94707 | 47.5% | 17.9%(+29.6)#68 | 11.4%(+36.1)#341 |
| 69. | 92130 | 47.4% | 17.9%(+29.5)#69 | 11.4%(+36.0)#342 |
| 70. | 95054 | 47.2% | 17.9%(+29.3)#70 | 11.4%(+35.8)#346 |
| 71. | 94973 | 47.2% | 17.9%(+29.3)#71 | 11.4%(+35.8)#348 |
| 72. | 94010 | 47.1% | 17.9%(+29.2)#72 | 11.4%(+35.7)#349 |
| 73. | 90266 | 47.1% | 17.9%(+29.2)#73 | 11.4%(+35.7)#350 |
| 74. | 92861 | 46.8% | 17.9%(+28.9)#74 | 11.4%(+35.4)#363 |
| 75. | 94402 | 46.7% | 17.9%(+28.8)#75 | 11.4%(+35.3)#365 |
| 76. | 94117 | 46.5% | 17.9%(+28.6)#76 | 11.4%(+35.1)#370 |
| 77. | 92603 | 46.3% | 17.9%(+28.4)#77 | 11.4%(+34.9)#377 |
| 78. | 94037 | 46.1% | 17.9%(+28.2)#78 | 11.4%(+34.7)#387 |
| 79. | 94566 | 45.9% | 17.9%(+28.0)#79 | 11.4%(+34.5)#391 |
| 80. | 90265 | 45.9% | 17.9%(+28.0)#80 | 11.4%(+34.5)#392 |
| 81. | 90402 | 45.9% | 17.9%(+28.0)#81 | 11.4%(+34.5)#393 |
| 82. | 95007 | 45.8% | 17.9%(+27.9)#82 | 11.4%(+34.4)#399 |
| 83. | 91210 | 45.7% | 17.9%(+27.8)#83 | 11.4%(+34.3)#403 |
| 84. | 94107 | 45.5% | 17.9%(+27.6)#84 | 11.4%(+34.1)#407 |
| 85. | 95134 | 45.3% | 17.9%(+27.4)#85 | 11.4%(+33.9)#416 |
| 86. | 94598 | 45.3% | 17.9%(+27.4)#86 | 11.4%(+33.9)#417 |
| 87. | 95139 | 45.2% | 17.9%(+27.3)#87 | 11.4%(+33.8)#422 |
| 88. | 94404 | 45.0% | 17.9%(+27.1)#88 | 11.4%(+33.6)#425 |
| 89. | 94583 | 44.9% | 17.9%(+27.0)#89 | 11.4%(+33.5)#429 |
| 90. | 92694 | 44.9% | 17.9%(+27.0)#90 | 11.4%(+33.5)#430 |
| 91. | 94586 | 44.9% | 17.9%(+27.0)#91 | 11.4%(+33.5)#436 |
| 92. | 94043 | 44.7% | 17.9%(+26.8)#92 | 11.4%(+33.3)#441 |
| 93. | 95746 | 44.4% | 17.9%(+26.5)#93 | 11.4%(+33.0)#447 |
| 94. | 95124 | 44.3% | 17.9%(+26.4)#94 | 11.4%(+32.9)#452 |
| 95. | 94588 | 44.1% | 17.9%(+26.2)#95 | 11.4%(+32.7)#456 |
| 96. | 94939 | 44.1% | 17.9%(+26.2)#96 | 11.4%(+32.7)#458 |
| 97. | 95129 | 43.9% | 17.9%(+26.0)#97 | 11.4%(+32.5)#462 |
| 98. | 94960 | 43.8% | 17.9%(+25.9)#98 | 11.4%(+32.4)#464 |
| 99. | 92384 | 43.8% | 17.9%(+25.9)#99 | 11.4%(+32.4)#468 |
| 100. | 91302 | 43.7% | 17.9%(+25.8)#100 | 11.4%(+32.3)#469 |
Common Questions
What are the Top 10 Zip Codes with the Highest Percentage of Households with Income Above $200,000 in California?
Top 10 Zip Codes with the Highest Percentage of Households with Income Above $200,000 in California are:
What zip code has the Highest Percentage of Households with Income Above $200,000 in California?
93943 has the Highest Percentage of Households with Income Above $200,000 in California with 100.0%.
What is the Percentage of Households with Income Above $200,000 in the State of California?
Percentage of Households with Income Above $200,000 in California is 17.9%.
What is the Percentage of Households with Income Above $200,000 in the United States?
Percentage of Households with Income Above $200,000 in the United States is 11.4%.