Zip Codes with the Highest Percentage of Households with Income Above $200,000 in Arizona
RELATED REPORTS & OPTIONS
Household Income | $200k+
Arizona
Compare Zip Codes
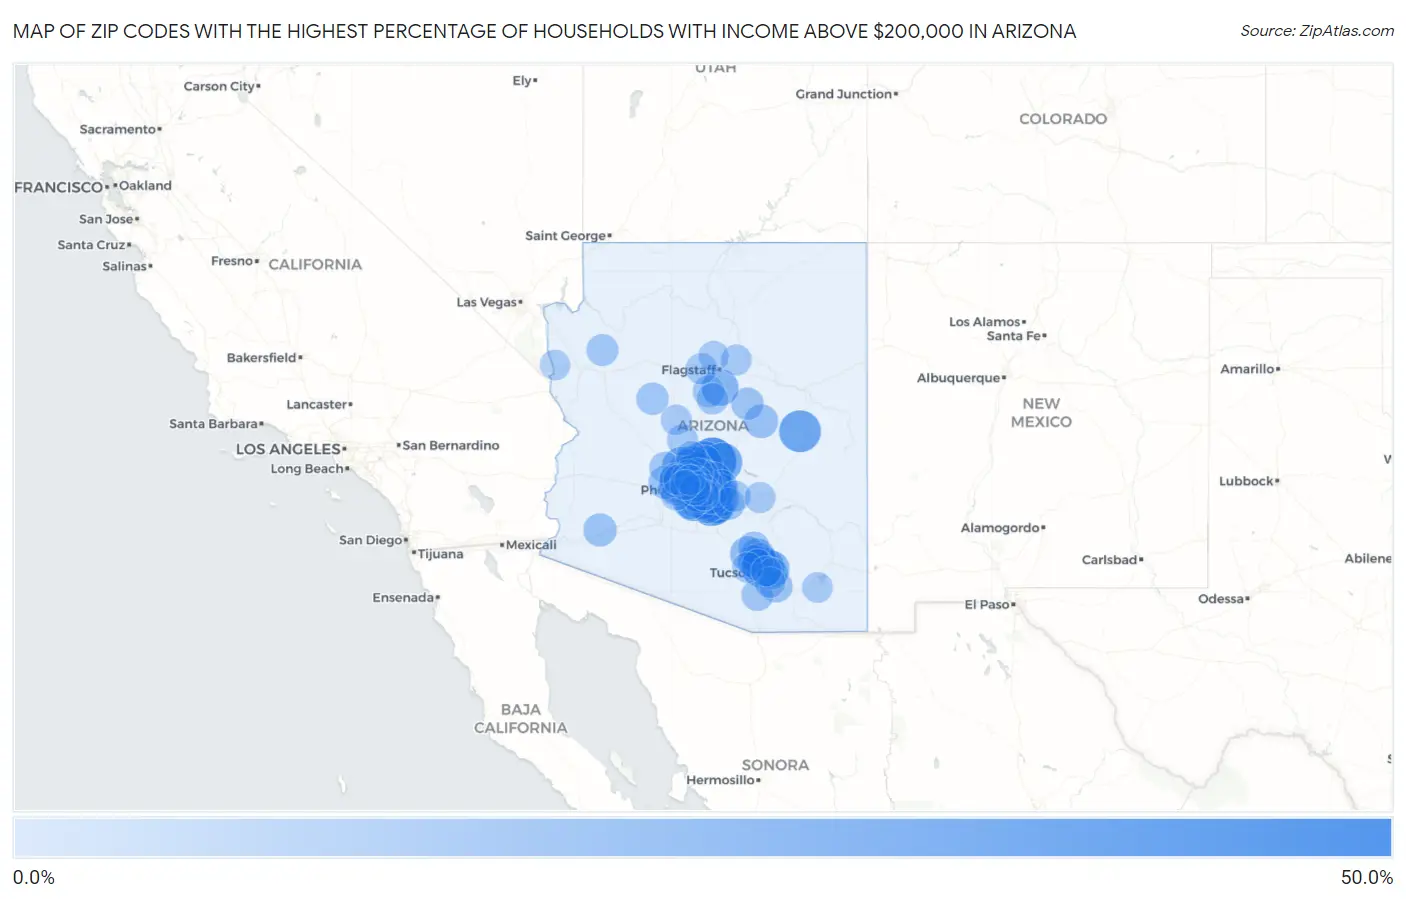
Map of Zip Codes with the Highest Percentage of Households with Income Above $200,000 in Arizona
0.0%
50.0%
Zip Codes with the Highest Percentage of Households with Income Above $200,000 in Arizona
| Zip Code | Households with Income > $200k | vs State | vs National | |
| 1. | 85253 | 46.2% | 9.2%(+37.0)#1 | 11.4%(+34.8)#382 |
| 2. | 85262 | 41.9% | 9.2%(+32.7)#2 | 11.4%(+30.5)#555 |
| 3. | 85266 | 36.9% | 9.2%(+27.7)#3 | 11.4%(+25.5)#844 |
| 4. | 85255 | 34.8% | 9.2%(+25.6)#4 | 11.4%(+23.4)#994 |
| 5. | 85259 | 33.2% | 9.2%(+24.0)#5 | 11.4%(+21.8)#1,142 |
| 6. | 85249 | 31.5% | 9.2%(+22.3)#6 | 11.4%(+20.1)#1,292 |
| 7. | 85045 | 31.3% | 9.2%(+22.1)#7 | 11.4%(+19.9)#1,318 |
| 8. | 85934 | 30.8% | 9.2%(+21.6)#8 | 11.4%(+19.4)#1,373 |
| 9. | 85284 | 29.9% | 9.2%(+20.7)#9 | 11.4%(+18.5)#1,469 |
| 10. | 85083 | 29.2% | 9.2%(+20.0)#10 | 11.4%(+17.8)#1,555 |
| 11. | 85050 | 28.3% | 9.2%(+19.1)#11 | 11.4%(+16.9)#1,679 |
| 12. | 85331 | 28.2% | 9.2%(+19.0)#12 | 11.4%(+16.8)#1,689 |
| 13. | 85298 | 27.2% | 9.2%(+18.0)#13 | 11.4%(+15.8)#1,838 |
| 14. | 85718 | 27.2% | 9.2%(+18.0)#14 | 11.4%(+15.8)#1,839 |
| 15. | 85263 | 26.3% | 9.2%(+17.1)#15 | 11.4%(+14.9)#1,987 |
| 16. | 85258 | 25.2% | 9.2%(+16.0)#16 | 11.4%(+13.8)#2,147 |
| 17. | 85750 | 25.2% | 9.2%(+16.0)#17 | 11.4%(+13.8)#2,148 |
| 18. | 85383 | 24.3% | 9.2%(+15.1)#18 | 11.4%(+12.9)#2,309 |
| 19. | 85254 | 23.7% | 9.2%(+14.5)#19 | 11.4%(+12.3)#2,423 |
| 20. | 85048 | 23.5% | 9.2%(+14.3)#20 | 11.4%(+12.1)#2,461 |
| 21. | 85018 | 22.5% | 9.2%(+13.3)#21 | 11.4%(+11.1)#2,678 |
| 22. | 85377 | 22.1% | 9.2%(+12.9)#22 | 11.4%(+10.7)#2,760 |
| 23. | 85297 | 22.0% | 9.2%(+12.8)#23 | 11.4%(+10.6)#2,772 |
| 24. | 85310 | 21.8% | 9.2%(+12.6)#24 | 11.4%(+10.4)#2,825 |
| 25. | 85286 | 21.6% | 9.2%(+12.4)#25 | 11.4%(+10.2)#2,863 |
| 26. | 86017 | 21.5% | 9.2%(+12.3)#26 | 11.4%(+10.1)#2,890 |
| 27. | 85028 | 21.4% | 9.2%(+12.2)#27 | 11.4%(+10.00)#2,905 |
| 28. | 85085 | 20.9% | 9.2%(+11.7)#28 | 11.4%(+9.50)#3,053 |
| 29. | 85749 | 20.7% | 9.2%(+11.5)#29 | 11.4%(+9.30)#3,112 |
| 30. | 85260 | 20.5% | 9.2%(+11.3)#30 | 11.4%(+9.10)#3,152 |
| 31. | 85012 | 20.0% | 9.2%(+10.8)#31 | 11.4%(+8.60)#3,287 |
| 32. | 85295 | 19.8% | 9.2%(+10.6)#32 | 11.4%(+8.40)#3,340 |
| 33. | 85268 | 19.1% | 9.2%(+9.90)#33 | 11.4%(+7.70)#3,537 |
| 34. | 85086 | 18.8% | 9.2%(+9.60)#34 | 11.4%(+7.40)#3,609 |
| 35. | 85395 | 18.8% | 9.2%(+9.60)#35 | 11.4%(+7.40)#3,610 |
| 36. | 85212 | 17.8% | 9.2%(+8.60)#36 | 11.4%(+6.40)#3,898 |
| 37. | 85755 | 17.7% | 9.2%(+8.50)#37 | 11.4%(+6.30)#3,941 |
| 38. | 85234 | 17.1% | 9.2%(+7.90)#38 | 11.4%(+5.70)#4,139 |
| 39. | 85658 | 17.1% | 9.2%(+7.90)#39 | 11.4%(+5.70)#4,152 |
| 40. | 85142 | 16.6% | 9.2%(+7.40)#40 | 11.4%(+5.20)#4,319 |
| 41. | 85296 | 16.5% | 9.2%(+7.30)#41 | 11.4%(+5.10)#4,361 |
| 42. | 85226 | 15.9% | 9.2%(+6.70)#42 | 11.4%(+4.50)#4,597 |
| 43. | 85248 | 15.6% | 9.2%(+6.40)#43 | 11.4%(+4.20)#4,715 |
| 44. | 85737 | 15.5% | 9.2%(+6.30)#44 | 11.4%(+4.10)#4,761 |
| 45. | 85207 | 15.3% | 9.2%(+6.10)#45 | 11.4%(+3.90)#4,838 |
| 46. | 85931 | 15.2% | 9.2%(+6.00)#46 | 11.4%(+3.80)#4,924 |
| 47. | 85213 | 14.9% | 9.2%(+5.70)#47 | 11.4%(+3.50)#5,025 |
| 48. | 85016 | 14.6% | 9.2%(+5.40)#48 | 11.4%(+3.20)#5,174 |
| 49. | 85251 | 14.3% | 9.2%(+5.10)#49 | 11.4%(+2.90)#5,296 |
| 50. | 85347 | 14.2% | 9.2%(+5.00)#50 | 11.4%(+2.80)#5,391 |
| 51. | 85340 | 14.0% | 9.2%(+4.80)#51 | 11.4%(+2.60)#5,462 |
| 52. | 85396 | 14.0% | 9.2%(+4.80)#52 | 11.4%(+2.60)#5,464 |
| 53. | 85215 | 13.5% | 9.2%(+4.30)#53 | 11.4%(+2.10)#5,743 |
| 54. | 85250 | 13.5% | 9.2%(+4.30)#54 | 11.4%(+2.10)#5,746 |
| 55. | 85233 | 13.4% | 9.2%(+4.20)#55 | 11.4%(+2.00)#5,782 |
| 56. | 85004 | 13.3% | 9.2%(+4.10)#56 | 11.4%(+1.90)#5,853 |
| 57. | 85742 | 13.2% | 9.2%(+4.00)#57 | 11.4%(+1.80)#5,900 |
| 58. | 85641 | 13.0% | 9.2%(+3.80)#58 | 11.4%(+1.60)#6,006 |
| 59. | 86024 | 13.0% | 9.2%(+3.80)#59 | 11.4%(+1.60)#6,052 |
| 60. | 85044 | 12.8% | 9.2%(+3.60)#60 | 11.4%(+1.40)#6,120 |
| 61. | 86305 | 12.7% | 9.2%(+3.50)#61 | 11.4%(+1.30)#6,206 |
| 62. | 85355 | 12.4% | 9.2%(+3.20)#62 | 11.4%(+1.000)#6,415 |
| 63. | 85054 | 12.3% | 9.2%(+3.10)#63 | 11.4%(+0.900)#6,484 |
| 64. | 85629 | 11.8% | 9.2%(+2.60)#64 | 11.4%(+0.400)#6,798 |
| 65. | 85140 | 11.7% | 9.2%(+2.50)#65 | 11.4%(+0.300)#6,846 |
| 66. | 86336 | 11.7% | 9.2%(+2.50)#66 | 11.4%(+0.300)#6,873 |
| 67. | 86411 | 11.7% | 9.2%(+2.50)#67 | 11.4%(+0.300)#6,913 |
| 68. | 85739 | 11.4% | 9.2%(+2.20)#68 | 11.4%(=0.000)#7,089 |
| 69. | 85704 | 11.3% | 9.2%(+2.10)#69 | 11.4%(-0.100)#7,151 |
| 70. | 86351 | 11.0% | 9.2%(+1.80)#70 | 11.4%(-0.400)#7,432 |
| 71. | 85024 | 10.9% | 9.2%(+1.70)#71 | 11.4%(-0.500)#7,485 |
| 72. | 85748 | 10.9% | 9.2%(+1.70)#72 | 11.4%(-0.500)#7,487 |
| 73. | 85361 | 10.8% | 9.2%(+1.60)#73 | 11.4%(-0.600)#7,554 |
| 74. | 85308 | 10.6% | 9.2%(+1.40)#74 | 11.4%(-0.800)#7,692 |
| 75. | 85042 | 10.6% | 9.2%(+1.40)#75 | 11.4%(-0.800)#7,694 |
| 76. | 85257 | 10.6% | 9.2%(+1.40)#76 | 11.4%(-0.800)#7,698 |
| 77. | 85339 | 10.4% | 9.2%(+1.20)#77 | 11.4%(-1.000)#7,861 |
| 78. | 85020 | 10.4% | 9.2%(+1.20)#78 | 11.4%(-1.000)#7,867 |
| 79. | 86343 | 10.4% | 9.2%(+1.20)#79 | 11.4%(-1.000)#7,939 |
| 80. | 85283 | 10.3% | 9.2%(+1.10)#80 | 11.4%(-1.10)#7,944 |
| 81. | 86018 | 10.3% | 9.2%(+1.10)#81 | 11.4%(-1.10)#8,018 |
| 82. | 85388 | 10.2% | 9.2%(+1.000)#82 | 11.4%(-1.20)#8,053 |
| 83. | 85118 | 10.2% | 9.2%(+1.000)#83 | 11.4%(-1.20)#8,069 |
| 84. | 85747 | 10.1% | 9.2%(+0.900)#84 | 11.4%(-1.30)#8,145 |
| 85. | 85381 | 10.0% | 9.2%(+0.800)#85 | 11.4%(-1.40)#8,250 |
| 86. | 86004 | 9.9% | 9.2%(+0.700)#86 | 11.4%(-1.50)#8,346 |
| 87. | 85013 | 9.9% | 9.2%(+0.700)#87 | 11.4%(-1.50)#8,357 |
| 88. | 85539 | 9.9% | 9.2%(+0.700)#88 | 11.4%(-1.50)#8,389 |
| 89. | 85338 | 9.8% | 9.2%(+0.600)#89 | 11.4%(-1.60)#8,428 |
| 90. | 86303 | 9.7% | 9.2%(+0.500)#90 | 11.4%(-1.70)#8,563 |
| 91. | 85379 | 9.6% | 9.2%(+0.400)#91 | 11.4%(-1.80)#8,621 |
| 92. | 85003 | 9.3% | 9.2%(+0.100)#92 | 11.4%(-2.10)#8,953 |
| 93. | 85743 | 9.2% | 9.2%(=0.000)#93 | 11.4%(-2.20)#9,037 |
| 94. | 85606 | 9.2% | 9.2%(=0.000)#94 | 11.4%(-2.20)#9,098 |
| 95. | 86001 | 9.1% | 9.2%(-0.100)#95 | 11.4%(-2.30)#9,127 |
| 96. | 85087 | 9.1% | 9.2%(-0.100)#96 | 11.4%(-2.30)#9,153 |
| 97. | 85304 | 8.9% | 9.2%(-0.300)#97 | 11.4%(-2.50)#9,318 |
| 98. | 86429 | 8.9% | 9.2%(-0.300)#98 | 11.4%(-2.50)#9,339 |
| 99. | 85715 | 8.8% | 9.2%(-0.400)#99 | 11.4%(-2.60)#9,436 |
| 100. | 85305 | 8.7% | 9.2%(-0.500)#100 | 11.4%(-2.70)#9,546 |
Common Questions
What are the Top 10 Zip Codes with the Highest Percentage of Households with Income Above $200,000 in Arizona?
Top 10 Zip Codes with the Highest Percentage of Households with Income Above $200,000 in Arizona are:
What zip code has the Highest Percentage of Households with Income Above $200,000 in Arizona?
85253 has the Highest Percentage of Households with Income Above $200,000 in Arizona with 46.2%.
What is the Percentage of Households with Income Above $200,000 in the State of Arizona?
Percentage of Households with Income Above $200,000 in Arizona is 9.2%.
What is the Percentage of Households with Income Above $200,000 in the United States?
Percentage of Households with Income Above $200,000 in the United States is 11.4%.