Zip Codes with the Highest Percentage of Households with Income Above $200,000 in Montana
RELATED REPORTS & OPTIONS
Household Income | $200k+
Montana
Compare Zip Codes
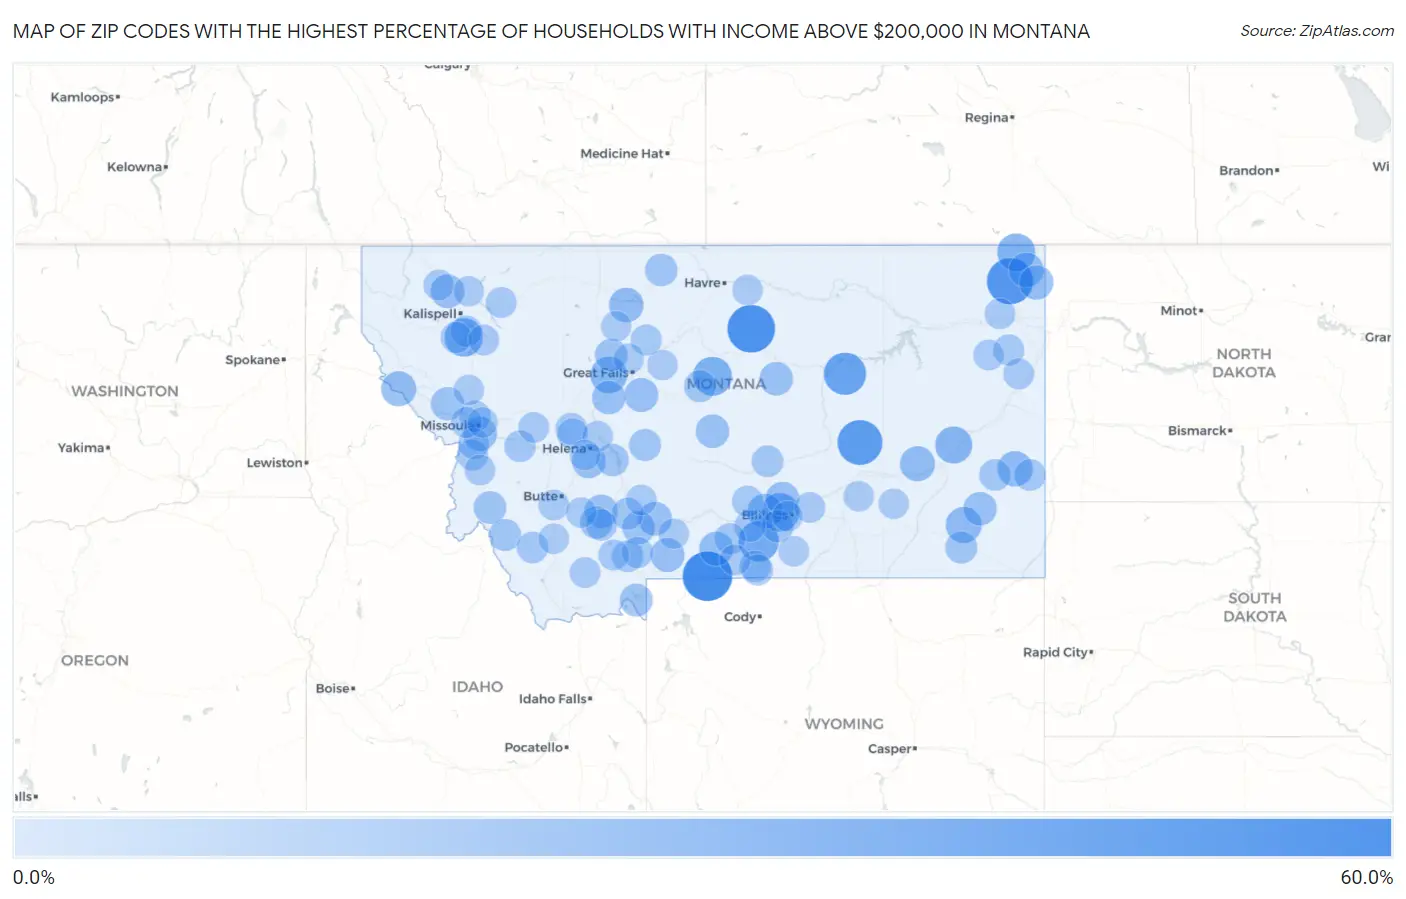
Map of Zip Codes with the Highest Percentage of Households with Income Above $200,000 in Montana
0.0%
60.0%
Zip Codes with the Highest Percentage of Households with Income Above $200,000 in Montana
| Zip Code | Households with Income > $200k | vs State | vs National | |
| 1. | 59081 | 50.9% | 7.2%(+43.7)#1 | 11.4%(+39.5)#257 |
| 2. | 59535 | 46.7% | 7.2%(+39.5)#2 | 11.4%(+35.3)#367 |
| 3. | 59258 | 43.0% | 7.2%(+35.8)#3 | 11.4%(+31.6)#507 |
| 4. | 59039 | 40.0% | 7.2%(+32.8)#4 | 11.4%(+28.6)#651 |
| 5. | 59318 | 34.0% | 7.2%(+26.8)#5 | 11.4%(+22.6)#1,071 |
| 6. | 59013 | 30.0% | 7.2%(+22.8)#6 | 11.4%(+18.6)#1,458 |
| 7. | 59430 | 26.8% | 7.2%(+19.6)#7 | 11.4%(+15.4)#1,912 |
| 8. | 59106 | 25.9% | 7.2%(+18.7)#8 | 11.4%(+14.5)#2,042 |
| 9. | 59931 | 25.0% | 7.2%(+17.8)#9 | 11.4%(+13.6)#2,200 |
| 10. | 59256 | 24.4% | 7.2%(+17.2)#10 | 11.4%(+13.0)#2,308 |
| 11. | 59338 | 22.4% | 7.2%(+15.2)#11 | 11.4%(+11.0)#2,711 |
| 12. | 59483 | 21.5% | 7.2%(+14.3)#12 | 11.4%(+10.1)#2,893 |
| 13. | 59343 | 20.0% | 7.2%(+12.8)#13 | 11.4%(+8.60)#3,296 |
| 14. | 59344 | 18.4% | 7.2%(+11.2)#14 | 11.4%(+7.00)#3,739 |
| 15. | 59347 | 17.9% | 7.2%(+10.7)#15 | 11.4%(+6.50)#3,893 |
| 16. | 59842 | 17.9% | 7.2%(+10.7)#16 | 11.4%(+6.50)#3,895 |
| 17. | 59057 | 17.5% | 7.2%(+10.3)#17 | 11.4%(+6.10)#4,030 |
| 18. | 59211 | 17.0% | 7.2%(+9.80)#18 | 11.4%(+5.60)#4,207 |
| 19. | 59456 | 16.7% | 7.2%(+9.50)#19 | 11.4%(+5.30)#4,312 |
| 20. | 59061 | 16.1% | 7.2%(+8.90)#20 | 11.4%(+4.70)#4,548 |
| 21. | 59219 | 16.1% | 7.2%(+8.90)#21 | 11.4%(+4.70)#4,549 |
| 22. | 59803 | 15.5% | 7.2%(+8.30)#22 | 11.4%(+4.10)#4,765 |
| 23. | 59065 | 15.4% | 7.2%(+8.20)#23 | 11.4%(+4.00)#4,832 |
| 24. | 59715 | 15.3% | 7.2%(+8.10)#24 | 11.4%(+3.90)#4,842 |
| 25. | 59480 | 15.3% | 7.2%(+8.10)#25 | 11.4%(+3.90)#4,875 |
| 26. | 59634 | 15.1% | 7.2%(+7.90)#26 | 11.4%(+3.70)#4,952 |
| 27. | 59937 | 15.0% | 7.2%(+7.80)#27 | 11.4%(+3.60)#4,986 |
| 28. | 59002 | 14.9% | 7.2%(+7.70)#28 | 11.4%(+3.50)#5,066 |
| 29. | 59471 | 14.5% | 7.2%(+7.30)#29 | 11.4%(+3.10)#5,241 |
| 30. | 59421 | 14.3% | 7.2%(+7.10)#30 | 11.4%(+2.90)#5,327 |
| 31. | 59418 | 14.3% | 7.2%(+7.10)#31 | 11.4%(+2.90)#5,339 |
| 32. | 59345 | 14.3% | 7.2%(+7.10)#32 | 11.4%(+2.90)#5,341 |
| 33. | 59721 | 14.1% | 7.2%(+6.90)#33 | 11.4%(+2.70)#5,448 |
| 34. | 59846 | 14.0% | 7.2%(+6.80)#34 | 11.4%(+2.60)#5,492 |
| 35. | 59718 | 13.2% | 7.2%(+6.00)#35 | 11.4%(+1.80)#5,892 |
| 36. | 59758 | 12.9% | 7.2%(+5.70)#36 | 11.4%(+1.50)#6,106 |
| 37. | 59747 | 12.5% | 7.2%(+5.30)#37 | 11.4%(+1.10)#6,391 |
| 38. | 59468 | 12.4% | 7.2%(+5.20)#38 | 11.4%(+1.000)#6,448 |
| 39. | 59871 | 12.3% | 7.2%(+5.10)#39 | 11.4%(+0.900)#6,520 |
| 40. | 59647 | 12.2% | 7.2%(+5.00)#40 | 11.4%(+0.800)#6,578 |
| 41. | 59531 | 12.1% | 7.2%(+4.90)#41 | 11.4%(+0.700)#6,645 |
| 42. | 59044 | 11.2% | 7.2%(+4.00)#42 | 11.4%(-0.200)#7,241 |
| 43. | 59645 | 11.2% | 7.2%(+4.00)#43 | 11.4%(-0.200)#7,272 |
| 44. | 59317 | 11.2% | 7.2%(+4.00)#44 | 11.4%(-0.200)#7,281 |
| 45. | 59424 | 11.1% | 7.2%(+3.90)#45 | 11.4%(-0.300)#7,380 |
| 46. | 59761 | 11.0% | 7.2%(+3.80)#46 | 11.4%(-0.400)#7,467 |
| 47. | 59741 | 10.8% | 7.2%(+3.60)#47 | 11.4%(-0.600)#7,560 |
| 48. | 59046 | 10.5% | 7.2%(+3.30)#48 | 11.4%(-0.900)#7,843 |
| 49. | 59716 | 10.3% | 7.2%(+3.10)#49 | 11.4%(-1.10)#8,007 |
| 50. | 59336 | 10.3% | 7.2%(+3.10)#50 | 11.4%(-1.10)#8,030 |
| 51. | 59313 | 10.2% | 7.2%(+3.00)#51 | 11.4%(-1.20)#8,099 |
| 52. | 59746 | 10.2% | 7.2%(+3.00)#52 | 11.4%(-1.20)#8,125 |
| 53. | 59019 | 10.1% | 7.2%(+2.90)#53 | 11.4%(-1.30)#8,182 |
| 54. | 59633 | 10.1% | 7.2%(+2.90)#54 | 11.4%(-1.30)#8,223 |
| 55. | 59832 | 10.0% | 7.2%(+2.80)#55 | 11.4%(-1.40)#8,316 |
| 56. | 59922 | 9.8% | 7.2%(+2.60)#56 | 11.4%(-1.60)#8,492 |
| 57. | 59001 | 9.7% | 7.2%(+2.50)#57 | 11.4%(-1.70)#8,598 |
| 58. | 59007 | 9.6% | 7.2%(+2.40)#58 | 11.4%(-1.80)#8,704 |
| 59. | 59870 | 9.5% | 7.2%(+2.30)#59 | 11.4%(-1.90)#8,744 |
| 60. | 59735 | 9.5% | 7.2%(+2.30)#60 | 11.4%(-1.90)#8,808 |
| 61. | 59929 | 9.5% | 7.2%(+2.30)#61 | 11.4%(-1.90)#8,812 |
| 62. | 59808 | 9.4% | 7.2%(+2.20)#62 | 11.4%(-2.00)#8,851 |
| 63. | 59730 | 9.3% | 7.2%(+2.10)#63 | 11.4%(-2.10)#8,980 |
| 64. | 59243 | 9.1% | 7.2%(+1.90)#64 | 11.4%(-2.30)#9,191 |
| 65. | 59008 | 9.1% | 7.2%(+1.90)#65 | 11.4%(-2.30)#9,192 |
| 66. | 59067 | 9.1% | 7.2%(+1.90)#66 | 11.4%(-2.30)#9,199 |
| 67. | 59833 | 9.0% | 7.2%(+1.80)#67 | 11.4%(-2.40)#9,250 |
| 68. | 59420 | 8.9% | 7.2%(+1.70)#68 | 11.4%(-2.50)#9,403 |
| 69. | 59068 | 8.7% | 7.2%(+1.50)#69 | 11.4%(-2.70)#9,579 |
| 70. | 59262 | 8.7% | 7.2%(+1.50)#70 | 11.4%(-2.70)#9,611 |
| 71. | 59916 | 8.6% | 7.2%(+1.40)#71 | 11.4%(-2.80)#9,736 |
| 72. | 59640 | 8.6% | 7.2%(+1.40)#72 | 11.4%(-2.80)#9,740 |
| 73. | 59804 | 8.4% | 7.2%(+1.20)#73 | 11.4%(-3.00)#9,903 |
| 74. | 59729 | 8.4% | 7.2%(+1.20)#74 | 11.4%(-3.00)#9,930 |
| 75. | 59602 | 8.3% | 7.2%(+1.10)#75 | 11.4%(-3.10)#9,999 |
| 76. | 59911 | 8.3% | 7.2%(+1.10)#76 | 11.4%(-3.10)#10,027 |
| 77. | 59828 | 8.3% | 7.2%(+1.10)#77 | 11.4%(-3.10)#10,036 |
| 78. | 59927 | 8.2% | 7.2%(+1.000)#78 | 11.4%(-3.20)#10,198 |
| 79. | 59714 | 8.1% | 7.2%(+0.900)#79 | 11.4%(-3.30)#10,244 |
| 80. | 59750 | 8.1% | 7.2%(+0.900)#80 | 11.4%(-3.30)#10,330 |
| 81. | 59843 | 8.1% | 7.2%(+0.900)#81 | 11.4%(-3.30)#10,334 |
| 82. | 59710 | 8.1% | 7.2%(+0.900)#82 | 11.4%(-3.30)#10,336 |
| 83. | 59037 | 8.0% | 7.2%(+0.800)#83 | 11.4%(-3.40)#10,431 |
| 84. | 59213 | 8.0% | 7.2%(+0.800)#84 | 11.4%(-3.40)#10,448 |
| 85. | 59259 | 8.0% | 7.2%(+0.800)#85 | 11.4%(-3.40)#10,459 |
| 86. | 59601 | 7.9% | 7.2%(+0.700)#86 | 11.4%(-3.50)#10,493 |
| 87. | 59404 | 7.9% | 7.2%(+0.700)#87 | 11.4%(-3.50)#10,499 |
| 88. | 59066 | 7.9% | 7.2%(+0.700)#88 | 11.4%(-3.50)#10,581 |
| 89. | 59863 | 7.9% | 7.2%(+0.700)#89 | 11.4%(-3.50)#10,601 |
| 90. | 59759 | 7.8% | 7.2%(+0.600)#90 | 11.4%(-3.60)#10,674 |
| 91. | 59732 | 7.8% | 7.2%(+0.600)#91 | 11.4%(-3.60)#10,729 |
| 92. | 59010 | 7.8% | 7.2%(+0.600)#92 | 11.4%(-3.60)#10,733 |
| 93. | 59802 | 7.7% | 7.2%(+0.500)#93 | 11.4%(-3.70)#10,775 |
| 94. | 59047 | 7.7% | 7.2%(+0.500)#94 | 11.4%(-3.70)#10,786 |
| 95. | 59523 | 7.7% | 7.2%(+0.500)#95 | 11.4%(-3.70)#10,829 |
| 96. | 59102 | 7.6% | 7.2%(+0.400)#96 | 11.4%(-3.80)#10,894 |
| 97. | 59912 | 7.5% | 7.2%(+0.300)#97 | 11.4%(-3.90)#11,063 |
| 98. | 59323 | 7.5% | 7.2%(+0.300)#98 | 11.4%(-3.90)#11,106 |
| 99. | 59450 | 7.5% | 7.2%(+0.300)#99 | 11.4%(-3.90)#11,154 |
| 100. | 59416 | 7.5% | 7.2%(+0.300)#100 | 11.4%(-3.90)#11,160 |
Common Questions
What are the Top 10 Zip Codes with the Highest Percentage of Households with Income Above $200,000 in Montana?
Top 10 Zip Codes with the Highest Percentage of Households with Income Above $200,000 in Montana are:
What zip code has the Highest Percentage of Households with Income Above $200,000 in Montana?
59081 has the Highest Percentage of Households with Income Above $200,000 in Montana with 50.9%.
What is the Percentage of Households with Income Above $200,000 in the State of Montana?
Percentage of Households with Income Above $200,000 in Montana is 7.2%.
What is the Percentage of Households with Income Above $200,000 in the United States?
Percentage of Households with Income Above $200,000 in the United States is 11.4%.