Zip Codes with the Highest Percentage of Households with Income Above $200,000 in Florida
RELATED REPORTS & OPTIONS
Household Income | $200k+
Florida
Compare Zip Codes
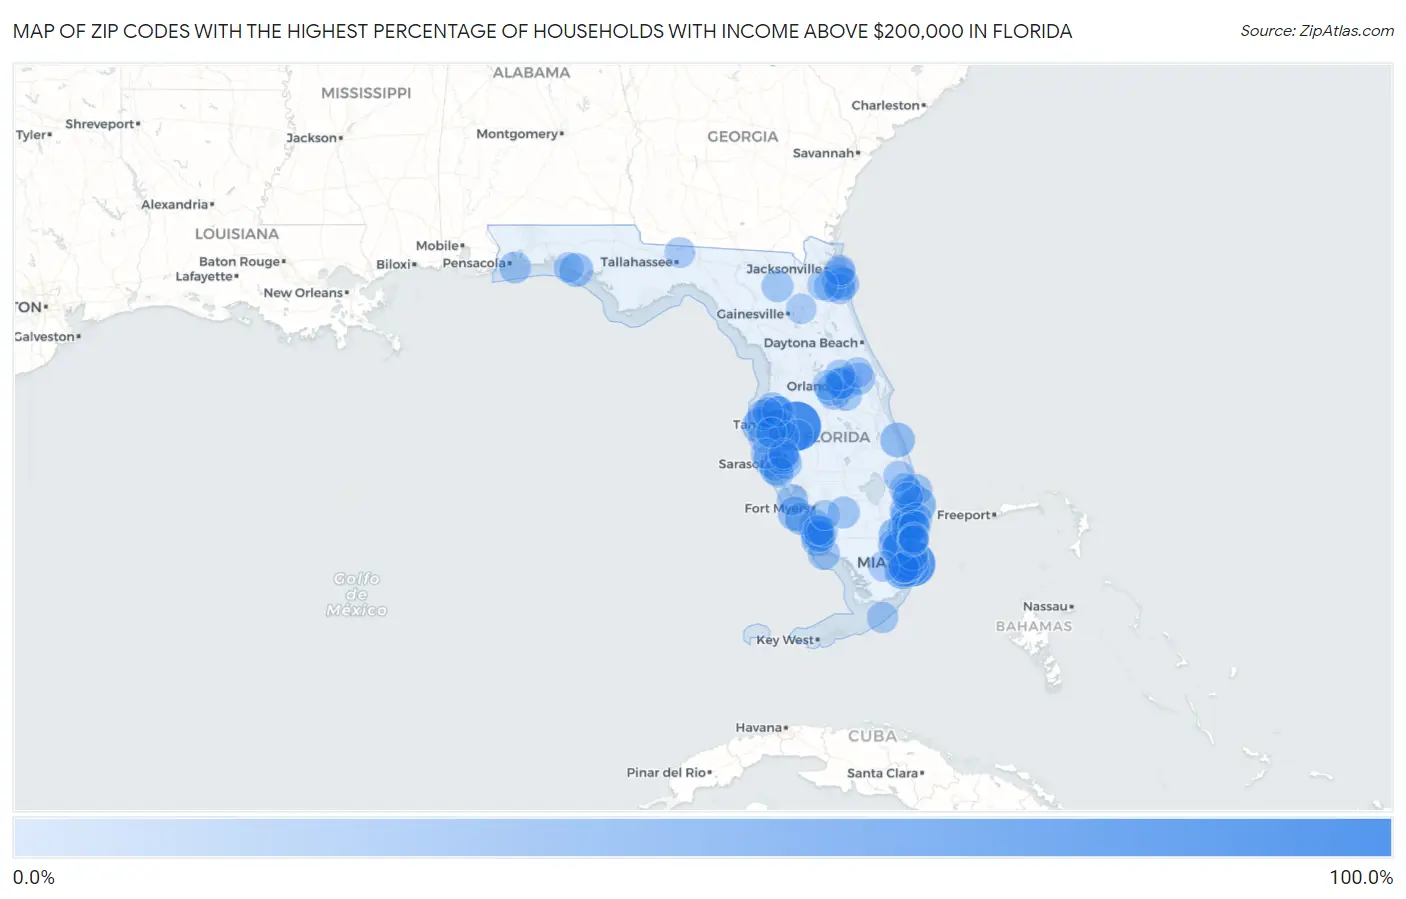
Map of Zip Codes with the Highest Percentage of Households with Income Above $200,000 in Florida
0.0%
100.0%
Zip Codes with the Highest Percentage of Households with Income Above $200,000 in Florida
| Zip Code | Households with Income > $200k | vs State | vs National | |
| 1. | 33530 | 100.0% | 9.0%(+91.0)#1 | 11.4%(+88.6)#23 |
| 2. | 33109 | 83.5% | 9.0%(+74.5)#2 | 11.4%(+72.1)#34 |
| 3. | 33149 | 47.0% | 9.0%(+38.0)#3 | 11.4%(+35.6)#359 |
| 4. | 33480 | 45.7% | 9.0%(+36.7)#4 | 11.4%(+34.3)#401 |
| 5. | 33158 | 43.1% | 9.0%(+34.1)#5 | 11.4%(+31.7)#502 |
| 6. | 33327 | 39.1% | 9.0%(+30.1)#6 | 11.4%(+27.7)#698 |
| 7. | 33629 | 38.7% | 9.0%(+29.7)#7 | 11.4%(+27.3)#728 |
| 8. | 33473 | 38.6% | 9.0%(+29.6)#8 | 11.4%(+27.2)#736 |
| 9. | 33076 | 38.5% | 9.0%(+29.5)#9 | 11.4%(+27.1)#740 |
| 10. | 32963 | 37.6% | 9.0%(+28.6)#10 | 11.4%(+26.2)#796 |
| 11. | 33156 | 36.0% | 9.0%(+27.0)#11 | 11.4%(+24.6)#904 |
| 12. | 33924 | 35.0% | 9.0%(+26.0)#12 | 11.4%(+23.6)#982 |
| 13. | 33146 | 34.9% | 9.0%(+25.9)#13 | 11.4%(+23.5)#987 |
| 14. | 32461 | 34.7% | 9.0%(+25.7)#14 | 11.4%(+23.3)#1,003 |
| 15. | 33786 | 34.7% | 9.0%(+25.7)#15 | 11.4%(+23.3)#1,004 |
| 16. | 33332 | 32.7% | 9.0%(+23.7)#16 | 11.4%(+21.3)#1,182 |
| 17. | 32081 | 32.5% | 9.0%(+23.5)#17 | 11.4%(+21.1)#1,205 |
| 18. | 34228 | 32.2% | 9.0%(+23.2)#18 | 11.4%(+20.8)#1,237 |
| 19. | 34242 | 31.7% | 9.0%(+22.7)#19 | 11.4%(+20.3)#1,276 |
| 20. | 32082 | 31.2% | 9.0%(+22.2)#20 | 11.4%(+19.8)#1,328 |
| 21. | 33449 | 31.2% | 9.0%(+22.2)#21 | 11.4%(+19.8)#1,332 |
| 22. | 34134 | 31.1% | 9.0%(+22.1)#22 | 11.4%(+19.7)#1,340 |
| 23. | 33131 | 30.9% | 9.0%(+21.9)#23 | 11.4%(+19.5)#1,359 |
| 24. | 33330 | 30.9% | 9.0%(+21.9)#24 | 11.4%(+19.5)#1,361 |
| 25. | 33556 | 29.9% | 9.0%(+20.9)#25 | 11.4%(+18.5)#1,464 |
| 26. | 33548 | 29.9% | 9.0%(+20.9)#26 | 11.4%(+18.5)#1,471 |
| 27. | 33331 | 29.4% | 9.0%(+20.4)#27 | 11.4%(+18.0)#1,532 |
| 28. | 34102 | 29.4% | 9.0%(+20.4)#28 | 11.4%(+18.0)#1,537 |
| 29. | 34108 | 29.2% | 9.0%(+20.2)#29 | 11.4%(+17.8)#1,558 |
| 30. | 33957 | 29.2% | 9.0%(+20.2)#30 | 11.4%(+17.8)#1,562 |
| 31. | 33418 | 28.5% | 9.0%(+19.5)#31 | 11.4%(+17.1)#1,644 |
| 32. | 34103 | 28.1% | 9.0%(+19.1)#32 | 11.4%(+16.7)#1,708 |
| 33. | 32814 | 27.5% | 9.0%(+18.5)#33 | 11.4%(+16.1)#1,798 |
| 34. | 32766 | 27.2% | 9.0%(+18.2)#34 | 11.4%(+15.8)#1,844 |
| 35. | 34145 | 27.1% | 9.0%(+18.1)#35 | 11.4%(+15.7)#1,862 |
| 36. | 33606 | 27.0% | 9.0%(+18.0)#36 | 11.4%(+15.6)#1,880 |
| 37. | 33477 | 26.8% | 9.0%(+17.8)#37 | 11.4%(+15.4)#1,909 |
| 38. | 32836 | 26.6% | 9.0%(+17.6)#38 | 11.4%(+15.2)#1,933 |
| 39. | 33140 | 26.5% | 9.0%(+17.5)#39 | 11.4%(+15.1)#1,945 |
| 40. | 33930 | 26.5% | 9.0%(+17.5)#40 | 11.4%(+15.1)#1,955 |
| 41. | 33496 | 26.4% | 9.0%(+17.4)#41 | 11.4%(+15.0)#1,966 |
| 42. | 33133 | 26.3% | 9.0%(+17.3)#42 | 11.4%(+14.9)#1,974 |
| 43. | 32061 | 26.3% | 9.0%(+17.3)#43 | 11.4%(+14.9)#1,992 |
| 44. | 34786 | 26.2% | 9.0%(+17.2)#44 | 11.4%(+14.8)#1,994 |
| 45. | 33704 | 26.0% | 9.0%(+17.0)#45 | 11.4%(+14.6)#2,027 |
| 46. | 32561 | 26.0% | 9.0%(+17.0)#46 | 11.4%(+14.6)#2,030 |
| 47. | 33029 | 25.9% | 9.0%(+16.9)#47 | 11.4%(+14.5)#2,037 |
| 48. | 33498 | 25.8% | 9.0%(+16.8)#48 | 11.4%(+14.4)#2,056 |
| 49. | 34236 | 25.7% | 9.0%(+16.7)#49 | 11.4%(+14.3)#2,066 |
| 50. | 33483 | 25.6% | 9.0%(+16.6)#50 | 11.4%(+14.2)#2,086 |
| 51. | 32789 | 25.5% | 9.0%(+16.5)#51 | 11.4%(+14.1)#2,098 |
| 52. | 32259 | 25.4% | 9.0%(+16.4)#52 | 11.4%(+14.0)#2,110 |
| 53. | 33067 | 25.4% | 9.0%(+16.4)#53 | 11.4%(+14.0)#2,115 |
| 54. | 33432 | 24.9% | 9.0%(+15.9)#54 | 11.4%(+13.5)#2,210 |
| 55. | 32827 | 24.6% | 9.0%(+15.6)#55 | 11.4%(+13.2)#2,265 |
| 56. | 34105 | 24.6% | 9.0%(+15.6)#56 | 11.4%(+13.2)#2,267 |
| 57. | 34240 | 24.4% | 9.0%(+15.4)#57 | 11.4%(+13.0)#2,295 |
| 58. | 33626 | 24.3% | 9.0%(+15.3)#58 | 11.4%(+12.9)#2,315 |
| 59. | 33767 | 24.2% | 9.0%(+15.2)#59 | 11.4%(+12.8)#2,338 |
| 60. | 33036 | 24.1% | 9.0%(+15.1)#60 | 11.4%(+12.7)#2,354 |
| 61. | 33921 | 24.0% | 9.0%(+15.0)#61 | 11.4%(+12.6)#2,381 |
| 62. | 32804 | 23.8% | 9.0%(+14.8)#62 | 11.4%(+12.4)#2,408 |
| 63. | 33478 | 23.8% | 9.0%(+14.8)#63 | 11.4%(+12.4)#2,411 |
| 64. | 33547 | 23.6% | 9.0%(+14.6)#64 | 11.4%(+12.2)#2,441 |
| 65. | 34990 | 23.0% | 9.0%(+14.0)#65 | 11.4%(+11.6)#2,552 |
| 66. | 33609 | 22.8% | 9.0%(+13.8)#66 | 11.4%(+11.4)#2,605 |
| 67. | 34202 | 22.7% | 9.0%(+13.7)#67 | 11.4%(+11.3)#2,621 |
| 68. | 34201 | 22.7% | 9.0%(+13.7)#68 | 11.4%(+11.3)#2,636 |
| 69. | 33486 | 22.2% | 9.0%(+13.2)#69 | 11.4%(+10.8)#2,733 |
| 70. | 32095 | 22.1% | 9.0%(+13.1)#70 | 11.4%(+10.7)#2,755 |
| 71. | 33572 | 21.9% | 9.0%(+12.9)#71 | 11.4%(+10.5)#2,799 |
| 72. | 33706 | 21.9% | 9.0%(+12.9)#72 | 11.4%(+10.5)#2,803 |
| 73. | 32732 | 21.8% | 9.0%(+12.8)#73 | 11.4%(+10.4)#2,831 |
| 74. | 33194 | 21.5% | 9.0%(+12.5)#74 | 11.4%(+10.1)#2,888 |
| 75. | 34217 | 21.5% | 9.0%(+12.5)#75 | 11.4%(+10.1)#2,889 |
| 76. | 32312 | 21.2% | 9.0%(+12.2)#76 | 11.4%(+9.80)#2,958 |
| 77. | 34211 | 21.2% | 9.0%(+12.2)#77 | 11.4%(+9.80)#2,966 |
| 78. | 33154 | 21.2% | 9.0%(+12.2)#78 | 11.4%(+9.80)#2,969 |
| 79. | 34681 | 21.2% | 9.0%(+12.2)#79 | 11.4%(+9.80)#2,980 |
| 80. | 32779 | 21.1% | 9.0%(+12.1)#80 | 11.4%(+9.70)#2,994 |
| 81. | 33558 | 21.1% | 9.0%(+12.1)#81 | 11.4%(+9.70)#2,995 |
| 82. | 32250 | 21.1% | 9.0%(+12.1)#82 | 11.4%(+9.70)#2,996 |
| 83. | 32266 | 21.1% | 9.0%(+12.1)#83 | 11.4%(+9.70)#3,007 |
| 84. | 33143 | 21.0% | 9.0%(+12.0)#84 | 11.4%(+9.60)#3,023 |
| 85. | 32003 | 21.0% | 9.0%(+12.0)#85 | 11.4%(+9.60)#3,026 |
| 86. | 34688 | 20.9% | 9.0%(+11.9)#86 | 11.4%(+9.50)#3,060 |
| 87. | 34119 | 20.7% | 9.0%(+11.7)#87 | 11.4%(+9.30)#3,104 |
| 88. | 33305 | 20.7% | 9.0%(+11.7)#88 | 11.4%(+9.30)#3,114 |
| 89. | 32459 | 20.5% | 9.0%(+11.5)#89 | 11.4%(+9.10)#3,157 |
| 90. | 33301 | 20.4% | 9.0%(+11.4)#90 | 11.4%(+9.00)#3,179 |
| 91. | 34229 | 20.4% | 9.0%(+11.4)#91 | 11.4%(+9.00)#3,180 |
| 92. | 34110 | 20.3% | 9.0%(+11.3)#92 | 11.4%(+8.90)#3,202 |
| 93. | 33412 | 20.3% | 9.0%(+11.3)#93 | 11.4%(+8.90)#3,206 |
| 94. | 32631 | 20.3% | 9.0%(+11.3)#94 | 11.4%(+8.90)#3,223 |
| 95. | 34212 | 20.0% | 9.0%(+11.0)#95 | 11.4%(+8.60)#3,279 |
| 96. | 33913 | 19.9% | 9.0%(+10.9)#96 | 11.4%(+8.50)#3,311 |
| 97. | 33306 | 19.9% | 9.0%(+10.9)#97 | 11.4%(+8.50)#3,333 |
| 98. | 33703 | 19.8% | 9.0%(+10.8)#98 | 11.4%(+8.40)#3,342 |
| 99. | 33304 | 19.8% | 9.0%(+10.8)#99 | 11.4%(+8.40)#3,346 |
| 100. | 34760 | 19.7% | 9.0%(+10.7)#100 | 11.4%(+8.30)#3,381 |
Common Questions
What are the Top 10 Zip Codes with the Highest Percentage of Households with Income Above $200,000 in Florida?
Top 10 Zip Codes with the Highest Percentage of Households with Income Above $200,000 in Florida are:
What zip code has the Highest Percentage of Households with Income Above $200,000 in Florida?
33530 has the Highest Percentage of Households with Income Above $200,000 in Florida with 100.0%.
What is the Percentage of Households with Income Above $200,000 in the State of Florida?
Percentage of Households with Income Above $200,000 in Florida is 9.0%.
What is the Percentage of Households with Income Above $200,000 in the United States?
Percentage of Households with Income Above $200,000 in the United States is 11.4%.