Zip Codes with the Highest Percentage of Households with Income Above $200,000 in Wyoming
RELATED REPORTS & OPTIONS
Household Income | $200k+
Wyoming
Compare Zip Codes
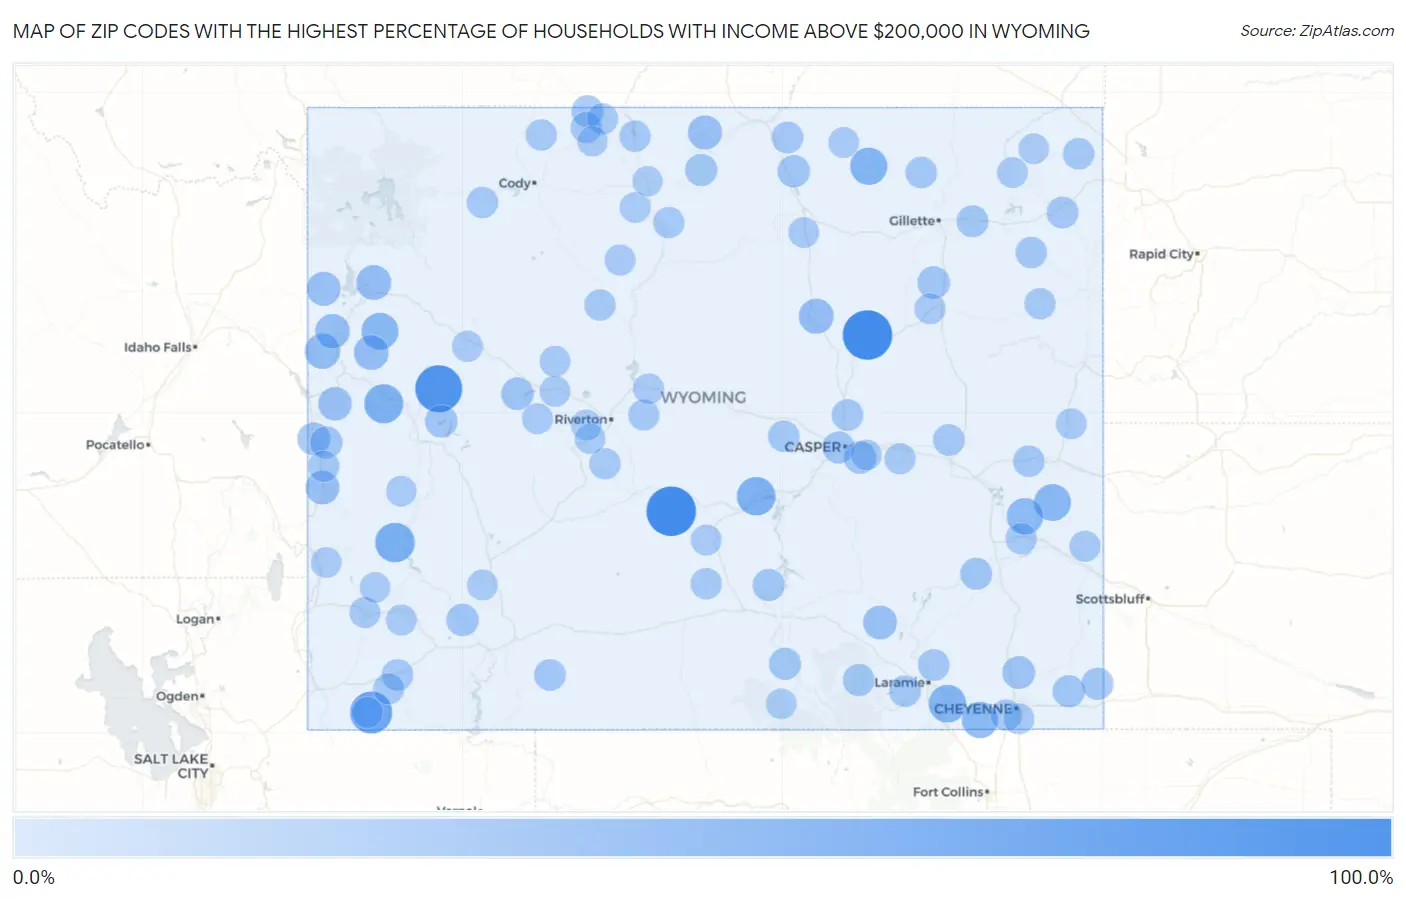
Map of Zip Codes with the Highest Percentage of Households with Income Above $200,000 in Wyoming
0.0%
100.0%
Zip Codes with the Highest Percentage of Households with Income Above $200,000 in Wyoming
| Zip Code | Households with Income > $200k | vs State | vs National | |
| 1. | 82640 | 100.0% | 7.4%(+92.6)#1 | 11.4%(+88.6)#8 |
| 2. | 82310 | 100.0% | 7.4%(+92.6)#2 | 11.4%(+88.6)#18 |
| 3. | 82925 | 86.3% | 7.4%(+78.9)#3 | 11.4%(+74.9)#32 |
| 4. | 82944 | 60.8% | 7.4%(+53.4)#4 | 11.4%(+49.4)#111 |
| 5. | 83123 | 47.3% | 7.4%(+39.9)#5 | 11.4%(+35.9)#345 |
| 6. | 82922 | 44.9% | 7.4%(+37.5)#6 | 11.4%(+33.5)#437 |
| 7. | 82620 | 42.7% | 7.4%(+35.3)#7 | 11.4%(+31.3)#520 |
| 8. | 82073 | 37.5% | 7.4%(+30.1)#8 | 11.4%(+26.1)#807 |
| 9. | 82831 | 35.6% | 7.4%(+28.2)#9 | 11.4%(+24.2)#935 |
| 10. | 83011 | 33.3% | 7.4%(+25.9)#10 | 11.4%(+21.9)#1,133 |
| 11. | 82219 | 33.3% | 7.4%(+25.9)#11 | 11.4%(+21.9)#1,139 |
| 12. | 82215 | 31.5% | 7.4%(+24.1)#12 | 11.4%(+20.1)#1,302 |
| 13. | 82059 | 29.7% | 7.4%(+22.3)#13 | 11.4%(+18.3)#1,504 |
| 14. | 83014 | 25.5% | 7.4%(+18.1)#14 | 11.4%(+14.1)#2,107 |
| 15. | 82639 | 23.5% | 7.4%(+16.1)#15 | 11.4%(+12.1)#2,472 |
| 16. | 83013 | 23.1% | 7.4%(+15.7)#16 | 11.4%(+11.7)#2,544 |
| 17. | 83001 | 22.4% | 7.4%(+15.0)#17 | 11.4%(+11.0)#2,692 |
| 18. | 83025 | 21.3% | 7.4%(+13.9)#18 | 11.4%(+9.90)#2,951 |
| 19. | 82836 | 19.6% | 7.4%(+12.2)#19 | 11.4%(+8.20)#3,413 |
| 20. | 83414 | 18.5% | 7.4%(+11.1)#20 | 11.4%(+7.10)#3,716 |
| 21. | 83126 | 17.7% | 7.4%(+10.3)#21 | 11.4%(+6.30)#3,946 |
| 22. | 82083 | 17.6% | 7.4%(+10.2)#22 | 11.4%(+6.20)#3,995 |
| 23. | 83128 | 16.8% | 7.4%(+9.40)#23 | 11.4%(+5.40)#4,274 |
| 24. | 82009 | 12.9% | 7.4%(+5.50)#24 | 11.4%(+1.50)#6,068 |
| 25. | 83127 | 12.8% | 7.4%(+5.40)#25 | 11.4%(+1.40)#6,161 |
| 26. | 82512 | 11.8% | 7.4%(+4.40)#26 | 11.4%(+0.400)#6,836 |
| 27. | 82718 | 11.6% | 7.4%(+4.20)#27 | 11.4%(+0.200)#6,938 |
| 28. | 82832 | 11.2% | 7.4%(+3.80)#28 | 11.4%(-0.200)#7,278 |
| 29. | 82609 | 11.1% | 7.4%(+3.70)#29 | 11.4%(-0.300)#7,317 |
| 30. | 82941 | 11.1% | 7.4%(+3.70)#30 | 11.4%(-0.300)#7,340 |
| 31. | 82935 | 10.6% | 7.4%(+3.20)#31 | 11.4%(-0.800)#7,717 |
| 32. | 83112 | 10.5% | 7.4%(+3.10)#32 | 11.4%(-0.900)#7,833 |
| 33. | 82644 | 10.1% | 7.4%(+2.70)#33 | 11.4%(-1.30)#8,202 |
| 34. | 82053 | 9.8% | 7.4%(+2.40)#34 | 11.4%(-1.60)#8,511 |
| 35. | 82334 | 9.6% | 7.4%(+2.20)#35 | 11.4%(-1.80)#8,691 |
| 36. | 82441 | 9.6% | 7.4%(+2.20)#36 | 11.4%(-1.80)#8,703 |
| 37. | 82331 | 9.3% | 7.4%(+1.90)#37 | 11.4%(-2.10)#8,981 |
| 38. | 82082 | 8.7% | 7.4%(+1.30)#38 | 11.4%(-2.70)#9,590 |
| 39. | 82727 | 8.3% | 7.4%(+0.900)#39 | 11.4%(-3.10)#10,070 |
| 40. | 82201 | 8.2% | 7.4%(+0.800)#40 | 11.4%(-3.20)#10,134 |
| 41. | 82423 | 8.2% | 7.4%(+0.800)#41 | 11.4%(-3.20)#10,204 |
| 42. | 82055 | 8.0% | 7.4%(+0.600)#42 | 11.4%(-3.40)#10,460 |
| 43. | 82801 | 7.7% | 7.4%(+0.300)#43 | 11.4%(-3.70)#10,765 |
| 44. | 82729 | 7.7% | 7.4%(+0.300)#44 | 11.4%(-3.70)#10,819 |
| 45. | 82601 | 7.0% | 7.4%(-0.400)#45 | 11.4%(-4.40)#11,767 |
| 46. | 82937 | 6.9% | 7.4%(-0.500)#46 | 11.4%(-4.50)#11,986 |
| 47. | 82901 | 6.8% | 7.4%(-0.600)#47 | 11.4%(-4.60)#12,074 |
| 48. | 82070 | 6.8% | 7.4%(-0.600)#48 | 11.4%(-4.60)#12,085 |
| 49. | 82633 | 6.7% | 7.4%(-0.700)#49 | 11.4%(-4.70)#12,256 |
| 50. | 82716 | 6.6% | 7.4%(-0.800)#50 | 11.4%(-4.80)#12,426 |
| 51. | 82072 | 6.6% | 7.4%(-0.800)#51 | 11.4%(-4.80)#12,428 |
| 52. | 82227 | 6.4% | 7.4%(-1.00)#52 | 11.4%(-5.00)#12,875 |
| 53. | 82604 | 6.3% | 7.4%(-1.10)#53 | 11.4%(-5.10)#12,918 |
| 54. | 82730 | 6.2% | 7.4%(-1.20)#54 | 11.4%(-5.20)#13,192 |
| 55. | 82710 | 6.0% | 7.4%(-1.40)#55 | 11.4%(-5.40)#13,599 |
| 56. | 82414 | 5.5% | 7.4%(-1.90)#56 | 11.4%(-5.90)#14,520 |
| 57. | 82301 | 5.5% | 7.4%(-1.90)#57 | 11.4%(-5.90)#14,537 |
| 58. | 82214 | 5.4% | 7.4%(-2.00)#58 | 11.4%(-6.00)#14,820 |
| 59. | 82431 | 5.2% | 7.4%(-2.20)#59 | 11.4%(-6.20)#15,192 |
| 60. | 82443 | 5.1% | 7.4%(-2.30)#60 | 11.4%(-6.30)#15,404 |
| 61. | 82701 | 4.8% | 7.4%(-2.60)#61 | 11.4%(-6.60)#16,134 |
| 62. | 82520 | 4.7% | 7.4%(-2.70)#62 | 11.4%(-6.70)#16,315 |
| 63. | 82435 | 4.7% | 7.4%(-2.70)#63 | 11.4%(-6.70)#16,319 |
| 64. | 83110 | 4.6% | 7.4%(-2.80)#64 | 11.4%(-6.80)#16,609 |
| 65. | 82421 | 4.6% | 7.4%(-2.80)#65 | 11.4%(-6.80)#16,738 |
| 66. | 82432 | 4.5% | 7.4%(-2.90)#66 | 11.4%(-6.90)#16,988 |
| 67. | 82637 | 4.2% | 7.4%(-3.20)#67 | 11.4%(-7.20)#17,652 |
| 68. | 82001 | 4.1% | 7.4%(-3.30)#68 | 11.4%(-7.30)#17,811 |
| 69. | 82501 | 4.1% | 7.4%(-3.30)#69 | 11.4%(-7.30)#17,852 |
| 70. | 82939 | 4.1% | 7.4%(-3.30)#70 | 11.4%(-7.30)#17,995 |
| 71. | 83116 | 4.0% | 7.4%(-3.40)#71 | 11.4%(-7.40)#18,297 |
| 72. | 82420 | 3.9% | 7.4%(-3.50)#72 | 11.4%(-7.50)#18,534 |
| 73. | 82240 | 3.8% | 7.4%(-3.60)#73 | 11.4%(-7.60)#18,659 |
| 74. | 82732 | 3.7% | 7.4%(-3.70)#74 | 11.4%(-7.70)#19,044 |
| 75. | 83124 | 3.6% | 7.4%(-3.80)#75 | 11.4%(-7.80)#19,412 |
| 76. | 82401 | 3.5% | 7.4%(-3.90)#76 | 11.4%(-7.90)#19,527 |
| 77. | 82513 | 3.5% | 7.4%(-3.90)#77 | 11.4%(-7.90)#19,617 |
| 78. | 82007 | 3.4% | 7.4%(-4.00)#78 | 11.4%(-8.00)#19,712 |
| 79. | 82523 | 3.4% | 7.4%(-4.00)#79 | 11.4%(-8.00)#19,919 |
| 80. | 82516 | 3.3% | 7.4%(-4.10)#80 | 11.4%(-8.10)#20,254 |
| 81. | 82930 | 2.8% | 7.4%(-4.60)#81 | 11.4%(-8.60)#21,467 |
| 82. | 82322 | 2.8% | 7.4%(-4.60)#82 | 11.4%(-8.60)#21,705 |
| 83. | 82514 | 2.7% | 7.4%(-4.70)#83 | 11.4%(-8.70)#21,908 |
| 84. | 82834 | 2.6% | 7.4%(-4.80)#84 | 11.4%(-8.80)#22,096 |
| 85. | 82721 | 2.6% | 7.4%(-4.80)#85 | 11.4%(-8.80)#22,160 |
| 86. | 82932 | 2.6% | 7.4%(-4.80)#86 | 11.4%(-8.80)#22,256 |
| 87. | 82636 | 2.5% | 7.4%(-4.90)#87 | 11.4%(-8.90)#22,441 |
| 88. | 82835 | 2.4% | 7.4%(-5.00)#88 | 11.4%(-9.00)#22,868 |
| 89. | 83113 | 2.2% | 7.4%(-5.20)#89 | 11.4%(-9.20)#23,314 |
| 90. | 82225 | 2.2% | 7.4%(-5.20)#90 | 11.4%(-9.20)#23,338 |
| 91. | 82410 | 2.1% | 7.4%(-5.30)#91 | 11.4%(-9.30)#23,589 |
| 92. | 82510 | 2.1% | 7.4%(-5.30)#92 | 11.4%(-9.30)#23,651 |
| 93. | 83114 | 2.1% | 7.4%(-5.30)#93 | 11.4%(-9.30)#23,675 |
| 94. | 82649 | 2.0% | 7.4%(-5.40)#94 | 11.4%(-9.40)#23,938 |
| 95. | 82325 | 2.0% | 7.4%(-5.40)#95 | 11.4%(-9.40)#23,975 |
| 96. | 83101 | 1.7% | 7.4%(-5.70)#96 | 11.4%(-9.70)#24,648 |
| 97. | 82720 | 1.6% | 7.4%(-5.80)#97 | 11.4%(-9.80)#24,994 |
| 98. | 82515 | 1.6% | 7.4%(-5.80)#98 | 11.4%(-9.80)#25,015 |
| 99. | 82412 | 1.0% | 7.4%(-6.40)#99 | 11.4%(-10.4)#26,323 |
| 100. | 82426 | 0.80% | 7.4%(-6.60)#100 | 11.4%(-10.6)#26,602 |
1
2Common Questions
What are the Top 10 Zip Codes with the Highest Percentage of Households with Income Above $200,000 in Wyoming?
Top 10 Zip Codes with the Highest Percentage of Households with Income Above $200,000 in Wyoming are:
What zip code has the Highest Percentage of Households with Income Above $200,000 in Wyoming?
82640 has the Highest Percentage of Households with Income Above $200,000 in Wyoming with 100.0%.
What is the Percentage of Households with Income Above $200,000 in the State of Wyoming?
Percentage of Households with Income Above $200,000 in Wyoming is 7.4%.
What is the Percentage of Households with Income Above $200,000 in the United States?
Percentage of Households with Income Above $200,000 in the United States is 11.4%.