Zip Codes with the Highest Percentage of Households with Income Above $200,000 in Minnesota
RELATED REPORTS & OPTIONS
Household Income | $200k+
Minnesota
Compare Zip Codes
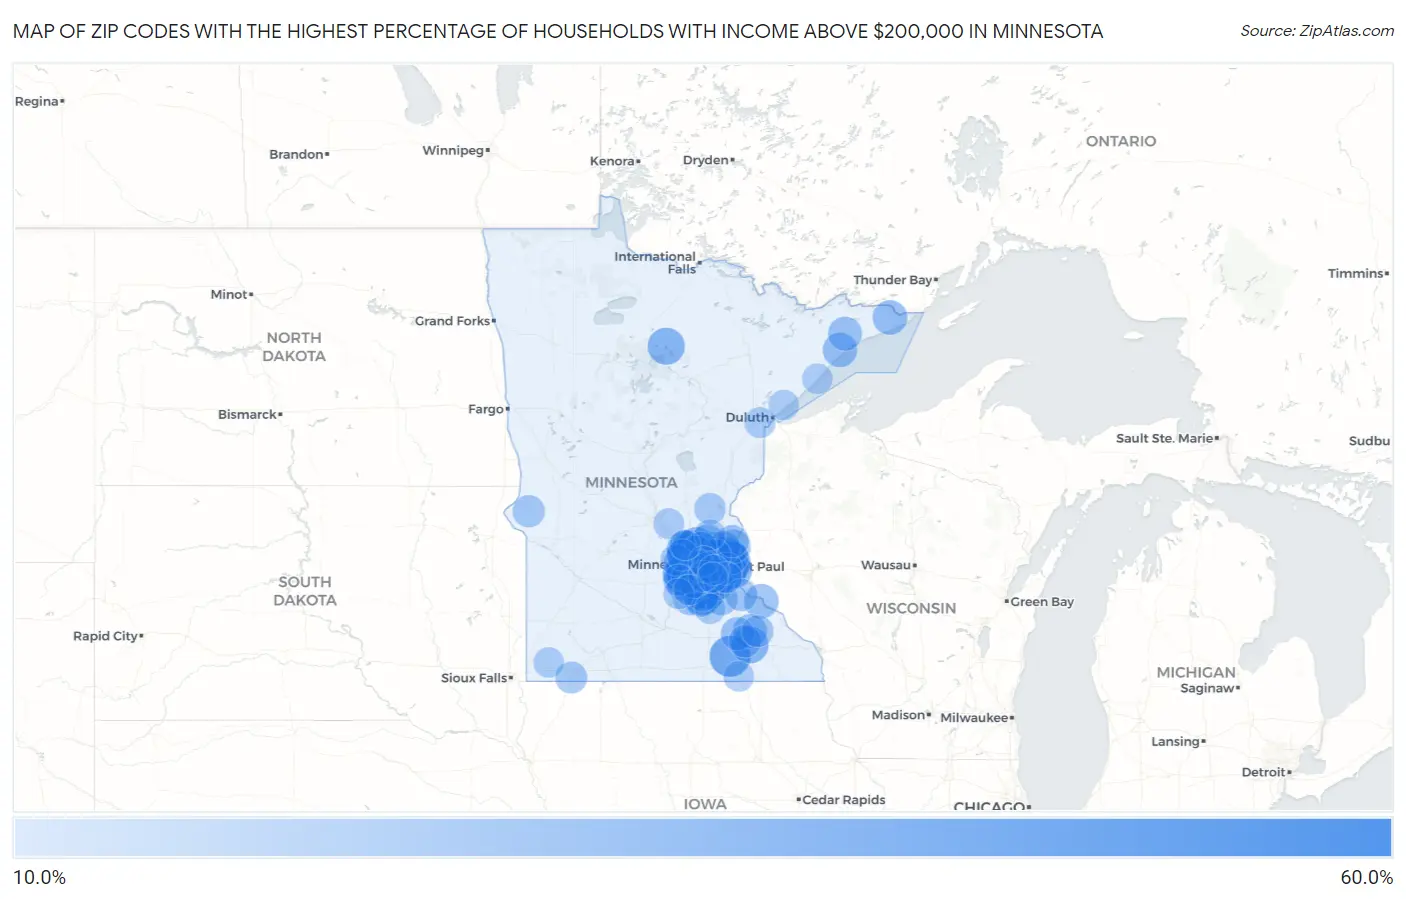
Map of Zip Codes with the Highest Percentage of Households with Income Above $200,000 in Minnesota
10.0%
60.0%
Zip Codes with the Highest Percentage of Households with Income Above $200,000 in Minnesota
| Zip Code | Households with Income > $200k | vs State | vs National | |
| 1. | 55424 | 53.6% | 11.9%(+41.7)#1 | 11.4%(+42.2)#201 |
| 2. | 55439 | 42.7% | 11.9%(+30.8)#2 | 11.4%(+31.3)#519 |
| 3. | 55331 | 41.0% | 11.9%(+29.1)#3 | 11.4%(+29.6)#600 |
| 4. | 55386 | 40.7% | 11.9%(+28.8)#4 | 11.4%(+29.3)#616 |
| 5. | 55042 | 40.4% | 11.9%(+28.5)#5 | 11.4%(+29.0)#632 |
| 6. | 55356 | 39.4% | 11.9%(+27.5)#6 | 11.4%(+28.0)#678 |
| 7. | 55340 | 39.0% | 11.9%(+27.1)#7 | 11.4%(+27.6)#708 |
| 8. | 55347 | 38.3% | 11.9%(+26.4)#8 | 11.4%(+26.9)#753 |
| 9. | 55446 | 37.7% | 11.9%(+25.8)#9 | 11.4%(+26.3)#788 |
| 10. | 55391 | 37.4% | 11.9%(+25.5)#10 | 11.4%(+26.0)#810 |
| 11. | 55982 | 35.8% | 11.9%(+23.9)#11 | 11.4%(+24.4)#920 |
| 12. | 55436 | 35.6% | 11.9%(+23.7)#12 | 11.4%(+24.2)#930 |
| 13. | 55410 | 34.2% | 11.9%(+22.3)#13 | 11.4%(+22.8)#1,040 |
| 14. | 55359 | 32.6% | 11.9%(+20.7)#14 | 11.4%(+21.2)#1,194 |
| 15. | 55357 | 32.6% | 11.9%(+20.7)#15 | 11.4%(+21.2)#1,195 |
| 16. | 55317 | 32.5% | 11.9%(+20.6)#16 | 11.4%(+21.1)#1,206 |
| 17. | 55129 | 32.0% | 11.9%(+20.1)#17 | 11.4%(+20.6)#1,244 |
| 18. | 55419 | 31.5% | 11.9%(+19.6)#18 | 11.4%(+20.1)#1,294 |
| 19. | 55311 | 31.0% | 11.9%(+19.1)#19 | 11.4%(+19.6)#1,348 |
| 20. | 55115 | 30.0% | 11.9%(+18.1)#20 | 11.4%(+18.6)#1,455 |
| 21. | 55327 | 30.0% | 11.9%(+18.1)#21 | 11.4%(+18.6)#1,456 |
| 22. | 55372 | 29.9% | 11.9%(+18.0)#22 | 11.4%(+18.5)#1,463 |
| 23. | 55345 | 29.2% | 11.9%(+17.3)#23 | 11.4%(+17.8)#1,554 |
| 24. | 55054 | 29.1% | 11.9%(+17.2)#24 | 11.4%(+17.7)#1,575 |
| 25. | 55127 | 28.1% | 11.9%(+16.2)#25 | 11.4%(+16.7)#1,705 |
| 26. | 55346 | 28.0% | 11.9%(+16.1)#26 | 11.4%(+16.6)#1,724 |
| 27. | 56659 | 27.9% | 11.9%(+16.0)#27 | 11.4%(+16.5)#1,753 |
| 28. | 55902 | 27.5% | 11.9%(+15.6)#28 | 11.4%(+16.1)#1,796 |
| 29. | 55001 | 27.5% | 11.9%(+15.6)#29 | 11.4%(+16.1)#1,800 |
| 30. | 55123 | 27.1% | 11.9%(+15.2)#30 | 11.4%(+15.7)#1,854 |
| 31. | 55442 | 27.0% | 11.9%(+15.1)#31 | 11.4%(+15.6)#1,883 |
| 32. | 55044 | 26.4% | 11.9%(+14.5)#32 | 11.4%(+15.0)#1,958 |
| 33. | 55105 | 26.4% | 11.9%(+14.5)#33 | 11.4%(+15.0)#1,964 |
| 34. | 55447 | 26.2% | 11.9%(+14.3)#34 | 11.4%(+14.8)#2,001 |
| 35. | 55341 | 25.9% | 11.9%(+14.0)#35 | 11.4%(+14.5)#2,049 |
| 36. | 55364 | 25.4% | 11.9%(+13.5)#36 | 11.4%(+14.0)#2,118 |
| 37. | 55374 | 25.3% | 11.9%(+13.4)#37 | 11.4%(+13.9)#2,133 |
| 38. | 55120 | 23.8% | 11.9%(+11.9)#38 | 11.4%(+12.4)#2,416 |
| 39. | 55378 | 23.0% | 11.9%(+11.1)#39 | 11.4%(+11.6)#2,551 |
| 40. | 55315 | 22.9% | 11.9%(+11.0)#40 | 11.4%(+11.5)#2,582 |
| 41. | 55415 | 22.9% | 11.9%(+11.0)#41 | 11.4%(+11.5)#2,583 |
| 42. | 55613 | 22.9% | 11.9%(+11.0)#42 | 11.4%(+11.5)#2,589 |
| 43. | 55606 | 22.9% | 11.9%(+11.0)#43 | 11.4%(+11.5)#2,590 |
| 44. | 55026 | 22.7% | 11.9%(+10.8)#44 | 11.4%(+11.3)#2,642 |
| 45. | 55077 | 22.3% | 11.9%(+10.4)#45 | 11.4%(+10.9)#2,719 |
| 46. | 55441 | 22.0% | 11.9%(+10.1)#46 | 11.4%(+10.6)#2,780 |
| 47. | 55960 | 21.7% | 11.9%(+9.80)#47 | 11.4%(+10.3)#2,856 |
| 48. | 55449 | 21.6% | 11.9%(+9.70)#48 | 11.4%(+10.2)#2,867 |
| 49. | 55615 | 21.6% | 11.9%(+9.70)#49 | 11.4%(+10.2)#2,877 |
| 50. | 55082 | 21.5% | 11.9%(+9.60)#50 | 11.4%(+10.1)#2,883 |
| 51. | 55304 | 21.0% | 11.9%(+9.10)#51 | 11.4%(+9.60)#3,018 |
| 52. | 55416 | 21.0% | 11.9%(+9.10)#52 | 11.4%(+9.60)#3,020 |
| 53. | 55047 | 21.0% | 11.9%(+9.10)#53 | 11.4%(+9.60)#3,035 |
| 54. | 55150 | 20.8% | 11.9%(+8.90)#54 | 11.4%(+9.40)#3,099 |
| 55. | 55955 | 20.6% | 11.9%(+8.70)#55 | 11.4%(+9.20)#3,140 |
| 56. | 55088 | 20.3% | 11.9%(+8.40)#56 | 11.4%(+8.90)#3,219 |
| 57. | 55038 | 20.0% | 11.9%(+8.10)#57 | 11.4%(+8.60)#3,278 |
| 58. | 55065 | 19.8% | 11.9%(+7.90)#58 | 11.4%(+8.40)#3,357 |
| 59. | 55068 | 19.6% | 11.9%(+7.70)#59 | 11.4%(+8.20)#3,395 |
| 60. | 56071 | 19.5% | 11.9%(+7.60)#60 | 11.4%(+8.10)#3,434 |
| 61. | 55401 | 19.3% | 11.9%(+7.40)#61 | 11.4%(+7.90)#3,494 |
| 62. | 55020 | 19.3% | 11.9%(+7.40)#62 | 11.4%(+7.90)#3,496 |
| 63. | 55125 | 19.0% | 11.9%(+7.10)#63 | 11.4%(+7.60)#3,560 |
| 64. | 55920 | 18.9% | 11.9%(+7.00)#64 | 11.4%(+7.50)#3,594 |
| 65. | 55073 | 18.9% | 11.9%(+7.00)#65 | 11.4%(+7.50)#3,597 |
| 66. | 55089 | 18.5% | 11.9%(+6.60)#66 | 11.4%(+7.10)#3,712 |
| 67. | 55417 | 18.3% | 11.9%(+6.40)#67 | 11.4%(+6.90)#3,749 |
| 68. | 55387 | 18.3% | 11.9%(+6.40)#68 | 11.4%(+6.90)#3,755 |
| 69. | 55438 | 18.1% | 11.9%(+6.20)#69 | 11.4%(+6.70)#3,822 |
| 70. | 56236 | 18.0% | 11.9%(+6.10)#70 | 11.4%(+6.60)#3,865 |
| 71. | 55375 | 17.9% | 11.9%(+6.00)#71 | 11.4%(+6.50)#3,888 |
| 72. | 55126 | 17.8% | 11.9%(+5.90)#72 | 11.4%(+6.40)#3,901 |
| 73. | 55318 | 17.6% | 11.9%(+5.70)#73 | 11.4%(+6.20)#3,964 |
| 74. | 55906 | 17.3% | 11.9%(+5.40)#74 | 11.4%(+5.90)#4,072 |
| 75. | 56117 | 17.3% | 11.9%(+5.40)#75 | 11.4%(+5.90)#4,091 |
| 76. | 55369 | 17.0% | 11.9%(+5.10)#76 | 11.4%(+5.60)#4,181 |
| 77. | 55316 | 17.0% | 11.9%(+5.10)#77 | 11.4%(+5.60)#4,188 |
| 78. | 55305 | 17.0% | 11.9%(+5.10)#78 | 11.4%(+5.60)#4,189 |
| 79. | 55328 | 17.0% | 11.9%(+5.10)#79 | 11.4%(+5.60)#4,194 |
| 80. | 55379 | 16.9% | 11.9%(+5.00)#80 | 11.4%(+5.50)#4,213 |
| 81. | 55373 | 16.9% | 11.9%(+5.00)#81 | 11.4%(+5.50)#4,231 |
| 82. | 55016 | 16.7% | 11.9%(+4.80)#82 | 11.4%(+5.30)#4,284 |
| 83. | 55080 | 16.6% | 11.9%(+4.70)#83 | 11.4%(+5.20)#4,345 |
| 84. | 55322 | 16.4% | 11.9%(+4.50)#84 | 11.4%(+5.00)#4,426 |
| 85. | 55011 | 15.8% | 11.9%(+3.90)#85 | 11.4%(+4.40)#4,655 |
| 86. | 55733 | 15.5% | 11.9%(+3.60)#86 | 11.4%(+4.10)#4,776 |
| 87. | 55437 | 15.4% | 11.9%(+3.50)#87 | 11.4%(+4.00)#4,810 |
| 88. | 56011 | 15.2% | 11.9%(+3.30)#88 | 11.4%(+3.80)#4,899 |
| 89. | 55319 | 15.2% | 11.9%(+3.30)#89 | 11.4%(+3.80)#4,905 |
| 90. | 55409 | 15.0% | 11.9%(+3.10)#90 | 11.4%(+3.60)#4,989 |
| 91. | 55352 | 15.0% | 11.9%(+3.10)#91 | 11.4%(+3.60)#4,990 |
| 92. | 55909 | 14.9% | 11.9%(+3.00)#92 | 11.4%(+3.50)#5,054 |
| 93. | 55422 | 14.8% | 11.9%(+2.90)#93 | 11.4%(+3.40)#5,077 |
| 94. | 55116 | 14.8% | 11.9%(+2.90)#94 | 11.4%(+3.40)#5,078 |
| 95. | 55376 | 14.8% | 11.9%(+2.90)#95 | 11.4%(+3.40)#5,084 |
| 96. | 56147 | 14.8% | 11.9%(+2.90)#96 | 11.4%(+3.40)#5,108 |
| 97. | 55122 | 14.7% | 11.9%(+2.80)#97 | 11.4%(+3.30)#5,121 |
| 98. | 55019 | 14.7% | 11.9%(+2.80)#98 | 11.4%(+3.30)#5,151 |
| 99. | 55601 | 14.7% | 11.9%(+2.80)#99 | 11.4%(+3.30)#5,169 |
| 100. | 55804 | 14.5% | 11.9%(+2.60)#100 | 11.4%(+3.10)#5,222 |
Common Questions
What are the Top 10 Zip Codes with the Highest Percentage of Households with Income Above $200,000 in Minnesota?
Top 10 Zip Codes with the Highest Percentage of Households with Income Above $200,000 in Minnesota are:
What zip code has the Highest Percentage of Households with Income Above $200,000 in Minnesota?
55424 has the Highest Percentage of Households with Income Above $200,000 in Minnesota with 53.6%.
What is the Percentage of Households with Income Above $200,000 in the State of Minnesota?
Percentage of Households with Income Above $200,000 in Minnesota is 11.9%.
What is the Percentage of Households with Income Above $200,000 in the United States?
Percentage of Households with Income Above $200,000 in the United States is 11.4%.