Zip Codes with the Highest Percentage of Households with Income Above $200,000 in Indiana
RELATED REPORTS & OPTIONS
Household Income | $200k+
Indiana
Compare Zip Codes
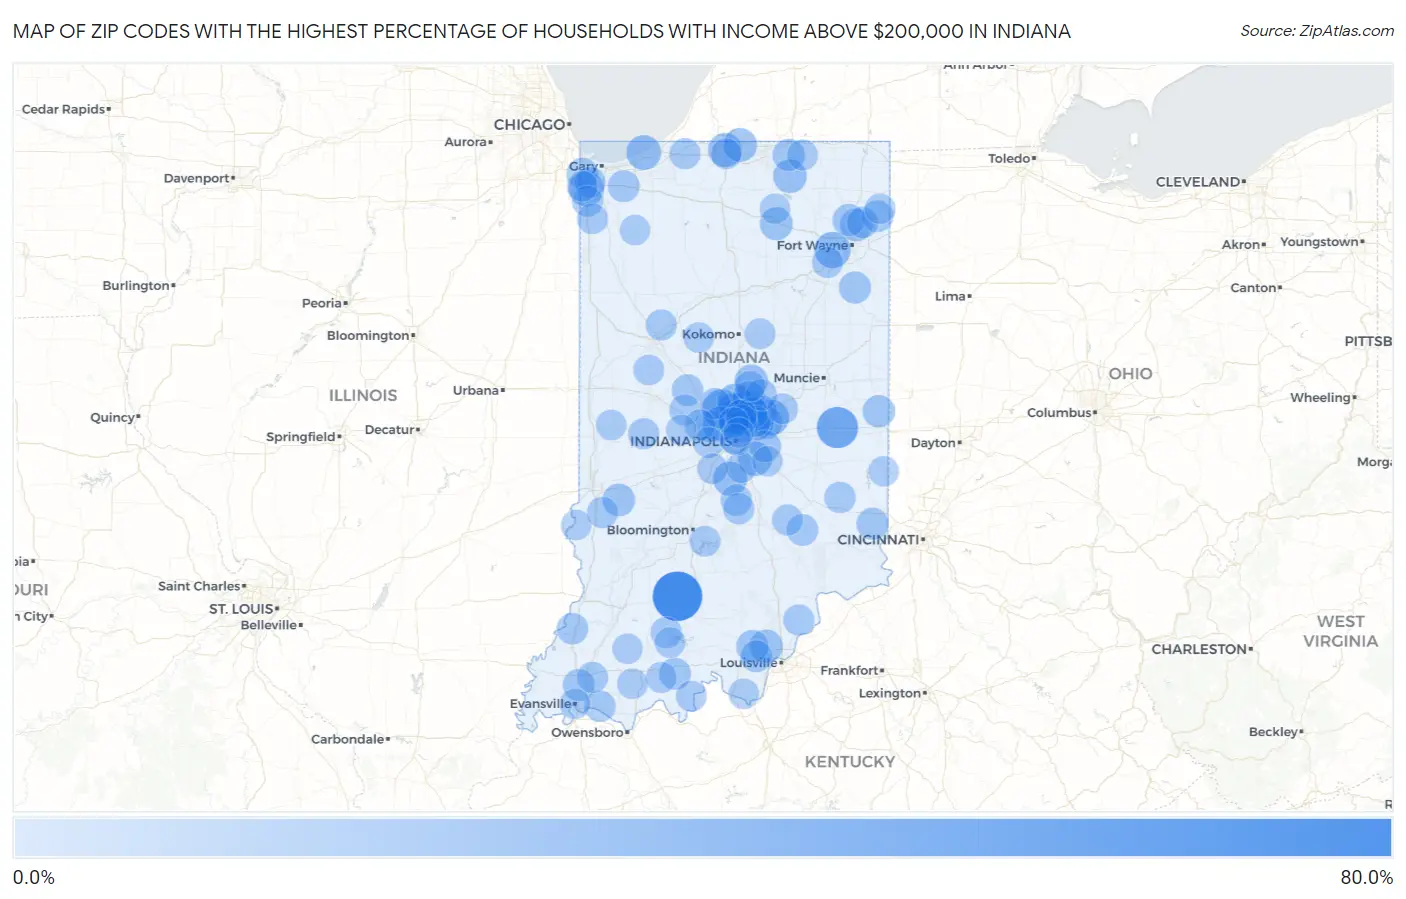
Map of Zip Codes with the Highest Percentage of Households with Income Above $200,000 in Indiana
0.0%
80.0%
Zip Codes with the Highest Percentage of Households with Income Above $200,000 in Indiana
| Zip Code | Households with Income > $200k | vs State | vs National | |
| 1. | 47437 | 76.7% | 6.7%(+70.0)#1 | 11.4%(+65.3)#39 |
| 2. | 47366 | 47.1% | 6.7%(+40.4)#2 | 11.4%(+35.7)#357 |
| 3. | 46077 | 36.7% | 6.7%(+30.0)#3 | 11.4%(+25.3)#856 |
| 4. | 46033 | 35.3% | 6.7%(+28.6)#4 | 11.4%(+23.9)#951 |
| 5. | 46032 | 29.8% | 6.7%(+23.1)#5 | 11.4%(+18.4)#1,478 |
| 6. | 46814 | 29.6% | 6.7%(+22.9)#6 | 11.4%(+18.2)#1,506 |
| 7. | 46040 | 27.7% | 6.7%(+21.0)#7 | 11.4%(+16.3)#1,775 |
| 8. | 46290 | 26.7% | 6.7%(+20.0)#8 | 11.4%(+15.3)#1,925 |
| 9. | 46373 | 26.4% | 6.7%(+19.7)#9 | 11.4%(+15.0)#1,967 |
| 10. | 46074 | 25.4% | 6.7%(+18.7)#10 | 11.4%(+14.0)#2,113 |
| 11. | 46037 | 25.2% | 6.7%(+18.5)#11 | 11.4%(+13.8)#2,143 |
| 12. | 46278 | 24.8% | 6.7%(+18.1)#12 | 11.4%(+13.4)#2,228 |
| 13. | 46301 | 24.5% | 6.7%(+17.8)#13 | 11.4%(+13.1)#2,287 |
| 14. | 46259 | 22.9% | 6.7%(+16.2)#14 | 11.4%(+11.5)#2,578 |
| 15. | 46106 | 22.8% | 6.7%(+16.1)#15 | 11.4%(+11.4)#2,607 |
| 16. | 46624 | 21.9% | 6.7%(+15.2)#16 | 11.4%(+10.5)#2,814 |
| 17. | 46530 | 21.0% | 6.7%(+14.3)#17 | 11.4%(+9.60)#3,022 |
| 18. | 46543 | 21.0% | 6.7%(+14.3)#18 | 11.4%(+9.60)#3,031 |
| 19. | 46030 | 19.9% | 6.7%(+13.2)#19 | 11.4%(+8.50)#3,332 |
| 20. | 47119 | 19.6% | 6.7%(+12.9)#20 | 11.4%(+8.20)#3,403 |
| 21. | 46590 | 18.6% | 6.7%(+11.9)#21 | 11.4%(+7.20)#3,682 |
| 22. | 46055 | 18.2% | 6.7%(+11.5)#22 | 11.4%(+6.80)#3,787 |
| 23. | 46845 | 17.5% | 6.7%(+10.8)#23 | 11.4%(+6.10)#4,011 |
| 24. | 47846 | 17.4% | 6.7%(+10.7)#24 | 11.4%(+6.00)#4,054 |
| 25. | 47124 | 16.8% | 6.7%(+10.1)#25 | 11.4%(+5.40)#4,266 |
| 26. | 46236 | 16.6% | 6.7%(+9.90)#26 | 11.4%(+5.20)#4,331 |
| 27. | 46062 | 16.4% | 6.7%(+9.70)#27 | 11.4%(+5.00)#4,407 |
| 28. | 47341 | 16.3% | 6.7%(+9.60)#28 | 11.4%(+4.90)#4,466 |
| 29. | 46748 | 16.1% | 6.7%(+9.40)#29 | 11.4%(+4.70)#4,530 |
| 30. | 46540 | 16.0% | 6.7%(+9.30)#30 | 11.4%(+4.60)#4,570 |
| 31. | 46731 | 15.9% | 6.7%(+9.20)#31 | 11.4%(+4.50)#4,627 |
| 32. | 47022 | 15.6% | 6.7%(+8.90)#32 | 11.4%(+4.20)#4,741 |
| 33. | 46163 | 15.1% | 6.7%(+8.40)#33 | 11.4%(+3.70)#4,947 |
| 34. | 46038 | 15.0% | 6.7%(+8.30)#34 | 11.4%(+3.60)#4,976 |
| 35. | 47515 | 15.0% | 6.7%(+8.30)#35 | 11.4%(+3.60)#5,008 |
| 36. | 46112 | 14.9% | 6.7%(+8.20)#36 | 11.4%(+3.50)#5,023 |
| 37. | 47725 | 14.9% | 6.7%(+8.20)#37 | 11.4%(+3.50)#5,033 |
| 38. | 46220 | 14.8% | 6.7%(+8.10)#38 | 11.4%(+3.40)#5,073 |
| 39. | 47122 | 14.7% | 6.7%(+8.00)#39 | 11.4%(+3.30)#5,136 |
| 40. | 46385 | 14.3% | 6.7%(+7.60)#40 | 11.4%(+2.90)#5,295 |
| 41. | 46321 | 14.3% | 6.7%(+7.60)#41 | 11.4%(+2.90)#5,307 |
| 42. | 46788 | 14.1% | 6.7%(+7.40)#42 | 11.4%(+2.70)#5,433 |
| 43. | 46256 | 13.7% | 6.7%(+7.00)#43 | 11.4%(+2.30)#5,623 |
| 44. | 47283 | 13.7% | 6.7%(+7.00)#44 | 11.4%(+2.30)#5,646 |
| 45. | 46765 | 13.5% | 6.7%(+6.80)#45 | 11.4%(+2.10)#5,752 |
| 46. | 46071 | 13.4% | 6.7%(+6.70)#46 | 11.4%(+2.00)#5,818 |
| 47. | 47524 | 13.4% | 6.7%(+6.70)#47 | 11.4%(+2.00)#5,834 |
| 48. | 46060 | 13.2% | 6.7%(+6.50)#48 | 11.4%(+1.80)#5,890 |
| 49. | 47630 | 13.1% | 6.7%(+6.40)#49 | 11.4%(+1.70)#5,949 |
| 50. | 46181 | 13.0% | 6.7%(+6.30)#50 | 11.4%(+1.60)#6,028 |
| 51. | 47036 | 13.0% | 6.7%(+6.30)#51 | 11.4%(+1.60)#6,048 |
| 52. | 46164 | 12.7% | 6.7%(+6.00)#52 | 11.4%(+1.30)#6,223 |
| 53. | 46147 | 12.7% | 6.7%(+6.00)#53 | 11.4%(+1.30)#6,225 |
| 54. | 47866 | 12.7% | 6.7%(+6.00)#54 | 11.4%(+1.30)#6,237 |
| 55. | 47527 | 12.6% | 6.7%(+5.90)#55 | 11.4%(+1.20)#6,298 |
| 56. | 46375 | 12.3% | 6.7%(+5.60)#56 | 11.4%(+0.900)#6,470 |
| 57. | 46075 | 12.3% | 6.7%(+5.60)#57 | 11.4%(+0.900)#6,485 |
| 58. | 46167 | 12.3% | 6.7%(+5.60)#58 | 11.4%(+0.900)#6,488 |
| 59. | 47613 | 12.3% | 6.7%(+5.60)#59 | 11.4%(+0.900)#6,502 |
| 60. | 46175 | 12.2% | 6.7%(+5.50)#60 | 11.4%(+0.800)#6,574 |
| 61. | 46240 | 12.1% | 6.7%(+5.40)#61 | 11.4%(+0.700)#6,608 |
| 62. | 46303 | 12.1% | 6.7%(+5.40)#62 | 11.4%(+0.700)#6,611 |
| 63. | 46371 | 12.0% | 6.7%(+5.30)#63 | 11.4%(+0.600)#6,691 |
| 64. | 46783 | 11.9% | 6.7%(+5.20)#64 | 11.4%(+0.500)#6,749 |
| 65. | 46280 | 11.9% | 6.7%(+5.20)#65 | 11.4%(+0.500)#6,750 |
| 66. | 47920 | 11.9% | 6.7%(+5.20)#66 | 11.4%(+0.500)#6,759 |
| 67. | 47141 | 11.9% | 6.7%(+5.20)#67 | 11.4%(+0.500)#6,765 |
| 68. | 47244 | 11.9% | 6.7%(+5.20)#68 | 11.4%(+0.500)#6,776 |
| 69. | 46123 | 11.7% | 6.7%(+5.00)#69 | 11.4%(+0.300)#6,849 |
| 70. | 47577 | 11.5% | 6.7%(+4.80)#70 | 11.4%(+0.100)#7,052 |
| 71. | 46936 | 11.4% | 6.7%(+4.70)#71 | 11.4%(=0.000)#7,103 |
| 72. | 46064 | 11.3% | 6.7%(+4.60)#72 | 11.4%(-0.100)#7,160 |
| 73. | 46143 | 11.2% | 6.7%(+4.50)#73 | 11.4%(-0.200)#7,219 |
| 74. | 47401 | 11.2% | 6.7%(+4.50)#74 | 11.4%(-0.200)#7,221 |
| 75. | 47521 | 11.2% | 6.7%(+4.50)#75 | 11.4%(-0.200)#7,285 |
| 76. | 46204 | 11.1% | 6.7%(+4.40)#76 | 11.4%(-0.300)#7,327 |
| 77. | 46565 | 11.1% | 6.7%(+4.40)#77 | 11.4%(-0.300)#7,330 |
| 78. | 46356 | 11.0% | 6.7%(+4.30)#78 | 11.4%(-0.400)#7,410 |
| 79. | 47525 | 10.9% | 6.7%(+4.20)#79 | 11.4%(-0.500)#7,523 |
| 80. | 46260 | 10.7% | 6.7%(+4.00)#80 | 11.4%(-0.700)#7,613 |
| 81. | 46158 | 10.7% | 6.7%(+4.00)#81 | 11.4%(-0.700)#7,621 |
| 82. | 46617 | 10.7% | 6.7%(+4.00)#82 | 11.4%(-0.700)#7,644 |
| 83. | 46034 | 10.7% | 6.7%(+4.00)#83 | 11.4%(-0.700)#7,654 |
| 84. | 47981 | 10.7% | 6.7%(+4.00)#84 | 11.4%(-0.700)#7,679 |
| 85. | 46202 | 10.6% | 6.7%(+3.90)#85 | 11.4%(-0.800)#7,707 |
| 86. | 46311 | 10.5% | 6.7%(+3.80)#86 | 11.4%(-0.900)#7,786 |
| 87. | 47537 | 10.5% | 6.7%(+3.80)#87 | 11.4%(-0.900)#7,838 |
| 88. | 47832 | 10.4% | 6.7%(+3.70)#88 | 11.4%(-1.000)#7,918 |
| 89. | 46920 | 10.1% | 6.7%(+3.40)#89 | 11.4%(-1.30)#8,208 |
| 90. | 47135 | 10.0% | 6.7%(+3.30)#90 | 11.4%(-1.40)#8,320 |
| 91. | 46538 | 9.9% | 6.7%(+3.20)#91 | 11.4%(-1.50)#8,384 |
| 92. | 47849 | 9.9% | 6.7%(+3.20)#92 | 11.4%(-1.50)#8,416 |
| 93. | 46392 | 9.8% | 6.7%(+3.10)#93 | 11.4%(-1.60)#8,471 |
| 94. | 46165 | 9.8% | 6.7%(+3.10)#94 | 11.4%(-1.60)#8,500 |
| 95. | 46785 | 9.8% | 6.7%(+3.10)#95 | 11.4%(-1.60)#8,502 |
| 96. | 47003 | 9.8% | 6.7%(+3.10)#96 | 11.4%(-1.60)#8,515 |
| 97. | 47708 | 9.8% | 6.7%(+3.10)#97 | 11.4%(-1.60)#8,519 |
| 98. | 47590 | 9.8% | 6.7%(+3.10)#98 | 11.4%(-1.60)#8,525 |
| 99. | 46205 | 9.7% | 6.7%(+3.00)#99 | 11.4%(-1.70)#8,552 |
| 100. | 46126 | 9.7% | 6.7%(+3.00)#100 | 11.4%(-1.70)#8,580 |
Common Questions
What are the Top 10 Zip Codes with the Highest Percentage of Households with Income Above $200,000 in Indiana?
Top 10 Zip Codes with the Highest Percentage of Households with Income Above $200,000 in Indiana are:
What zip code has the Highest Percentage of Households with Income Above $200,000 in Indiana?
47437 has the Highest Percentage of Households with Income Above $200,000 in Indiana with 76.7%.
What is the Percentage of Households with Income Above $200,000 in the State of Indiana?
Percentage of Households with Income Above $200,000 in Indiana is 6.7%.
What is the Percentage of Households with Income Above $200,000 in the United States?
Percentage of Households with Income Above $200,000 in the United States is 11.4%.