Zip Codes with the Highest Percentage of Households with Income Above $200,000 in Missouri
RELATED REPORTS & OPTIONS
Household Income | $200k+
Missouri
Compare Zip Codes
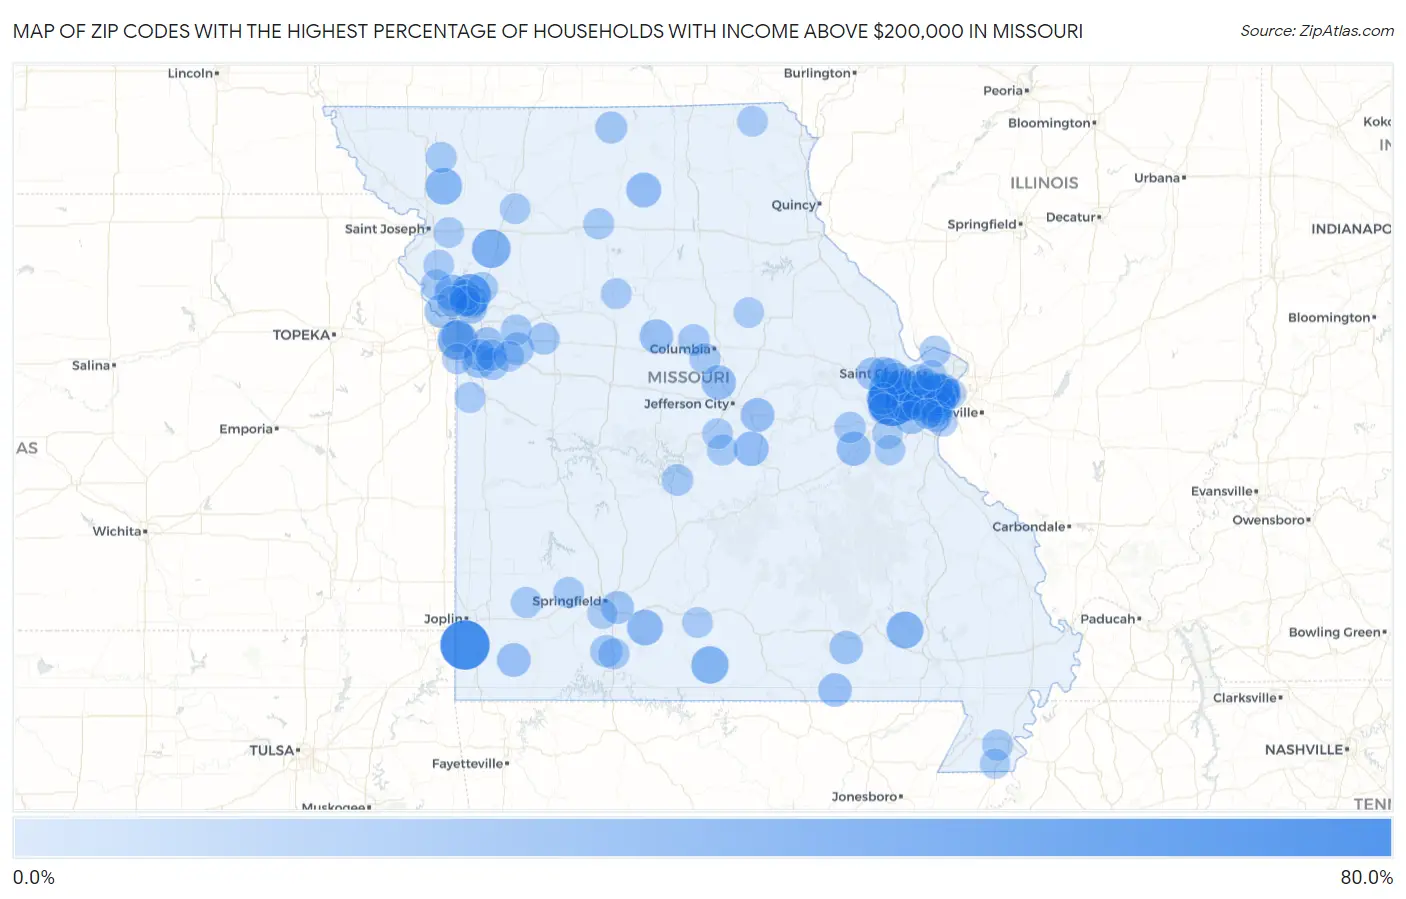
Map of Zip Codes with the Highest Percentage of Households with Income Above $200,000 in Missouri
0.0%
80.0%
Zip Codes with the Highest Percentage of Households with Income Above $200,000 in Missouri
| Zip Code | Households with Income > $200k | vs State | vs National | |
| 1. | 63073 | 74.0% | 7.3%(+66.7)#1 | 11.4%(+62.6)#44 |
| 2. | 64858 | 73.2% | 7.3%(+65.9)#2 | 11.4%(+61.8)#47 |
| 3. | 63131 | 51.5% | 7.3%(+44.2)#3 | 11.4%(+40.1)#243 |
| 4. | 64167 | 48.5% | 7.3%(+41.2)#4 | 11.4%(+37.1)#315 |
| 5. | 63124 | 47.0% | 7.3%(+39.7)#5 | 11.4%(+35.6)#360 |
| 6. | 63005 | 44.9% | 7.3%(+37.6)#6 | 11.4%(+33.5)#431 |
| 7. | 64113 | 41.0% | 7.3%(+33.7)#7 | 11.4%(+29.6)#601 |
| 8. | 64493 | 38.0% | 7.3%(+30.7)#8 | 11.4%(+26.6)#773 |
| 9. | 63038 | 37.9% | 7.3%(+30.6)#9 | 11.4%(+26.5)#779 |
| 10. | 65618 | 33.9% | 7.3%(+26.6)#10 | 11.4%(+22.5)#1,077 |
| 11. | 63341 | 33.5% | 7.3%(+26.2)#11 | 11.4%(+22.1)#1,112 |
| 12. | 63952 | 32.5% | 7.3%(+25.2)#12 | 11.4%(+21.1)#1,212 |
| 13. | 63017 | 31.8% | 7.3%(+24.5)#13 | 11.4%(+20.4)#1,257 |
| 14. | 64480 | 31.7% | 7.3%(+24.4)#14 | 11.4%(+20.3)#1,281 |
| 15. | 63105 | 31.0% | 7.3%(+23.7)#15 | 11.4%(+19.6)#1,350 |
| 16. | 63127 | 31.0% | 7.3%(+23.7)#16 | 11.4%(+19.6)#1,352 |
| 17. | 63141 | 29.8% | 7.3%(+22.5)#17 | 11.4%(+18.4)#1,485 |
| 18. | 65620 | 28.8% | 7.3%(+21.5)#18 | 11.4%(+17.4)#1,619 |
| 19. | 64164 | 28.0% | 7.3%(+20.7)#19 | 11.4%(+16.6)#1,737 |
| 20. | 63566 | 25.8% | 7.3%(+18.5)#20 | 11.4%(+14.4)#2,058 |
| 21. | 63122 | 25.0% | 7.3%(+17.7)#21 | 11.4%(+13.6)#2,184 |
| 22. | 65001 | 25.0% | 7.3%(+17.7)#22 | 11.4%(+13.6)#2,201 |
| 23. | 65039 | 24.2% | 7.3%(+16.9)#23 | 11.4%(+12.8)#2,341 |
| 24. | 63079 | 23.4% | 7.3%(+16.1)#24 | 11.4%(+12.0)#2,488 |
| 25. | 63011 | 22.7% | 7.3%(+15.4)#25 | 11.4%(+11.3)#2,619 |
| 26. | 65054 | 22.6% | 7.3%(+15.3)#26 | 11.4%(+11.2)#2,668 |
| 27. | 65250 | 22.6% | 7.3%(+15.3)#27 | 11.4%(+11.2)#2,672 |
| 28. | 64842 | 22.4% | 7.3%(+15.1)#28 | 11.4%(+11.0)#2,707 |
| 29. | 63040 | 22.2% | 7.3%(+14.9)#29 | 11.4%(+10.8)#2,737 |
| 30. | 64157 | 22.0% | 7.3%(+14.7)#30 | 11.4%(+10.6)#2,778 |
| 31. | 65690 | 21.8% | 7.3%(+14.5)#31 | 11.4%(+10.4)#2,837 |
| 32. | 64082 | 21.6% | 7.3%(+14.3)#32 | 11.4%(+10.2)#2,871 |
| 33. | 64152 | 21.4% | 7.3%(+14.1)#33 | 11.4%(+10.00)#2,901 |
| 34. | 63367 | 21.2% | 7.3%(+13.9)#34 | 11.4%(+9.80)#2,961 |
| 35. | 63941 | 20.8% | 7.3%(+13.5)#35 | 11.4%(+9.40)#3,097 |
| 36. | 63117 | 20.5% | 7.3%(+13.2)#36 | 11.4%(+9.10)#3,161 |
| 37. | 63025 | 20.3% | 7.3%(+13.0)#37 | 11.4%(+8.90)#3,204 |
| 38. | 64064 | 20.1% | 7.3%(+12.8)#38 | 11.4%(+8.70)#3,256 |
| 39. | 63304 | 19.5% | 7.3%(+12.2)#39 | 11.4%(+8.10)#3,421 |
| 40. | 65809 | 19.5% | 7.3%(+12.2)#40 | 11.4%(+8.10)#3,438 |
| 41. | 64112 | 19.2% | 7.3%(+11.9)#41 | 11.4%(+7.80)#3,517 |
| 42. | 64011 | 19.0% | 7.3%(+11.7)#42 | 11.4%(+7.60)#3,572 |
| 43. | 63348 | 18.7% | 7.3%(+11.4)#43 | 11.4%(+7.30)#3,652 |
| 44. | 63130 | 18.1% | 7.3%(+10.8)#44 | 11.4%(+6.70)#3,812 |
| 45. | 63119 | 17.9% | 7.3%(+10.6)#45 | 11.4%(+6.50)#3,873 |
| 46. | 63021 | 17.6% | 7.3%(+10.3)#46 | 11.4%(+6.20)#3,955 |
| 47. | 65754 | 17.6% | 7.3%(+10.3)#47 | 11.4%(+6.20)#3,992 |
| 48. | 64034 | 17.3% | 7.3%(+10.0)#48 | 11.4%(+5.90)#4,079 |
| 49. | 64158 | 17.2% | 7.3%(+9.90)#49 | 11.4%(+5.80)#4,120 |
| 50. | 64081 | 17.1% | 7.3%(+9.80)#50 | 11.4%(+5.70)#4,148 |
| 51. | 64655 | 16.9% | 7.3%(+9.60)#51 | 11.4%(+5.50)#4,243 |
| 52. | 63368 | 16.4% | 7.3%(+9.10)#52 | 11.4%(+5.00)#4,403 |
| 53. | 63332 | 16.4% | 7.3%(+9.10)#53 | 11.4%(+5.00)#4,430 |
| 54. | 64071 | 16.4% | 7.3%(+9.10)#54 | 11.4%(+5.00)#4,436 |
| 55. | 63126 | 15.8% | 7.3%(+8.50)#55 | 11.4%(+4.40)#4,653 |
| 56. | 63144 | 15.5% | 7.3%(+8.20)#56 | 11.4%(+4.10)#4,769 |
| 57. | 65279 | 15.4% | 7.3%(+8.10)#57 | 11.4%(+4.00)#4,822 |
| 58. | 64166 | 15.4% | 7.3%(+8.10)#58 | 11.4%(+4.00)#4,831 |
| 59. | 63132 | 15.2% | 7.3%(+7.90)#59 | 11.4%(+3.80)#4,897 |
| 60. | 65052 | 15.1% | 7.3%(+7.80)#60 | 11.4%(+3.70)#4,955 |
| 61. | 63303 | 15.0% | 7.3%(+7.70)#61 | 11.4%(+3.60)#4,973 |
| 62. | 64086 | 14.8% | 7.3%(+7.50)#62 | 11.4%(+3.40)#5,079 |
| 63. | 63013 | 14.8% | 7.3%(+7.50)#63 | 11.4%(+3.40)#5,102 |
| 64. | 63128 | 14.7% | 7.3%(+7.40)#64 | 11.4%(+3.30)#5,122 |
| 65. | 63385 | 14.4% | 7.3%(+7.10)#65 | 11.4%(+3.00)#5,250 |
| 66. | 65630 | 14.3% | 7.3%(+7.00)#66 | 11.4%(+2.90)#5,334 |
| 67. | 63826 | 14.0% | 7.3%(+6.70)#67 | 11.4%(+2.60)#5,505 |
| 68. | 64156 | 13.8% | 7.3%(+6.50)#68 | 11.4%(+2.40)#5,581 |
| 69. | 65604 | 13.8% | 7.3%(+6.50)#69 | 11.4%(+2.40)#5,586 |
| 70. | 64079 | 13.7% | 7.3%(+6.40)#70 | 11.4%(+2.30)#5,631 |
| 71. | 65075 | 13.7% | 7.3%(+6.40)#71 | 11.4%(+2.30)#5,657 |
| 72. | 64074 | 13.7% | 7.3%(+6.40)#72 | 11.4%(+2.30)#5,660 |
| 73. | 64848 | 13.7% | 7.3%(+6.40)#73 | 11.4%(+2.30)#5,661 |
| 74. | 65203 | 13.6% | 7.3%(+6.30)#74 | 11.4%(+2.20)#5,669 |
| 75. | 64060 | 13.5% | 7.3%(+6.20)#75 | 11.4%(+2.10)#5,744 |
| 76. | 63373 | 13.5% | 7.3%(+6.20)#76 | 11.4%(+2.10)#5,769 |
| 77. | 64688 | 13.4% | 7.3%(+6.10)#77 | 11.4%(+2.00)#5,832 |
| 78. | 64434 | 13.4% | 7.3%(+6.10)#78 | 11.4%(+2.00)#5,833 |
| 79. | 63055 | 13.3% | 7.3%(+6.00)#79 | 11.4%(+1.90)#5,873 |
| 80. | 64070 | 13.1% | 7.3%(+5.80)#80 | 11.4%(+1.70)#5,975 |
| 81. | 64746 | 13.1% | 7.3%(+5.80)#81 | 11.4%(+1.70)#5,985 |
| 82. | 65040 | 13.1% | 7.3%(+5.80)#82 | 11.4%(+1.70)#5,986 |
| 83. | 65344 | 13.0% | 7.3%(+5.70)#83 | 11.4%(+1.60)#6,059 |
| 84. | 63432 | 12.9% | 7.3%(+5.60)#84 | 11.4%(+1.50)#6,111 |
| 85. | 64439 | 12.7% | 7.3%(+5.40)#85 | 11.4%(+1.30)#6,229 |
| 86. | 65702 | 12.7% | 7.3%(+5.40)#86 | 11.4%(+1.30)#6,244 |
| 87. | 64620 | 12.6% | 7.3%(+5.30)#87 | 11.4%(+1.20)#6,312 |
| 88. | 64443 | 12.5% | 7.3%(+5.20)#88 | 11.4%(+1.10)#6,375 |
| 89. | 64145 | 12.4% | 7.3%(+5.10)#89 | 11.4%(+1.000)#6,428 |
| 90. | 63129 | 12.3% | 7.3%(+5.00)#90 | 11.4%(+0.900)#6,458 |
| 91. | 65285 | 12.1% | 7.3%(+4.80)#91 | 11.4%(+0.700)#6,646 |
| 92. | 63146 | 12.0% | 7.3%(+4.70)#92 | 11.4%(+0.600)#6,666 |
| 93. | 64154 | 12.0% | 7.3%(+4.70)#93 | 11.4%(+0.600)#6,678 |
| 94. | 63072 | 12.0% | 7.3%(+4.70)#94 | 11.4%(+0.600)#6,688 |
| 95. | 63108 | 11.9% | 7.3%(+4.60)#95 | 11.4%(+0.500)#6,732 |
| 96. | 63026 | 11.8% | 7.3%(+4.50)#96 | 11.4%(+0.400)#6,788 |
| 97. | 65810 | 11.8% | 7.3%(+4.50)#97 | 11.4%(+0.400)#6,802 |
| 98. | 63041 | 11.8% | 7.3%(+4.50)#98 | 11.4%(+0.400)#6,837 |
| 99. | 63853 | 11.7% | 7.3%(+4.40)#99 | 11.4%(+0.300)#6,921 |
| 100. | 63044 | 11.5% | 7.3%(+4.20)#100 | 11.4%(+0.100)#7,028 |
Common Questions
What are the Top 10 Zip Codes with the Highest Percentage of Households with Income Above $200,000 in Missouri?
Top 10 Zip Codes with the Highest Percentage of Households with Income Above $200,000 in Missouri are:
What zip code has the Highest Percentage of Households with Income Above $200,000 in Missouri?
63073 has the Highest Percentage of Households with Income Above $200,000 in Missouri with 74.0%.
What is the Percentage of Households with Income Above $200,000 in the State of Missouri?
Percentage of Households with Income Above $200,000 in Missouri is 7.3%.
What is the Percentage of Households with Income Above $200,000 in the United States?
Percentage of Households with Income Above $200,000 in the United States is 11.4%.