Zip Codes with the Highest Percentage of Households with Income Above $200,000 in Kentucky
RELATED REPORTS & OPTIONS
Household Income | $200k+
Kentucky
Compare Zip Codes
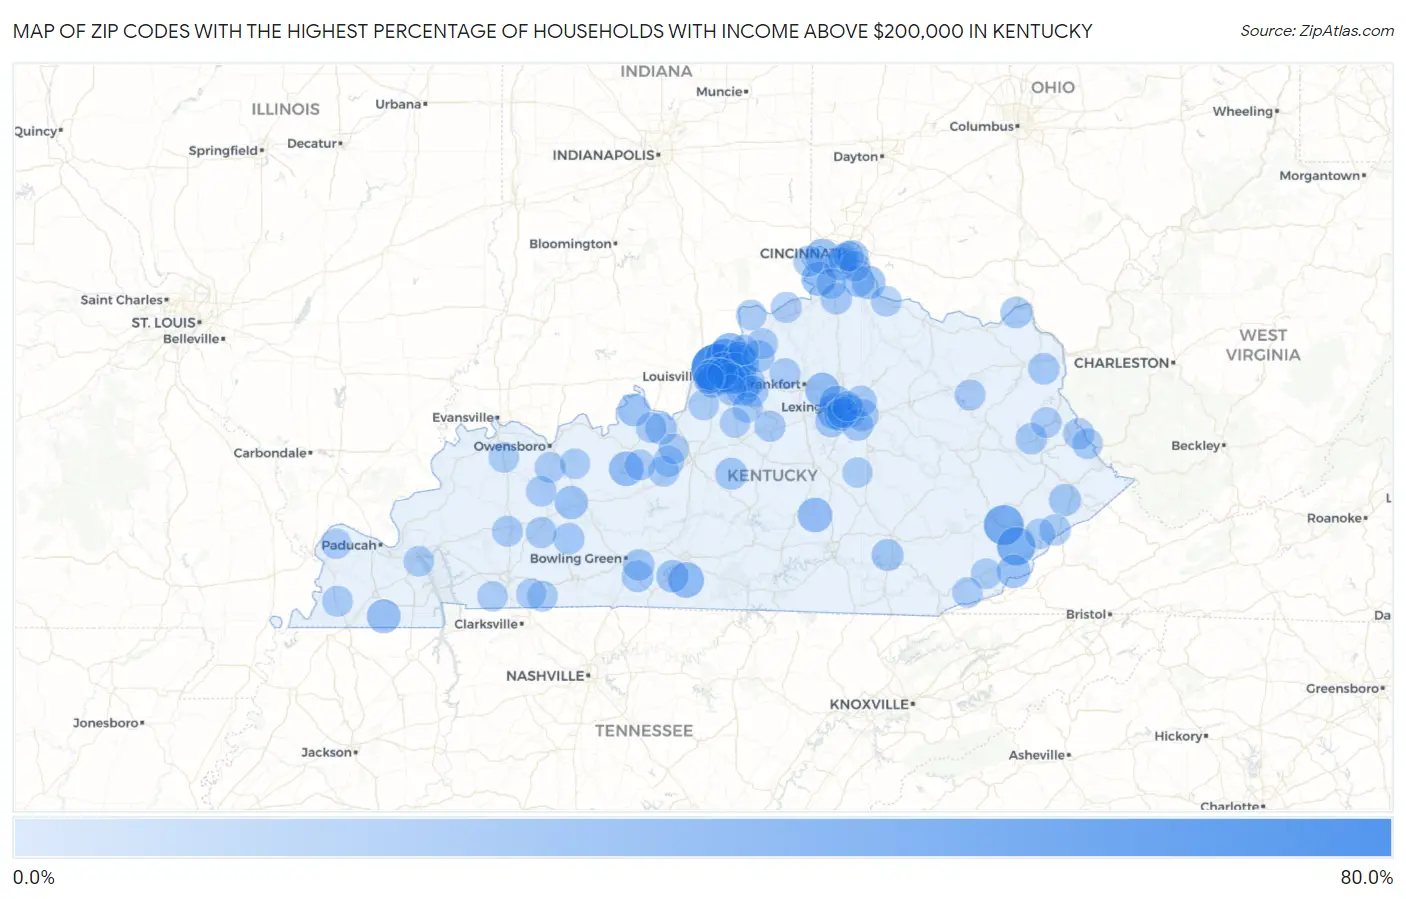
Map of Zip Codes with the Highest Percentage of Households with Income Above $200,000 in Kentucky
0.0%
80.0%
Zip Codes with the Highest Percentage of Households with Income Above $200,000 in Kentucky
| Zip Code | Households with Income > $200k | vs State | vs National | |
| 1. | 40025 | 76.4% | 6.0%(+70.4)#1 | 11.4%(+65.0)#40 |
| 2. | 41751 | 41.4% | 6.0%(+35.4)#2 | 11.4%(+30.0)#578 |
| 3. | 40059 | 39.7% | 6.0%(+33.7)#3 | 11.4%(+28.3)#663 |
| 4. | 41821 | 36.6% | 6.0%(+30.6)#4 | 11.4%(+25.2)#871 |
| 5. | 40026 | 28.7% | 6.0%(+22.7)#5 | 11.4%(+17.3)#1,623 |
| 6. | 40513 | 27.7% | 6.0%(+21.7)#6 | 11.4%(+16.3)#1,777 |
| 7. | 42131 | 26.0% | 6.0%(+20.0)#7 | 11.4%(+14.6)#2,035 |
| 8. | 40245 | 25.5% | 6.0%(+19.5)#8 | 11.4%(+14.1)#2,096 |
| 9. | 40014 | 24.9% | 6.0%(+18.9)#9 | 11.4%(+13.5)#2,209 |
| 10. | 41048 | 23.8% | 6.0%(+17.8)#10 | 11.4%(+12.4)#2,410 |
| 11. | 40152 | 23.1% | 6.0%(+17.1)#11 | 11.4%(+11.7)#2,542 |
| 12. | 42566 | 22.8% | 6.0%(+16.8)#12 | 11.4%(+11.4)#2,616 |
| 13. | 40347 | 22.5% | 6.0%(+16.5)#13 | 11.4%(+11.1)#2,683 |
| 14. | 41091 | 22.0% | 6.0%(+16.0)#14 | 11.4%(+10.6)#2,776 |
| 15. | 40207 | 21.8% | 6.0%(+15.8)#15 | 11.4%(+10.4)#2,819 |
| 16. | 40010 | 21.5% | 6.0%(+15.5)#16 | 11.4%(+10.1)#2,892 |
| 17. | 42079 | 20.3% | 6.0%(+14.3)#17 | 11.4%(+8.90)#3,220 |
| 18. | 40510 | 19.6% | 6.0%(+13.6)#18 | 11.4%(+8.20)#3,410 |
| 19. | 40023 | 19.0% | 6.0%(+13.0)#19 | 11.4%(+7.60)#3,570 |
| 20. | 40927 | 18.9% | 6.0%(+12.9)#20 | 11.4%(+7.50)#3,603 |
| 21. | 41007 | 18.6% | 6.0%(+12.6)#21 | 11.4%(+7.20)#3,683 |
| 22. | 42354 | 18.3% | 6.0%(+12.3)#22 | 11.4%(+6.90)#3,768 |
| 23. | 40502 | 17.7% | 6.0%(+11.7)#23 | 11.4%(+6.30)#3,938 |
| 24. | 41017 | 17.0% | 6.0%(+11.0)#24 | 11.4%(+5.60)#4,180 |
| 25. | 40241 | 16.9% | 6.0%(+10.9)#25 | 11.4%(+5.50)#4,221 |
| 26. | 40157 | 16.3% | 6.0%(+10.3)#26 | 11.4%(+4.90)#4,471 |
| 27. | 42156 | 16.1% | 6.0%(+10.1)#27 | 11.4%(+4.70)#4,546 |
| 28. | 40205 | 16.0% | 6.0%(+10.00)#28 | 11.4%(+4.60)#4,562 |
| 29. | 40223 | 15.0% | 6.0%(+9.00)#29 | 11.4%(+3.60)#4,983 |
| 30. | 40339 | 14.6% | 6.0%(+8.60)#30 | 11.4%(+3.20)#5,205 |
| 31. | 40509 | 14.4% | 6.0%(+8.40)#31 | 11.4%(+3.00)#5,252 |
| 32. | 41560 | 14.1% | 6.0%(+8.10)#32 | 11.4%(+2.70)#5,450 |
| 33. | 40056 | 14.0% | 6.0%(+8.00)#33 | 11.4%(+2.60)#5,485 |
| 34. | 40067 | 13.8% | 6.0%(+7.80)#34 | 11.4%(+2.40)#5,582 |
| 35. | 40052 | 13.8% | 6.0%(+7.80)#35 | 11.4%(+2.40)#5,599 |
| 36. | 40737 | 13.5% | 6.0%(+7.50)#36 | 11.4%(+2.10)#5,762 |
| 37. | 40514 | 13.4% | 6.0%(+7.40)#37 | 11.4%(+2.00)#5,795 |
| 38. | 41075 | 13.2% | 6.0%(+7.20)#38 | 11.4%(+1.80)#5,907 |
| 39. | 40068 | 13.0% | 6.0%(+7.00)#39 | 11.4%(+1.60)#6,035 |
| 40. | 40117 | 13.0% | 6.0%(+7.00)#40 | 11.4%(+1.60)#6,038 |
| 41. | 40222 | 12.9% | 6.0%(+6.90)#41 | 11.4%(+1.50)#6,081 |
| 42. | 42122 | 12.8% | 6.0%(+6.80)#42 | 11.4%(+1.40)#6,153 |
| 43. | 40515 | 12.7% | 6.0%(+6.70)#43 | 11.4%(+1.30)#6,198 |
| 44. | 42103 | 12.6% | 6.0%(+6.60)#44 | 11.4%(+1.20)#6,272 |
| 45. | 41001 | 12.5% | 6.0%(+6.50)#45 | 11.4%(+1.10)#6,341 |
| 46. | 41174 | 12.4% | 6.0%(+6.40)#46 | 11.4%(+1.000)#6,446 |
| 47. | 41168 | 12.2% | 6.0%(+6.20)#47 | 11.4%(+0.800)#6,551 |
| 48. | 40022 | 12.2% | 6.0%(+6.20)#48 | 11.4%(+0.800)#6,570 |
| 49. | 41256 | 12.0% | 6.0%(+6.00)#49 | 11.4%(+0.600)#6,696 |
| 50. | 42339 | 12.0% | 6.0%(+6.00)#50 | 11.4%(+0.600)#6,703 |
| 51. | 40243 | 11.7% | 6.0%(+5.70)#51 | 11.4%(+0.300)#6,872 |
| 52. | 41030 | 11.7% | 6.0%(+5.70)#52 | 11.4%(+0.300)#6,881 |
| 53. | 41810 | 11.4% | 6.0%(+5.40)#53 | 11.4%(=0.000)#7,133 |
| 54. | 41203 | 11.2% | 6.0%(+5.20)#54 | 11.4%(-0.200)#7,287 |
| 55. | 40516 | 11.0% | 6.0%(+5.00)#55 | 11.4%(-0.400)#7,451 |
| 56. | 42345 | 10.8% | 6.0%(+4.80)#56 | 11.4%(-0.600)#7,549 |
| 57. | 41080 | 10.8% | 6.0%(+4.80)#57 | 11.4%(-0.600)#7,574 |
| 58. | 40503 | 10.5% | 6.0%(+4.50)#58 | 11.4%(-0.900)#7,781 |
| 59. | 40012 | 10.5% | 6.0%(+4.50)#59 | 11.4%(-0.900)#7,835 |
| 60. | 42724 | 10.3% | 6.0%(+4.30)#60 | 11.4%(-1.10)#7,990 |
| 61. | 42442 | 10.2% | 6.0%(+4.20)#61 | 11.4%(-1.20)#8,093 |
| 62. | 40003 | 10.1% | 6.0%(+4.10)#62 | 11.4%(-1.30)#8,200 |
| 63. | 41045 | 10.1% | 6.0%(+4.10)#63 | 11.4%(-1.30)#8,207 |
| 64. | 40070 | 10.1% | 6.0%(+4.10)#64 | 11.4%(-1.30)#8,219 |
| 65. | 42732 | 10.0% | 6.0%(+4.00)#65 | 11.4%(-1.40)#8,296 |
| 66. | 40313 | 9.9% | 6.0%(+3.90)#66 | 11.4%(-1.50)#8,391 |
| 67. | 41231 | 9.9% | 6.0%(+3.90)#67 | 11.4%(-1.50)#8,411 |
| 68. | 40142 | 9.8% | 6.0%(+3.80)#68 | 11.4%(-1.60)#8,494 |
| 69. | 41011 | 9.7% | 6.0%(+3.70)#69 | 11.4%(-1.70)#8,554 |
| 70. | 40145 | 9.7% | 6.0%(+3.70)#70 | 11.4%(-1.70)#8,604 |
| 71. | 40299 | 9.5% | 6.0%(+3.50)#71 | 11.4%(-1.90)#8,715 |
| 72. | 41076 | 9.5% | 6.0%(+3.50)#72 | 11.4%(-1.90)#8,734 |
| 73. | 42376 | 9.5% | 6.0%(+3.50)#73 | 11.4%(-1.90)#8,757 |
| 74. | 42031 | 9.5% | 6.0%(+3.50)#74 | 11.4%(-1.90)#8,774 |
| 75. | 42350 | 9.1% | 6.0%(+3.10)#75 | 11.4%(-2.30)#9,177 |
| 76. | 41232 | 9.1% | 6.0%(+3.10)#76 | 11.4%(-2.30)#9,186 |
| 77. | 40206 | 9.0% | 6.0%(+3.00)#77 | 11.4%(-2.40)#9,226 |
| 78. | 40242 | 9.0% | 6.0%(+3.00)#78 | 11.4%(-2.40)#9,235 |
| 79. | 42234 | 9.0% | 6.0%(+3.00)#79 | 11.4%(-2.40)#9,266 |
| 80. | 40806 | 9.0% | 6.0%(+3.00)#80 | 11.4%(-2.40)#9,279 |
| 81. | 41094 | 8.9% | 6.0%(+2.90)#81 | 11.4%(-2.50)#9,332 |
| 82. | 42044 | 8.9% | 6.0%(+2.90)#82 | 11.4%(-2.50)#9,360 |
| 83. | 41071 | 8.8% | 6.0%(+2.80)#83 | 11.4%(-2.60)#9,434 |
| 84. | 40109 | 8.8% | 6.0%(+2.80)#84 | 11.4%(-2.60)#9,473 |
| 85. | 42236 | 8.8% | 6.0%(+2.80)#85 | 11.4%(-2.60)#9,488 |
| 86. | 40031 | 8.7% | 6.0%(+2.70)#86 | 11.4%(-2.70)#9,530 |
| 87. | 40071 | 8.7% | 6.0%(+2.70)#87 | 11.4%(-2.70)#9,545 |
| 88. | 40204 | 8.7% | 6.0%(+2.70)#88 | 11.4%(-2.70)#9,548 |
| 89. | 40045 | 8.7% | 6.0%(+2.70)#89 | 11.4%(-2.70)#9,581 |
| 90. | 41043 | 8.6% | 6.0%(+2.60)#90 | 11.4%(-2.80)#9,705 |
| 91. | 42378 | 8.5% | 6.0%(+2.50)#91 | 11.4%(-2.90)#9,798 |
| 92. | 42056 | 8.5% | 6.0%(+2.50)#92 | 11.4%(-2.90)#9,817 |
| 93. | 42452 | 8.4% | 6.0%(+2.40)#93 | 11.4%(-3.00)#9,932 |
| 94. | 41815 | 8.4% | 6.0%(+2.40)#94 | 11.4%(-3.00)#9,958 |
| 95. | 40863 | 8.4% | 6.0%(+2.40)#95 | 11.4%(-3.00)#9,966 |
| 96. | 40162 | 8.3% | 6.0%(+2.30)#96 | 11.4%(-3.10)#10,035 |
| 97. | 40507 | 8.2% | 6.0%(+2.20)#97 | 11.4%(-3.20)#10,163 |
| 98. | 42286 | 8.2% | 6.0%(+2.20)#98 | 11.4%(-3.20)#10,168 |
| 99. | 40013 | 8.1% | 6.0%(+2.10)#99 | 11.4%(-3.30)#10,269 |
| 100. | 40461 | 8.1% | 6.0%(+2.10)#100 | 11.4%(-3.30)#10,293 |
Common Questions
What are the Top 10 Zip Codes with the Highest Percentage of Households with Income Above $200,000 in Kentucky?
Top 10 Zip Codes with the Highest Percentage of Households with Income Above $200,000 in Kentucky are:
What zip code has the Highest Percentage of Households with Income Above $200,000 in Kentucky?
40025 has the Highest Percentage of Households with Income Above $200,000 in Kentucky with 76.4%.
What is the Percentage of Households with Income Above $200,000 in the State of Kentucky?
Percentage of Households with Income Above $200,000 in Kentucky is 6.0%.
What is the Percentage of Households with Income Above $200,000 in the United States?
Percentage of Households with Income Above $200,000 in the United States is 11.4%.