Cities with the Highest Percentage of Population Employed in Personal Care and Service in Maryland
RELATED REPORTS & OPTIONS
Personal Care and Service
Maryland
Compare Cities
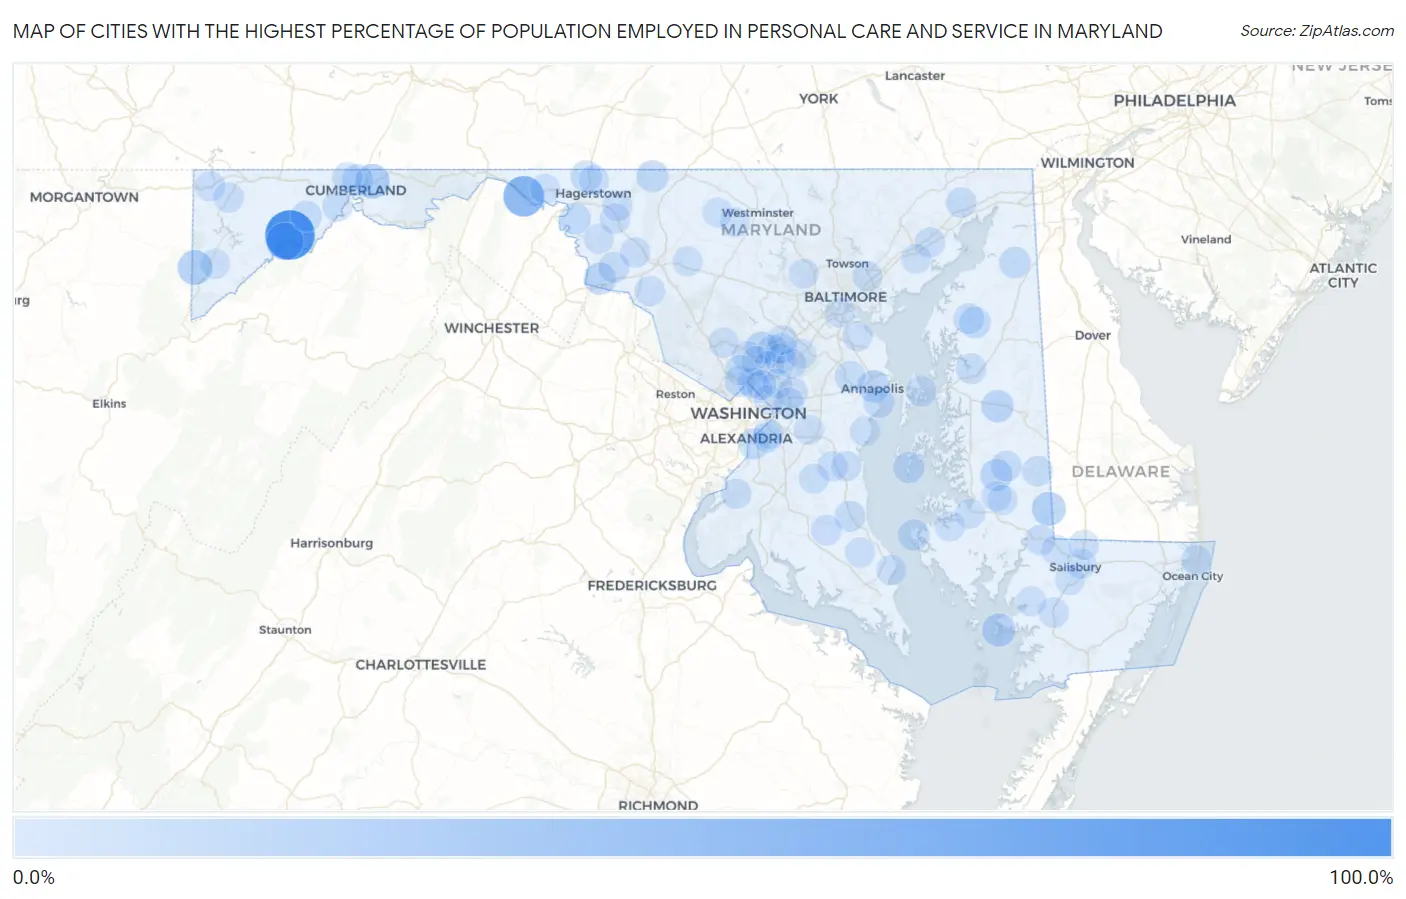
Map of Cities with the Highest Percentage of Population Employed in Personal Care and Service in Maryland
0.0%
100.0%
Cities with the Highest Percentage of Population Employed in Personal Care and Service in Maryland
| City | % Employed | vs State | vs National | |
| 1. | Franklin | 100.0% | 2.6%(+97.4)#1 | 2.6%(+97.4)#1 |
| 2. | Ernstville | 55.0% | 2.6%(+52.4)#2 | 2.6%(+52.4)#35 |
| 3. | Bloomington | 38.7% | 2.6%(+36.1)#3 | 2.6%(+36.1)#67 |
| 4. | Crellin | 24.8% | 2.6%(+22.2)#4 | 2.6%(+22.2)#164 |
| 5. | Pleasant Grove | 24.3% | 2.6%(+21.6)#5 | 2.6%(+21.7)#169 |
| 6. | Galestown | 21.4% | 2.6%(+18.8)#6 | 2.6%(+18.9)#225 |
| 7. | Deal Island | 17.9% | 2.6%(+15.2)#7 | 2.6%(+15.3)#310 |
| 8. | Naval Academy | 14.4% | 2.6%(+11.7)#8 | 2.6%(+11.8)#460 |
| 9. | Hillsboro | 14.0% | 2.6%(+11.4)#9 | 2.6%(+11.4)#490 |
| 10. | Garretts Mill | 13.2% | 2.6%(+10.6)#10 | 2.6%(+10.6)#543 |
| 11. | Choptank | 13.0% | 2.6%(+10.4)#11 | 2.6%(+10.5)#557 |
| 12. | Sabillasville | 12.2% | 2.6%(+9.54)#12 | 2.6%(+9.60)#641 |
| 13. | Spencerville | 12.1% | 2.6%(+9.45)#13 | 2.6%(+9.51)#658 |
| 14. | Callaway | 11.6% | 2.6%(+8.99)#14 | 2.6%(+9.05)#704 |
| 15. | Taylors Island | 10.4% | 2.6%(+7.80)#15 | 2.6%(+7.85)#857 |
| 16. | Cecilton | 10.2% | 2.6%(+7.63)#16 | 2.6%(+7.68)#883 |
| 17. | Tilghman Island | 10.2% | 2.6%(+7.60)#17 | 2.6%(+7.66)#893 |
| 18. | Downsville | 10.1% | 2.6%(+7.50)#18 | 2.6%(+7.55)#911 |
| 19. | National Harbor | 9.7% | 2.6%(+7.03)#19 | 2.6%(+7.09)#997 |
| 20. | Maugansville | 9.6% | 2.6%(+6.97)#20 | 2.6%(+7.03)#1,012 |
| 21. | Bowmans Addition | 9.5% | 2.6%(+6.86)#21 | 2.6%(+6.91)#1,035 |
| 22. | Kingstown | 9.4% | 2.6%(+6.80)#22 | 2.6%(+6.86)#1,049 |
| 23. | Lonaconing | 8.1% | 2.6%(+5.45)#23 | 2.6%(+5.50)#1,413 |
| 24. | North Chevy Chase | 7.7% | 2.6%(+5.10)#24 | 2.6%(+5.15)#1,534 |
| 25. | Crownsville | 7.5% | 2.6%(+4.87)#25 | 2.6%(+4.92)#1,638 |
| 26. | Preston | 7.2% | 2.6%(+4.63)#26 | 2.6%(+4.68)#1,714 |
| 27. | Burkittsville | 7.0% | 2.6%(+4.42)#27 | 2.6%(+4.48)#1,808 |
| 28. | Layhill | 7.0% | 2.6%(+4.37)#28 | 2.6%(+4.43)#1,833 |
| 29. | Chestertown | 6.9% | 2.6%(+4.24)#29 | 2.6%(+4.29)#1,915 |
| 30. | Federalsburg | 6.9% | 2.6%(+4.23)#30 | 2.6%(+4.29)#1,918 |
| 31. | Prince Frederick | 6.8% | 2.6%(+4.21)#31 | 2.6%(+4.27)#1,932 |
| 32. | Burtonsville | 6.7% | 2.6%(+4.05)#32 | 2.6%(+4.11)#1,999 |
| 33. | Highland Beach | 6.5% | 2.6%(+3.83)#33 | 2.6%(+3.89)#2,134 |
| 34. | Centreville | 6.3% | 2.6%(+3.70)#34 | 2.6%(+3.75)#2,225 |
| 35. | Cresaptown | 6.2% | 2.6%(+3.61)#35 | 2.6%(+3.67)#2,302 |
| 36. | Port Deposit | 6.1% | 2.6%(+3.50)#36 | 2.6%(+3.56)#2,377 |
| 37. | Corriganville | 6.1% | 2.6%(+3.44)#37 | 2.6%(+3.50)#2,425 |
| 38. | Golden Beach | 5.9% | 2.6%(+3.30)#38 | 2.6%(+3.35)#2,529 |
| 39. | Calverton | 5.9% | 2.6%(+3.25)#39 | 2.6%(+3.30)#2,574 |
| 40. | Chester | 5.8% | 2.6%(+3.17)#40 | 2.6%(+3.23)#2,651 |
| 41. | Konterra | 5.7% | 2.6%(+3.06)#41 | 2.6%(+3.12)#2,749 |
| 42. | West Laurel | 5.6% | 2.6%(+3.00)#42 | 2.6%(+3.05)#2,815 |
| 43. | Mount Lena | 5.6% | 2.6%(+2.97)#43 | 2.6%(+3.02)#2,832 |
| 44. | Burnt Mills | 5.4% | 2.6%(+2.81)#44 | 2.6%(+2.87)#2,978 |
| 45. | Lanham | 5.4% | 2.6%(+2.80)#45 | 2.6%(+2.85)#2,995 |
| 46. | Mardela Springs | 5.4% | 2.6%(+2.75)#46 | 2.6%(+2.81)#3,039 |
| 47. | Dunkirk | 5.1% | 2.6%(+2.50)#47 | 2.6%(+2.55)#3,310 |
| 48. | Middletown | 5.0% | 2.6%(+2.35)#48 | 2.6%(+2.40)#3,518 |
| 49. | Salisbury | 4.9% | 2.6%(+2.31)#49 | 2.6%(+2.37)#3,550 |
| 50. | Riverside | 4.9% | 2.6%(+2.27)#50 | 2.6%(+2.33)#3,605 |
| 51. | Accident | 4.9% | 2.6%(+2.24)#51 | 2.6%(+2.29)#3,659 |
| 52. | Princess Anne | 4.8% | 2.6%(+2.22)#52 | 2.6%(+2.28)#3,676 |
| 53. | Adamstown | 4.8% | 2.6%(+2.22)#53 | 2.6%(+2.28)#3,677 |
| 54. | Baltimore Highlands | 4.8% | 2.6%(+2.22)#54 | 2.6%(+2.28)#3,678 |
| 55. | Bryans Road | 4.7% | 2.6%(+2.12)#55 | 2.6%(+2.17)#3,801 |
| 56. | Baden | 4.7% | 2.6%(+2.10)#56 | 2.6%(+2.16)#3,828 |
| 57. | Brown Station | 4.7% | 2.6%(+2.09)#57 | 2.6%(+2.15)#3,838 |
| 58. | Overlea | 4.7% | 2.6%(+2.03)#58 | 2.6%(+2.09)#3,917 |
| 59. | Friendsville | 4.6% | 2.6%(+2.00)#59 | 2.6%(+2.05)#3,975 |
| 60. | Flower Hill | 4.6% | 2.6%(+1.95)#60 | 2.6%(+2.00)#4,054 |
| 61. | Takoma Park | 4.5% | 2.6%(+1.91)#61 | 2.6%(+1.97)#4,121 |
| 62. | Silver Spring | 4.5% | 2.6%(+1.90)#62 | 2.6%(+1.96)#4,135 |
| 63. | North Kensington | 4.5% | 2.6%(+1.84)#63 | 2.6%(+1.90)#4,222 |
| 64. | Woodlawn Cdp Prince George S County | 4.5% | 2.6%(+1.83)#64 | 2.6%(+1.89)#4,235 |
| 65. | Owings | 4.4% | 2.6%(+1.82)#65 | 2.6%(+1.88)#4,261 |
| 66. | New Windsor | 4.4% | 2.6%(+1.82)#66 | 2.6%(+1.87)#4,270 |
| 67. | Hebron | 4.3% | 2.6%(+1.69)#67 | 2.6%(+1.75)#4,462 |
| 68. | Cottage City | 4.3% | 2.6%(+1.67)#68 | 2.6%(+1.73)#4,495 |
| 69. | Edgewood | 4.3% | 2.6%(+1.66)#69 | 2.6%(+1.72)#4,512 |
| 70. | Broomes Island | 4.3% | 2.6%(+1.64)#70 | 2.6%(+1.69)#4,555 |
| 71. | Church Creek | 4.3% | 2.6%(+1.64)#71 | 2.6%(+1.69)#4,562 |
| 72. | Secretary | 4.2% | 2.6%(+1.63)#72 | 2.6%(+1.69)#4,574 |
| 73. | Redland | 4.2% | 2.6%(+1.59)#73 | 2.6%(+1.64)#4,652 |
| 74. | Delmar | 4.1% | 2.6%(+1.52)#74 | 2.6%(+1.57)#4,793 |
| 75. | Berwyn Heights | 4.1% | 2.6%(+1.51)#75 | 2.6%(+1.57)#4,800 |
| 76. | Keedysville | 4.1% | 2.6%(+1.51)#76 | 2.6%(+1.57)#4,806 |
| 77. | Pasadena | 4.1% | 2.6%(+1.48)#77 | 2.6%(+1.53)#4,869 |
| 78. | Clear Spring | 4.1% | 2.6%(+1.45)#78 | 2.6%(+1.51)#4,909 |
| 79. | Chesapeake Ranch Estates | 4.0% | 2.6%(+1.43)#79 | 2.6%(+1.48)#4,960 |
| 80. | Marlboro Village | 4.0% | 2.6%(+1.40)#80 | 2.6%(+1.45)#5,010 |
| 81. | Union Bridge | 4.0% | 2.6%(+1.37)#81 | 2.6%(+1.43)#5,075 |
| 82. | Colesville | 4.0% | 2.6%(+1.37)#82 | 2.6%(+1.43)#5,086 |
| 83. | Linganore | 4.0% | 2.6%(+1.34)#83 | 2.6%(+1.40)#5,126 |
| 84. | Langley Park | 3.9% | 2.6%(+1.30)#84 | 2.6%(+1.36)#5,202 |
| 85. | Mountain Lake Park | 3.9% | 2.6%(+1.29)#85 | 2.6%(+1.34)#5,261 |
| 86. | Marlow Heights | 3.9% | 2.6%(+1.28)#86 | 2.6%(+1.33)#5,293 |
| 87. | Randallstown | 3.9% | 2.6%(+1.27)#87 | 2.6%(+1.33)#5,301 |
| 88. | South Laurel | 3.8% | 2.6%(+1.23)#88 | 2.6%(+1.28)#5,390 |
| 89. | Mount Aetna | 3.8% | 2.6%(+1.23)#89 | 2.6%(+1.28)#5,398 |
| 90. | East New Market | 3.8% | 2.6%(+1.23)#90 | 2.6%(+1.28)#5,400 |
| 91. | Temple Hills | 3.8% | 2.6%(+1.23)#91 | 2.6%(+1.28)#5,412 |
| 92. | Ocean City | 3.8% | 2.6%(+1.23)#92 | 2.6%(+1.28)#5,413 |
| 93. | Cambridge | 3.8% | 2.6%(+1.21)#93 | 2.6%(+1.26)#5,458 |
| 94. | Shady Side | 3.8% | 2.6%(+1.18)#94 | 2.6%(+1.24)#5,507 |
| 95. | Fountainhead Orchard Hills | 3.7% | 2.6%(+1.13)#95 | 2.6%(+1.18)#5,650 |
| 96. | Glenarden | 3.7% | 2.6%(+1.12)#96 | 2.6%(+1.17)#5,675 |
| 97. | Mount Vernon | 3.7% | 2.6%(+1.11)#97 | 2.6%(+1.16)#5,695 |
| 98. | Scaggsville | 3.7% | 2.6%(+1.10)#98 | 2.6%(+1.15)#5,716 |
| 99. | Fruitland | 3.7% | 2.6%(+1.09)#99 | 2.6%(+1.14)#5,736 |
| 100. | Maryland City | 3.7% | 2.6%(+1.08)#100 | 2.6%(+1.14)#5,771 |
Common Questions
What are the Top 10 Cities with the Highest Percentage of Population Employed in Personal Care and Service in Maryland?
Top 10 Cities with the Highest Percentage of Population Employed in Personal Care and Service in Maryland are:
#1
100.0%
#2
55.0%
#3
38.7%
#4
24.8%
#5
24.3%
#6
21.4%
#7
17.9%
#8
14.4%
#9
14.0%
#10
13.2%
What city has the Highest Percentage of Population Employed in Personal Care and Service in Maryland?
Franklin has the Highest Percentage of Population Employed in Personal Care and Service in Maryland with 100.0%.
What is the Percentage of Population Employed in Personal Care and Service in the State of Maryland?
Percentage of Population Employed in Personal Care and Service in Maryland is 2.6%.
What is the Percentage of Population Employed in Personal Care and Service in the United States?
Percentage of Population Employed in Personal Care and Service in the United States is 2.6%.