Secretary, MD Map & Demographics
Secretary Map
Secretary Overview
$25,755
PER CAPITA INCOME
$76,932
AVG FAMILY INCOME
$66,458
AVG HOUSEHOLD INCOME
3.2%
WAGE / INCOME GAP [ % ]
96.8¢/ $1
WAGE / INCOME GAP [ $ ]
0.35
INEQUALITY / GINI INDEX
642
TOTAL POPULATION
325
MALE POPULATION
317
FEMALE POPULATION
102.52
MALES / 100 FEMALES
97.54
FEMALES / 100 MALES
32.8
MEDIAN AGE
3.7
AVG FAMILY SIZE
3.0
AVG HOUSEHOLD SIZE
331
LABOR FORCE [ PEOPLE ]
74.9%
PERCENT IN LABOR FORCE
7.6%
UNEMPLOYMENT RATE
Secretary Zip Codes
Secretary Area Codes
Income in Secretary
Income Overview in Secretary
Per Capita Income in Secretary is $25,755, while median incomes of families and households are $76,932 and $66,458 respectively.
| Characteristic | Number | Measure |
| Per Capita Income | 642 | $25,755 |
| Median Family Income | 139 | $76,932 |
| Mean Family Income | 139 | $88,871 |
| Median Household Income | 214 | $66,458 |
| Mean Household Income | 214 | $76,289 |
| Income Deficit | 139 | $0 |
| Wage / Income Gap (%) | 642 | 3.25% |
| Wage / Income Gap ($) | 642 | 96.75¢ per $1 |
| Gini / Inequality Index | 642 | 0.35 |
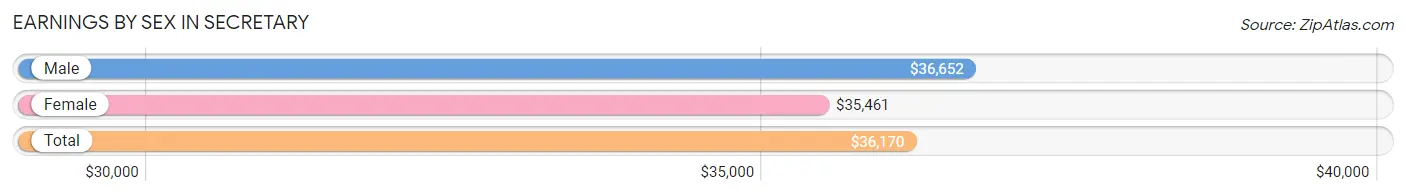
Earnings by Sex in Secretary
Average Earnings in Secretary are $36,170, $36,652 for men and $35,461 for women, a difference of 3.3%.
| Sex | Number | Average Earnings |
| Male | 183 (56.5%) | $36,652 |
| Female | 141 (43.5%) | $35,461 |
| Total | 324 (100.0%) | $36,170 |
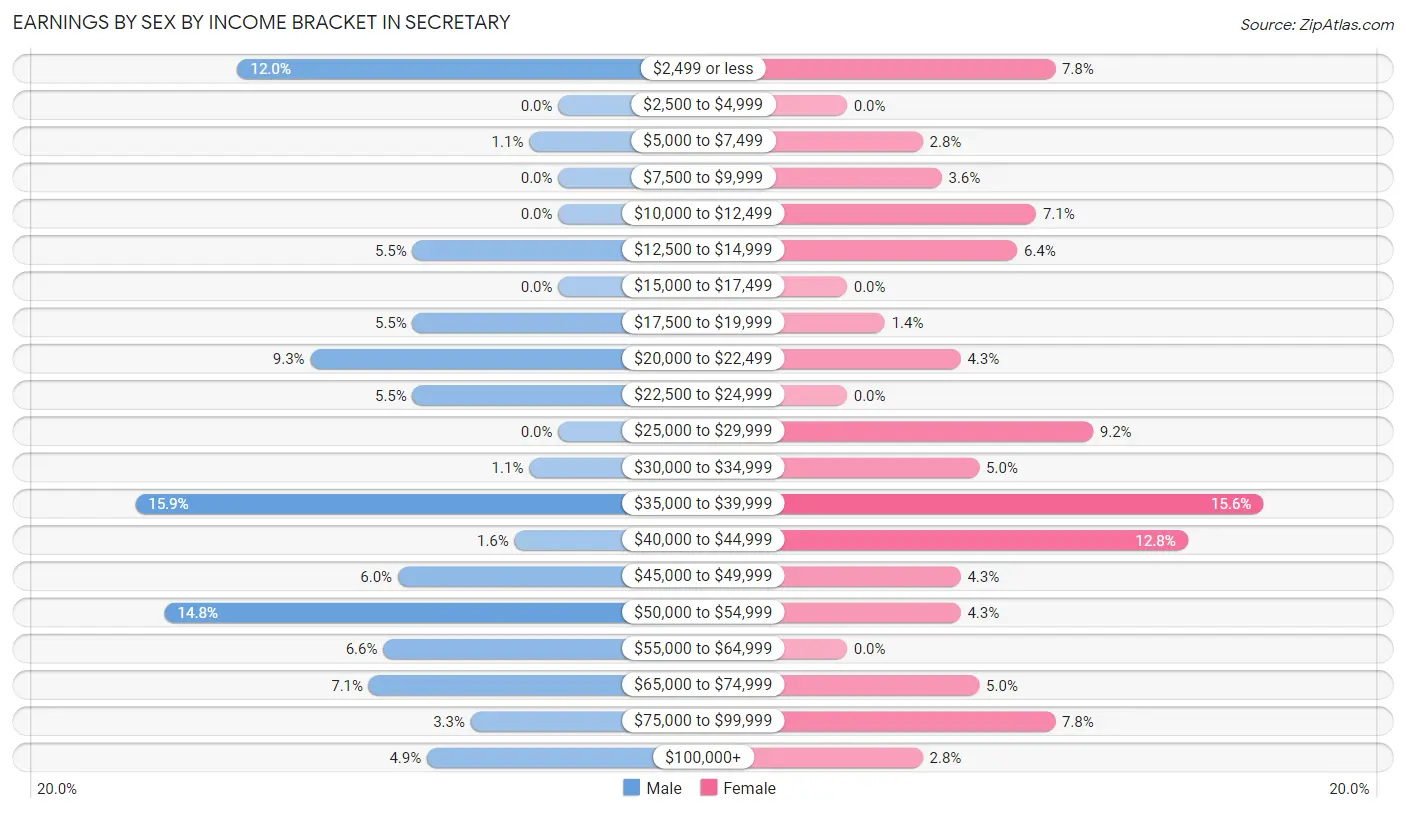
Earnings by Sex by Income Bracket in Secretary
The most common earnings brackets in Secretary are $35,000 to $39,999 for men (29 | 15.9%) and $35,000 to $39,999 for women (22 | 15.6%).
| Income | Male | Female |
| $2,499 or less | 22 (12.0%) | 11 (7.8%) |
| $2,500 to $4,999 | 0 (0.0%) | 0 (0.0%) |
| $5,000 to $7,499 | 2 (1.1%) | 4 (2.8%) |
| $7,500 to $9,999 | 0 (0.0%) | 5 (3.5%) |
| $10,000 to $12,499 | 0 (0.0%) | 10 (7.1%) |
| $12,500 to $14,999 | 10 (5.5%) | 9 (6.4%) |
| $15,000 to $17,499 | 0 (0.0%) | 0 (0.0%) |
| $17,500 to $19,999 | 10 (5.5%) | 2 (1.4%) |
| $20,000 to $22,499 | 17 (9.3%) | 6 (4.3%) |
| $22,500 to $24,999 | 10 (5.5%) | 0 (0.0%) |
| $25,000 to $29,999 | 0 (0.0%) | 13 (9.2%) |
| $30,000 to $34,999 | 2 (1.1%) | 7 (5.0%) |
| $35,000 to $39,999 | 29 (15.9%) | 22 (15.6%) |
| $40,000 to $44,999 | 3 (1.6%) | 18 (12.8%) |
| $45,000 to $49,999 | 11 (6.0%) | 6 (4.3%) |
| $50,000 to $54,999 | 27 (14.7%) | 6 (4.3%) |
| $55,000 to $64,999 | 12 (6.6%) | 0 (0.0%) |
| $65,000 to $74,999 | 13 (7.1%) | 7 (5.0%) |
| $75,000 to $99,999 | 6 (3.3%) | 11 (7.8%) |
| $100,000+ | 9 (4.9%) | 4 (2.8%) |
| Total | 183 (100.0%) | 141 (100.0%) |
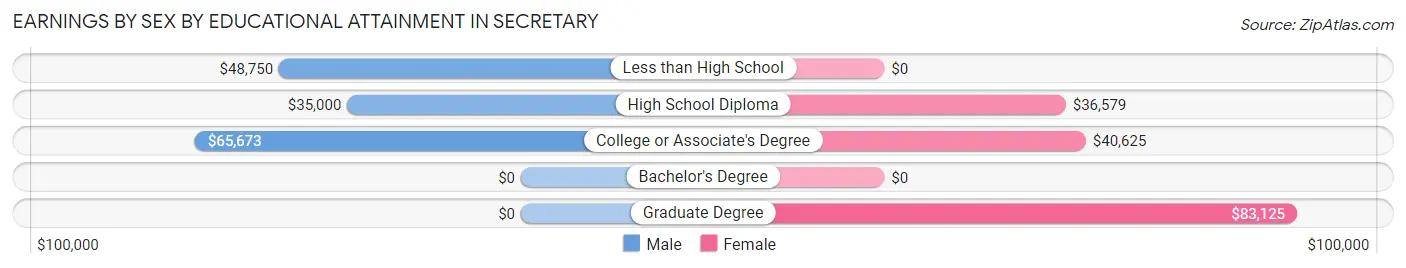
Earnings by Sex by Educational Attainment in Secretary
Average earnings in Secretary are $36,830 for men and $37,105 for women, a difference of 0.7%. Men with an educational attainment of college or associate's degree enjoy the highest average annual earnings of $65,673, while those with high school diploma education earn the least with $35,000. Women with an educational attainment of graduate degree earn the most with the average annual earnings of $83,125, while those with high school diploma education have the smallest earnings of $36,579.
| Educational Attainment | Male Income | Female Income |
| Less than High School | $48,750 | $0 |
| High School Diploma | $35,000 | $36,579 |
| College or Associate's Degree | $65,673 | $40,625 |
| Bachelor's Degree | - | - |
| Graduate Degree | - | - |
| Total | $36,830 | $37,105 |
Family Income in Secretary
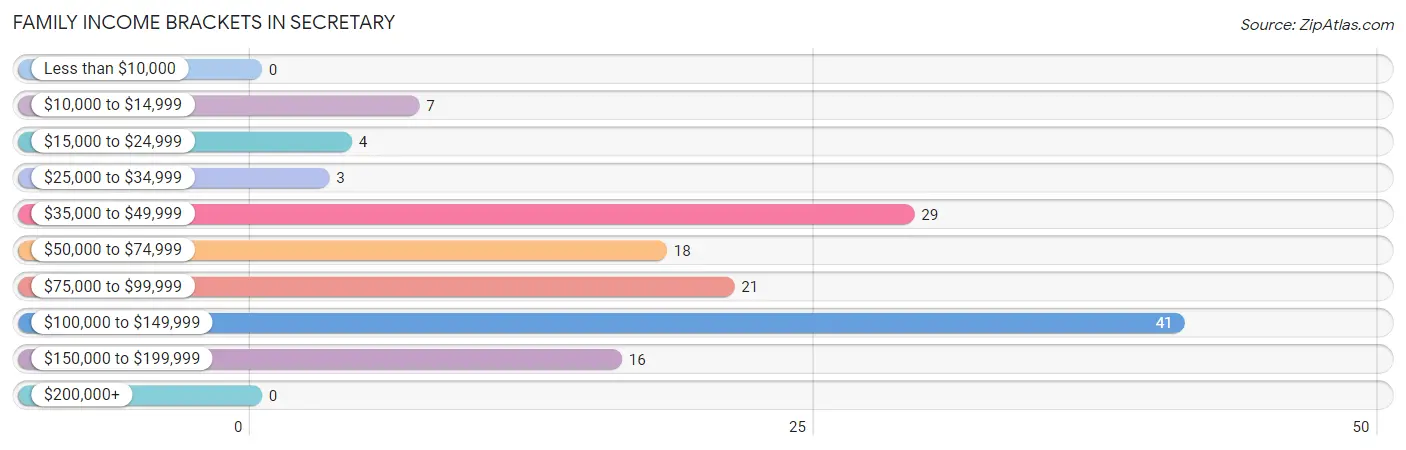
Family Income Brackets in Secretary
According to the Secretary family income data, there are 41 families falling into the $100,000 to $149,999 income range, which is the most common income bracket and makes up 29.5% of all families.
| Income Bracket | # Families | % Families |
| Less than $10,000 | 0 | 0.0% |
| $10,000 to $14,999 | 7 | 5.0% |
| $15,000 to $24,999 | 4 | 2.9% |
| $25,000 to $34,999 | 3 | 2.2% |
| $35,000 to $49,999 | 29 | 20.9% |
| $50,000 to $74,999 | 18 | 12.9% |
| $75,000 to $99,999 | 21 | 15.1% |
| $100,000 to $149,999 | 41 | 29.5% |
| $150,000 to $199,999 | 16 | 11.5% |
| $200,000+ | 0 | 0.0% |
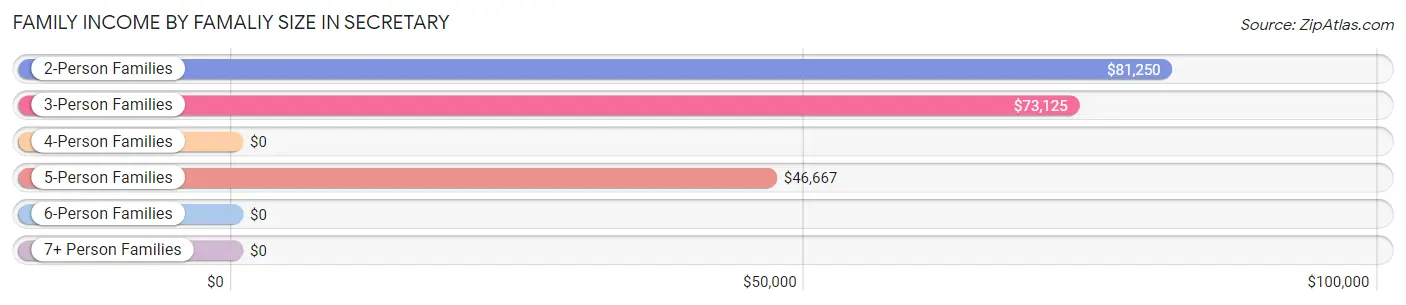
Family Income by Famaliy Size in Secretary
2-person families (52 | 37.4%) account for the highest median family income in Secretary with $81,250 per family, while 2-person families (52 | 37.4%) have the highest median income of $40,625 per family member.
| Income Bracket | # Families | Median Income |
| 2-Person Families | 52 (37.4%) | $81,250 |
| 3-Person Families | 22 (15.8%) | $73,125 |
| 4-Person Families | 33 (23.7%) | $0 |
| 5-Person Families | 20 (14.4%) | $46,667 |
| 6-Person Families | 12 (8.6%) | $0 |
| 7+ Person Families | 0 (0.0%) | $0 |
| Total | 139 (100.0%) | $76,932 |
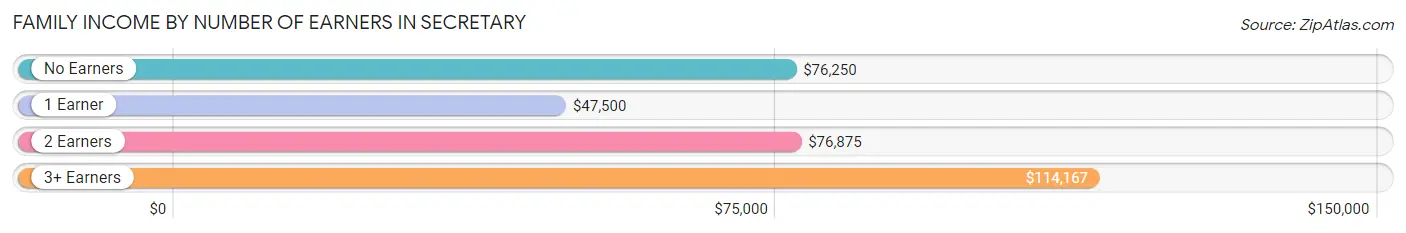
Family Income by Number of Earners in Secretary
The median family income in Secretary is $76,932, with families comprising 3+ earners (36) having the highest median family income of $114,167, while families with 1 earner (58) have the lowest median family income of $47,500, accounting for 25.9% and 41.7% of families, respectively.
| Number of Earners | # Families | Median Income |
| No Earners | 12 (8.6%) | $76,250 |
| 1 Earner | 58 (41.7%) | $47,500 |
| 2 Earners | 33 (23.7%) | $76,875 |
| 3+ Earners | 36 (25.9%) | $114,167 |
| Total | 139 (100.0%) | $76,932 |
Household Income in Secretary
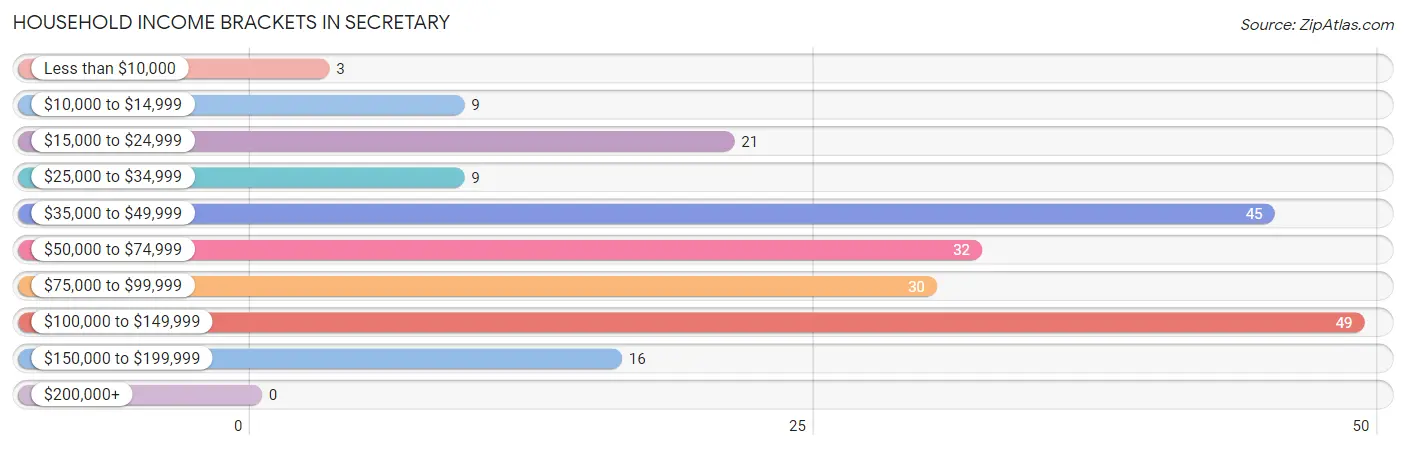
Household Income Brackets in Secretary
With 49 households falling in the category, the $100,000 to $149,999 income range is the most frequent in Secretary, accounting for 22.9% of all households.
| Income Bracket | # Households | % Households |
| Less than $10,000 | 3 | 1.4% |
| $10,000 to $14,999 | 9 | 4.2% |
| $15,000 to $24,999 | 21 | 9.8% |
| $25,000 to $34,999 | 9 | 4.2% |
| $35,000 to $49,999 | 45 | 21.0% |
| $50,000 to $74,999 | 32 | 15.0% |
| $75,000 to $99,999 | 30 | 14.0% |
| $100,000 to $149,999 | 49 | 22.9% |
| $150,000 to $199,999 | 16 | 7.5% |
| $200,000+ | 0 | 0.0% |
Household Income by Householder Age in Secretary
The median household income in Secretary is $66,458, with the highest median household income of $74,688 found in the 45 to 64 years age bracket for the primary householder. A total of 75 households (35.0%) fall into this category. Meanwhile, the 15 to 24 years age bracket for the primary householder has the lowest median household income of $0, with 8 households (3.7%) in this group.
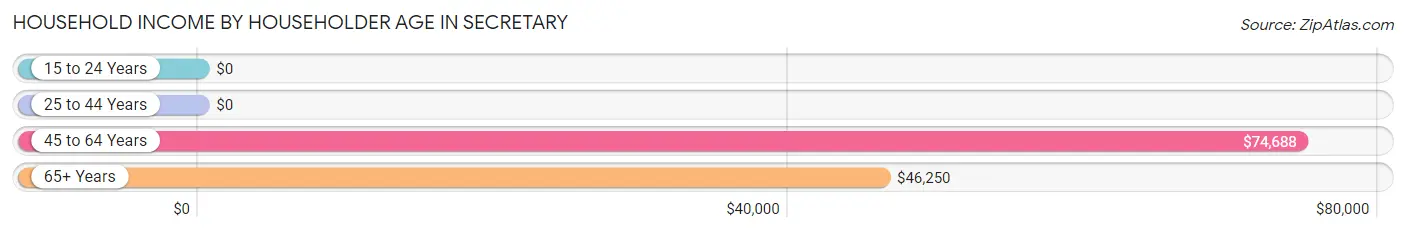
| Income Bracket | # Households | Median Income |
| 15 to 24 Years | 8 (3.7%) | $0 |
| 25 to 44 Years | 86 (40.2%) | $0 |
| 45 to 64 Years | 75 (35.0%) | $74,688 |
| 65+ Years | 45 (21.0%) | $46,250 |
| Total | 214 (100.0%) | $66,458 |
Poverty in Secretary
Income Below Poverty by Sex and Age in Secretary
With 6.0% poverty level for males and 13.7% for females among the residents of Secretary, 15 year old males and 25 to 34 year old females are the most vulnerable to poverty, with 8 males (72.7%) and 16 females (38.1%) in their respective age groups living below the poverty level.
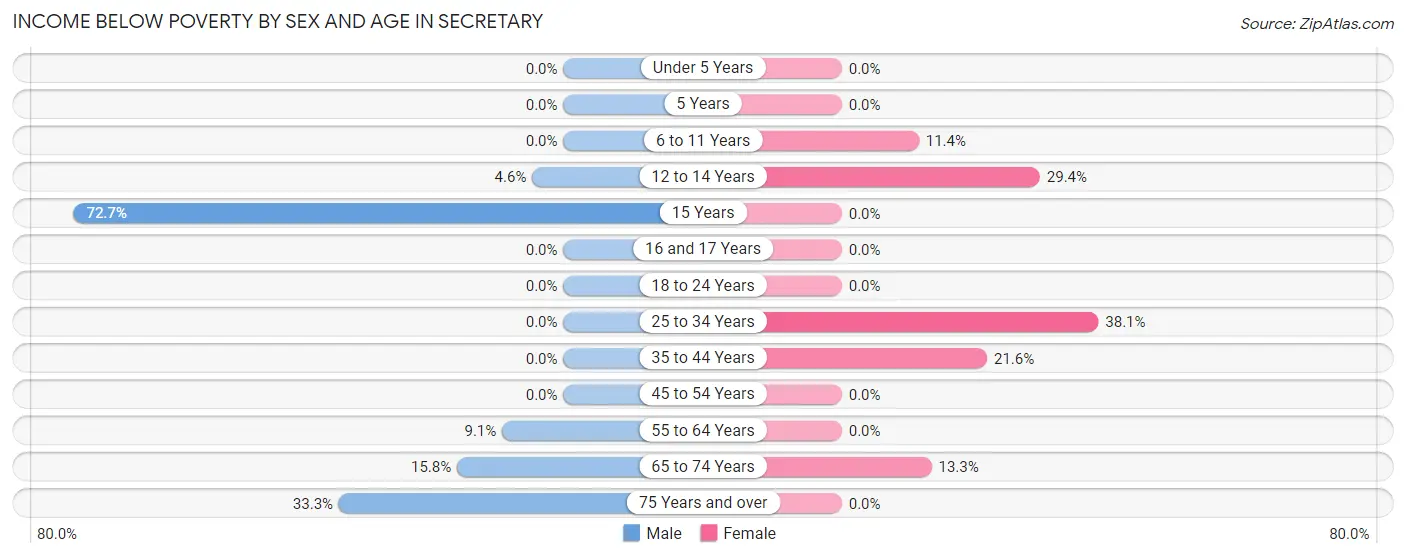
| Age Bracket | Male | Female |
| Under 5 Years | 0 (0.0%) | 0 (0.0%) |
| 5 Years | 0 (0.0%) | 0 (0.0%) |
| 6 to 11 Years | 0 (0.0%) | 4 (11.4%) |
| 12 to 14 Years | 3 (4.6%) | 10 (29.4%) |
| 15 Years | 8 (72.7%) | 0 (0.0%) |
| 16 and 17 Years | 0 (0.0%) | 0 (0.0%) |
| 18 to 24 Years | 0 (0.0%) | 0 (0.0%) |
| 25 to 34 Years | 0 (0.0%) | 16 (38.1%) |
| 35 to 44 Years | 0 (0.0%) | 11 (21.6%) |
| 45 to 54 Years | 0 (0.0%) | 0 (0.0%) |
| 55 to 64 Years | 3 (9.1%) | 0 (0.0%) |
| 65 to 74 Years | 3 (15.8%) | 2 (13.3%) |
| 75 Years and over | 2 (33.3%) | 0 (0.0%) |
| Total | 19 (6.0%) | 43 (13.7%) |
Income Above Poverty by Sex and Age in Secretary
According to the poverty statistics in Secretary, males aged under 5 years and females aged under 5 years are the age groups that are most secure financially, with 100.0% of males and 100.0% of females in these age groups living above the poverty line.
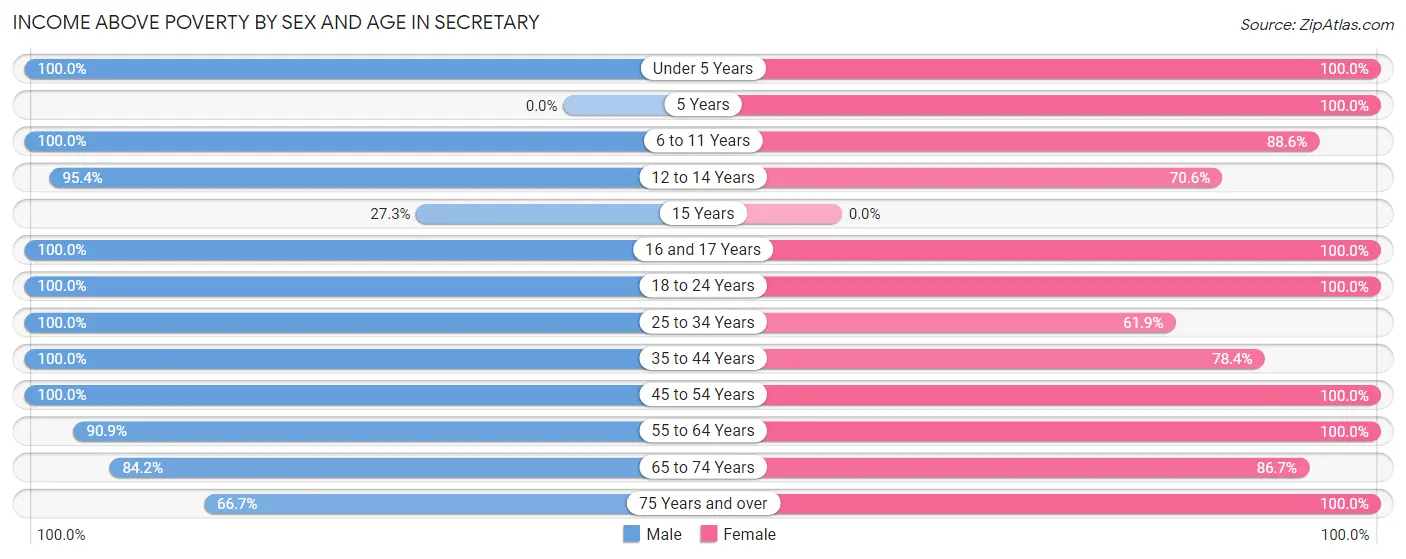
| Age Bracket | Male | Female |
| Under 5 Years | 2 (100.0%) | 20 (100.0%) |
| 5 Years | 0 (0.0%) | 2 (100.0%) |
| 6 to 11 Years | 21 (100.0%) | 31 (88.6%) |
| 12 to 14 Years | 62 (95.4%) | 24 (70.6%) |
| 15 Years | 3 (27.3%) | 0 (0.0%) |
| 16 and 17 Years | 10 (100.0%) | 11 (100.0%) |
| 18 to 24 Years | 14 (100.0%) | 24 (100.0%) |
| 25 to 34 Years | 42 (100.0%) | 26 (61.9%) |
| 35 to 44 Years | 70 (100.0%) | 40 (78.4%) |
| 45 to 54 Years | 25 (100.0%) | 25 (100.0%) |
| 55 to 64 Years | 30 (90.9%) | 32 (100.0%) |
| 65 to 74 Years | 16 (84.2%) | 13 (86.7%) |
| 75 Years and over | 4 (66.7%) | 23 (100.0%) |
| Total | 299 (94.0%) | 271 (86.3%) |
Income Below Poverty Among Married-Couple Families in Secretary
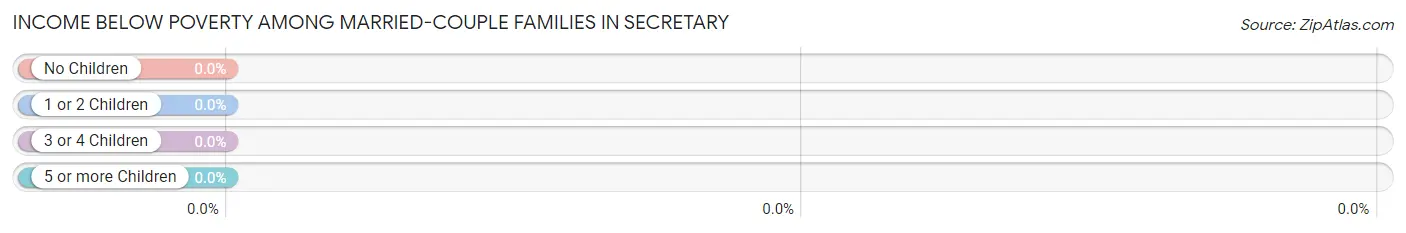
| Children | Above Poverty | Below Poverty |
| No Children | 33 (100.0%) | 0 (0.0%) |
| 1 or 2 Children | 31 (100.0%) | 0 (0.0%) |
| 3 or 4 Children | 29 (100.0%) | 0 (0.0%) |
| 5 or more Children | 0 (0.0%) | 0 (0.0%) |
| Total | 93 (100.0%) | 0 (0.0%) |
Income Below Poverty Among Single-Parent Households in Secretary
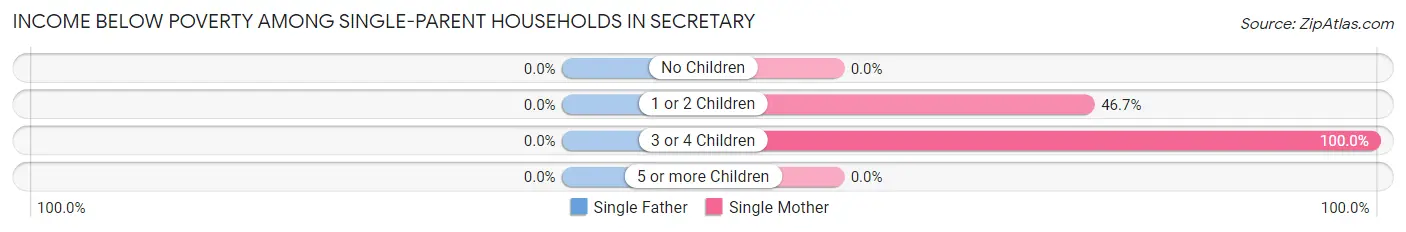
| Children | Single Father | Single Mother |
| No Children | 0 (0.0%) | 0 (0.0%) |
| 1 or 2 Children | 0 (0.0%) | 7 (46.7%) |
| 3 or 4 Children | 0 (0.0%) | 4 (100.0%) |
| 5 or more Children | 0 (0.0%) | 0 (0.0%) |
| Total | 0 (0.0%) | 11 (26.8%) |
Income Below Poverty Among Married-Couple vs Single-Parent Households in Secretary
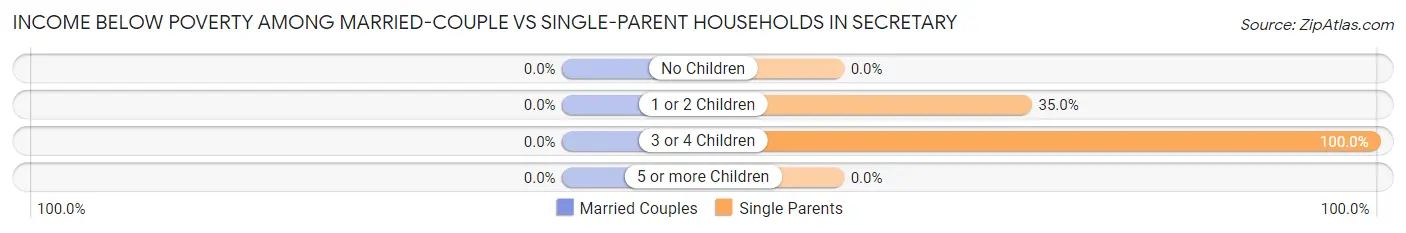
| Children | Married-Couple Families | Single-Parent Households |
| No Children | 0 (0.0%) | 0 (0.0%) |
| 1 or 2 Children | 0 (0.0%) | 7 (35.0%) |
| 3 or 4 Children | 0 (0.0%) | 4 (100.0%) |
| 5 or more Children | 0 (0.0%) | 0 (0.0%) |
| Total | 0 (0.0%) | 11 (23.9%) |
Race in Secretary
The most populous races in Secretary are White / Caucasian (489 | 76.2%), Hispanic or Latino (154 | 24.0%), and Some other Race (119 | 18.5%).
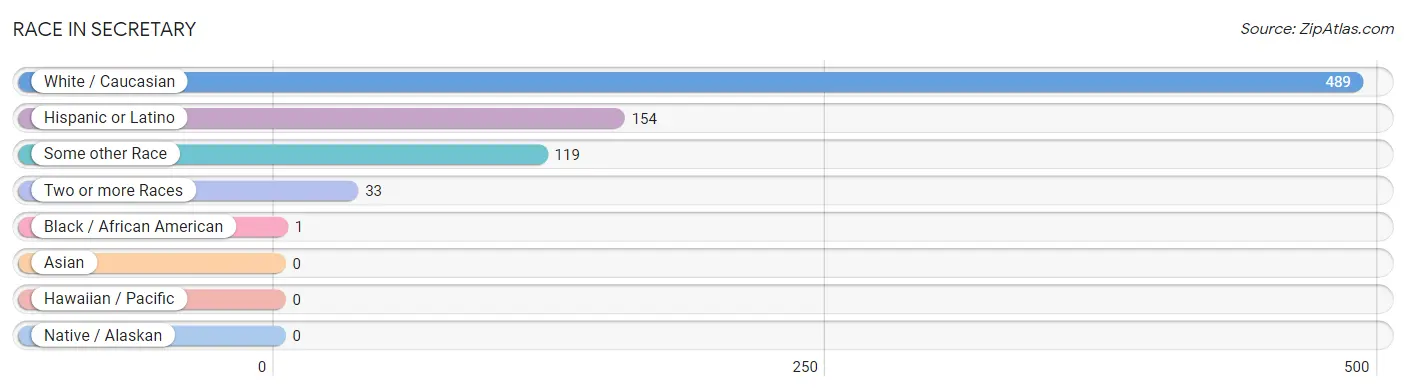
| Race | # Population | % Population |
| Asian | 0 | 0.0% |
| Black / African American | 1 | 0.2% |
| Hawaiian / Pacific | 0 | 0.0% |
| Hispanic or Latino | 154 | 24.0% |
| Native / Alaskan | 0 | 0.0% |
| White / Caucasian | 489 | 76.2% |
| Two or more Races | 33 | 5.1% |
| Some other Race | 119 | 18.5% |
| Total | 642 | 100.0% |
Ancestry in Secretary
The most populous ancestries reported in Secretary are American (177 | 27.6%), Mexican (118 | 18.4%), German (61 | 9.5%), Irish (44 | 6.9%), and English (42 | 6.5%), together accounting for 68.8% of all Secretary residents.
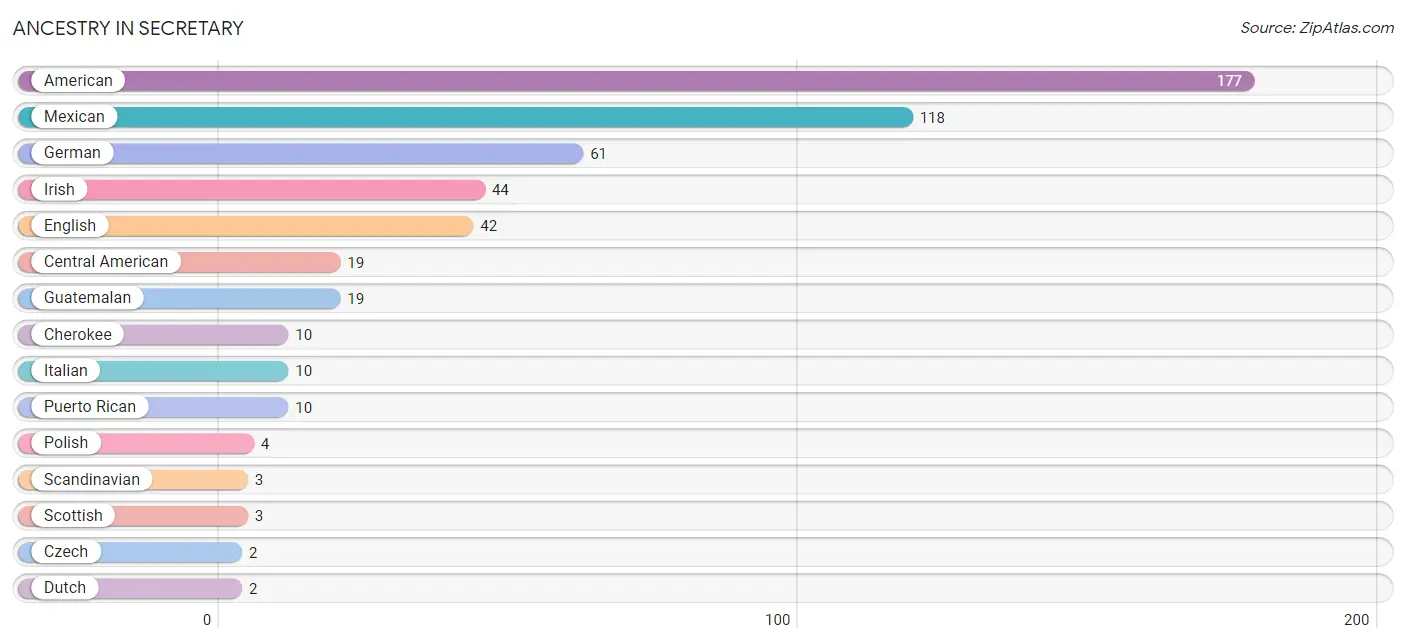
| Ancestry | # Population | % Population |
| American | 177 | 27.6% |
| Central American | 19 | 3.0% |
| Cherokee | 10 | 1.6% |
| Czech | 2 | 0.3% |
| Dutch | 2 | 0.3% |
| Eastern European | 1 | 0.2% |
| English | 42 | 6.5% |
| German | 61 | 9.5% |
| Guatemalan | 19 | 3.0% |
| Irish | 44 | 6.9% |
| Italian | 10 | 1.6% |
| Mexican | 118 | 18.4% |
| Polish | 4 | 0.6% |
| Puerto Rican | 10 | 1.6% |
| Romanian | 1 | 0.2% |
| Scandinavian | 3 | 0.5% |
| Scottish | 3 | 0.5% |
| Welsh | 2 | 0.3% | View All 18 Rows |
Immigrants in Secretary
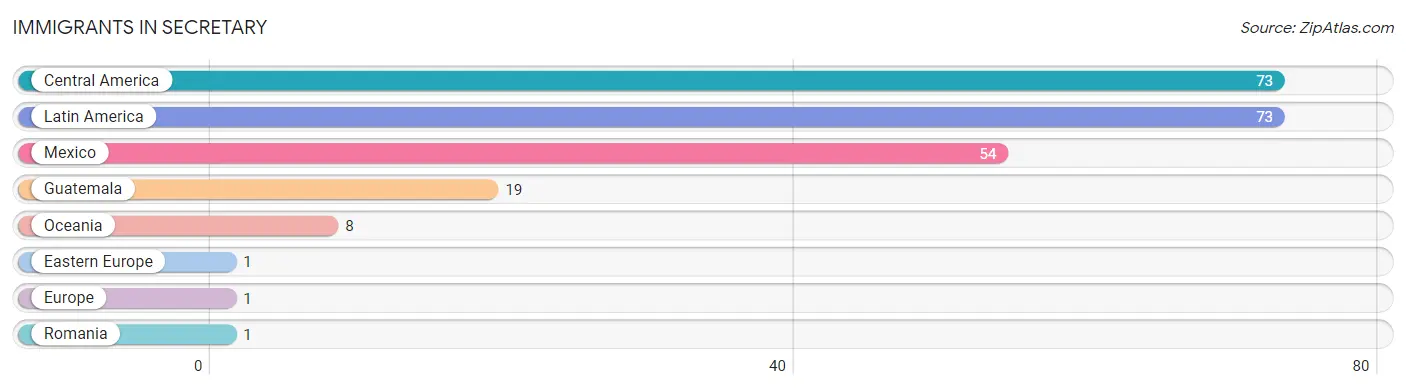
The most numerous immigrant groups reported in Secretary came from Central America (73 | 11.4%), Latin America (73 | 11.4%), Mexico (54 | 8.4%), Guatemala (19 | 3.0%), and Oceania (8 | 1.3%), together accounting for 35.4% of all Secretary residents.
| Immigration Origin | # Population | % Population |
| Central America | 73 | 11.4% |
| Eastern Europe | 1 | 0.2% |
| Europe | 1 | 0.2% |
| Guatemala | 19 | 3.0% |
| Latin America | 73 | 11.4% |
| Mexico | 54 | 8.4% |
| Oceania | 8 | 1.3% |
| Romania | 1 | 0.2% | View All 8 Rows |
Sex and Age in Secretary
Sex and Age in Secretary
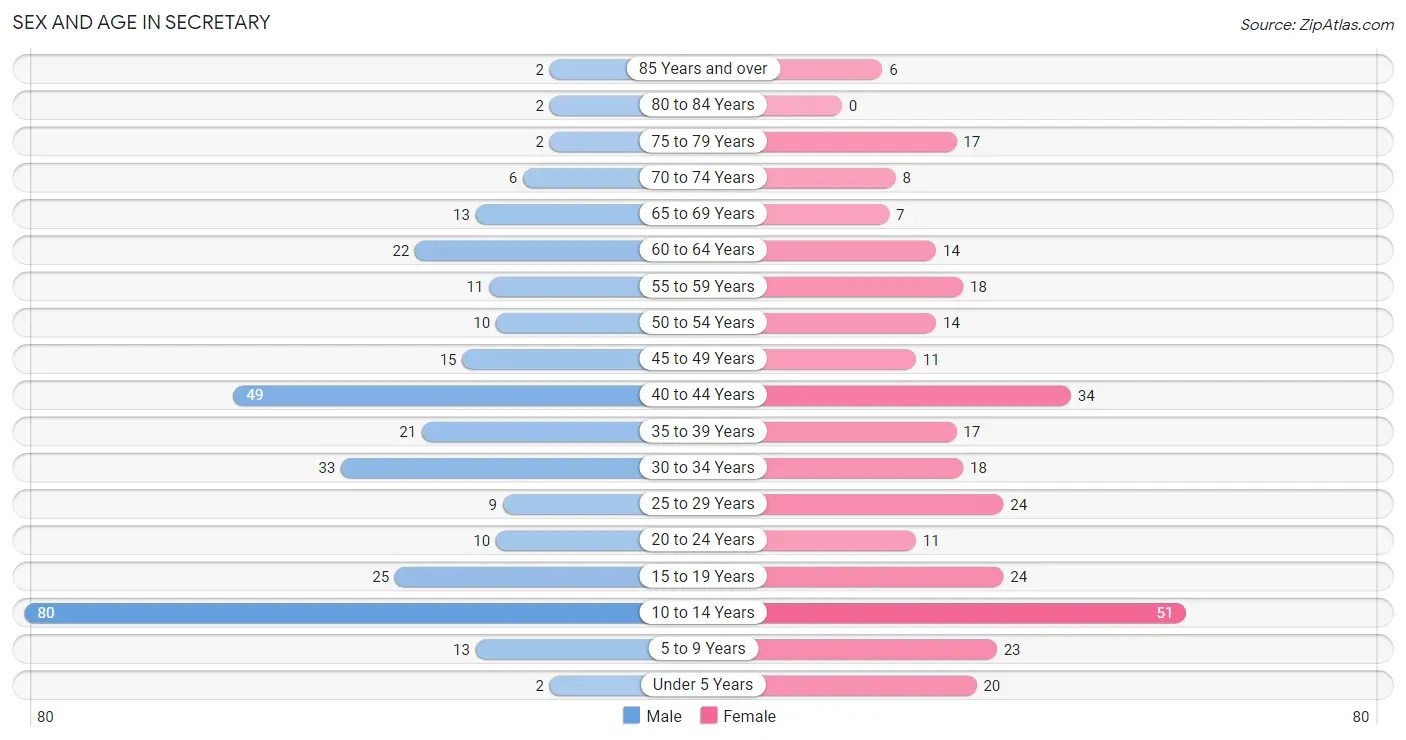
The most populous age groups in Secretary are 10 to 14 Years (80 | 24.6%) for men and 10 to 14 Years (51 | 16.1%) for women.
| Age Bracket | Male | Female |
| Under 5 Years | 2 (0.6%) | 20 (6.3%) |
| 5 to 9 Years | 13 (4.0%) | 23 (7.3%) |
| 10 to 14 Years | 80 (24.6%) | 51 (16.1%) |
| 15 to 19 Years | 25 (7.7%) | 24 (7.6%) |
| 20 to 24 Years | 10 (3.1%) | 11 (3.5%) |
| 25 to 29 Years | 9 (2.8%) | 24 (7.6%) |
| 30 to 34 Years | 33 (10.2%) | 18 (5.7%) |
| 35 to 39 Years | 21 (6.5%) | 17 (5.4%) |
| 40 to 44 Years | 49 (15.1%) | 34 (10.7%) |
| 45 to 49 Years | 15 (4.6%) | 11 (3.5%) |
| 50 to 54 Years | 10 (3.1%) | 14 (4.4%) |
| 55 to 59 Years | 11 (3.4%) | 18 (5.7%) |
| 60 to 64 Years | 22 (6.8%) | 14 (4.4%) |
| 65 to 69 Years | 13 (4.0%) | 7 (2.2%) |
| 70 to 74 Years | 6 (1.8%) | 8 (2.5%) |
| 75 to 79 Years | 2 (0.6%) | 17 (5.4%) |
| 80 to 84 Years | 2 (0.6%) | 0 (0.0%) |
| 85 Years and over | 2 (0.6%) | 6 (1.9%) |
| Total | 325 (100.0%) | 317 (100.0%) |
Families and Households in Secretary
Median Family Size in Secretary
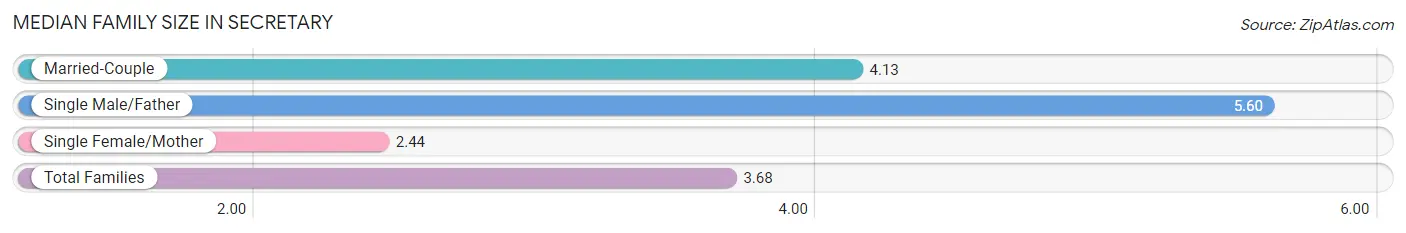
The median family size in Secretary is 3.68 persons per family, with single male/father families (5 | 3.6%) accounting for the largest median family size of 5.6 persons per family. On the other hand, single female/mother families (41 | 29.5%) represent the smallest median family size with 2.44 persons per family.
| Family Type | # Families | Family Size |
| Married-Couple | 93 (66.9%) | 4.13 |
| Single Male/Father | 5 (3.6%) | 5.60 |
| Single Female/Mother | 41 (29.5%) | 2.44 |
| Total Families | 139 (100.0%) | 3.68 |
Median Household Size in Secretary
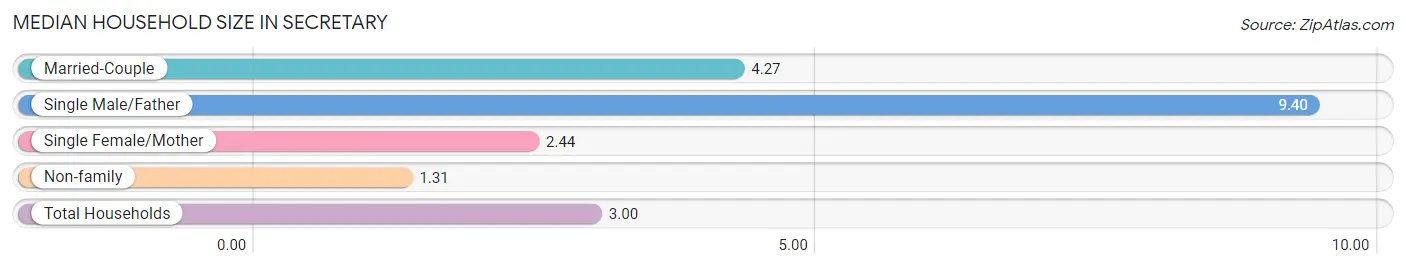
The median household size in Secretary is 3.00 persons per household, with single male/father households (5 | 2.3%) accounting for the largest median household size of 9.4 persons per household. non-family households (75 | 35.0%) represent the smallest median household size with 1.31 persons per household.
| Household Type | # Households | Household Size |
| Married-Couple | 93 (43.5%) | 4.27 |
| Single Male/Father | 5 (2.3%) | 9.40 |
| Single Female/Mother | 41 (19.2%) | 2.44 |
| Non-family | 75 (35.0%) | 1.31 |
| Total Households | 214 (100.0%) | 3.00 |
Household Size by Marriage Status in Secretary
Out of a total of 214 households in Secretary, 139 (64.9%) are family households, while 75 (35.0%) are nonfamily households. The most numerous type of family households are 2-person households, comprising 49, and the most common type of nonfamily households are 1-person households, comprising 45.
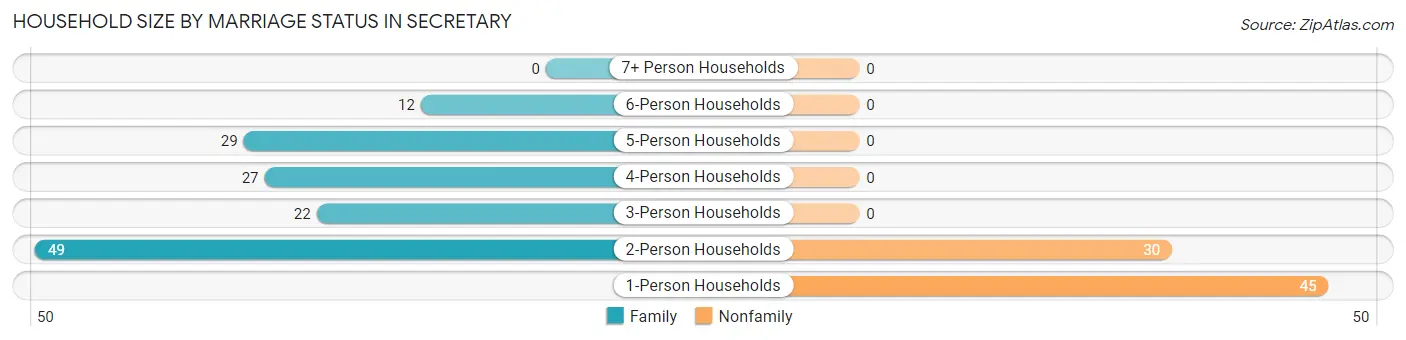
| Household Size | Family Households | Nonfamily Households |
| 1-Person Households | - | 45 (21.0%) |
| 2-Person Households | 49 (22.9%) | 30 (14.0%) |
| 3-Person Households | 22 (10.3%) | 0 (0.0%) |
| 4-Person Households | 27 (12.6%) | 0 (0.0%) |
| 5-Person Households | 29 (13.6%) | 0 (0.0%) |
| 6-Person Households | 12 (5.6%) | 0 (0.0%) |
| 7+ Person Households | 0 (0.0%) | 0 (0.0%) |
| Total | 139 (64.9%) | 75 (35.0%) |
Female Fertility in Secretary
Fertility by Age in Secretary
Average fertility rate in Secretary is 58.0 births per 1,000 women. Women in the age bracket of 20 to 34 years have the highest fertility rate with 151.0 births per 1,000 women. Women in the age bracket of 20 to 34 years acount for 100.0% of all women with births.
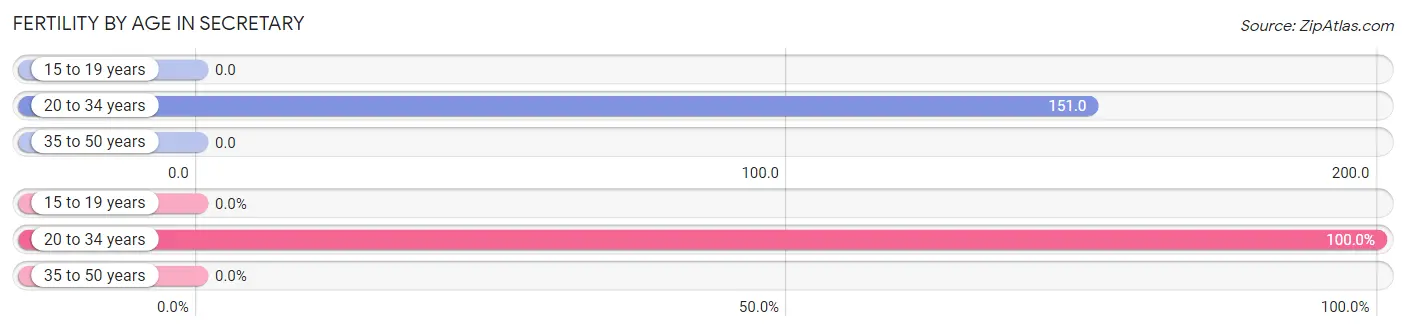
| Age Bracket | Women with Births | Births / 1,000 Women |
| 15 to 19 years | 0 (0.0%) | 0.0 |
| 20 to 34 years | 8 (100.0%) | 151.0 |
| 35 to 50 years | 0 (0.0%) | 0.0 |
| Total | 8 (100.0%) | 58.0 |
Fertility by Age by Marriage Status in Secretary
37.5% of women with births (8) in Secretary are married. The highest percentage of unmarried women with births falls into 20 to 34 years age bracket with 62.5% of them unmarried at the time of birth, while the lowest percentage of unmarried women with births belong to 20 to 34 years age bracket with 62.5% of them unmarried.
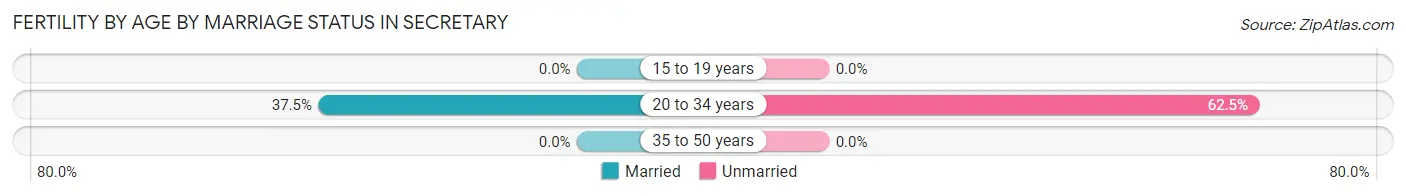
| Age Bracket | Married | Unmarried |
| 15 to 19 years | 0 (0.0%) | 0 (0.0%) |
| 20 to 34 years | 3 (37.5%) | 5 (62.5%) |
| 35 to 50 years | 0 (0.0%) | 0 (0.0%) |
| Total | 3 (37.5%) | 5 (62.5%) |
Fertility by Education in Secretary
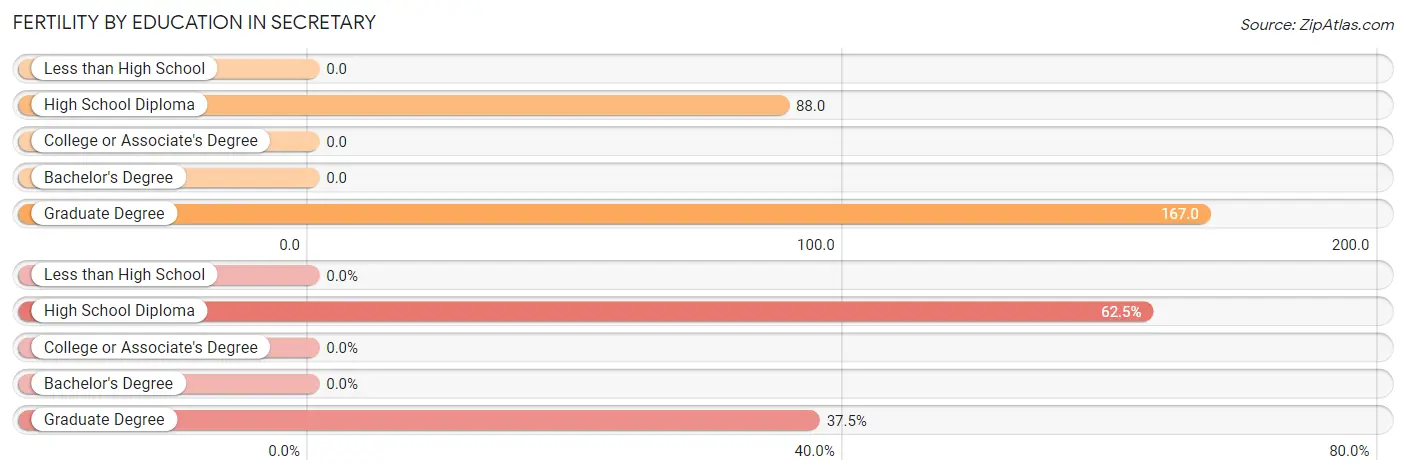
| Educational Attainment | Women with Births | Births / 1,000 Women |
| Less than High School | 0 (0.0%) | 0.0 |
| High School Diploma | 5 (62.5%) | 88.0 |
| College or Associate's Degree | 0 (0.0%) | 0.0 |
| Bachelor's Degree | 0 (0.0%) | 0.0 |
| Graduate Degree | 3 (37.5%) | 167.0 |
| Total | 8 (100.0%) | 58.0 |
Fertility by Education by Marriage Status in Secretary
62.5% of women with births in Secretary are unmarried. Women with the educational attainment of graduate degree are most likely to be married with 100.0% of them married at childbirth, while women with the educational attainment of high school diploma are least likely to be married with 100.0% of them unmarried at childbirth.
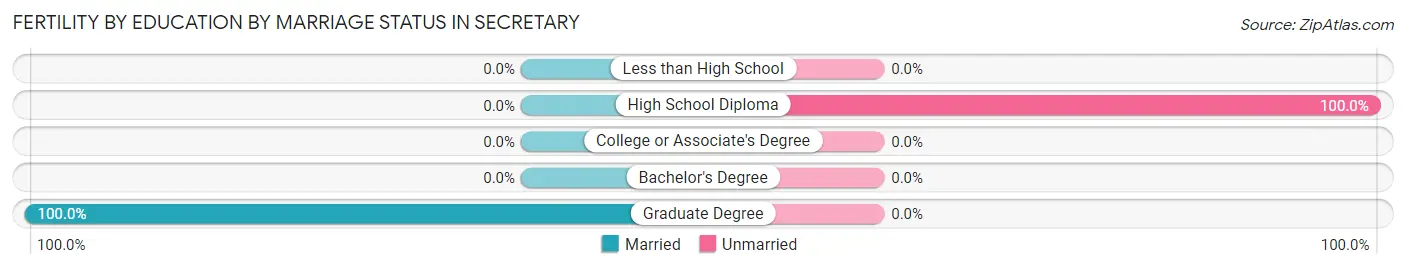
| Educational Attainment | Married | Unmarried |
| Less than High School | 0 (0.0%) | 0 (0.0%) |
| High School Diploma | 0 (0.0%) | 5 (100.0%) |
| College or Associate's Degree | 0 (0.0%) | 0 (0.0%) |
| Bachelor's Degree | 0 (0.0%) | 0 (0.0%) |
| Graduate Degree | 3 (100.0%) | 0 (0.0%) |
| Total | 3 (37.5%) | 5 (62.5%) |
Employment Characteristics in Secretary
Employment by Class of Employer in Secretary
Among the 303 employed individuals in Secretary, private company employees (216 | 71.3%), self-employed (not incorporated) (37 | 12.2%), and state government employees (19 | 6.3%) make up the most common classes of employment.
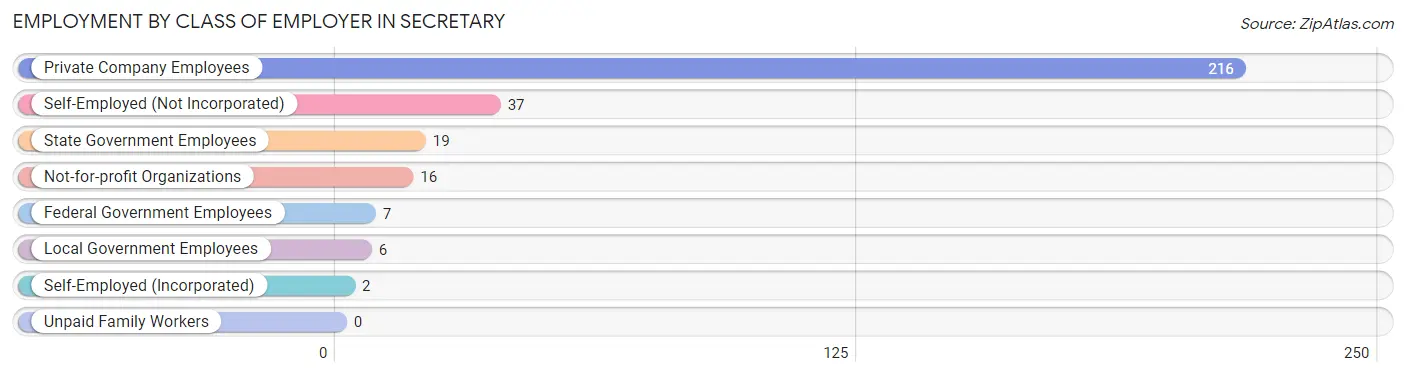
| Employer Class | # Employees | % Employees |
| Private Company Employees | 216 | 71.3% |
| Self-Employed (Incorporated) | 2 | 0.7% |
| Self-Employed (Not Incorporated) | 37 | 12.2% |
| Not-for-profit Organizations | 16 | 5.3% |
| Local Government Employees | 6 | 2.0% |
| State Government Employees | 19 | 6.3% |
| Federal Government Employees | 7 | 2.3% |
| Unpaid Family Workers | 0 | 0.0% |
| Total | 303 | 100.0% |
Employment Status by Age in Secretary
According to the labor force statistics for Secretary, out of the total population over 16 years of age (442), 74.9% or 331 individuals are in the labor force, with 7.6% or 25 of them unemployed. The age group with the highest labor force participation rate is 20 to 24 years, with 100.0% or 21 individuals in the labor force. Within the labor force, the 16 to 19 years age range has the highest percentage of unemployed individuals, with 26.5% or 9 of them being unemployed.
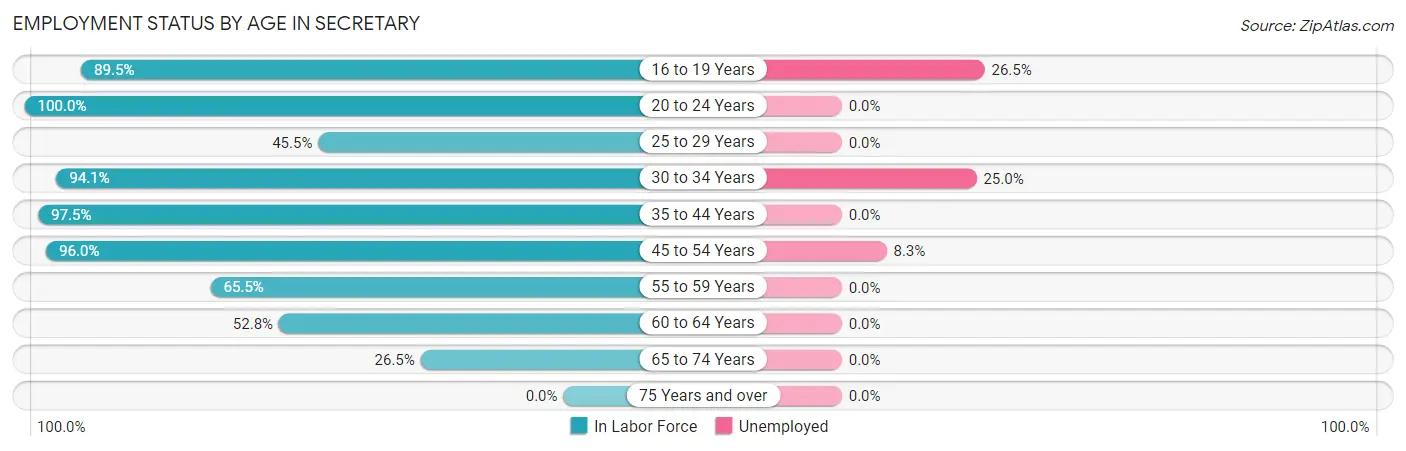
| Age Bracket | In Labor Force | Unemployed |
| 16 to 19 Years | 34 (89.5%) | 9 (26.5%) |
| 20 to 24 Years | 21 (100.0%) | 0 (0.0%) |
| 25 to 29 Years | 15 (45.5%) | 0 (0.0%) |
| 30 to 34 Years | 48 (94.1%) | 12 (25.0%) |
| 35 to 44 Years | 118 (97.5%) | 0 (0.0%) |
| 45 to 54 Years | 48 (96.0%) | 4 (8.3%) |
| 55 to 59 Years | 19 (65.5%) | 0 (0.0%) |
| 60 to 64 Years | 19 (52.8%) | 0 (0.0%) |
| 65 to 74 Years | 9 (26.5%) | 0 (0.0%) |
| 75 Years and over | 0 (0.0%) | 0 (0.0%) |
| Total | 331 (74.9%) | 25 (7.6%) |
Employment Status by Educational Attainment in Secretary
According to labor force statistics for Secretary, 83.4% of individuals (267) out of the total population between 25 and 64 years of age (320) are in the labor force, with 6.0% or 16 of them being unemployed. The group with the highest labor force participation rate are those with the educational attainment of less than high school, with 92.3% or 24 individuals in the labor force. Within the labor force, individuals with high school diploma education have the highest percentage of unemployment, with 10.5% or 16 of them being unemployed.
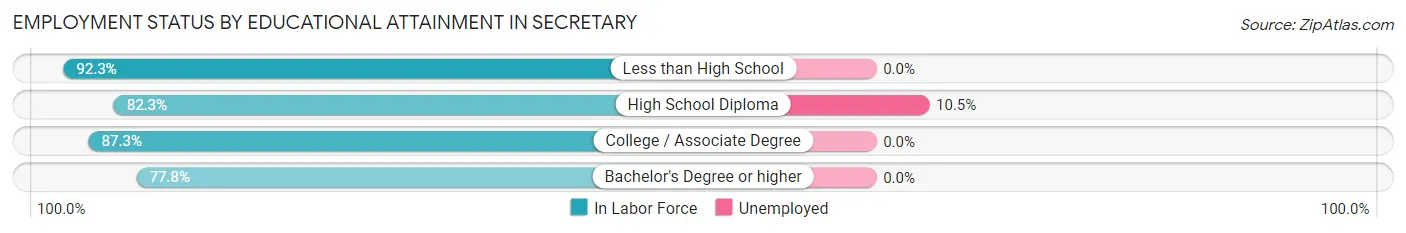
| Educational Attainment | In Labor Force | Unemployed |
| Less than High School | 24 (92.3%) | 0 (0.0%) |
| High School Diploma | 153 (82.3%) | 20 (10.5%) |
| College / Associate Degree | 55 (87.3%) | 0 (0.0%) |
| Bachelor's Degree or higher | 35 (77.8%) | 0 (0.0%) |
| Total | 267 (83.4%) | 19 (6.0%) |
Employment Occupations by Sex in Secretary
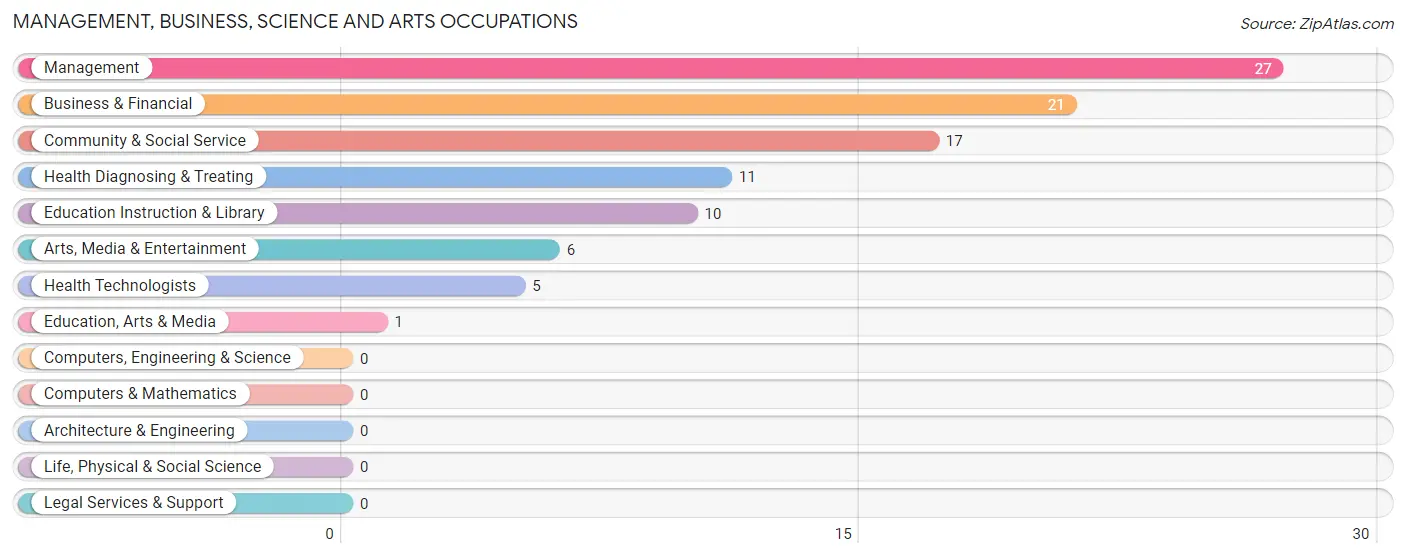
Management, Business, Science and Arts Occupations
The most common Management, Business, Science and Arts occupations in Secretary are Management (27 | 8.8%), Business & Financial (21 | 6.9%), Community & Social Service (17 | 5.6%), Health Diagnosing & Treating (11 | 3.6%), and Education Instruction & Library (10 | 3.3%).
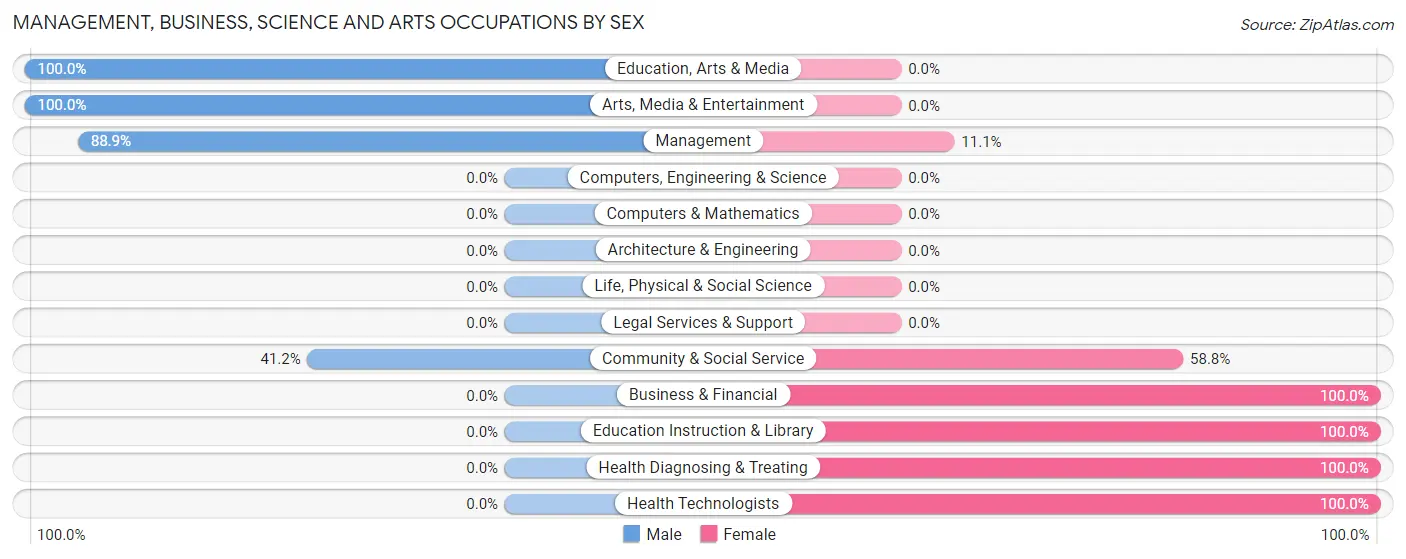
Management, Business, Science and Arts Occupations by Sex
Within the Management, Business, Science and Arts occupations in Secretary, the most male-oriented occupations are Education, Arts & Media (100.0%), Arts, Media & Entertainment (100.0%), and Management (88.9%), while the most female-oriented occupations are Business & Financial (100.0%), Education Instruction & Library (100.0%), and Health Diagnosing & Treating (100.0%).
| Occupation | Male | Female |
| Management | 24 (88.9%) | 3 (11.1%) |
| Business & Financial | 0 (0.0%) | 21 (100.0%) |
| Computers, Engineering & Science | 0 (0.0%) | 0 (0.0%) |
| Computers & Mathematics | 0 (0.0%) | 0 (0.0%) |
| Architecture & Engineering | 0 (0.0%) | 0 (0.0%) |
| Life, Physical & Social Science | 0 (0.0%) | 0 (0.0%) |
| Community & Social Service | 7 (41.2%) | 10 (58.8%) |
| Education, Arts & Media | 1 (100.0%) | 0 (0.0%) |
| Legal Services & Support | 0 (0.0%) | 0 (0.0%) |
| Education Instruction & Library | 0 (0.0%) | 10 (100.0%) |
| Arts, Media & Entertainment | 6 (100.0%) | 0 (0.0%) |
| Health Diagnosing & Treating | 0 (0.0%) | 11 (100.0%) |
| Health Technologists | 0 (0.0%) | 5 (100.0%) |
| Total (Category) | 31 (40.8%) | 45 (59.2%) |
| Total (Overall) | 178 (58.2%) | 128 (41.8%) |
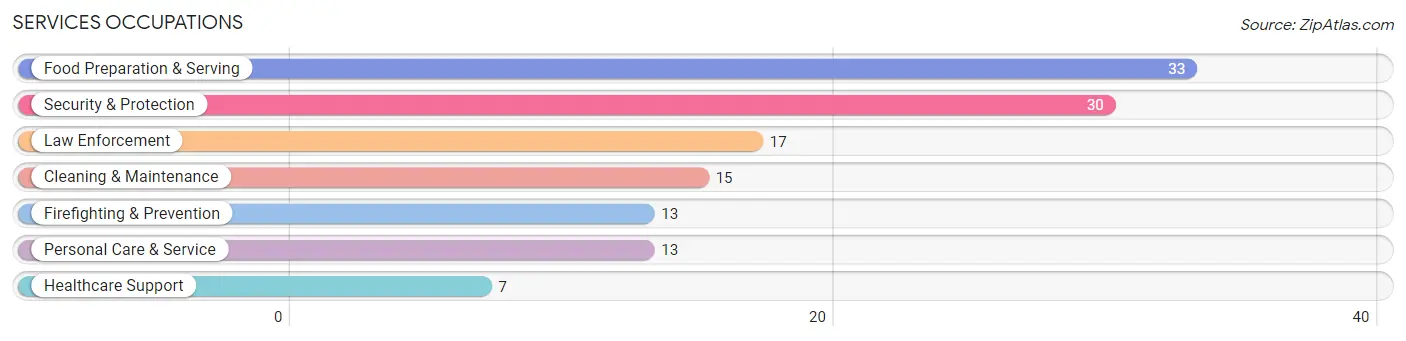
Services Occupations
The most common Services occupations in Secretary are Food Preparation & Serving (33 | 10.8%), Security & Protection (30 | 9.8%), Law Enforcement (17 | 5.6%), Cleaning & Maintenance (15 | 4.9%), and Firefighting & Prevention (13 | 4.3%).
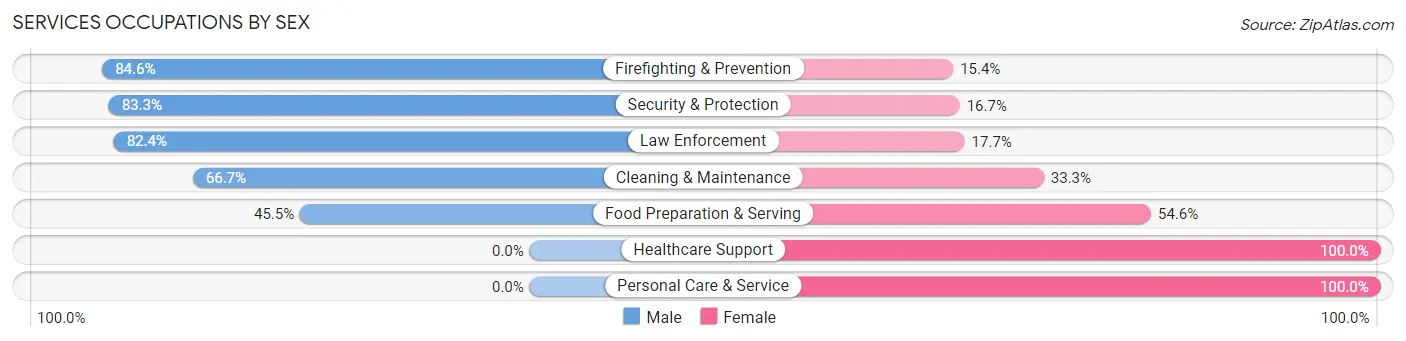
Services Occupations by Sex
Within the Services occupations in Secretary, the most male-oriented occupations are Firefighting & Prevention (84.6%), Security & Protection (83.3%), and Law Enforcement (82.4%), while the most female-oriented occupations are Healthcare Support (100.0%), Personal Care & Service (100.0%), and Food Preparation & Serving (54.5%).
| Occupation | Male | Female |
| Healthcare Support | 0 (0.0%) | 7 (100.0%) |
| Security & Protection | 25 (83.3%) | 5 (16.7%) |
| Firefighting & Prevention | 11 (84.6%) | 2 (15.4%) |
| Law Enforcement | 14 (82.4%) | 3 (17.6%) |
| Food Preparation & Serving | 15 (45.5%) | 18 (54.5%) |
| Cleaning & Maintenance | 10 (66.7%) | 5 (33.3%) |
| Personal Care & Service | 0 (0.0%) | 13 (100.0%) |
| Total (Category) | 50 (51.0%) | 48 (49.0%) |
| Total (Overall) | 178 (58.2%) | 128 (41.8%) |
Sales and Office Occupations
The most common Sales and Office occupations in Secretary are Office & Administration (40 | 13.1%), and Sales & Related (9 | 2.9%).
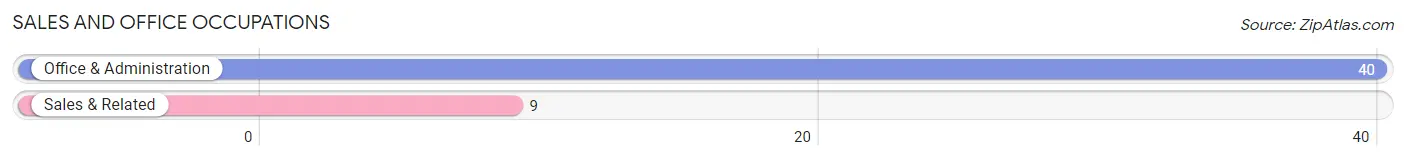
Sales and Office Occupations by Sex
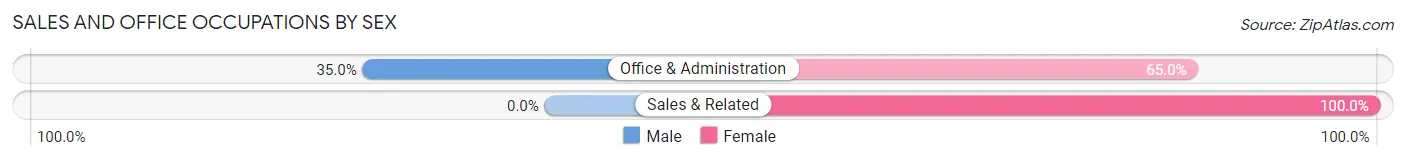
| Occupation | Male | Female |
| Sales & Related | 0 (0.0%) | 9 (100.0%) |
| Office & Administration | 14 (35.0%) | 26 (65.0%) |
| Total (Category) | 14 (28.6%) | 35 (71.4%) |
| Total (Overall) | 178 (58.2%) | 128 (41.8%) |
Natural Resources, Construction and Maintenance Occupations
The most common Natural Resources, Construction and Maintenance occupations in Secretary are Construction & Extraction (17 | 5.6%), Installation, Maintenance & Repair (13 | 4.3%), and Farming, Fishing & Forestry (3 | 1.0%).
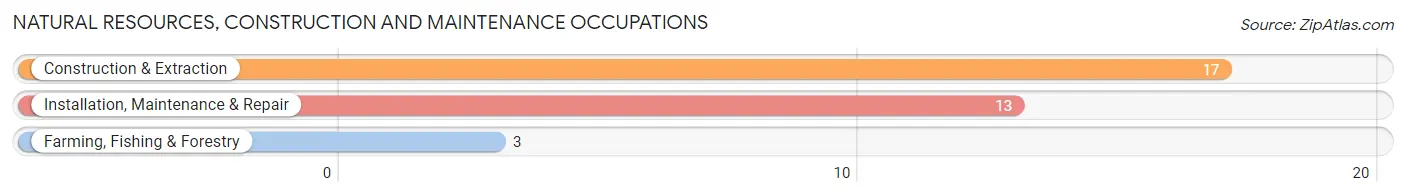
Natural Resources, Construction and Maintenance Occupations by Sex
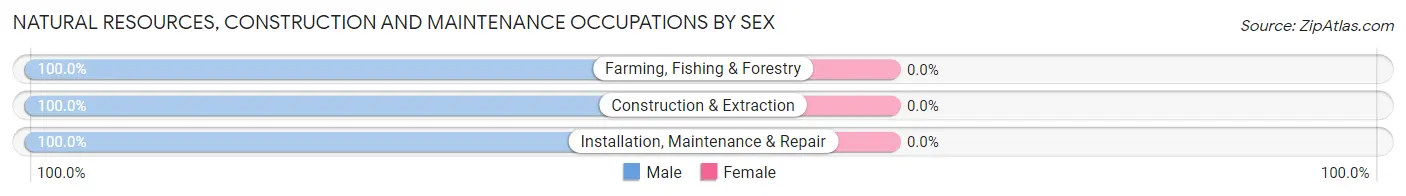
| Occupation | Male | Female |
| Farming, Fishing & Forestry | 3 (100.0%) | 0 (0.0%) |
| Construction & Extraction | 17 (100.0%) | 0 (0.0%) |
| Installation, Maintenance & Repair | 13 (100.0%) | 0 (0.0%) |
| Total (Category) | 33 (100.0%) | 0 (0.0%) |
| Total (Overall) | 178 (58.2%) | 128 (41.8%) |
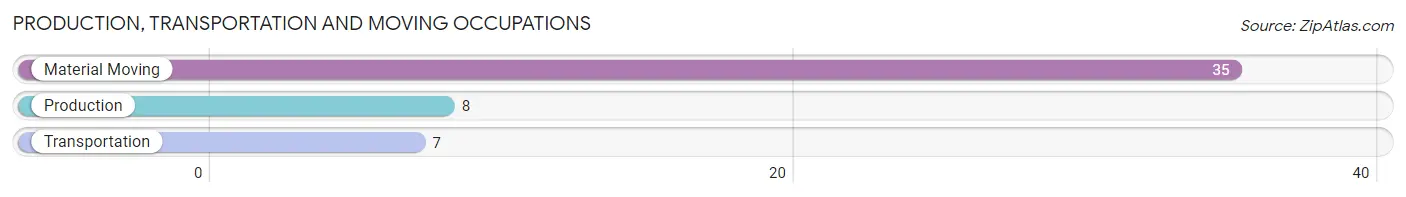
Production, Transportation and Moving Occupations
The most common Production, Transportation and Moving occupations in Secretary are Material Moving (35 | 11.4%), Production (8 | 2.6%), and Transportation (7 | 2.3%).
Production, Transportation and Moving Occupations by Sex
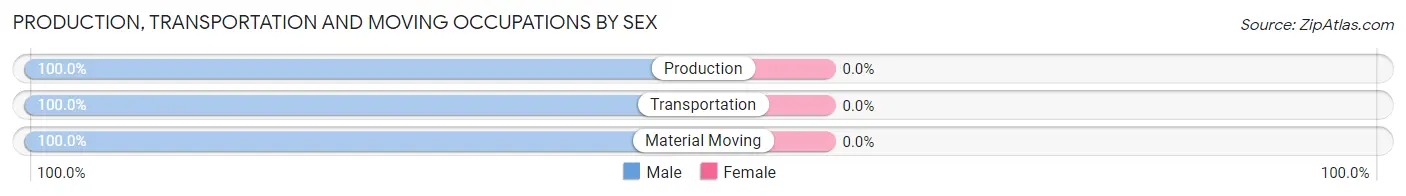
| Occupation | Male | Female |
| Production | 8 (100.0%) | 0 (0.0%) |
| Transportation | 7 (100.0%) | 0 (0.0%) |
| Material Moving | 35 (100.0%) | 0 (0.0%) |
| Total (Category) | 50 (100.0%) | 0 (0.0%) |
| Total (Overall) | 178 (58.2%) | 128 (41.8%) |
Employment Industries by Sex in Secretary
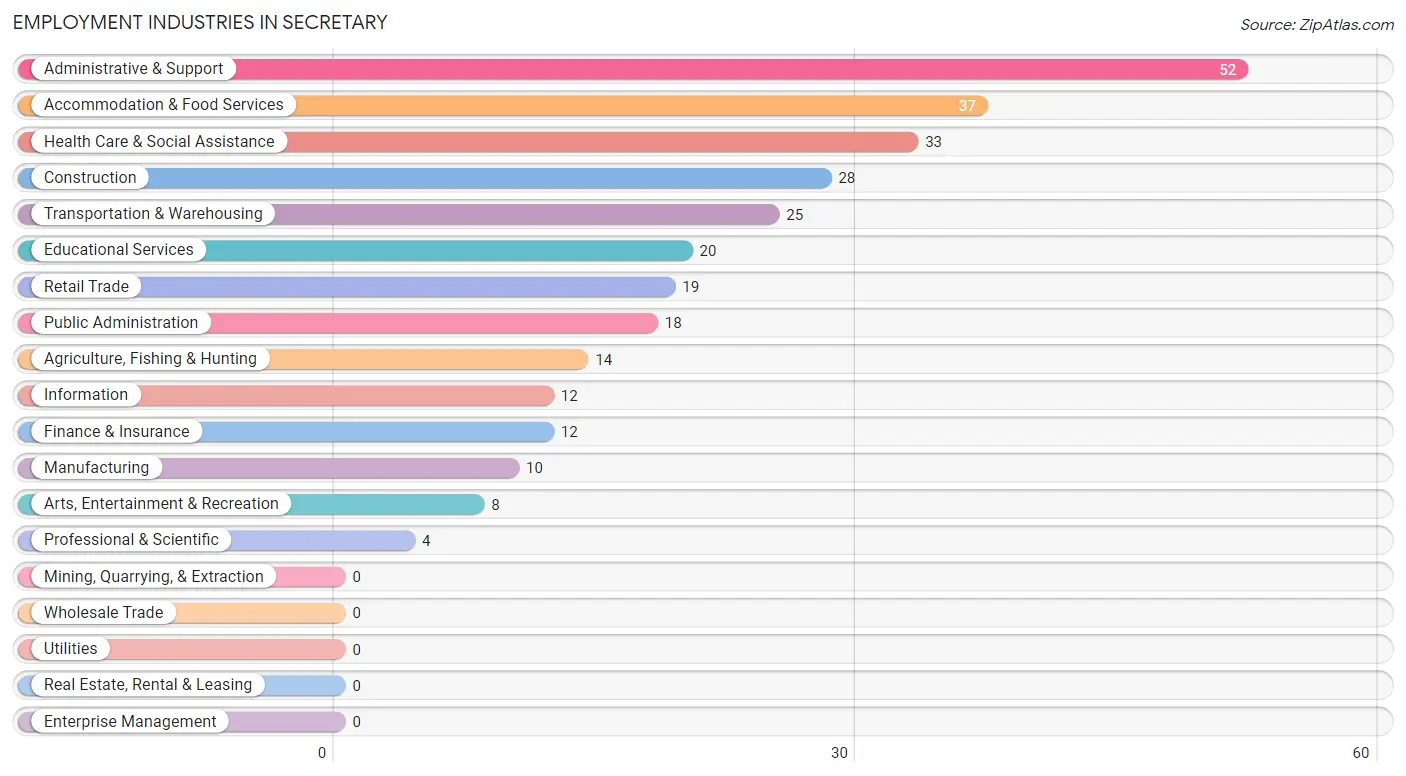
Employment Industries in Secretary
The major employment industries in Secretary include Administrative & Support (52 | 17.0%), Accommodation & Food Services (37 | 12.1%), Health Care & Social Assistance (33 | 10.8%), Construction (28 | 9.1%), and Transportation & Warehousing (25 | 8.2%).
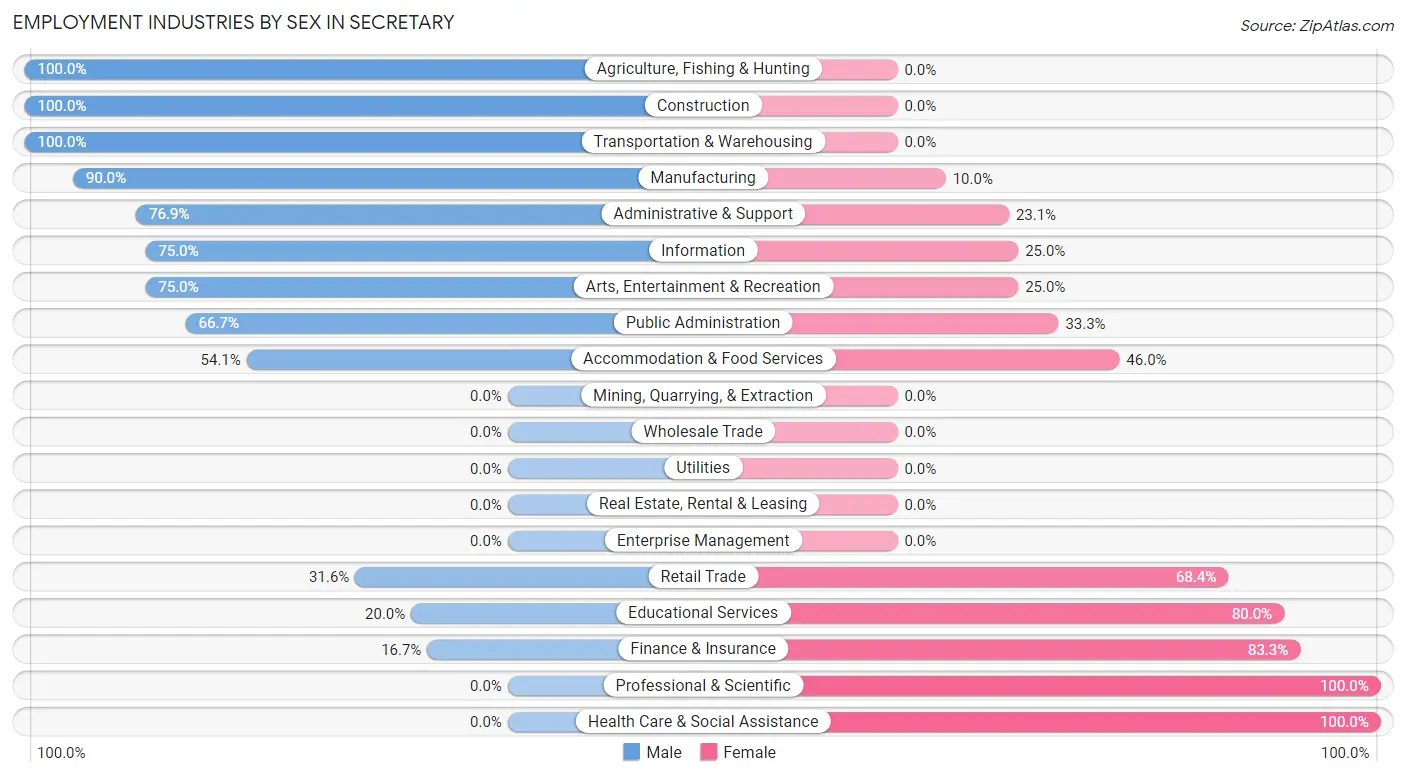
Employment Industries by Sex in Secretary
The Secretary industries that see more men than women are Agriculture, Fishing & Hunting (100.0%), Construction (100.0%), and Transportation & Warehousing (100.0%), whereas the industries that tend to have a higher number of women are Professional & Scientific (100.0%), Health Care & Social Assistance (100.0%), and Finance & Insurance (83.3%).
| Industry | Male | Female |
| Agriculture, Fishing & Hunting | 14 (100.0%) | 0 (0.0%) |
| Mining, Quarrying, & Extraction | 0 (0.0%) | 0 (0.0%) |
| Construction | 28 (100.0%) | 0 (0.0%) |
| Manufacturing | 9 (90.0%) | 1 (10.0%) |
| Wholesale Trade | 0 (0.0%) | 0 (0.0%) |
| Retail Trade | 6 (31.6%) | 13 (68.4%) |
| Transportation & Warehousing | 25 (100.0%) | 0 (0.0%) |
| Utilities | 0 (0.0%) | 0 (0.0%) |
| Information | 9 (75.0%) | 3 (25.0%) |
| Finance & Insurance | 2 (16.7%) | 10 (83.3%) |
| Real Estate, Rental & Leasing | 0 (0.0%) | 0 (0.0%) |
| Professional & Scientific | 0 (0.0%) | 4 (100.0%) |
| Enterprise Management | 0 (0.0%) | 0 (0.0%) |
| Administrative & Support | 40 (76.9%) | 12 (23.1%) |
| Educational Services | 4 (20.0%) | 16 (80.0%) |
| Health Care & Social Assistance | 0 (0.0%) | 33 (100.0%) |
| Arts, Entertainment & Recreation | 6 (75.0%) | 2 (25.0%) |
| Accommodation & Food Services | 20 (54.0%) | 17 (46.0%) |
| Public Administration | 12 (66.7%) | 6 (33.3%) |
| Total | 178 (58.2%) | 128 (41.8%) |
Education in Secretary
School Enrollment in Secretary
The most common levels of schooling among the 216 students in Secretary are middle school (89 | 41.2%), high school (68 | 31.5%), and elementary school (40 | 18.5%).
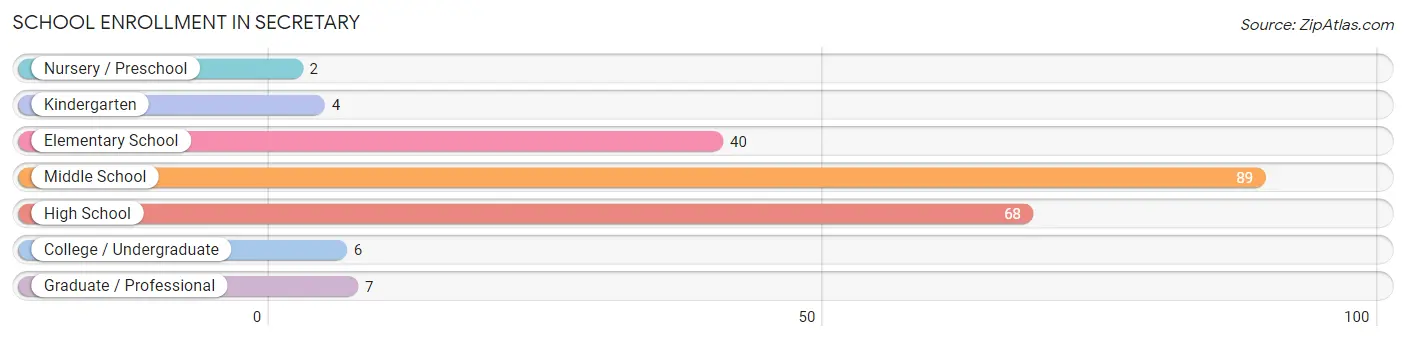
| School Level | # Students | % Students |
| Nursery / Preschool | 2 | 0.9% |
| Kindergarten | 4 | 1.8% |
| Elementary School | 40 | 18.5% |
| Middle School | 89 | 41.2% |
| High School | 68 | 31.5% |
| College / Undergraduate | 6 | 2.8% |
| Graduate / Professional | 7 | 3.2% |
| Total | 216 | 100.0% |
School Enrollment by Age by Funding Source in Secretary
Out of a total of 216 students who are enrolled in schools in Secretary, 35 (16.2%) attend a private institution, while the remaining 181 (83.8%) are enrolled in public schools. The age group of 18 to 19 year olds has the highest likelihood of being enrolled in private schools, with 4 (100.0% in the age bracket) enrolled. Conversely, the age group of 3 to 4 year olds has the lowest likelihood of being enrolled in a private school, with 2 (100.0% in the age bracket) attending a public institution.
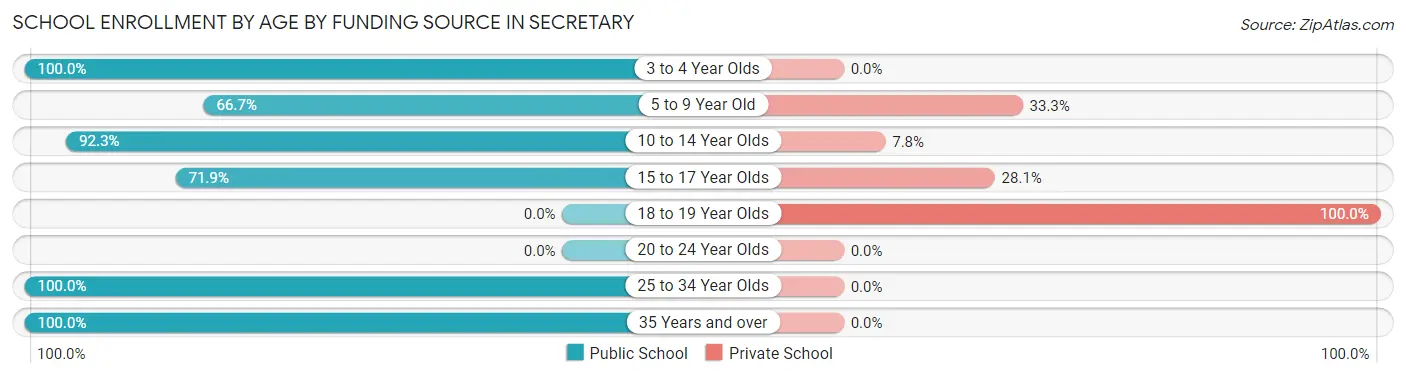
| Age Bracket | Public School | Private School |
| 3 to 4 Year Olds | 2 (100.0%) | 0 (0.0%) |
| 5 to 9 Year Old | 24 (66.7%) | 12 (33.3%) |
| 10 to 14 Year Olds | 119 (92.2%) | 10 (7.7%) |
| 15 to 17 Year Olds | 23 (71.9%) | 9 (28.1%) |
| 18 to 19 Year Olds | 0 (0.0%) | 4 (100.0%) |
| 20 to 24 Year Olds | 0 (0.0%) | 0 (0.0%) |
| 25 to 34 Year Olds | 2 (100.0%) | 0 (0.0%) |
| 35 Years and over | 11 (100.0%) | 0 (0.0%) |
| Total | 181 (83.8%) | 35 (16.2%) |
Educational Attainment by Field of Study in Secretary
Business (17 | 29.8%), education (15 | 26.3%), science & technology (10 | 17.5%), visual & performing arts (8 | 14.0%), and psychology (3 | 5.3%) are the most common fields of study among 57 individuals in Secretary who have obtained a bachelor's degree or higher.
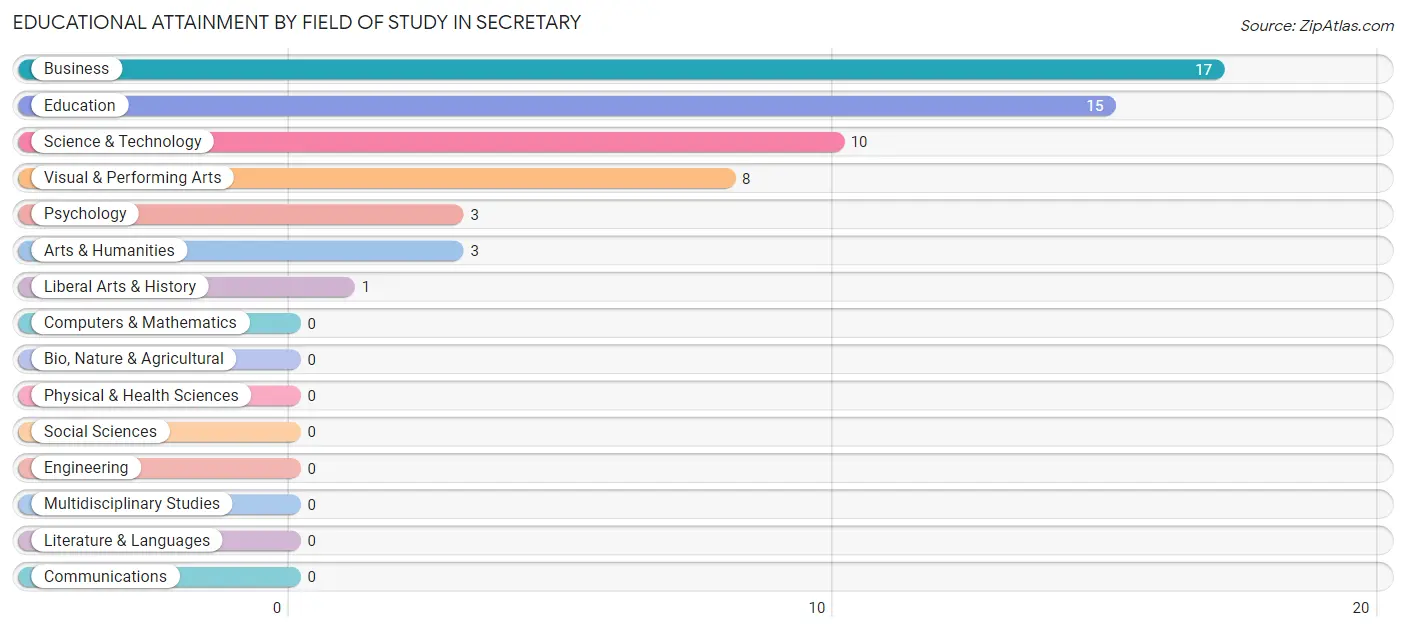
| Field of Study | # Graduates | % Graduates |
| Computers & Mathematics | 0 | 0.0% |
| Bio, Nature & Agricultural | 0 | 0.0% |
| Physical & Health Sciences | 0 | 0.0% |
| Psychology | 3 | 5.3% |
| Social Sciences | 0 | 0.0% |
| Engineering | 0 | 0.0% |
| Multidisciplinary Studies | 0 | 0.0% |
| Science & Technology | 10 | 17.5% |
| Business | 17 | 29.8% |
| Education | 15 | 26.3% |
| Literature & Languages | 0 | 0.0% |
| Liberal Arts & History | 1 | 1.8% |
| Visual & Performing Arts | 8 | 14.0% |
| Communications | 0 | 0.0% |
| Arts & Humanities | 3 | 5.3% |
| Total | 57 | 100.0% |
Transportation & Commute in Secretary
Vehicle Availability by Sex in Secretary
The most prevalent vehicle ownership categories in Secretary are males with 3 vehicles (62, accounting for 35.4%) and females with 3 vehicles (39, making up 48.4%).
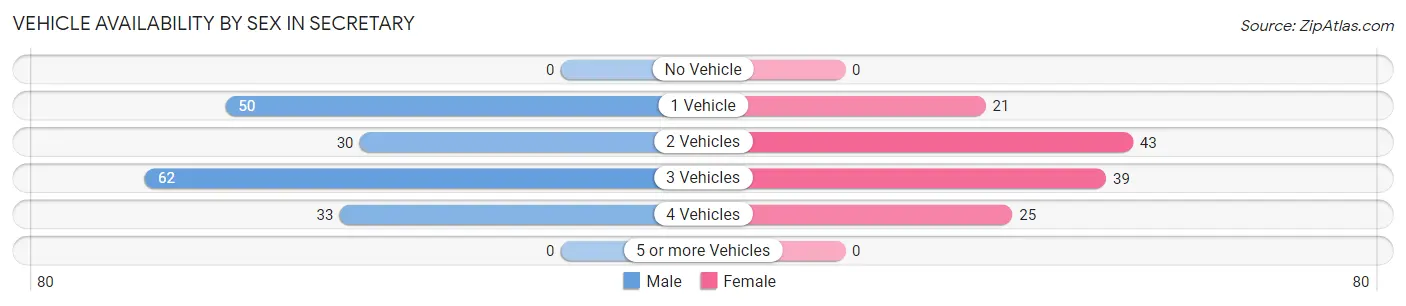
| Vehicles Available | Male | Female |
| No Vehicle | 0 (0.0%) | 0 (0.0%) |
| 1 Vehicle | 50 (28.6%) | 21 (16.4%) |
| 2 Vehicles | 30 (17.1%) | 43 (33.6%) |
| 3 Vehicles | 62 (35.4%) | 39 (30.5%) |
| 4 Vehicles | 33 (18.9%) | 25 (19.5%) |
| 5 or more Vehicles | 0 (0.0%) | 0 (0.0%) |
| Total | 175 (100.0%) | 128 (100.0%) |
Commute Time in Secretary
The most frequently occuring commute durations in Secretary are 15 to 19 minutes (81 commuters, 27.9%), 30 to 34 minutes (50 commuters, 17.2%), and 20 to 24 minutes (45 commuters, 15.5%).
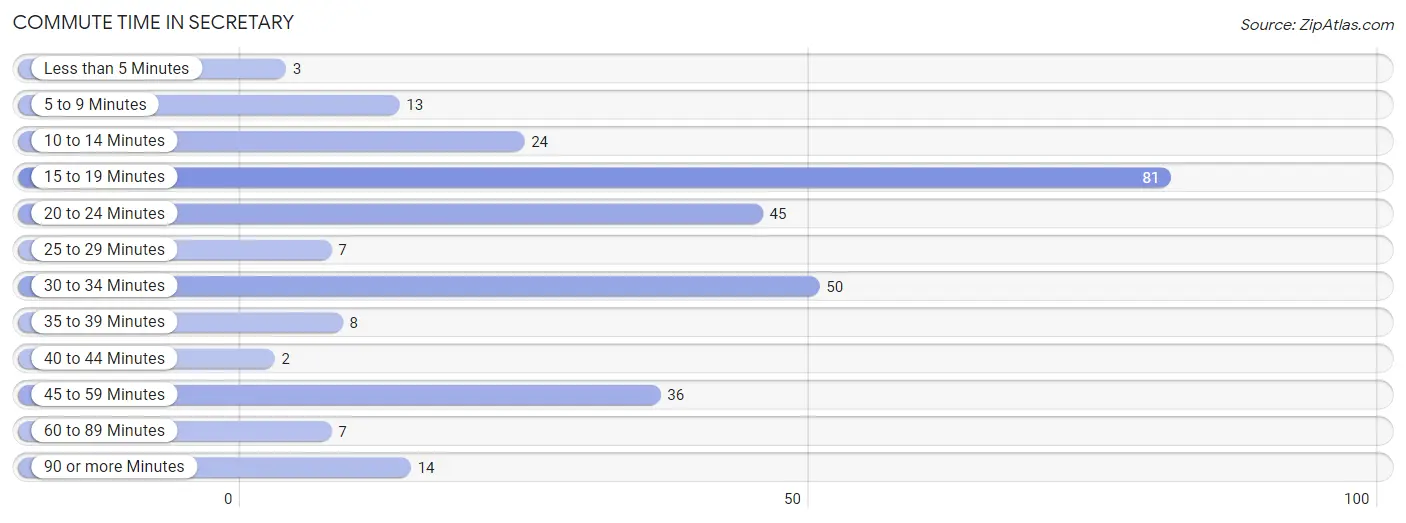
| Commute Time | # Commuters | % Commuters |
| Less than 5 Minutes | 3 | 1.0% |
| 5 to 9 Minutes | 13 | 4.5% |
| 10 to 14 Minutes | 24 | 8.3% |
| 15 to 19 Minutes | 81 | 27.9% |
| 20 to 24 Minutes | 45 | 15.5% |
| 25 to 29 Minutes | 7 | 2.4% |
| 30 to 34 Minutes | 50 | 17.2% |
| 35 to 39 Minutes | 8 | 2.8% |
| 40 to 44 Minutes | 2 | 0.7% |
| 45 to 59 Minutes | 36 | 12.4% |
| 60 to 89 Minutes | 7 | 2.4% |
| 90 or more Minutes | 14 | 4.8% |
Commute Time by Sex in Secretary
The most common commute times in Secretary are 15 to 19 minutes (70 commuters, 40.0%) for males and 20 to 24 minutes (29 commuters, 25.2%) for females.
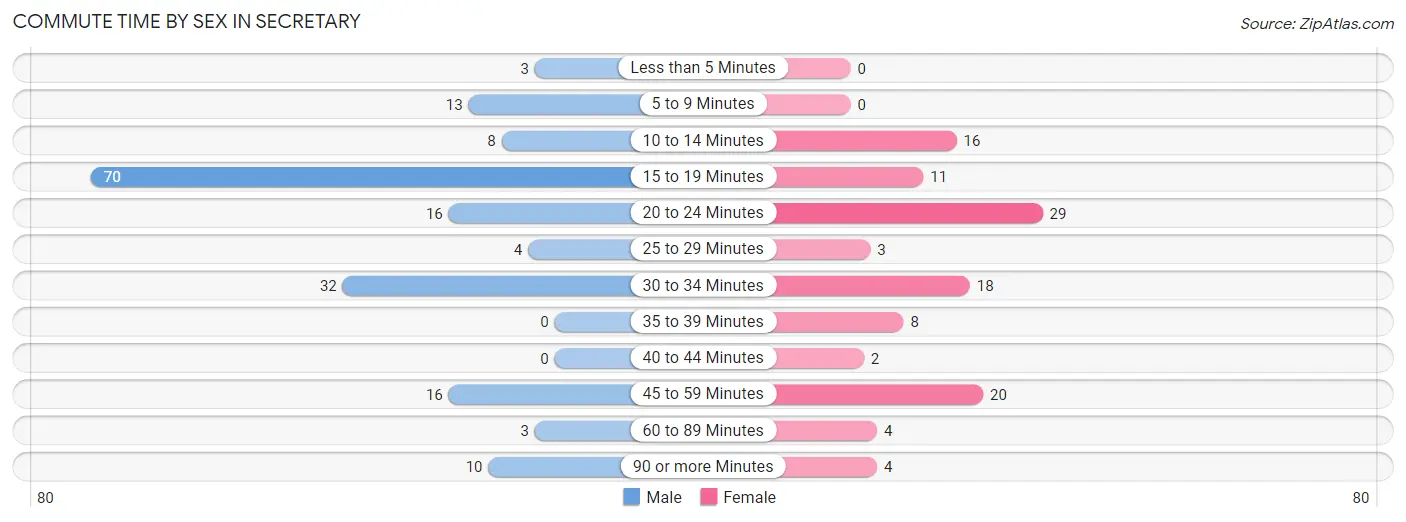
| Commute Time | Male | Female |
| Less than 5 Minutes | 3 (1.7%) | 0 (0.0%) |
| 5 to 9 Minutes | 13 (7.4%) | 0 (0.0%) |
| 10 to 14 Minutes | 8 (4.6%) | 16 (13.9%) |
| 15 to 19 Minutes | 70 (40.0%) | 11 (9.6%) |
| 20 to 24 Minutes | 16 (9.1%) | 29 (25.2%) |
| 25 to 29 Minutes | 4 (2.3%) | 3 (2.6%) |
| 30 to 34 Minutes | 32 (18.3%) | 18 (15.7%) |
| 35 to 39 Minutes | 0 (0.0%) | 8 (7.0%) |
| 40 to 44 Minutes | 0 (0.0%) | 2 (1.7%) |
| 45 to 59 Minutes | 16 (9.1%) | 20 (17.4%) |
| 60 to 89 Minutes | 3 (1.7%) | 4 (3.5%) |
| 90 or more Minutes | 10 (5.7%) | 4 (3.5%) |
Time of Departure to Work by Sex in Secretary
The most frequent times of departure to work in Secretary are 6:30 AM to 6:59 AM (50, 28.6%) for males and 7:00 AM to 7:29 AM (19, 16.5%) for females.
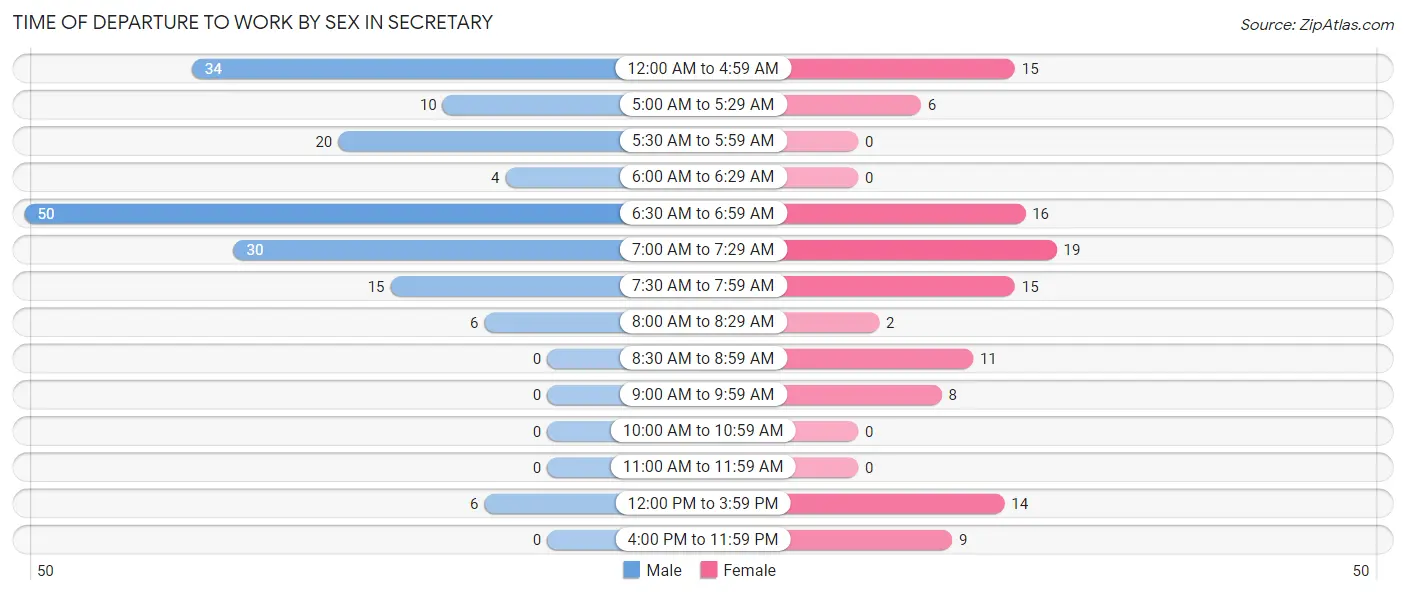
| Time of Departure | Male | Female |
| 12:00 AM to 4:59 AM | 34 (19.4%) | 15 (13.0%) |
| 5:00 AM to 5:29 AM | 10 (5.7%) | 6 (5.2%) |
| 5:30 AM to 5:59 AM | 20 (11.4%) | 0 (0.0%) |
| 6:00 AM to 6:29 AM | 4 (2.3%) | 0 (0.0%) |
| 6:30 AM to 6:59 AM | 50 (28.6%) | 16 (13.9%) |
| 7:00 AM to 7:29 AM | 30 (17.1%) | 19 (16.5%) |
| 7:30 AM to 7:59 AM | 15 (8.6%) | 15 (13.0%) |
| 8:00 AM to 8:29 AM | 6 (3.4%) | 2 (1.7%) |
| 8:30 AM to 8:59 AM | 0 (0.0%) | 11 (9.6%) |
| 9:00 AM to 9:59 AM | 0 (0.0%) | 8 (7.0%) |
| 10:00 AM to 10:59 AM | 0 (0.0%) | 0 (0.0%) |
| 11:00 AM to 11:59 AM | 0 (0.0%) | 0 (0.0%) |
| 12:00 PM to 3:59 PM | 6 (3.4%) | 14 (12.2%) |
| 4:00 PM to 11:59 PM | 0 (0.0%) | 9 (7.8%) |
| Total | 175 (100.0%) | 115 (100.0%) |
Housing Occupancy in Secretary
Occupancy by Ownership in Secretary
Of the total 214 dwellings in Secretary, owner-occupied units account for 132 (61.7%), while renter-occupied units make up 82 (38.3%).
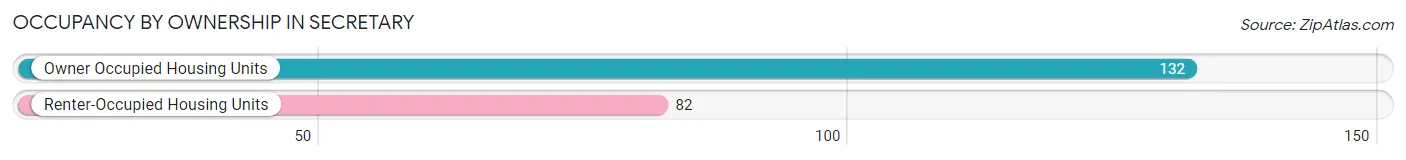
| Occupancy | # Housing Units | % Housing Units |
| Owner Occupied Housing Units | 132 | 61.7% |
| Renter-Occupied Housing Units | 82 | 38.3% |
| Total Occupied Housing Units | 214 | 100.0% |
Occupancy by Household Size in Secretary
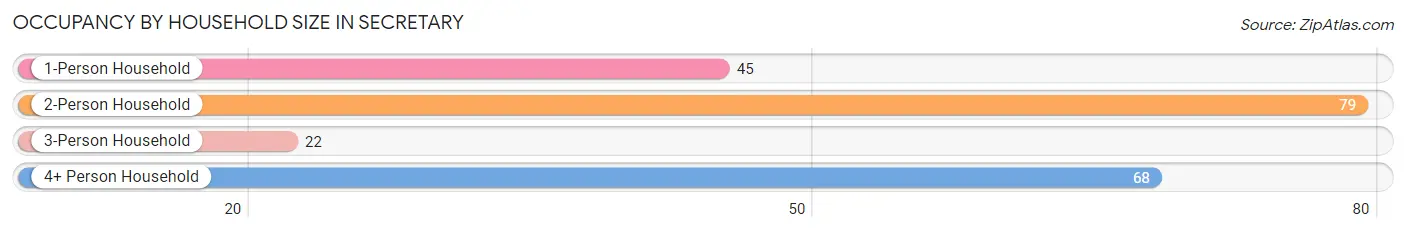
| Household Size | # Housing Units | % Housing Units |
| 1-Person Household | 45 | 21.0% |
| 2-Person Household | 79 | 36.9% |
| 3-Person Household | 22 | 10.3% |
| 4+ Person Household | 68 | 31.8% |
| Total Housing Units | 214 | 100.0% |
Occupancy by Ownership by Household Size in Secretary
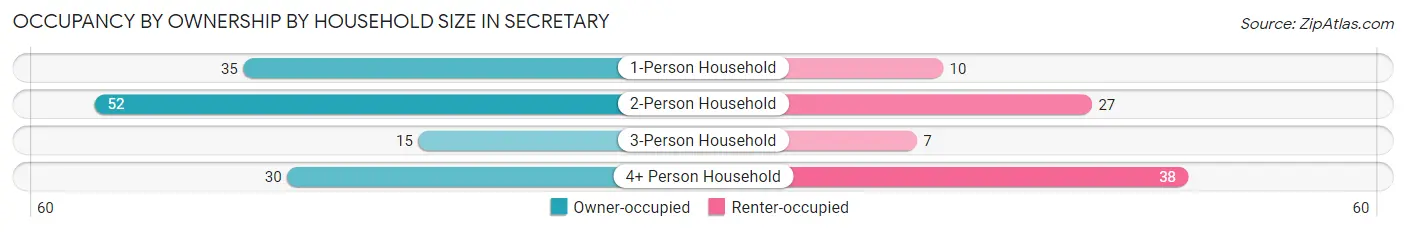
| Household Size | Owner-occupied | Renter-occupied |
| 1-Person Household | 35 (77.8%) | 10 (22.2%) |
| 2-Person Household | 52 (65.8%) | 27 (34.2%) |
| 3-Person Household | 15 (68.2%) | 7 (31.8%) |
| 4+ Person Household | 30 (44.1%) | 38 (55.9%) |
| Total Housing Units | 132 (61.7%) | 82 (38.3%) |
Occupancy by Educational Attainment in Secretary
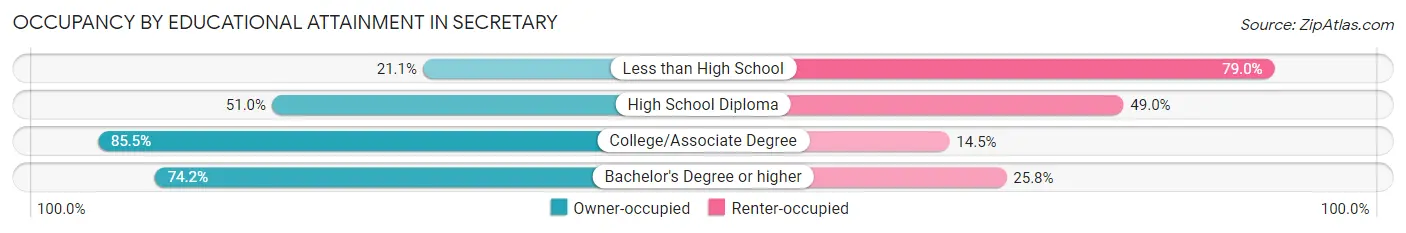
| Household Size | Owner-occupied | Renter-occupied |
| Less than High School | 4 (21.0%) | 15 (78.9%) |
| High School Diploma | 52 (51.0%) | 50 (49.0%) |
| College/Associate Degree | 53 (85.5%) | 9 (14.5%) |
| Bachelor's Degree or higher | 23 (74.2%) | 8 (25.8%) |
Occupancy by Age of Householder in Secretary
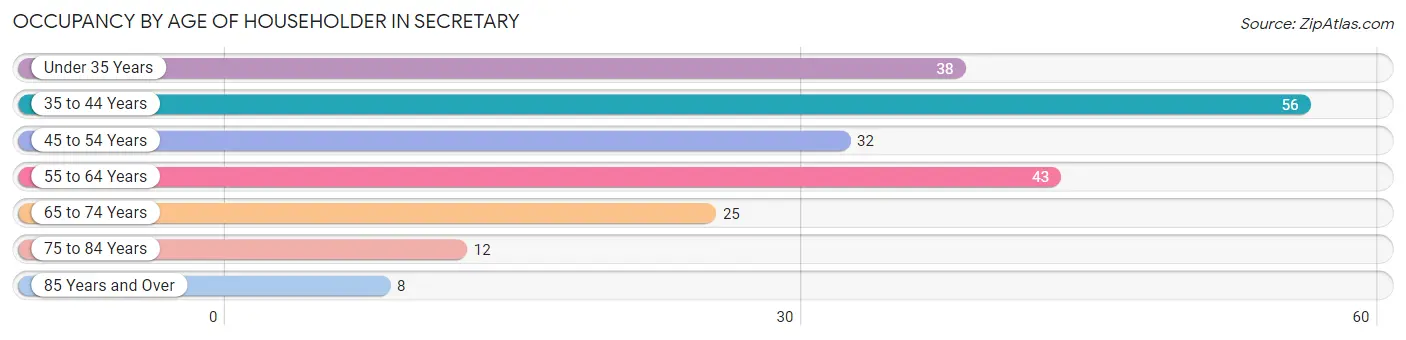
| Age Bracket | # Households | % Households |
| Under 35 Years | 38 | 17.8% |
| 35 to 44 Years | 56 | 26.2% |
| 45 to 54 Years | 32 | 14.9% |
| 55 to 64 Years | 43 | 20.1% |
| 65 to 74 Years | 25 | 11.7% |
| 75 to 84 Years | 12 | 5.6% |
| 85 Years and Over | 8 | 3.7% |
| Total | 214 | 100.0% |
Housing Finances in Secretary
Median Income by Occupancy in Secretary
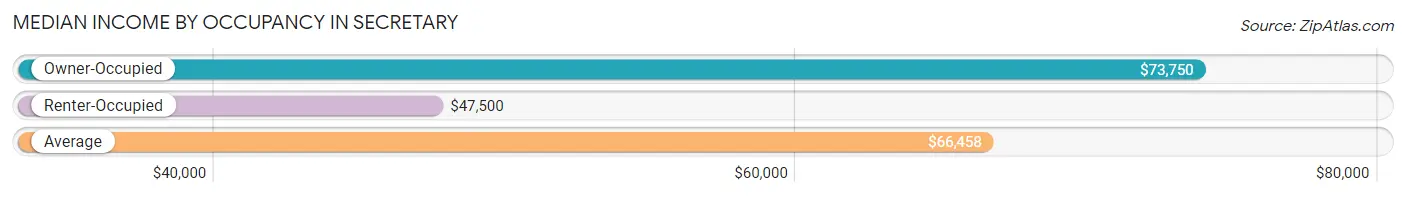
| Occupancy Type | # Households | Median Income |
| Owner-Occupied | 132 (61.7%) | $73,750 |
| Renter-Occupied | 82 (38.3%) | $47,500 |
| Average | 214 (100.0%) | $66,458 |
Occupancy by Householder Income Bracket in Secretary
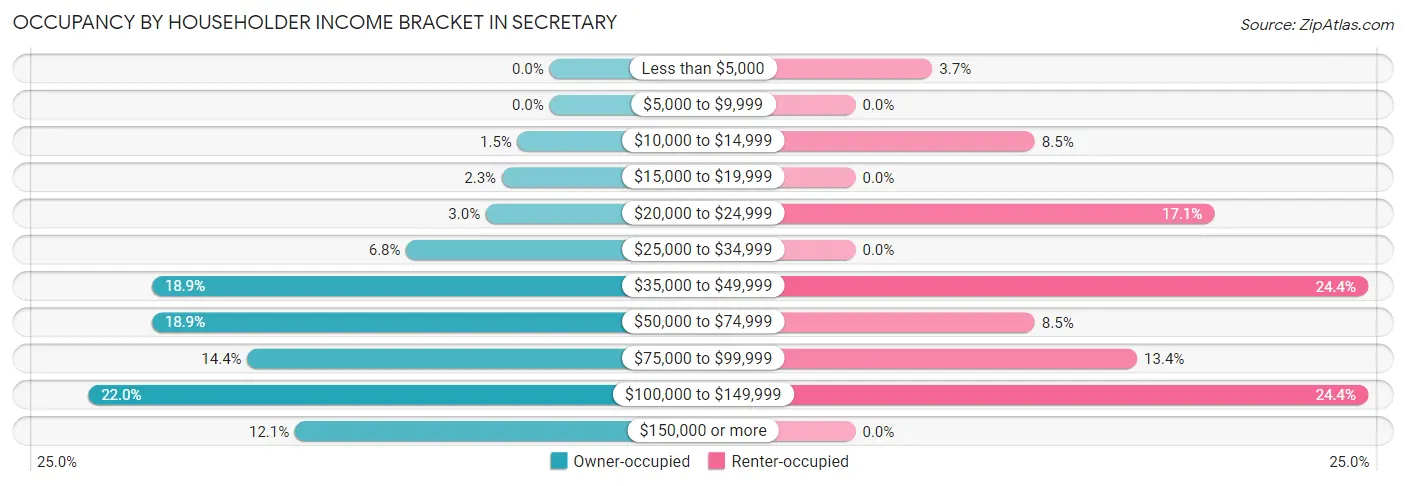
| Income Bracket | Owner-occupied | Renter-occupied |
| Less than $5,000 | 0 (0.0%) | 3 (3.7%) |
| $5,000 to $9,999 | 0 (0.0%) | 0 (0.0%) |
| $10,000 to $14,999 | 2 (1.5%) | 7 (8.5%) |
| $15,000 to $19,999 | 3 (2.3%) | 0 (0.0%) |
| $20,000 to $24,999 | 4 (3.0%) | 14 (17.1%) |
| $25,000 to $34,999 | 9 (6.8%) | 0 (0.0%) |
| $35,000 to $49,999 | 25 (18.9%) | 20 (24.4%) |
| $50,000 to $74,999 | 25 (18.9%) | 7 (8.5%) |
| $75,000 to $99,999 | 19 (14.4%) | 11 (13.4%) |
| $100,000 to $149,999 | 29 (22.0%) | 20 (24.4%) |
| $150,000 or more | 16 (12.1%) | 0 (0.0%) |
| Total | 132 (100.0%) | 82 (100.0%) |
Monthly Housing Cost Tiers in Secretary
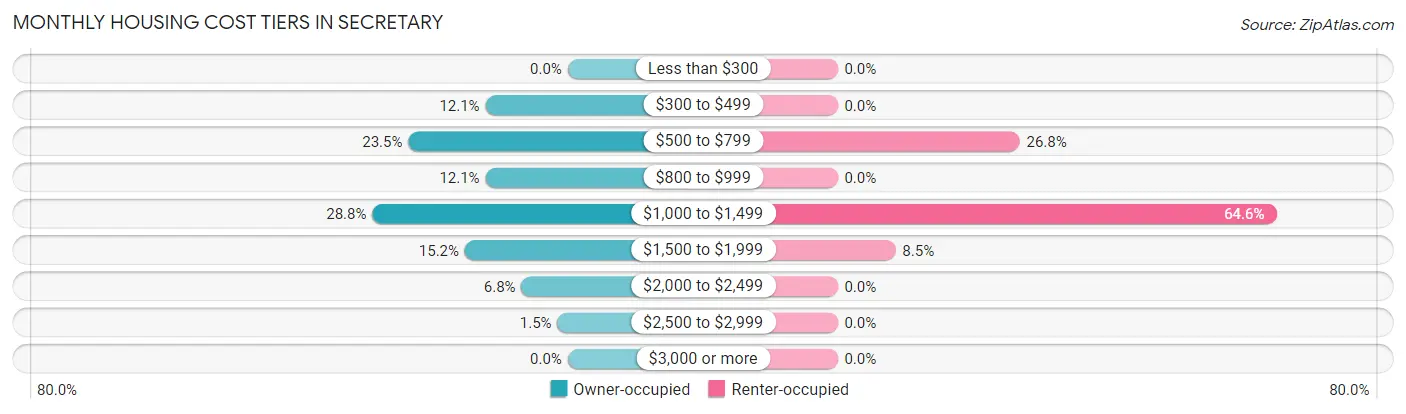
| Monthly Cost | Owner-occupied | Renter-occupied |
| Less than $300 | 0 (0.0%) | 0 (0.0%) |
| $300 to $499 | 16 (12.1%) | 0 (0.0%) |
| $500 to $799 | 31 (23.5%) | 22 (26.8%) |
| $800 to $999 | 16 (12.1%) | 0 (0.0%) |
| $1,000 to $1,499 | 38 (28.8%) | 53 (64.6%) |
| $1,500 to $1,999 | 20 (15.1%) | 7 (8.5%) |
| $2,000 to $2,499 | 9 (6.8%) | 0 (0.0%) |
| $2,500 to $2,999 | 2 (1.5%) | 0 (0.0%) |
| $3,000 or more | 0 (0.0%) | 0 (0.0%) |
| Total | 132 (100.0%) | 82 (100.0%) |
Physical Housing Characteristics in Secretary
Housing Structures in Secretary
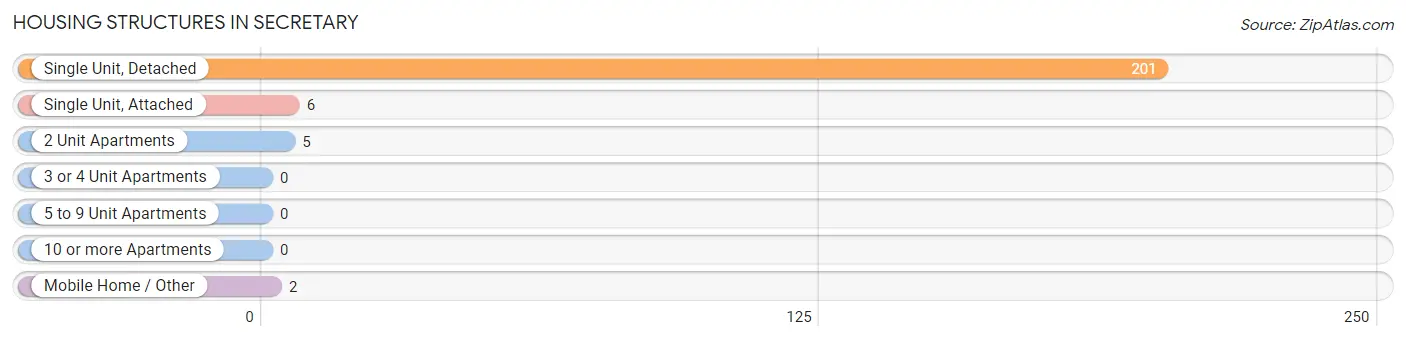
| Structure Type | # Housing Units | % Housing Units |
| Single Unit, Detached | 201 | 93.9% |
| Single Unit, Attached | 6 | 2.8% |
| 2 Unit Apartments | 5 | 2.3% |
| 3 or 4 Unit Apartments | 0 | 0.0% |
| 5 to 9 Unit Apartments | 0 | 0.0% |
| 10 or more Apartments | 0 | 0.0% |
| Mobile Home / Other | 2 | 0.9% |
| Total | 214 | 100.0% |
Housing Structures by Occupancy in Secretary
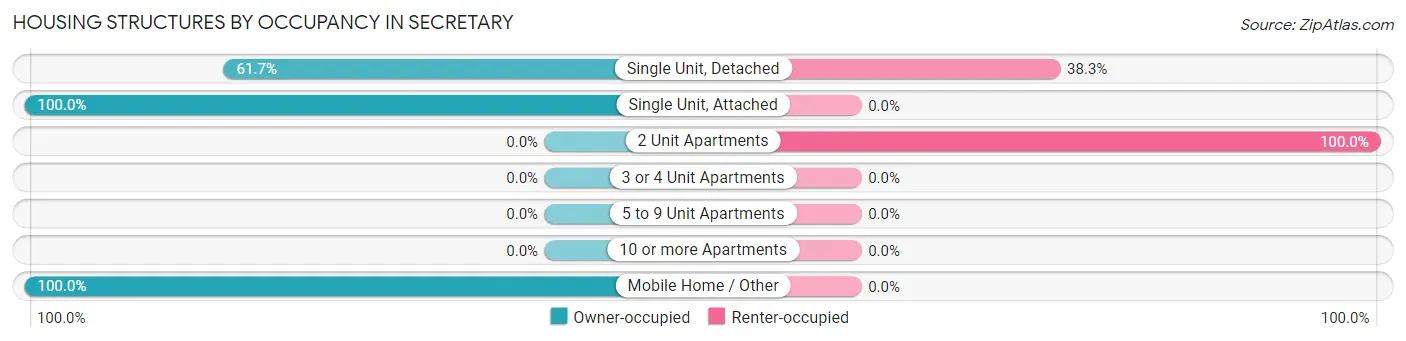
| Structure Type | Owner-occupied | Renter-occupied |
| Single Unit, Detached | 124 (61.7%) | 77 (38.3%) |
| Single Unit, Attached | 6 (100.0%) | 0 (0.0%) |
| 2 Unit Apartments | 0 (0.0%) | 5 (100.0%) |
| 3 or 4 Unit Apartments | 0 (0.0%) | 0 (0.0%) |
| 5 to 9 Unit Apartments | 0 (0.0%) | 0 (0.0%) |
| 10 or more Apartments | 0 (0.0%) | 0 (0.0%) |
| Mobile Home / Other | 2 (100.0%) | 0 (0.0%) |
| Total | 132 (61.7%) | 82 (38.3%) |
Housing Structures by Number of Rooms in Secretary
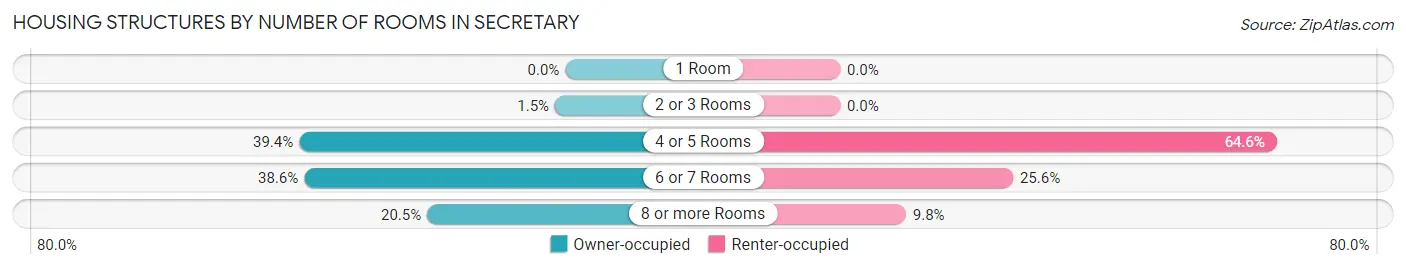
| Number of Rooms | Owner-occupied | Renter-occupied |
| 1 Room | 0 (0.0%) | 0 (0.0%) |
| 2 or 3 Rooms | 2 (1.5%) | 0 (0.0%) |
| 4 or 5 Rooms | 52 (39.4%) | 53 (64.6%) |
| 6 or 7 Rooms | 51 (38.6%) | 21 (25.6%) |
| 8 or more Rooms | 27 (20.4%) | 8 (9.8%) |
| Total | 132 (100.0%) | 82 (100.0%) |
Housing Structure by Heating Type in Secretary
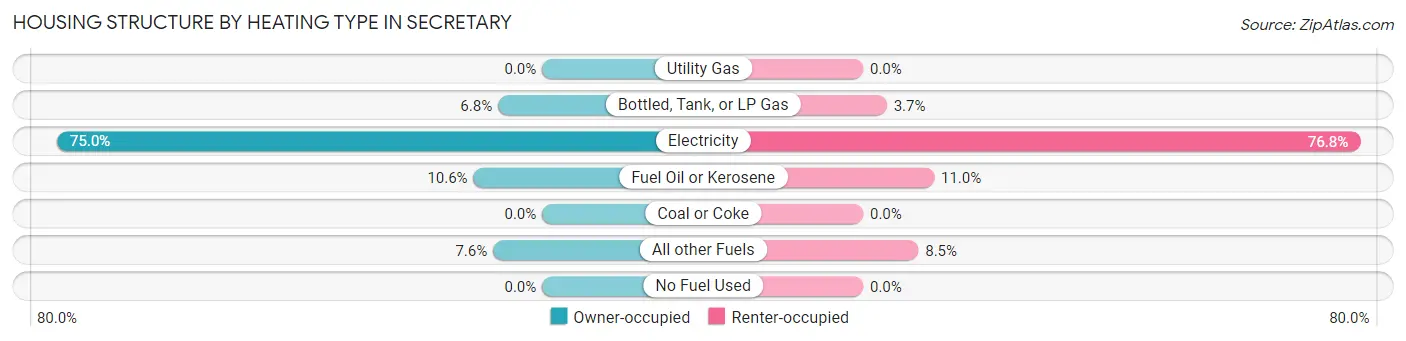
| Heating Type | Owner-occupied | Renter-occupied |
| Utility Gas | 0 (0.0%) | 0 (0.0%) |
| Bottled, Tank, or LP Gas | 9 (6.8%) | 3 (3.7%) |
| Electricity | 99 (75.0%) | 63 (76.8%) |
| Fuel Oil or Kerosene | 14 (10.6%) | 9 (11.0%) |
| Coal or Coke | 0 (0.0%) | 0 (0.0%) |
| All other Fuels | 10 (7.6%) | 7 (8.5%) |
| No Fuel Used | 0 (0.0%) | 0 (0.0%) |
| Total | 132 (100.0%) | 82 (100.0%) |
Household Vehicle Usage in Secretary
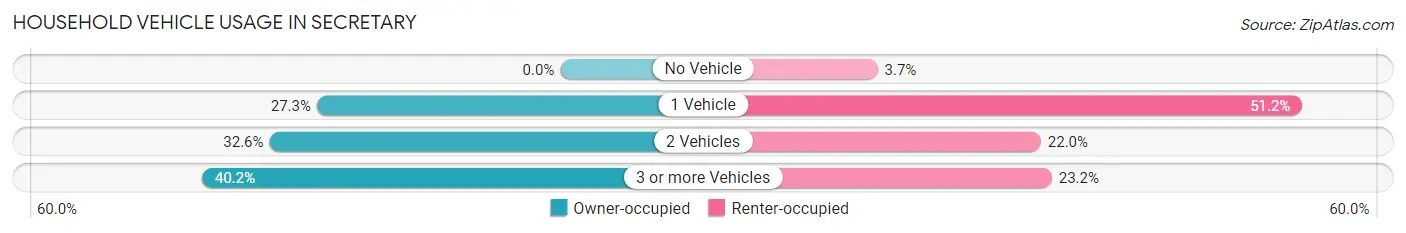
| Vehicles per Household | Owner-occupied | Renter-occupied |
| No Vehicle | 0 (0.0%) | 3 (3.7%) |
| 1 Vehicle | 36 (27.3%) | 42 (51.2%) |
| 2 Vehicles | 43 (32.6%) | 18 (22.0%) |
| 3 or more Vehicles | 53 (40.2%) | 19 (23.2%) |
| Total | 132 (100.0%) | 82 (100.0%) |
Real Estate & Mortgages in Secretary
Real Estate and Mortgage Overview in Secretary
| Characteristic | Without Mortgage | With Mortgage |
| Housing Units | 49 | 83 |
| Median Property Value | $198,400 | $154,500 |
| Median Household Income | - | - |
| Monthly Housing Costs | $609 | $0 |
| Real Estate Taxes | $1,369 | $0 |
Property Value by Mortgage Status in Secretary
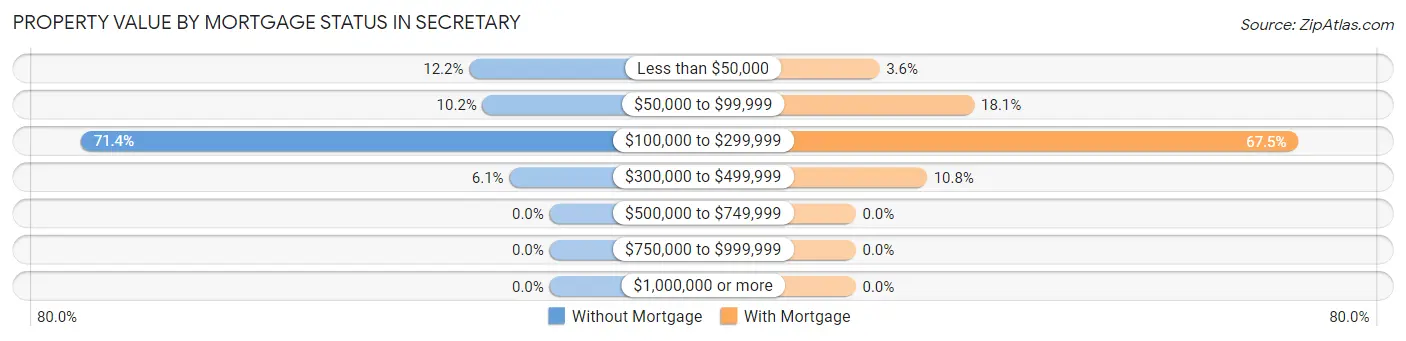
| Property Value | Without Mortgage | With Mortgage |
| Less than $50,000 | 6 (12.2%) | 3 (3.6%) |
| $50,000 to $99,999 | 5 (10.2%) | 15 (18.1%) |
| $100,000 to $299,999 | 35 (71.4%) | 56 (67.5%) |
| $300,000 to $499,999 | 3 (6.1%) | 9 (10.8%) |
| $500,000 to $749,999 | 0 (0.0%) | 0 (0.0%) |
| $750,000 to $999,999 | 0 (0.0%) | 0 (0.0%) |
| $1,000,000 or more | 0 (0.0%) | 0 (0.0%) |
| Total | 49 (100.0%) | 83 (100.0%) |
Household Income by Mortgage Status in Secretary
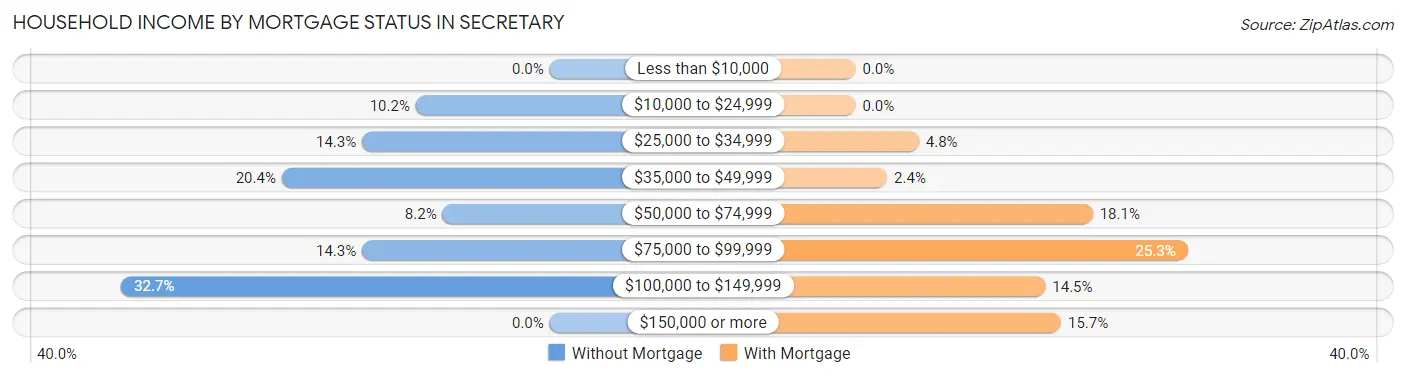
| Household Income | Without Mortgage | With Mortgage |
| Less than $10,000 | 0 (0.0%) | 0 (0.0%) |
| $10,000 to $24,999 | 5 (10.2%) | 0 (0.0%) |
| $25,000 to $34,999 | 7 (14.3%) | 4 (4.8%) |
| $35,000 to $49,999 | 10 (20.4%) | 2 (2.4%) |
| $50,000 to $74,999 | 4 (8.2%) | 15 (18.1%) |
| $75,000 to $99,999 | 7 (14.3%) | 21 (25.3%) |
| $100,000 to $149,999 | 16 (32.7%) | 12 (14.5%) |
| $150,000 or more | 0 (0.0%) | 13 (15.7%) |
| Total | 49 (100.0%) | 83 (100.0%) |
Property Value to Household Income Ratio in Secretary
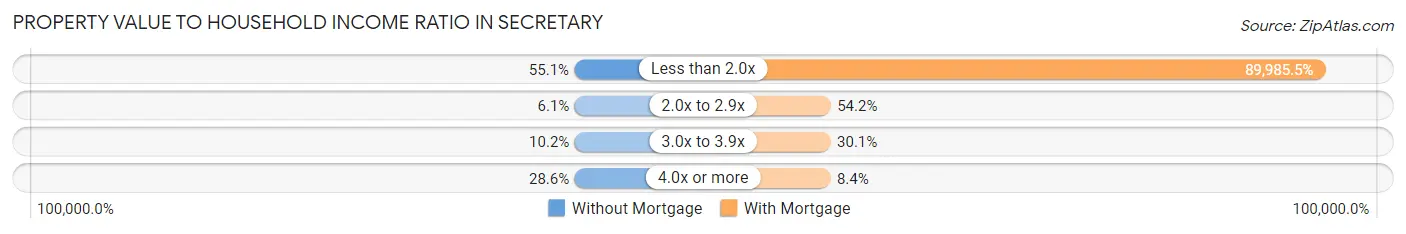
| Value-to-Income Ratio | Without Mortgage | With Mortgage |
| Less than 2.0x | 27 (55.1%) | 74,688 (89,985.5%) |
| 2.0x to 2.9x | 3 (6.1%) | 45 (54.2%) |
| 3.0x to 3.9x | 5 (10.2%) | 25 (30.1%) |
| 4.0x or more | 14 (28.6%) | 7 (8.4%) |
| Total | 49 (100.0%) | 83 (100.0%) |
Real Estate Taxes by Mortgage Status in Secretary
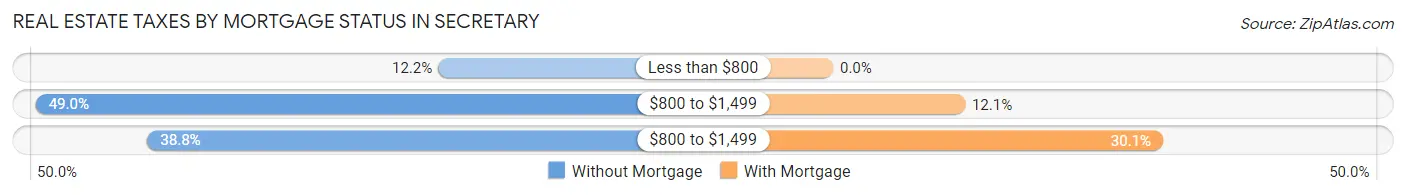
| Property Taxes | Without Mortgage | With Mortgage |
| Less than $800 | 6 (12.2%) | 0 (0.0%) |
| $800 to $1,499 | 24 (49.0%) | 10 (12.0%) |
| $800 to $1,499 | 19 (38.8%) | 25 (30.1%) |
| Total | 49 (100.0%) | 83 (100.0%) |
Health & Disability in Secretary
Health Insurance Coverage by Age in Secretary
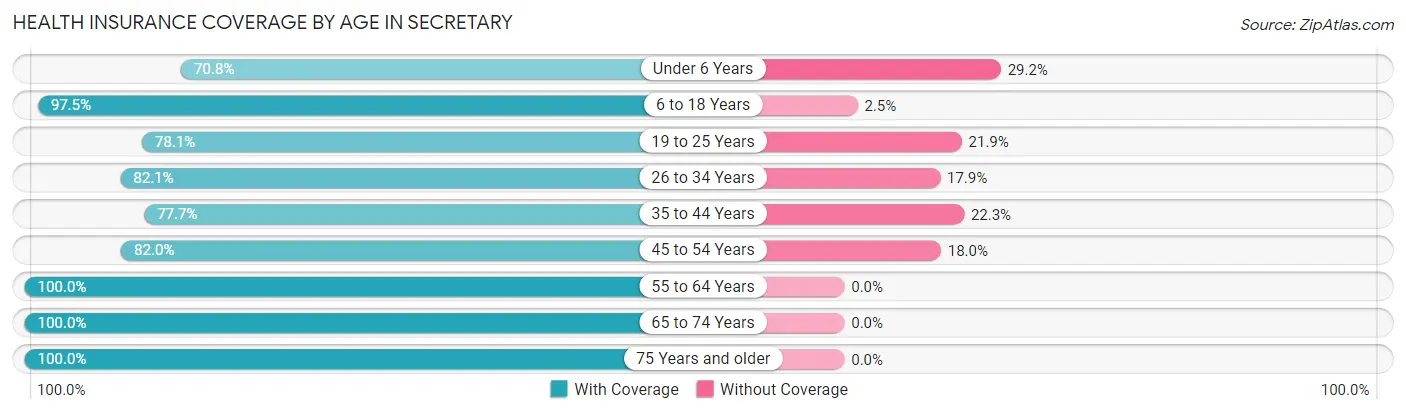
| Age Bracket | With Coverage | Without Coverage |
| Under 6 Years | 17 (70.8%) | 7 (29.2%) |
| 6 to 18 Years | 198 (97.5%) | 5 (2.5%) |
| 19 to 25 Years | 25 (78.1%) | 7 (21.9%) |
| 26 to 34 Years | 69 (82.1%) | 15 (17.9%) |
| 35 to 44 Years | 94 (77.7%) | 27 (22.3%) |
| 45 to 54 Years | 41 (82.0%) | 9 (18.0%) |
| 55 to 64 Years | 65 (100.0%) | 0 (0.0%) |
| 65 to 74 Years | 34 (100.0%) | 0 (0.0%) |
| 75 Years and older | 29 (100.0%) | 0 (0.0%) |
| Total | 572 (89.1%) | 70 (10.9%) |
Health Insurance Coverage by Citizenship Status in Secretary
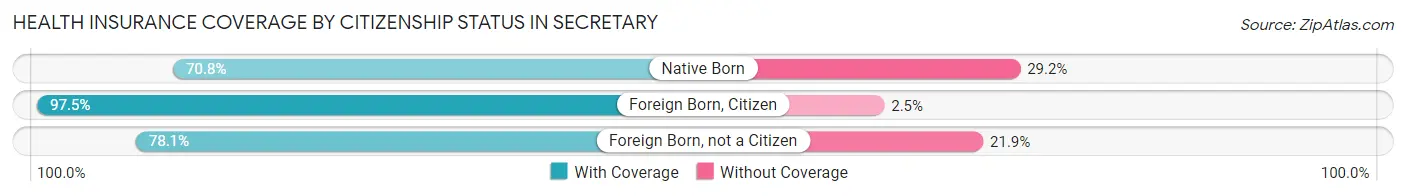
| Citizenship Status | With Coverage | Without Coverage |
| Native Born | 17 (70.8%) | 7 (29.2%) |
| Foreign Born, Citizen | 198 (97.5%) | 5 (2.5%) |
| Foreign Born, not a Citizen | 25 (78.1%) | 7 (21.9%) |
Health Insurance Coverage by Household Income in Secretary
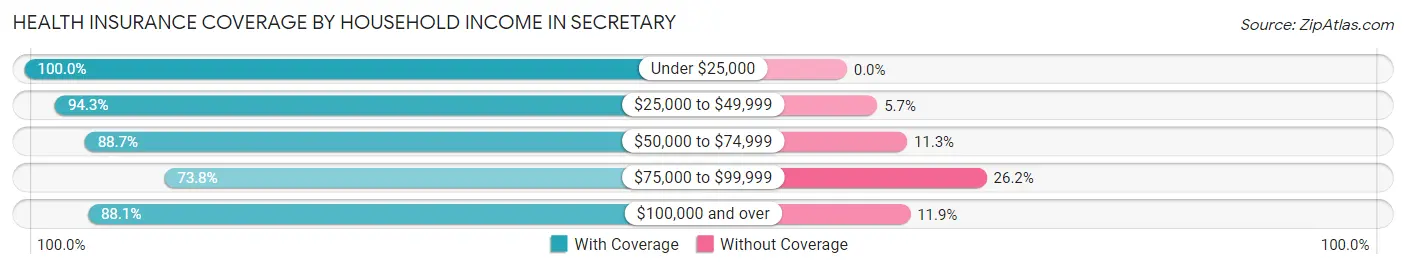
| Household Income | With Coverage | Without Coverage |
| Under $25,000 | 68 (100.0%) | 0 (0.0%) |
| $25,000 to $49,999 | 149 (94.3%) | 9 (5.7%) |
| $50,000 to $74,999 | 63 (88.7%) | 8 (11.3%) |
| $75,000 to $99,999 | 62 (73.8%) | 22 (26.2%) |
| $100,000 and over | 230 (88.1%) | 31 (11.9%) |
Public vs Private Health Insurance Coverage by Age in Secretary
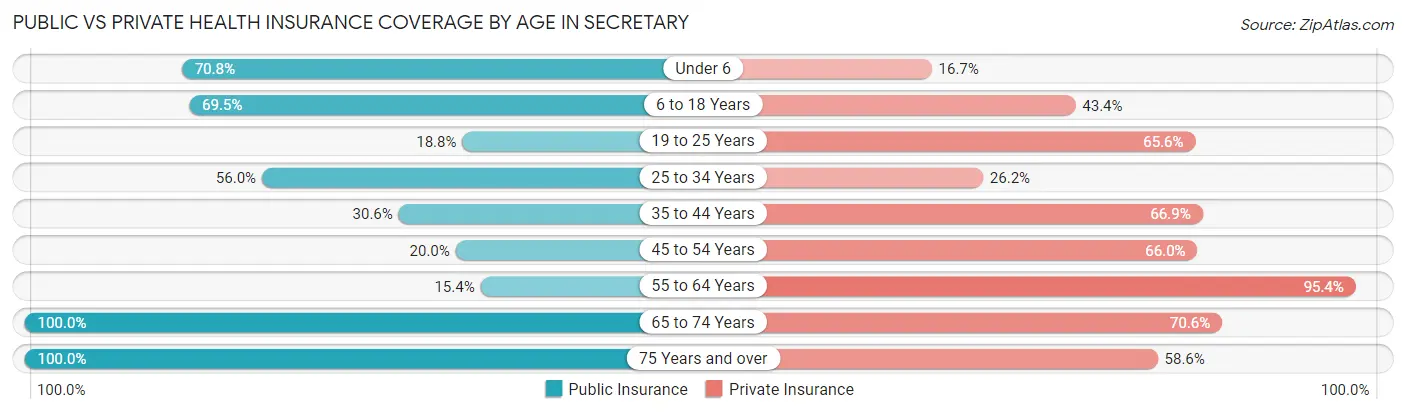
| Age Bracket | Public Insurance | Private Insurance |
| Under 6 | 17 (70.8%) | 4 (16.7%) |
| 6 to 18 Years | 141 (69.5%) | 88 (43.3%) |
| 19 to 25 Years | 6 (18.8%) | 21 (65.6%) |
| 25 to 34 Years | 47 (55.9%) | 22 (26.2%) |
| 35 to 44 Years | 37 (30.6%) | 81 (66.9%) |
| 45 to 54 Years | 10 (20.0%) | 33 (66.0%) |
| 55 to 64 Years | 10 (15.4%) | 62 (95.4%) |
| 65 to 74 Years | 34 (100.0%) | 24 (70.6%) |
| 75 Years and over | 29 (100.0%) | 17 (58.6%) |
| Total | 331 (51.6%) | 352 (54.8%) |
Disability Status by Sex by Age in Secretary
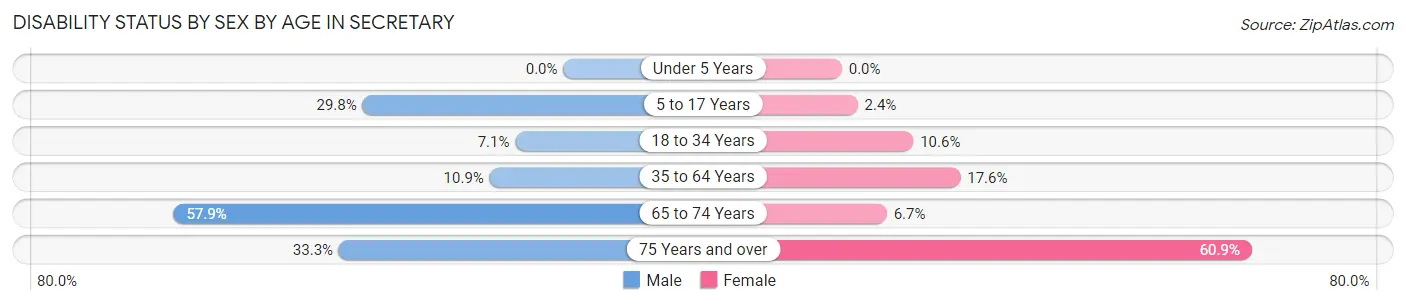
| Age Bracket | Male | Female |
| Under 5 Years | 0 (0.0%) | 0 (0.0%) |
| 5 to 17 Years | 34 (29.8%) | 2 (2.4%) |
| 18 to 34 Years | 4 (7.1%) | 7 (10.6%) |
| 35 to 64 Years | 14 (10.9%) | 19 (17.6%) |
| 65 to 74 Years | 11 (57.9%) | 1 (6.7%) |
| 75 Years and over | 2 (33.3%) | 14 (60.9%) |
Disability Class by Sex by Age in Secretary
Disability Class: Hearing Difficulty
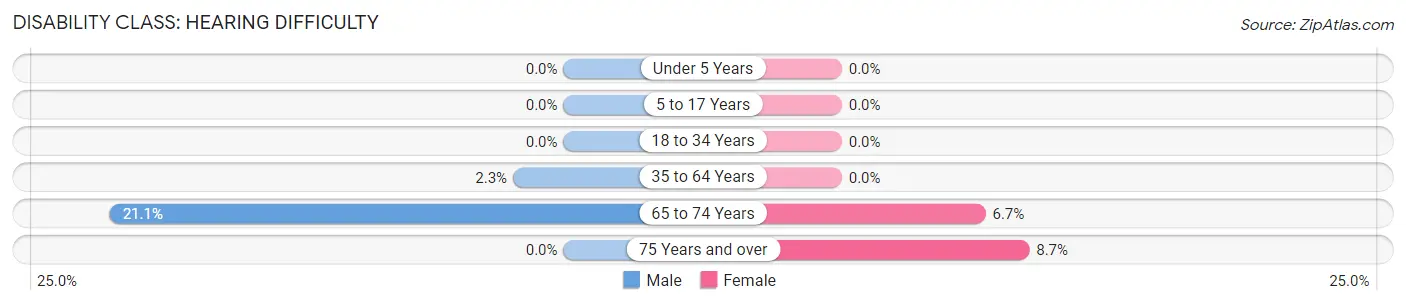
| Age Bracket | Male | Female |
| Under 5 Years | 0 (0.0%) | 0 (0.0%) |
| 5 to 17 Years | 0 (0.0%) | 0 (0.0%) |
| 18 to 34 Years | 0 (0.0%) | 0 (0.0%) |
| 35 to 64 Years | 3 (2.3%) | 0 (0.0%) |
| 65 to 74 Years | 4 (21.0%) | 1 (6.7%) |
| 75 Years and over | 0 (0.0%) | 2 (8.7%) |
Disability Class: Vision Difficulty
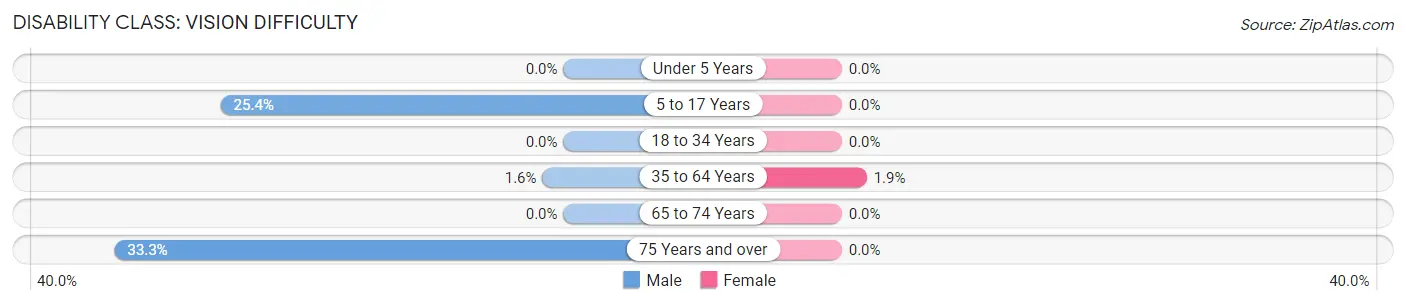
| Age Bracket | Male | Female |
| Under 5 Years | 0 (0.0%) | 0 (0.0%) |
| 5 to 17 Years | 29 (25.4%) | 0 (0.0%) |
| 18 to 34 Years | 0 (0.0%) | 0 (0.0%) |
| 35 to 64 Years | 2 (1.6%) | 2 (1.8%) |
| 65 to 74 Years | 0 (0.0%) | 0 (0.0%) |
| 75 Years and over | 2 (33.3%) | 0 (0.0%) |
Disability Class: Cognitive Difficulty
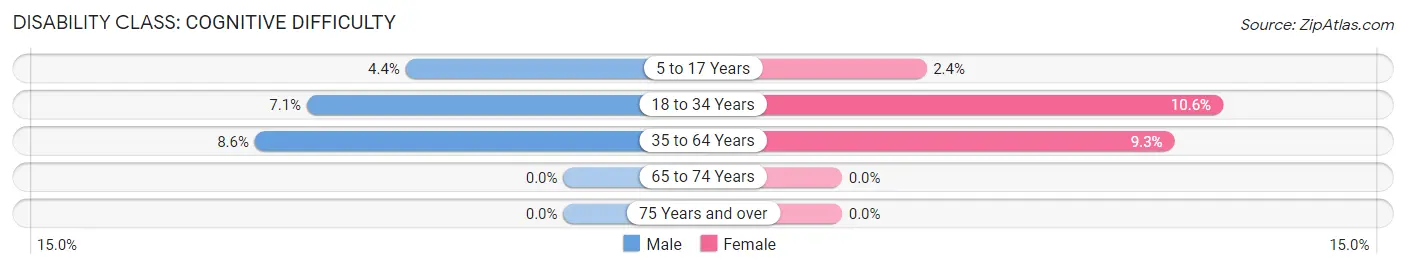
| Age Bracket | Male | Female |
| 5 to 17 Years | 5 (4.4%) | 2 (2.4%) |
| 18 to 34 Years | 4 (7.1%) | 7 (10.6%) |
| 35 to 64 Years | 11 (8.6%) | 10 (9.3%) |
| 65 to 74 Years | 0 (0.0%) | 0 (0.0%) |
| 75 Years and over | 0 (0.0%) | 0 (0.0%) |
Disability Class: Ambulatory Difficulty
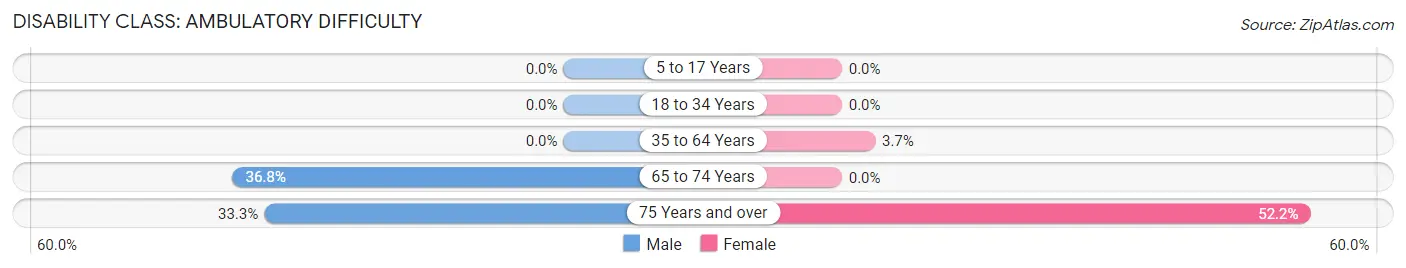
| Age Bracket | Male | Female |
| 5 to 17 Years | 0 (0.0%) | 0 (0.0%) |
| 18 to 34 Years | 0 (0.0%) | 0 (0.0%) |
| 35 to 64 Years | 0 (0.0%) | 4 (3.7%) |
| 65 to 74 Years | 7 (36.8%) | 0 (0.0%) |
| 75 Years and over | 2 (33.3%) | 12 (52.2%) |
Disability Class: Self-Care Difficulty
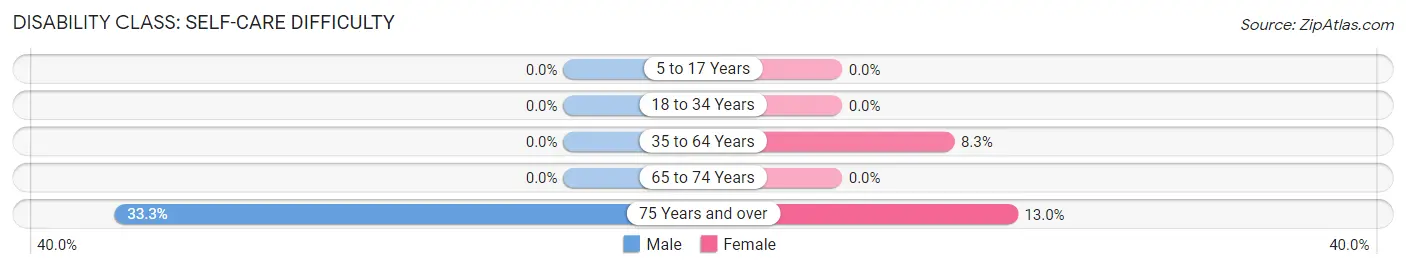
| Age Bracket | Male | Female |
| 5 to 17 Years | 0 (0.0%) | 0 (0.0%) |
| 18 to 34 Years | 0 (0.0%) | 0 (0.0%) |
| 35 to 64 Years | 0 (0.0%) | 9 (8.3%) |
| 65 to 74 Years | 0 (0.0%) | 0 (0.0%) |
| 75 Years and over | 2 (33.3%) | 3 (13.0%) |
Technology Access in Secretary
Computing Device Access in Secretary
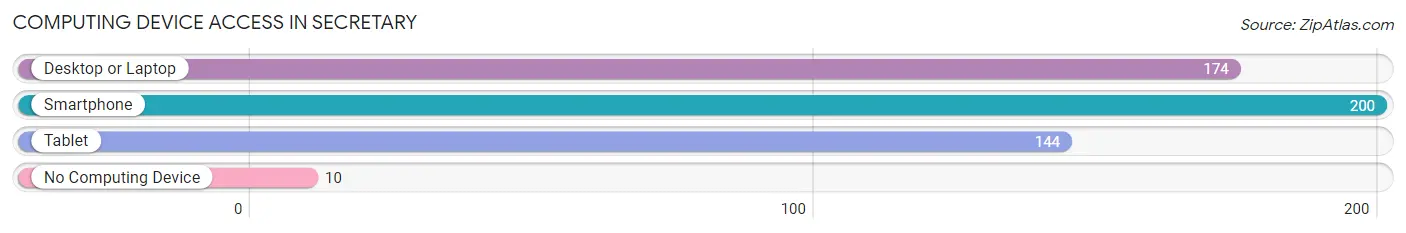
| Device Type | # Households | % Households |
| Desktop or Laptop | 174 | 81.3% |
| Smartphone | 200 | 93.5% |
| Tablet | 144 | 67.3% |
| No Computing Device | 10 | 4.7% |
| Total | 214 | 100.0% |
Internet Access in Secretary
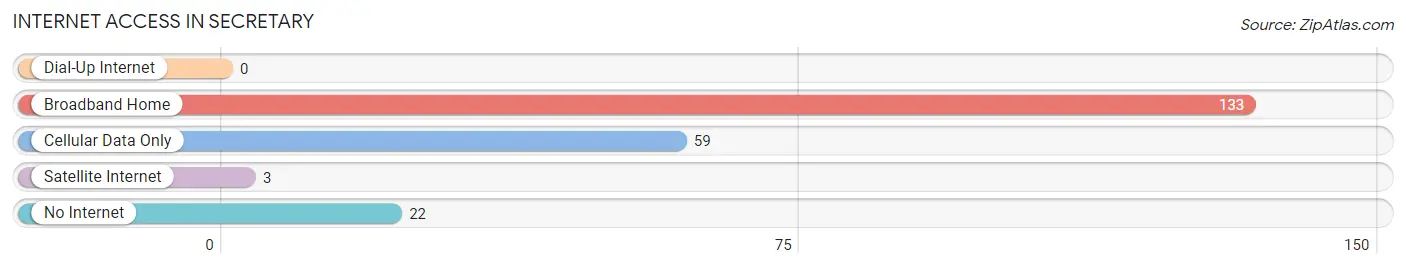
| Internet Type | # Households | % Households |
| Dial-Up Internet | 0 | 0.0% |
| Broadband Home | 133 | 62.2% |
| Cellular Data Only | 59 | 27.6% |
| Satellite Internet | 3 | 1.4% |
| No Internet | 22 | 10.3% |
| Total | 214 | 100.0% |
Secretary Summary
Maryland is a state located in the Mid-Atlantic region of the United States. It is bordered by Virginia, West Virginia, and the District of Columbia to the south and west; Pennsylvania to the north; and Delaware to the east. Maryland is the 9th smallest state in the United States and the 42nd most populous. The state has a population of 6 million people and is the 19th most densely populated state in the country.
History
Maryland was founded in 1632 as a British colony. It was named after Queen Henrietta Maria, the wife of King Charles I of England. The first settlers were English Catholics who had been persecuted in England. They were led by Lord Baltimore, who was granted a charter by King Charles I to establish a colony in the New World.
The colony was initially successful and grew rapidly. In 1649, Maryland became the first colony to pass a law granting religious freedom to all Christians. This law was later adopted by other colonies and eventually became part of the First Amendment of the United States Constitution.
In 1776, Maryland declared its independence from Great Britain and became one of the original 13 states of the United States. During the American Revolution, Maryland was a key battleground state and was the site of several important battles.
Geography
Maryland is located in the Mid-Atlantic region of the United States. It is bordered by Virginia, West Virginia, and the District of Columbia to the south and west; Pennsylvania to the north; and Delaware to the east.
The state has a total area of 12,407 square miles, making it the 42nd largest state in the country. Maryland is divided into 23 counties and Baltimore City. The state has a variety of landscapes, including mountains, forests, rivers, and coastal areas.
The highest point in Maryland is Hoye-Crest, located in Garrett County, which has an elevation of 3,360 feet. The lowest point is sea level, located along the Atlantic coast.
Economy
Maryland has a diverse economy that is driven by a variety of industries. The state’s largest industries include manufacturing, government, healthcare, and tourism.
Manufacturing is a major contributor to the state’s economy. Maryland is home to a number of major manufacturing companies, including Lockheed Martin, Northrop Grumman, and General Motors.
The government is also a major employer in the state. Maryland is home to a number of federal agencies, including the National Institutes of Health, the National Security Agency, and the Social Security Administration.
Healthcare is another major industry in the state. Maryland is home to a number of major hospitals and medical centers, including Johns Hopkins Hospital and the University of Maryland Medical Center.
Tourism is also an important part of the state’s economy. Maryland is home to a number of popular tourist destinations, including the Inner Harbor in Baltimore, the Chesapeake Bay, and the Appalachian Mountains.
Demographics
As of 2020, the population of Maryland was estimated to be 6 million people. This makes it the 19th most populous state in the country.
The state is racially and ethnically diverse. The largest racial group is White, making up 59.2% of the population. African Americans make up 30.2% of the population, while Hispanics and Latinos make up 8.2%.
The median household income in Maryland is $80,776, which is higher than the national median of $61,937. The median home value in the state is $320,000, which is higher than the national median of $219,700.
The largest cities in Maryland are Baltimore, Columbia, Germantown, Silver Spring, and Waldorf. Baltimore is the largest city in the state, with a population of 602,495.
Common Questions
What is Per Capita Income in Secretary?
Per Capita income in Secretary is $25,755.
What is the Median Family Income in Secretary?
Median Family Income in Secretary is $76,932.
What is the Median Household income in Secretary?
Median Household Income in Secretary is $66,458.
What is Income or Wage Gap in Secretary?
Income or Wage Gap in Secretary is 3.2%.
Women in Secretary earn 96.8 cents for every dollar earned by a man.
What is Inequality or Gini Index in Secretary?
Inequality or Gini Index in Secretary is 0.35.
What is the Total Population of Secretary?
Total Population of Secretary is 642.
What is the Total Male Population of Secretary?
Total Male Population of Secretary is 325.
What is the Total Female Population of Secretary?
Total Female Population of Secretary is 317.
What is the Ratio of Males per 100 Females in Secretary?
There are 102.52 Males per 100 Females in Secretary.
What is the Ratio of Females per 100 Males in Secretary?
There are 97.54 Females per 100 Males in Secretary.
What is the Median Population Age in Secretary?
Median Population Age in Secretary is 32.8 Years.
What is the Average Family Size in Secretary
Average Family Size in Secretary is 3.7 People.
What is the Average Household Size in Secretary
Average Household Size in Secretary is 3.0 People.
How Large is the Labor Force in Secretary?
There are 331 People in the Labor Forcein in Secretary.
What is the Percentage of People in the Labor Force in Secretary?
74.9% of People are in the Labor Force in Secretary.
What is the Unemployment Rate in Secretary?
Unemployment Rate in Secretary is 7.6%.