Deal Island, MD Map & Demographics
Deal Island Map
Deal Island Overview
$25,077
PER CAPITA INCOME
$22,429
AVG HOUSEHOLD INCOME
0.41
INEQUALITY / GINI INDEX
286
TOTAL POPULATION
101
MALE POPULATION
185
FEMALE POPULATION
54.59
MALES / 100 FEMALES
183.17
FEMALES / 100 MALES
65.2
MEDIAN AGE
2.6
AVG FAMILY SIZE
1.6
AVG HOUSEHOLD SIZE
84
LABOR FORCE [ PEOPLE ]
32.1%
PERCENT IN LABOR FORCE
Deal Island Zip Codes
Deal Island Area Codes
Income in Deal Island
Income Overview in Deal Island
| Characteristic | Number | Measure |
| Per Capita Income | 286 | $25,077 |
| Median Family Income | 56 | $0 |
| Mean Family Income | 56 | $52,411 |
| Median Household Income | 176 | $22,429 |
| Mean Household Income | 176 | $39,069 |
| Income Deficit | 56 | $0 |
| Wage / Income Gap (%) | 286 | 0.00% |
| Wage / Income Gap ($) | 286 | 100.00¢ per $1 |
| Gini / Inequality Index | 286 | 0.41 |
Earnings by Sex in Deal Island
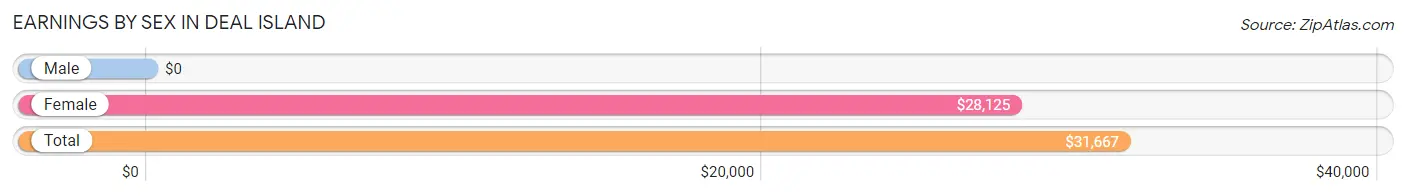
| Sex | Number | Average Earnings |
| Male | 48 (55.8%) | $0 |
| Female | 38 (44.2%) | $28,125 |
| Total | 86 (100.0%) | $31,667 |
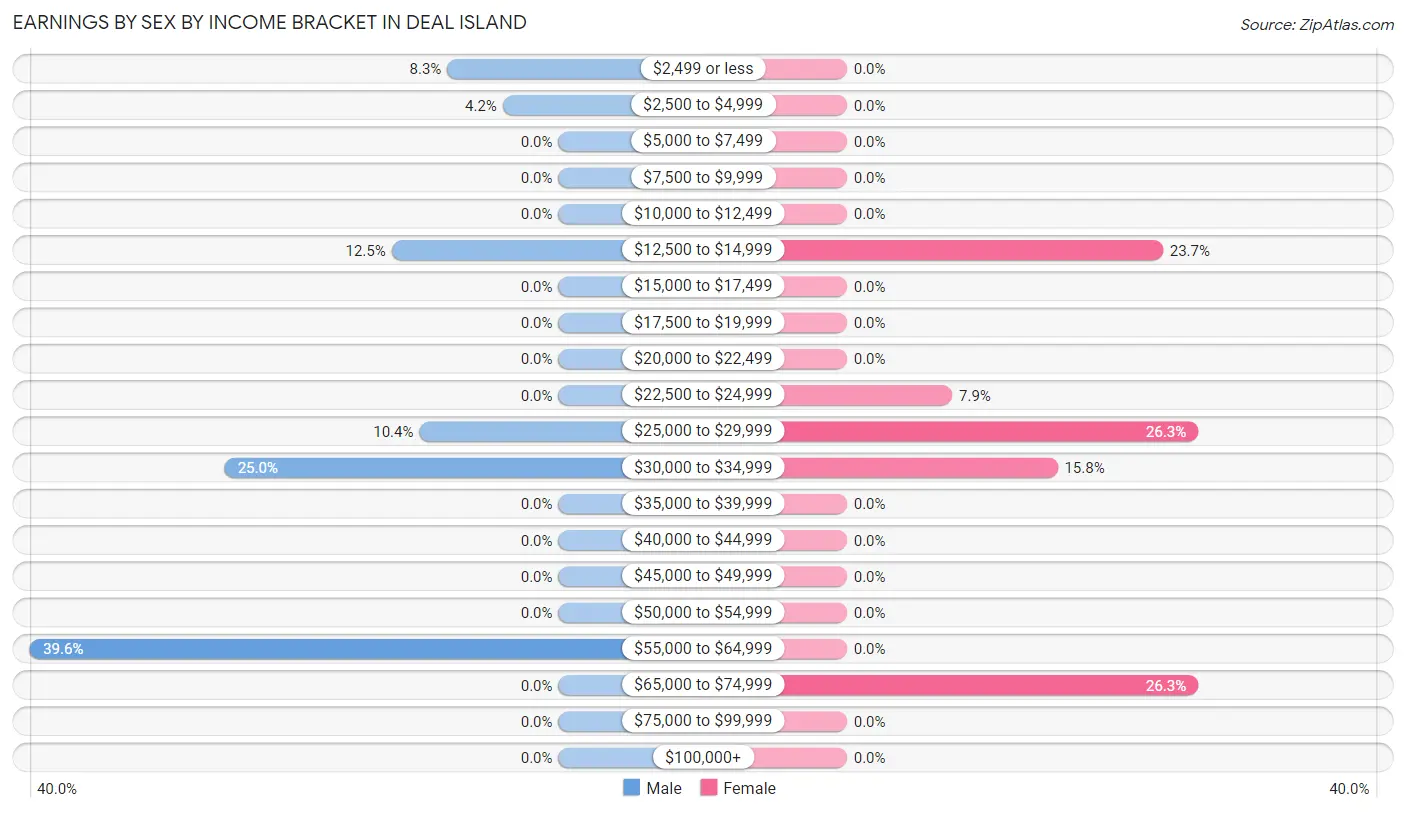
Earnings by Sex by Income Bracket in Deal Island
The most common earnings brackets in Deal Island are $55,000 to $64,999 for men (19 | 39.6%) and $25,000 to $29,999 for women (10 | 26.3%).
| Income | Male | Female |
| $2,499 or less | 4 (8.3%) | 0 (0.0%) |
| $2,500 to $4,999 | 2 (4.2%) | 0 (0.0%) |
| $5,000 to $7,499 | 0 (0.0%) | 0 (0.0%) |
| $7,500 to $9,999 | 0 (0.0%) | 0 (0.0%) |
| $10,000 to $12,499 | 0 (0.0%) | 0 (0.0%) |
| $12,500 to $14,999 | 6 (12.5%) | 9 (23.7%) |
| $15,000 to $17,499 | 0 (0.0%) | 0 (0.0%) |
| $17,500 to $19,999 | 0 (0.0%) | 0 (0.0%) |
| $20,000 to $22,499 | 0 (0.0%) | 0 (0.0%) |
| $22,500 to $24,999 | 0 (0.0%) | 3 (7.9%) |
| $25,000 to $29,999 | 5 (10.4%) | 10 (26.3%) |
| $30,000 to $34,999 | 12 (25.0%) | 6 (15.8%) |
| $35,000 to $39,999 | 0 (0.0%) | 0 (0.0%) |
| $40,000 to $44,999 | 0 (0.0%) | 0 (0.0%) |
| $45,000 to $49,999 | 0 (0.0%) | 0 (0.0%) |
| $50,000 to $54,999 | 0 (0.0%) | 0 (0.0%) |
| $55,000 to $64,999 | 19 (39.6%) | 0 (0.0%) |
| $65,000 to $74,999 | 0 (0.0%) | 10 (26.3%) |
| $75,000 to $99,999 | 0 (0.0%) | 0 (0.0%) |
| $100,000+ | 0 (0.0%) | 0 (0.0%) |
| Total | 48 (100.0%) | 38 (100.0%) |
Earnings by Sex by Educational Attainment in Deal Island
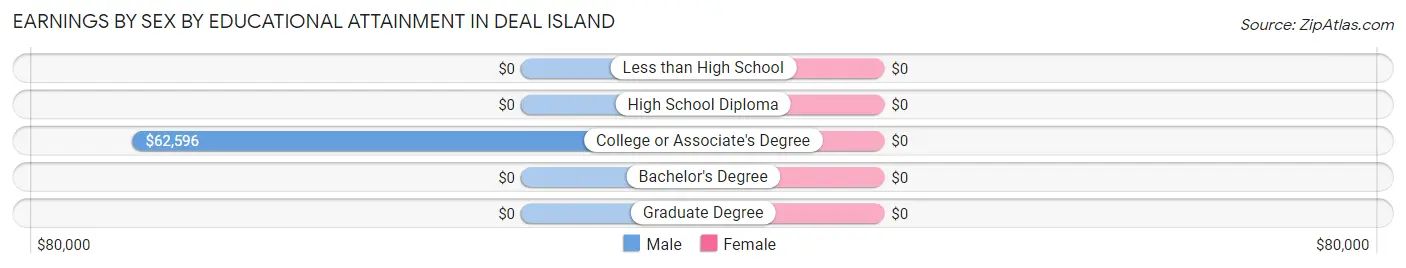
| Educational Attainment | Male Income | Female Income |
| Less than High School | - | - |
| High School Diploma | - | - |
| College or Associate's Degree | $62,596 | $0 |
| Bachelor's Degree | - | - |
| Graduate Degree | - | - |
| Total | - | - |
Family Income in Deal Island
Family Income Brackets in Deal Island
According to the Deal Island family income data, there are 18 families falling into the $15,000 to $24,999 income range, which is the most common income bracket and makes up 32.1% of all families.
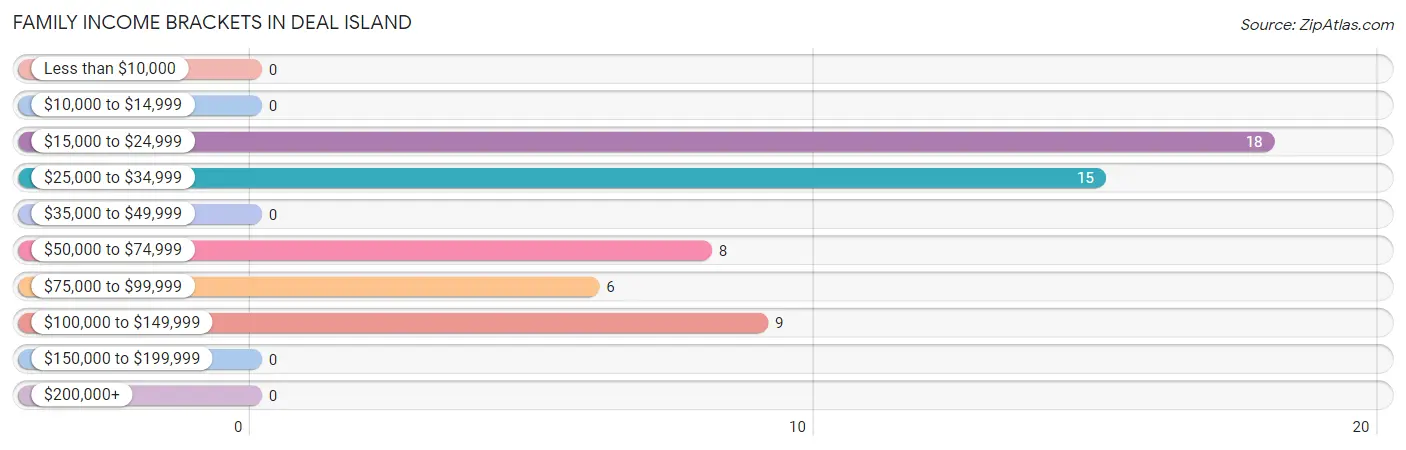
| Income Bracket | # Families | % Families |
| Less than $10,000 | 0 | 0.0% |
| $10,000 to $14,999 | 0 | 0.0% |
| $15,000 to $24,999 | 18 | 32.1% |
| $25,000 to $34,999 | 15 | 26.8% |
| $35,000 to $49,999 | 0 | 0.0% |
| $50,000 to $74,999 | 8 | 14.3% |
| $75,000 to $99,999 | 6 | 10.7% |
| $100,000 to $149,999 | 9 | 16.1% |
| $150,000 to $199,999 | 0 | 0.0% |
| $200,000+ | 0 | 0.0% |
Family Income by Famaliy Size in Deal Island
2-person families (42 | 75.0%) account for the highest median family income in Deal Island with $26,875 per family, while 2-person families (42 | 75.0%) have the highest median income of $13,438 per family member.
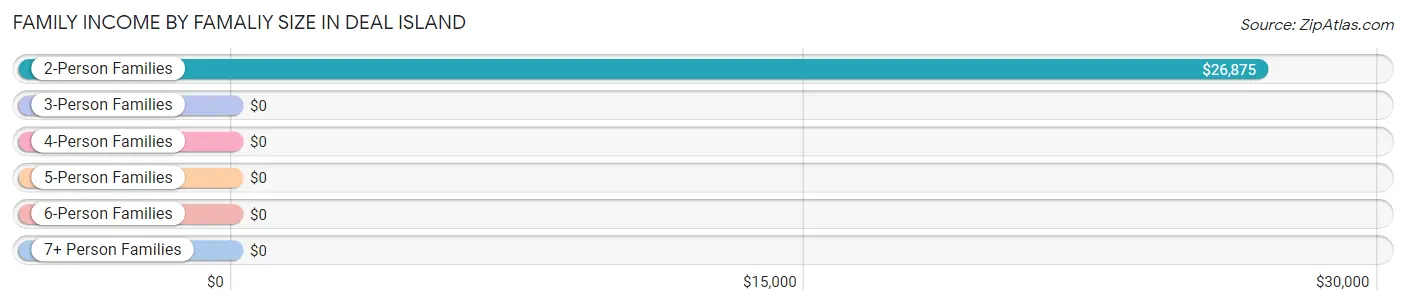
| Income Bracket | # Families | Median Income |
| 2-Person Families | 42 (75.0%) | $26,875 |
| 3-Person Families | 11 (19.6%) | $0 |
| 4-Person Families | 0 (0.0%) | $0 |
| 5-Person Families | 0 (0.0%) | $0 |
| 6-Person Families | 3 (5.4%) | $0 |
| 7+ Person Families | 0 (0.0%) | $0 |
| Total | 56 (100.0%) | $0 |
Family Income by Number of Earners in Deal Island
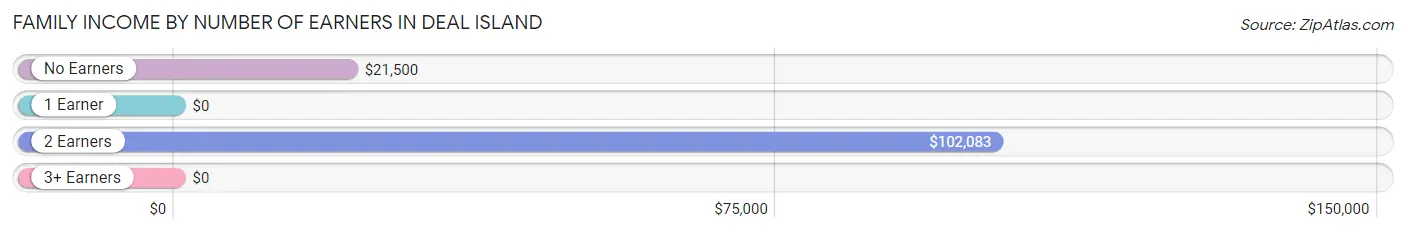
| Number of Earners | # Families | Median Income |
| No Earners | 32 (57.1%) | $21,500 |
| 1 Earner | 11 (19.6%) | $0 |
| 2 Earners | 13 (23.2%) | $102,083 |
| 3+ Earners | 0 (0.0%) | $0 |
| Total | 56 (100.0%) | $0 |
Household Income in Deal Island
Household Income Brackets in Deal Island
With 52 households falling in the category, the $15,000 to $24,999 income range is the most frequent in Deal Island, accounting for 29.5% of all households.
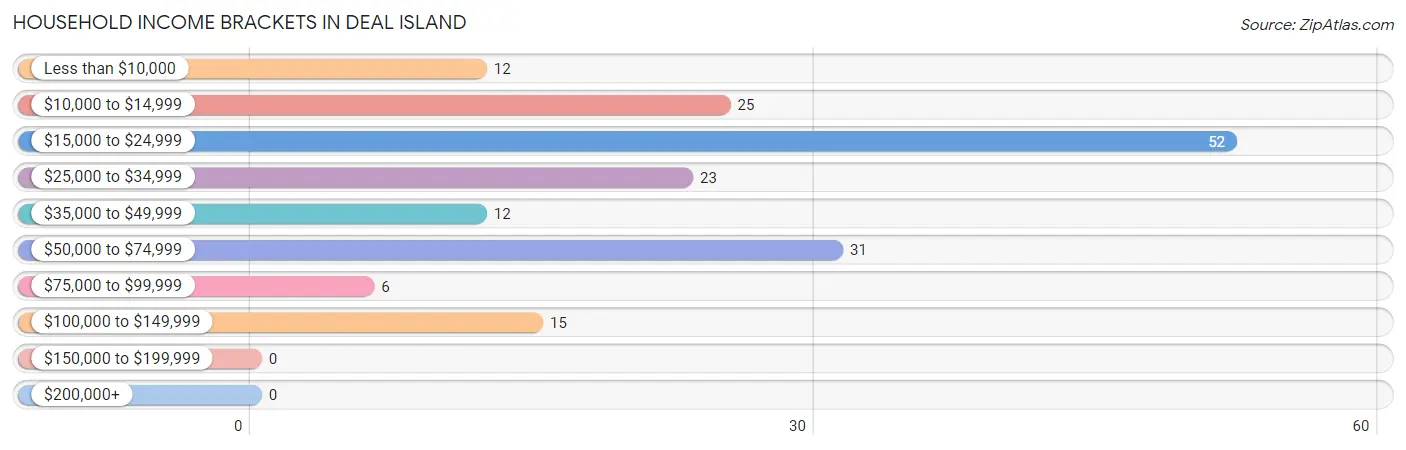
| Income Bracket | # Households | % Households |
| Less than $10,000 | 12 | 6.8% |
| $10,000 to $14,999 | 25 | 14.2% |
| $15,000 to $24,999 | 52 | 29.5% |
| $25,000 to $34,999 | 23 | 13.1% |
| $35,000 to $49,999 | 12 | 6.8% |
| $50,000 to $74,999 | 31 | 17.6% |
| $75,000 to $99,999 | 6 | 3.4% |
| $100,000 to $149,999 | 15 | 8.5% |
| $150,000 to $199,999 | 0 | 0.0% |
| $200,000+ | 0 | 0.0% |
Household Income by Householder Age in Deal Island
The median household income in Deal Island is $22,429, with the highest median household income of $21,893 found in the 65+ years age bracket for the primary householder. A total of 135 households (76.7%) fall into this category. Meanwhile, the 15 to 24 years age bracket for the primary householder has the lowest median household income of $0, with 3 households (1.7%) in this group.
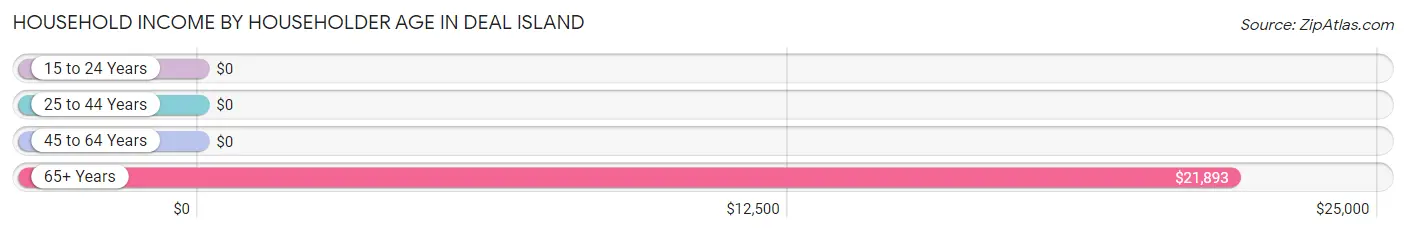
| Income Bracket | # Households | Median Income |
| 15 to 24 Years | 3 (1.7%) | $0 |
| 25 to 44 Years | 17 (9.7%) | $0 |
| 45 to 64 Years | 21 (11.9%) | $0 |
| 65+ Years | 135 (76.7%) | $21,893 |
| Total | 176 (100.0%) | $22,429 |
Poverty in Deal Island
Income Below Poverty by Sex and Age in Deal Island
With 8.8% poverty level for males and 31.4% for females among the residents of Deal Island, 18 to 24 year old males and 16 and 17 year old females are the most vulnerable to poverty, with 2 males (100.0%) and 8 females (100.0%) in their respective age groups living below the poverty level.
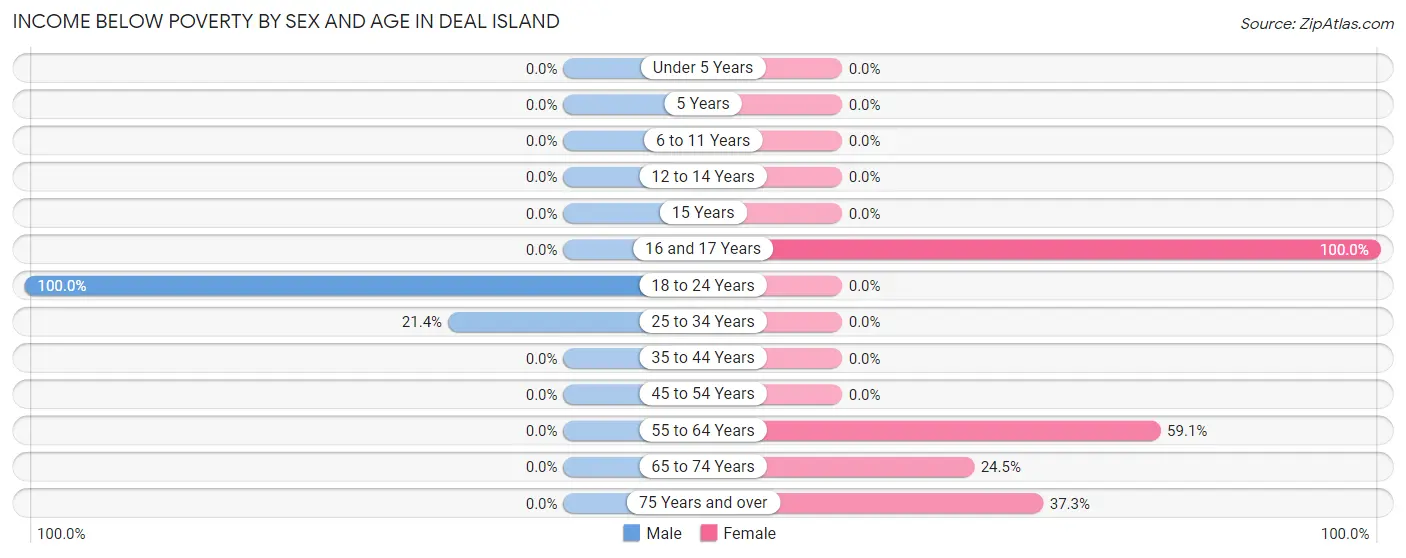
| Age Bracket | Male | Female |
| Under 5 Years | 0 (0.0%) | 0 (0.0%) |
| 5 Years | 0 (0.0%) | 0 (0.0%) |
| 6 to 11 Years | 0 (0.0%) | 0 (0.0%) |
| 12 to 14 Years | 0 (0.0%) | 0 (0.0%) |
| 15 Years | 0 (0.0%) | 0 (0.0%) |
| 16 and 17 Years | 0 (0.0%) | 8 (100.0%) |
| 18 to 24 Years | 2 (100.0%) | 0 (0.0%) |
| 25 to 34 Years | 6 (21.4%) | 0 (0.0%) |
| 35 to 44 Years | 0 (0.0%) | 0 (0.0%) |
| 45 to 54 Years | 0 (0.0%) | 0 (0.0%) |
| 55 to 64 Years | 0 (0.0%) | 13 (59.1%) |
| 65 to 74 Years | 0 (0.0%) | 12 (24.5%) |
| 75 Years and over | 0 (0.0%) | 25 (37.3%) |
| Total | 8 (8.8%) | 58 (31.4%) |
Income Above Poverty by Sex and Age in Deal Island
According to the poverty statistics in Deal Island, males aged under 5 years and females aged under 5 years are the age groups that are most secure financially, with 100.0% of males and 100.0% of females in these age groups living above the poverty line.
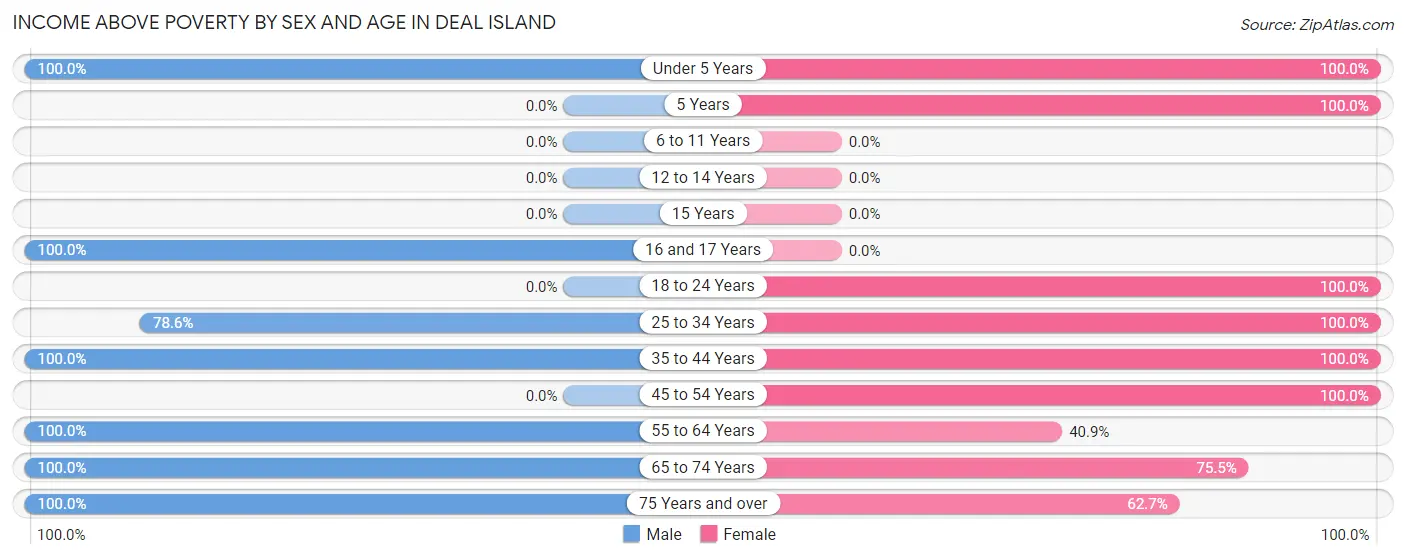
| Age Bracket | Male | Female |
| Under 5 Years | 5 (100.0%) | 4 (100.0%) |
| 5 Years | 0 (0.0%) | 5 (100.0%) |
| 6 to 11 Years | 0 (0.0%) | 0 (0.0%) |
| 12 to 14 Years | 0 (0.0%) | 0 (0.0%) |
| 15 Years | 0 (0.0%) | 0 (0.0%) |
| 16 and 17 Years | 5 (100.0%) | 0 (0.0%) |
| 18 to 24 Years | 0 (0.0%) | 7 (100.0%) |
| 25 to 34 Years | 22 (78.6%) | 9 (100.0%) |
| 35 to 44 Years | 12 (100.0%) | 9 (100.0%) |
| 45 to 54 Years | 0 (0.0%) | 5 (100.0%) |
| 55 to 64 Years | 10 (100.0%) | 9 (40.9%) |
| 65 to 74 Years | 25 (100.0%) | 37 (75.5%) |
| 75 Years and over | 4 (100.0%) | 42 (62.7%) |
| Total | 83 (91.2%) | 127 (68.6%) |
Income Below Poverty Among Married-Couple Families in Deal Island
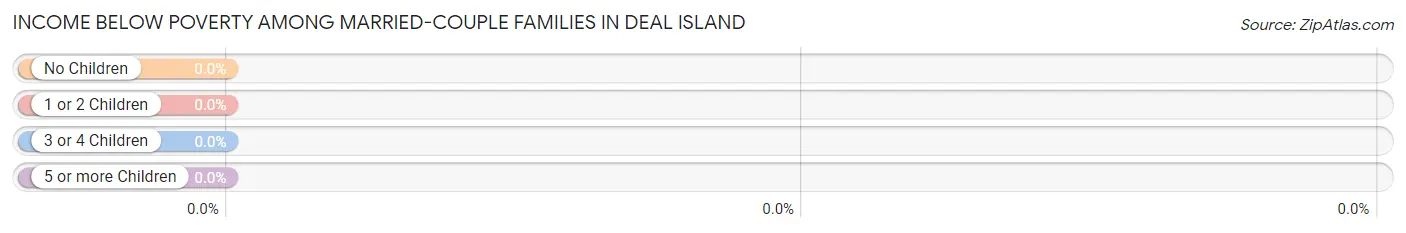
| Children | Above Poverty | Below Poverty |
| No Children | 26 (100.0%) | 0 (0.0%) |
| 1 or 2 Children | 0 (0.0%) | 0 (0.0%) |
| 3 or 4 Children | 0 (0.0%) | 0 (0.0%) |
| 5 or more Children | 0 (0.0%) | 0 (0.0%) |
| Total | 26 (100.0%) | 0 (0.0%) |
Income Below Poverty Among Single-Parent Households in Deal Island
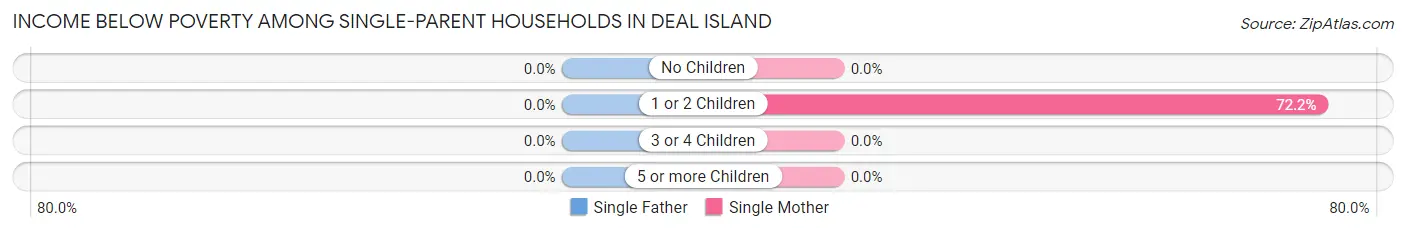
| Children | Single Father | Single Mother |
| No Children | 0 (0.0%) | 0 (0.0%) |
| 1 or 2 Children | 0 (0.0%) | 13 (72.2%) |
| 3 or 4 Children | 0 (0.0%) | 0 (0.0%) |
| 5 or more Children | 0 (0.0%) | 0 (0.0%) |
| Total | 0 (0.0%) | 13 (50.0%) |
Income Below Poverty Among Married-Couple vs Single-Parent Households in Deal Island
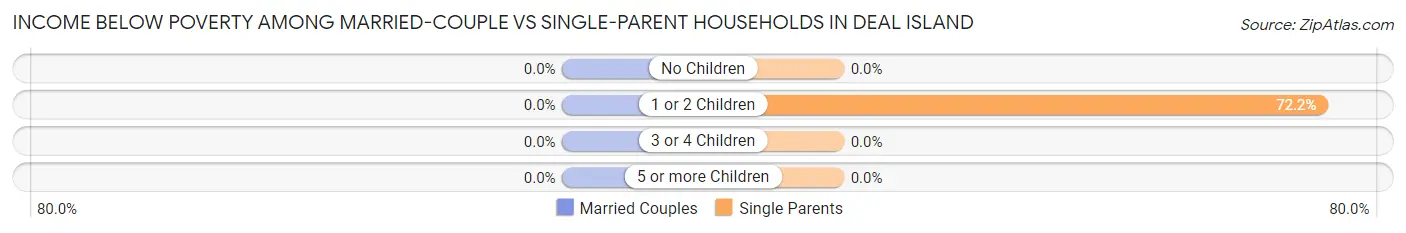
| Children | Married-Couple Families | Single-Parent Households |
| No Children | 0 (0.0%) | 0 (0.0%) |
| 1 or 2 Children | 0 (0.0%) | 13 (72.2%) |
| 3 or 4 Children | 0 (0.0%) | 0 (0.0%) |
| 5 or more Children | 0 (0.0%) | 0 (0.0%) |
| Total | 0 (0.0%) | 13 (43.3%) |
Race in Deal Island
The most populous races in Deal Island are White / Caucasian (276 | 96.5%), Black / African American (6 | 2.1%), and Two or more Races (4 | 1.4%).
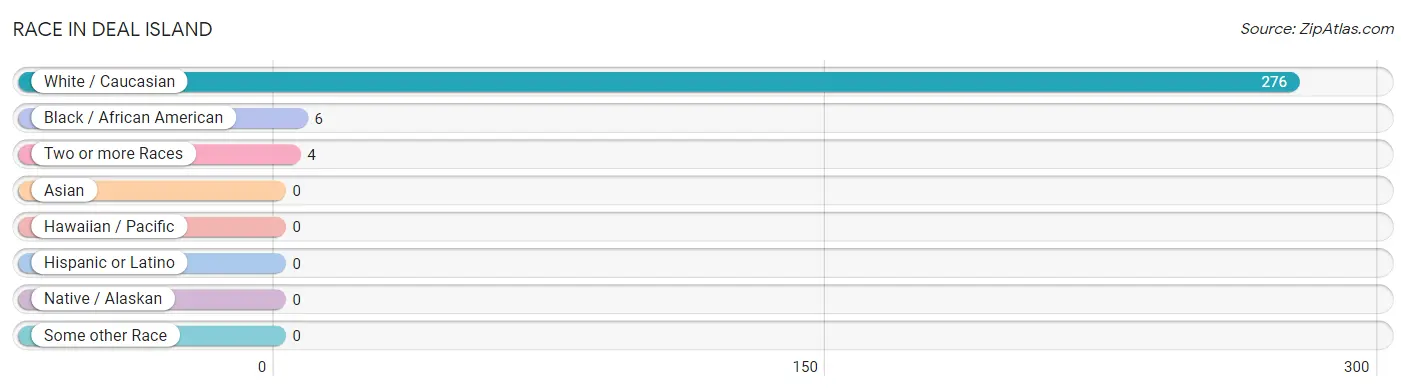
| Race | # Population | % Population |
| Asian | 0 | 0.0% |
| Black / African American | 6 | 2.1% |
| Hawaiian / Pacific | 0 | 0.0% |
| Hispanic or Latino | 0 | 0.0% |
| Native / Alaskan | 0 | 0.0% |
| White / Caucasian | 276 | 96.5% |
| Two or more Races | 4 | 1.4% |
| Some other Race | 0 | 0.0% |
| Total | 286 | 100.0% |
Ancestry in Deal Island
The most populous ancestries reported in Deal Island are American (127 | 44.4%), English (81 | 28.3%), German (22 | 7.7%), Irish (13 | 4.5%), and Polish (6 | 2.1%), together accounting for 87.1% of all Deal Island residents.
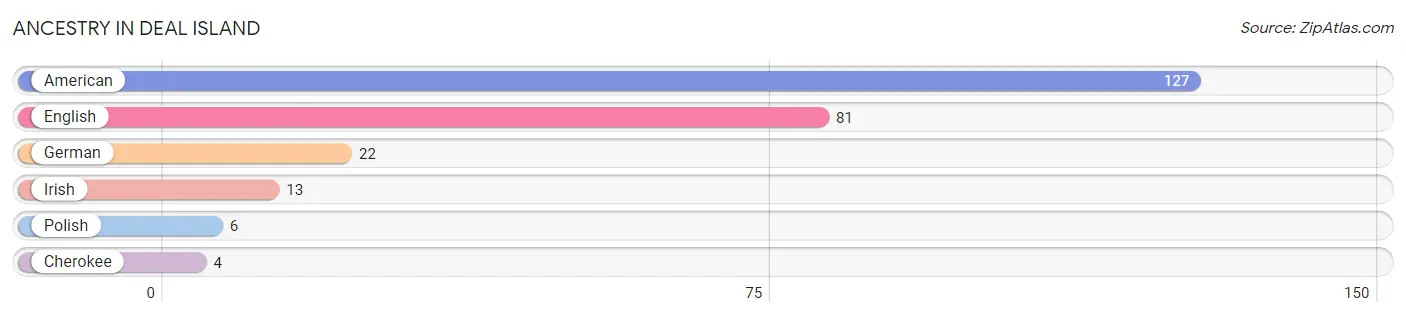
| Ancestry | # Population | % Population |
| American | 127 | 44.4% |
| Cherokee | 4 | 1.4% |
| English | 81 | 28.3% |
| German | 22 | 7.7% |
| Irish | 13 | 4.5% |
| Polish | 6 | 2.1% | View All 6 Rows |
Immigrants in Deal Island

| Immigration Origin | # Population | % Population | View All 0 Rows |
Sex and Age in Deal Island
Sex and Age in Deal Island
The most populous age groups in Deal Island are 30 to 34 Years (17 | 16.8%) for men and 80 to 84 Years (57 | 30.8%) for women.
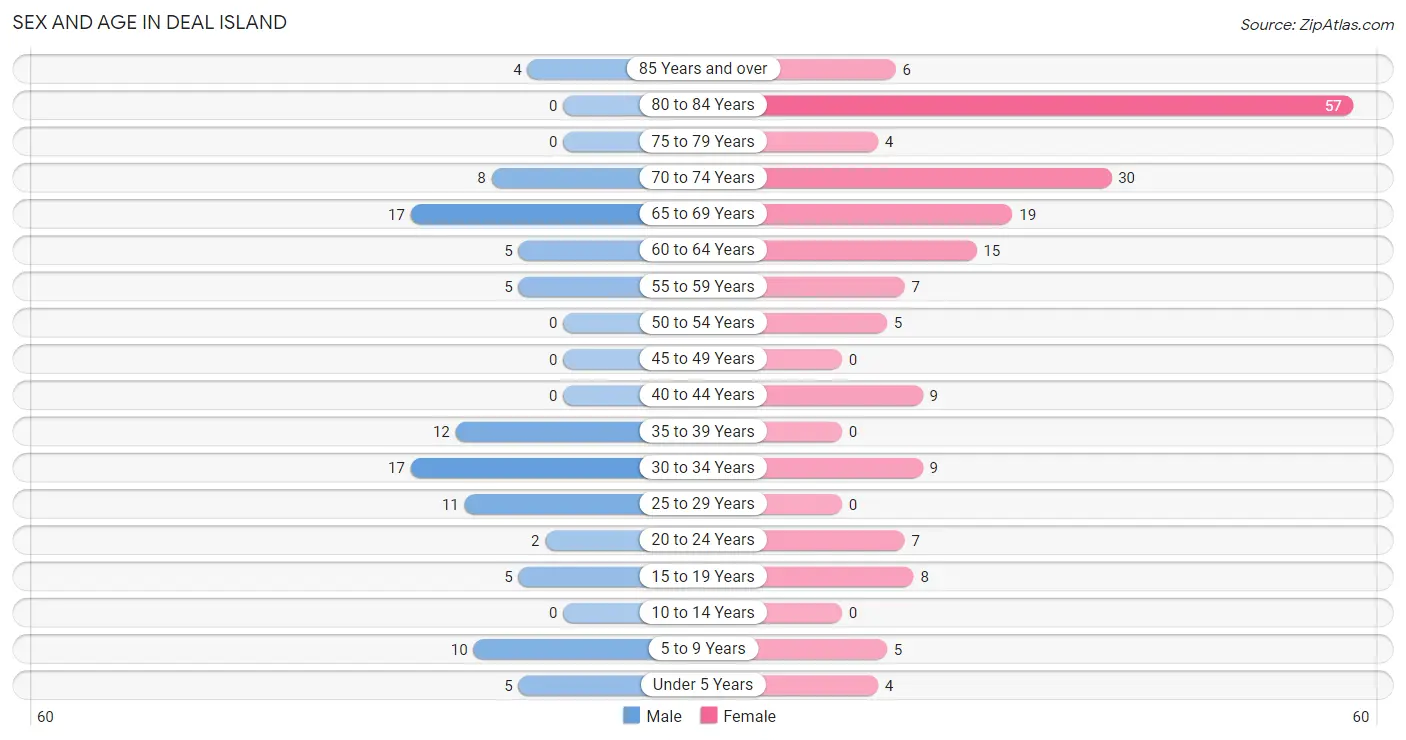
| Age Bracket | Male | Female |
| Under 5 Years | 5 (5.0%) | 4 (2.2%) |
| 5 to 9 Years | 10 (9.9%) | 5 (2.7%) |
| 10 to 14 Years | 0 (0.0%) | 0 (0.0%) |
| 15 to 19 Years | 5 (5.0%) | 8 (4.3%) |
| 20 to 24 Years | 2 (2.0%) | 7 (3.8%) |
| 25 to 29 Years | 11 (10.9%) | 0 (0.0%) |
| 30 to 34 Years | 17 (16.8%) | 9 (4.9%) |
| 35 to 39 Years | 12 (11.9%) | 0 (0.0%) |
| 40 to 44 Years | 0 (0.0%) | 9 (4.9%) |
| 45 to 49 Years | 0 (0.0%) | 0 (0.0%) |
| 50 to 54 Years | 0 (0.0%) | 5 (2.7%) |
| 55 to 59 Years | 5 (5.0%) | 7 (3.8%) |
| 60 to 64 Years | 5 (5.0%) | 15 (8.1%) |
| 65 to 69 Years | 17 (16.8%) | 19 (10.3%) |
| 70 to 74 Years | 8 (7.9%) | 30 (16.2%) |
| 75 to 79 Years | 0 (0.0%) | 4 (2.2%) |
| 80 to 84 Years | 0 (0.0%) | 57 (30.8%) |
| 85 Years and over | 4 (4.0%) | 6 (3.2%) |
| Total | 101 (100.0%) | 185 (100.0%) |
Families and Households in Deal Island
Median Family Size in Deal Island
The median family size in Deal Island is 2.64 persons per family, with single male/father families (4 | 7.1%) accounting for the largest median family size of 3.25 persons per family. On the other hand, married-couple families (26 | 46.4%) represent the smallest median family size with 2.27 persons per family.
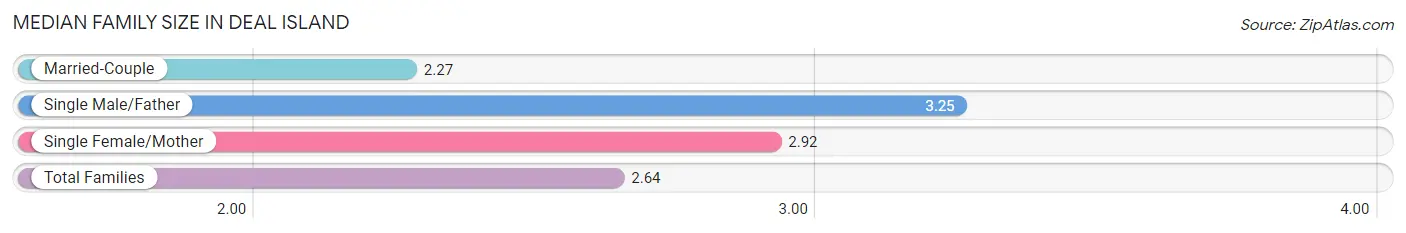
| Family Type | # Families | Family Size |
| Married-Couple | 26 (46.4%) | 2.27 |
| Single Male/Father | 4 (7.1%) | 3.25 |
| Single Female/Mother | 26 (46.4%) | 2.92 |
| Total Families | 56 (100.0%) | 2.64 |
Median Household Size in Deal Island
The median household size in Deal Island is 1.63 persons per household, with single male/father households (4 | 2.3%) accounting for the largest median household size of 4.75 persons per household. non-family households (120 | 68.2%) represent the smallest median household size with 1.10 persons per household.
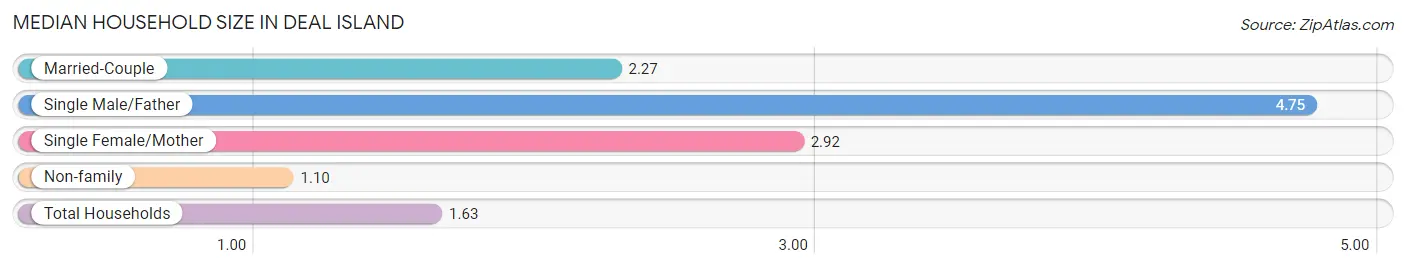
| Household Type | # Households | Household Size |
| Married-Couple | 26 (14.8%) | 2.27 |
| Single Male/Father | 4 (2.3%) | 4.75 |
| Single Female/Mother | 26 (14.8%) | 2.92 |
| Non-family | 120 (68.2%) | 1.10 |
| Total Households | 176 (100.0%) | 1.63 |
Household Size by Marriage Status in Deal Island
Out of a total of 176 households in Deal Island, 56 (31.8%) are family households, while 120 (68.2%) are nonfamily households. The most numerous type of family households are 2-person households, comprising 38, and the most common type of nonfamily households are 1-person households, comprising 117.
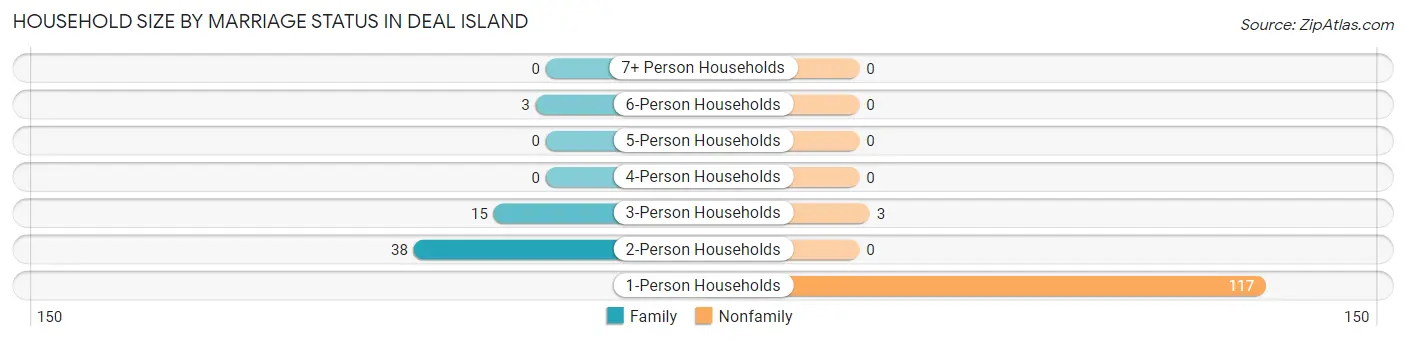
| Household Size | Family Households | Nonfamily Households |
| 1-Person Households | - | 117 (66.5%) |
| 2-Person Households | 38 (21.6%) | 0 (0.0%) |
| 3-Person Households | 15 (8.5%) | 3 (1.7%) |
| 4-Person Households | 0 (0.0%) | 0 (0.0%) |
| 5-Person Households | 0 (0.0%) | 0 (0.0%) |
| 6-Person Households | 3 (1.7%) | 0 (0.0%) |
| 7+ Person Households | 0 (0.0%) | 0 (0.0%) |
| Total | 56 (31.8%) | 120 (68.2%) |
Female Fertility in Deal Island
Fertility by Age in Deal Island
| Age Bracket | Women with Births | Births / 1,000 Women |
| 15 to 19 years | 0 (0.0%) | 0.0 |
| 20 to 34 years | 0 (0.0%) | 0.0 |
| 35 to 50 years | 0 (0.0%) | 0.0 |
| Total | 0 (0.0%) | 0.0 |
Fertility by Age by Marriage Status in Deal Island
| Age Bracket | Married | Unmarried |
| 15 to 19 years | 0 (0.0%) | 0 (0.0%) |
| 20 to 34 years | 0 (0.0%) | 0 (0.0%) |
| 35 to 50 years | 0 (0.0%) | 0 (0.0%) |
| Total | 0 (0.0%) | 0 (0.0%) |
Fertility by Education in Deal Island
| Educational Attainment | Women with Births | Births / 1,000 Women |
| Less than High School | 0 (0.0%) | 0.0 |
| High School Diploma | 0 (0.0%) | 0.0 |
| College or Associate's Degree | 0 (0.0%) | 0.0 |
| Bachelor's Degree | 0 (0.0%) | 0.0 |
| Graduate Degree | 0 (0.0%) | 0.0 |
| Total | 0 (0.0%) | 0.0 |
Fertility by Education by Marriage Status in Deal Island
| Educational Attainment | Married | Unmarried |
| Less than High School | 0 (0.0%) | 0 (0.0%) |
| High School Diploma | 0 (0.0%) | 0 (0.0%) |
| College or Associate's Degree | 0 (0.0%) | 0 (0.0%) |
| Bachelor's Degree | 0 (0.0%) | 0 (0.0%) |
| Graduate Degree | 0 (0.0%) | 0 (0.0%) |
| Total | 0 (0.0%) | 0 (0.0%) |
Employment Characteristics in Deal Island
Employment by Class of Employer in Deal Island
Among the 79 employed individuals in Deal Island, private company employees (41 | 51.9%), state government employees (12 | 15.2%), and not-for-profit organizations (11 | 13.9%) make up the most common classes of employment.
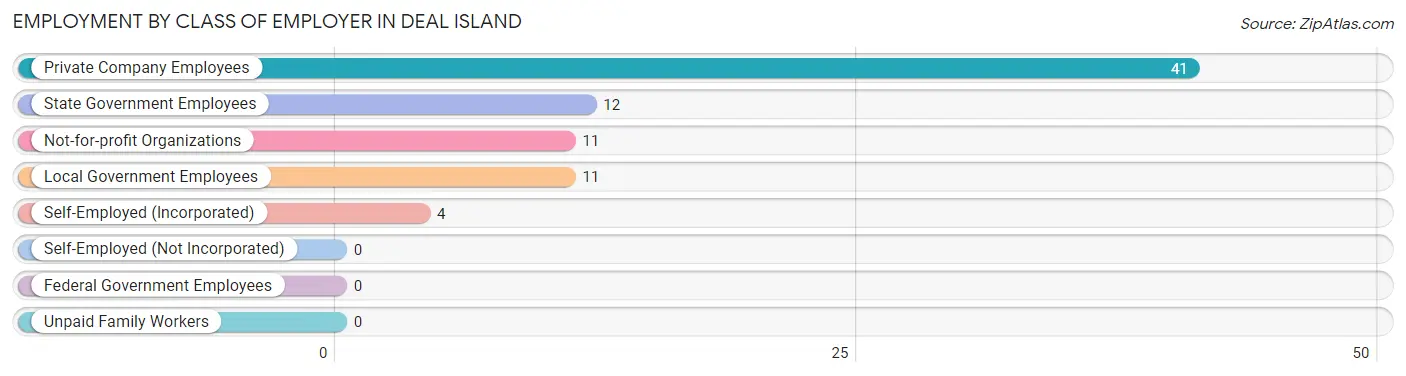
| Employer Class | # Employees | % Employees |
| Private Company Employees | 41 | 51.9% |
| Self-Employed (Incorporated) | 4 | 5.1% |
| Self-Employed (Not Incorporated) | 0 | 0.0% |
| Not-for-profit Organizations | 11 | 13.9% |
| Local Government Employees | 11 | 13.9% |
| State Government Employees | 12 | 15.2% |
| Federal Government Employees | 0 | 0.0% |
| Unpaid Family Workers | 0 | 0.0% |
| Total | 79 | 100.0% |
Employment Status by Age in Deal Island
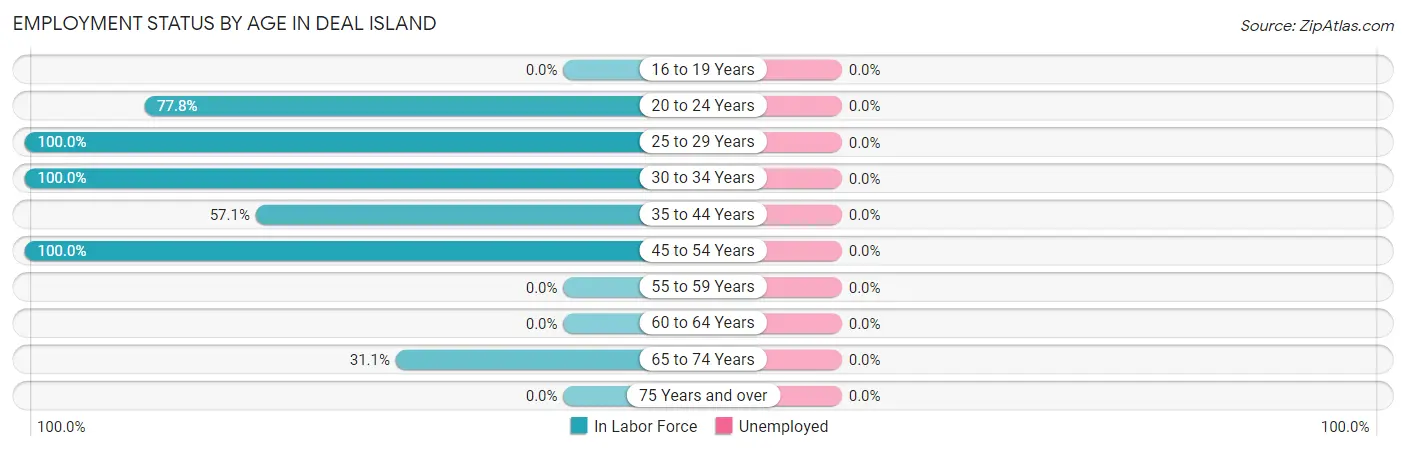
| Age Bracket | In Labor Force | Unemployed |
| 16 to 19 Years | 0 (0.0%) | 0 (0.0%) |
| 20 to 24 Years | 7 (77.8%) | 0 (0.0%) |
| 25 to 29 Years | 11 (100.0%) | 0 (0.0%) |
| 30 to 34 Years | 26 (100.0%) | 0 (0.0%) |
| 35 to 44 Years | 12 (57.1%) | 0 (0.0%) |
| 45 to 54 Years | 5 (100.0%) | 0 (0.0%) |
| 55 to 59 Years | 0 (0.0%) | 0 (0.0%) |
| 60 to 64 Years | 0 (0.0%) | 0 (0.0%) |
| 65 to 74 Years | 23 (31.1%) | 0 (0.0%) |
| 75 Years and over | 0 (0.0%) | 0 (0.0%) |
| Total | 84 (32.1%) | 0 (0.0%) |
Employment Status by Educational Attainment in Deal Island
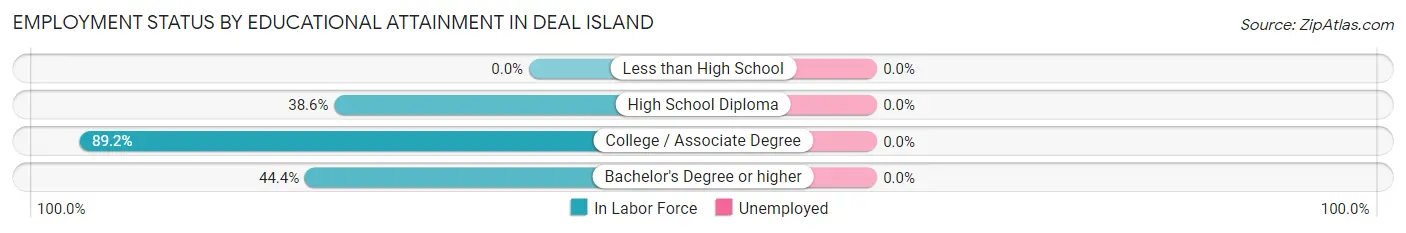
| Educational Attainment | In Labor Force | Unemployed |
| Less than High School | 0 (0.0%) | 0 (0.0%) |
| High School Diploma | 17 (38.6%) | 0 (0.0%) |
| College / Associate Degree | 33 (89.2%) | 0 (0.0%) |
| Bachelor's Degree or higher | 4 (44.4%) | 0 (0.0%) |
| Total | 54 (56.8%) | 0 (0.0%) |
Employment Occupations by Sex in Deal Island
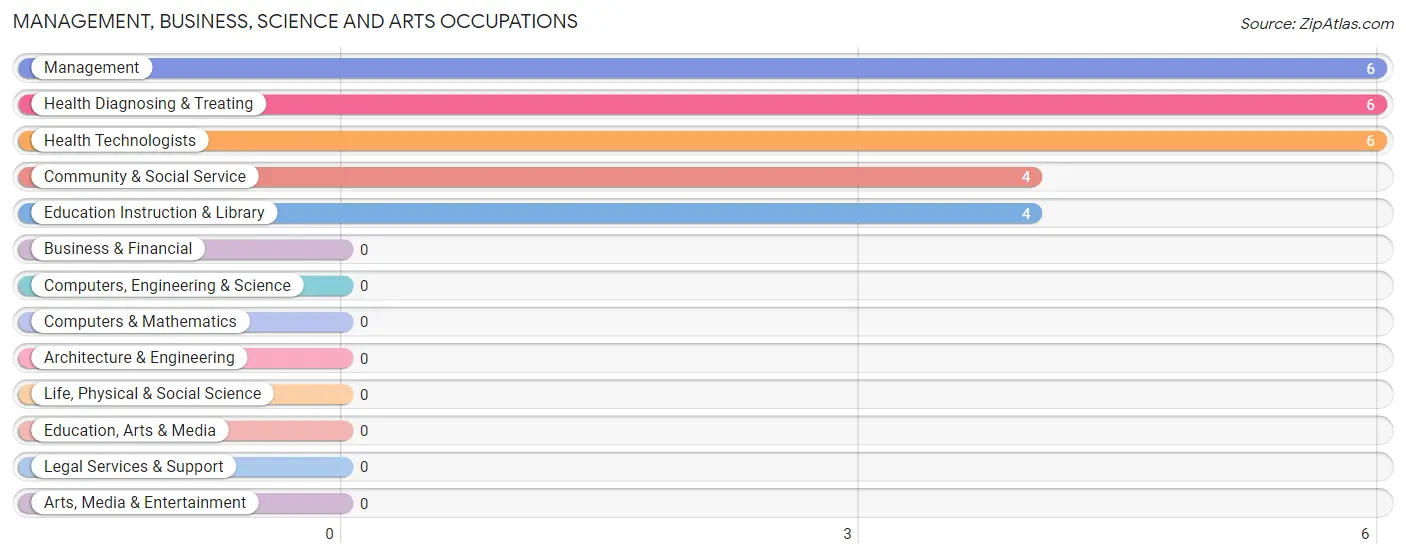
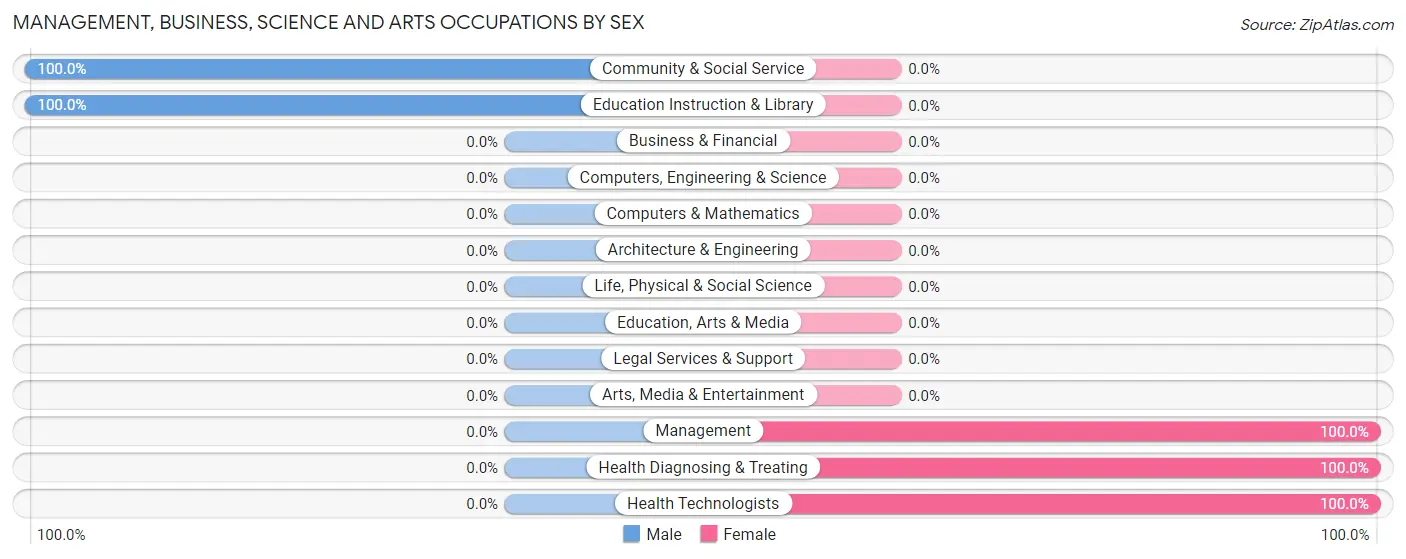
Management, Business, Science and Arts Occupations
The most common Management, Business, Science and Arts occupations in Deal Island are Management (6 | 7.1%), Health Diagnosing & Treating (6 | 7.1%), Health Technologists (6 | 7.1%), Community & Social Service (4 | 4.8%), and Education Instruction & Library (4 | 4.8%).
Management, Business, Science and Arts Occupations by Sex
Within the Management, Business, Science and Arts occupations in Deal Island, the most male-oriented occupations are Community & Social Service (100.0%), and Education Instruction & Library (100.0%), while the most female-oriented occupations are Management (100.0%), Health Diagnosing & Treating (100.0%), and Health Technologists (100.0%).
| Occupation | Male | Female |
| Management | 0 (0.0%) | 6 (100.0%) |
| Business & Financial | 0 (0.0%) | 0 (0.0%) |
| Computers, Engineering & Science | 0 (0.0%) | 0 (0.0%) |
| Computers & Mathematics | 0 (0.0%) | 0 (0.0%) |
| Architecture & Engineering | 0 (0.0%) | 0 (0.0%) |
| Life, Physical & Social Science | 0 (0.0%) | 0 (0.0%) |
| Community & Social Service | 4 (100.0%) | 0 (0.0%) |
| Education, Arts & Media | 0 (0.0%) | 0 (0.0%) |
| Legal Services & Support | 0 (0.0%) | 0 (0.0%) |
| Education Instruction & Library | 4 (100.0%) | 0 (0.0%) |
| Arts, Media & Entertainment | 0 (0.0%) | 0 (0.0%) |
| Health Diagnosing & Treating | 0 (0.0%) | 6 (100.0%) |
| Health Technologists | 0 (0.0%) | 6 (100.0%) |
| Total (Category) | 4 (25.0%) | 12 (75.0%) |
| Total (Overall) | 46 (54.8%) | 38 (45.2%) |
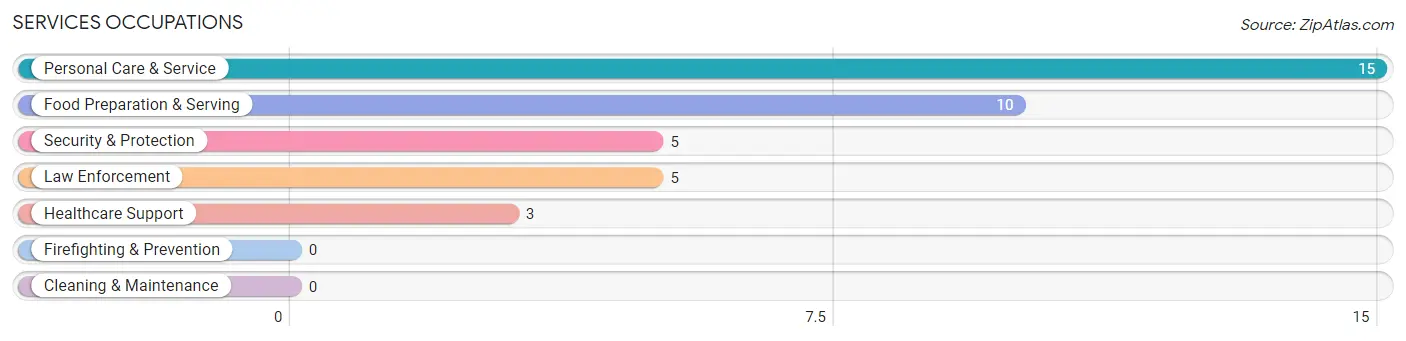
Services Occupations
The most common Services occupations in Deal Island are Personal Care & Service (15 | 17.9%), Food Preparation & Serving (10 | 11.9%), Security & Protection (5 | 5.9%), Law Enforcement (5 | 5.9%), and Healthcare Support (3 | 3.6%).
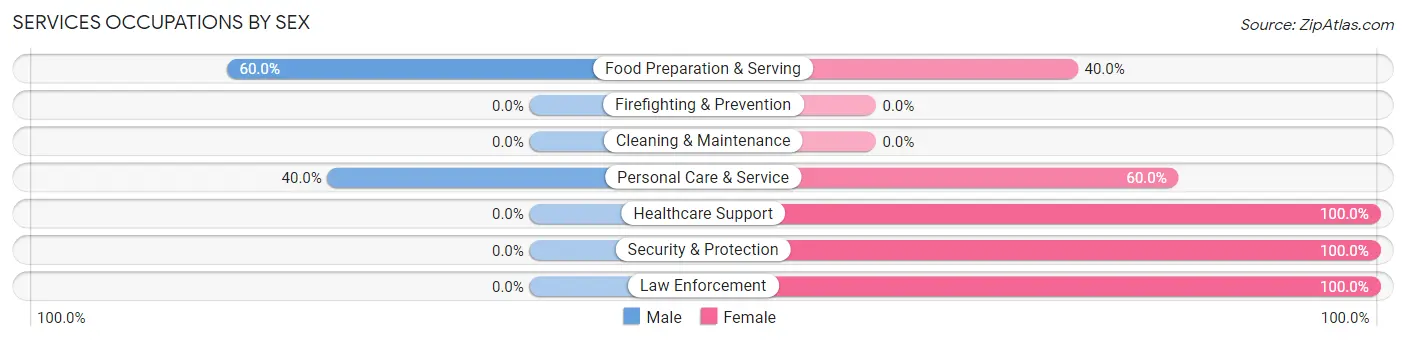
Services Occupations by Sex
Within the Services occupations in Deal Island, the most male-oriented occupations are Food Preparation & Serving (60.0%), and Personal Care & Service (40.0%), while the most female-oriented occupations are Healthcare Support (100.0%), Security & Protection (100.0%), and Law Enforcement (100.0%).
| Occupation | Male | Female |
| Healthcare Support | 0 (0.0%) | 3 (100.0%) |
| Security & Protection | 0 (0.0%) | 5 (100.0%) |
| Firefighting & Prevention | 0 (0.0%) | 0 (0.0%) |
| Law Enforcement | 0 (0.0%) | 5 (100.0%) |
| Food Preparation & Serving | 6 (60.0%) | 4 (40.0%) |
| Cleaning & Maintenance | 0 (0.0%) | 0 (0.0%) |
| Personal Care & Service | 6 (40.0%) | 9 (60.0%) |
| Total (Category) | 12 (36.4%) | 21 (63.6%) |
| Total (Overall) | 46 (54.8%) | 38 (45.2%) |
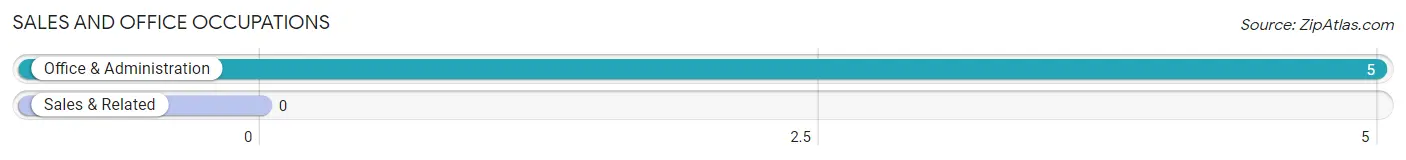
Sales and Office Occupations
The most common Sales and Office occupations in Deal Island are , and Office & Administration (5 | 5.9%).
Sales and Office Occupations by Sex
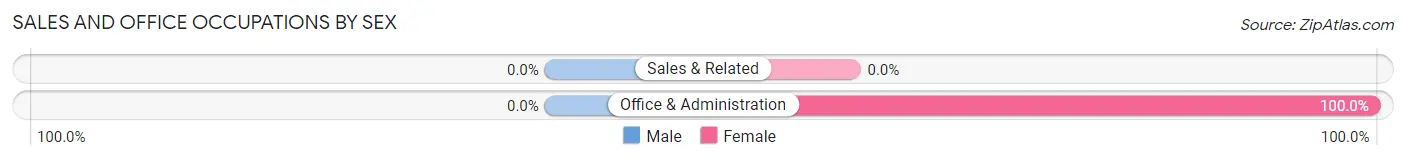
| Occupation | Male | Female |
| Sales & Related | 0 (0.0%) | 0 (0.0%) |
| Office & Administration | 0 (0.0%) | 5 (100.0%) |
| Total (Category) | 0 (0.0%) | 5 (100.0%) |
| Total (Overall) | 46 (54.8%) | 38 (45.2%) |
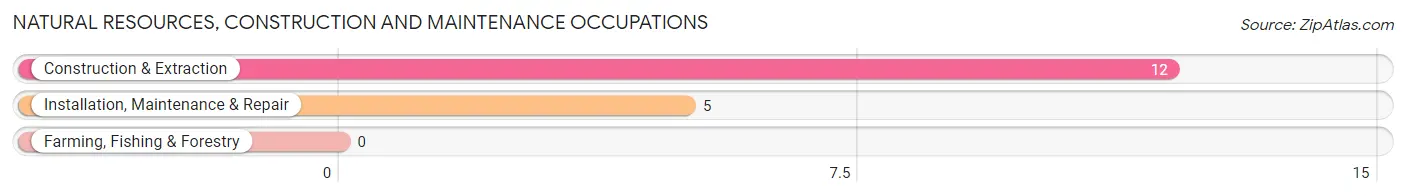
Natural Resources, Construction and Maintenance Occupations
The most common Natural Resources, Construction and Maintenance occupations in Deal Island are Construction & Extraction (12 | 14.3%), and Installation, Maintenance & Repair (5 | 5.9%).
Natural Resources, Construction and Maintenance Occupations by Sex
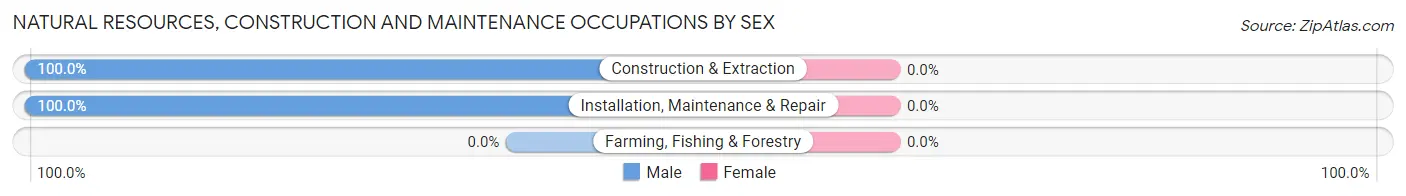
| Occupation | Male | Female |
| Farming, Fishing & Forestry | 0 (0.0%) | 0 (0.0%) |
| Construction & Extraction | 12 (100.0%) | 0 (0.0%) |
| Installation, Maintenance & Repair | 5 (100.0%) | 0 (0.0%) |
| Total (Category) | 17 (100.0%) | 0 (0.0%) |
| Total (Overall) | 46 (54.8%) | 38 (45.2%) |
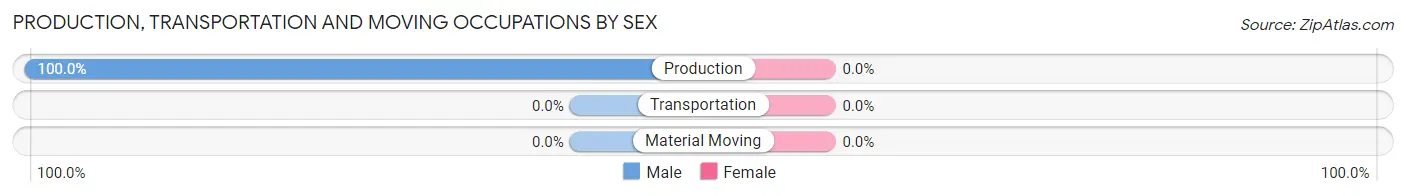
Production, Transportation and Moving Occupations
The most common Production, Transportation and Moving occupations in Deal Island are , and Production (13 | 15.5%).
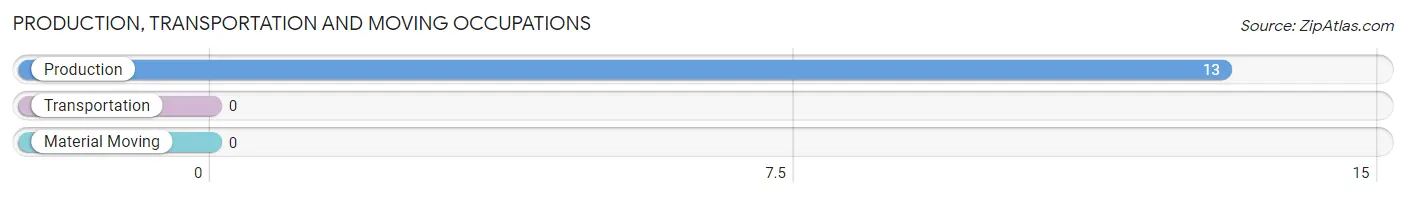
Production, Transportation and Moving Occupations by Sex
| Occupation | Male | Female |
| Production | 13 (100.0%) | 0 (0.0%) |
| Transportation | 0 (0.0%) | 0 (0.0%) |
| Material Moving | 0 (0.0%) | 0 (0.0%) |
| Total (Category) | 13 (100.0%) | 0 (0.0%) |
| Total (Overall) | 46 (54.8%) | 38 (45.2%) |
Employment Industries by Sex in Deal Island
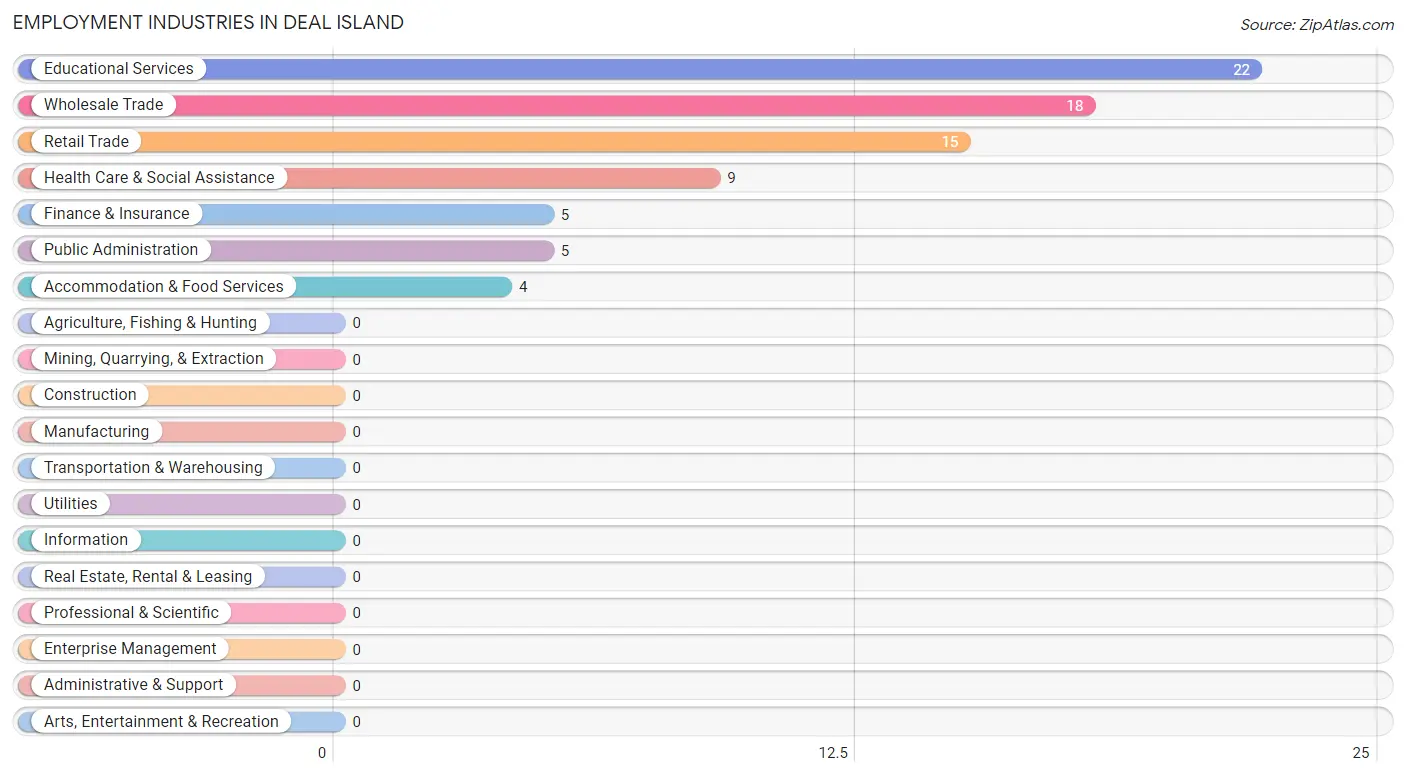
Employment Industries in Deal Island
The major employment industries in Deal Island include Educational Services (22 | 26.2%), Wholesale Trade (18 | 21.4%), Retail Trade (15 | 17.9%), Health Care & Social Assistance (9 | 10.7%), and Finance & Insurance (5 | 5.9%).
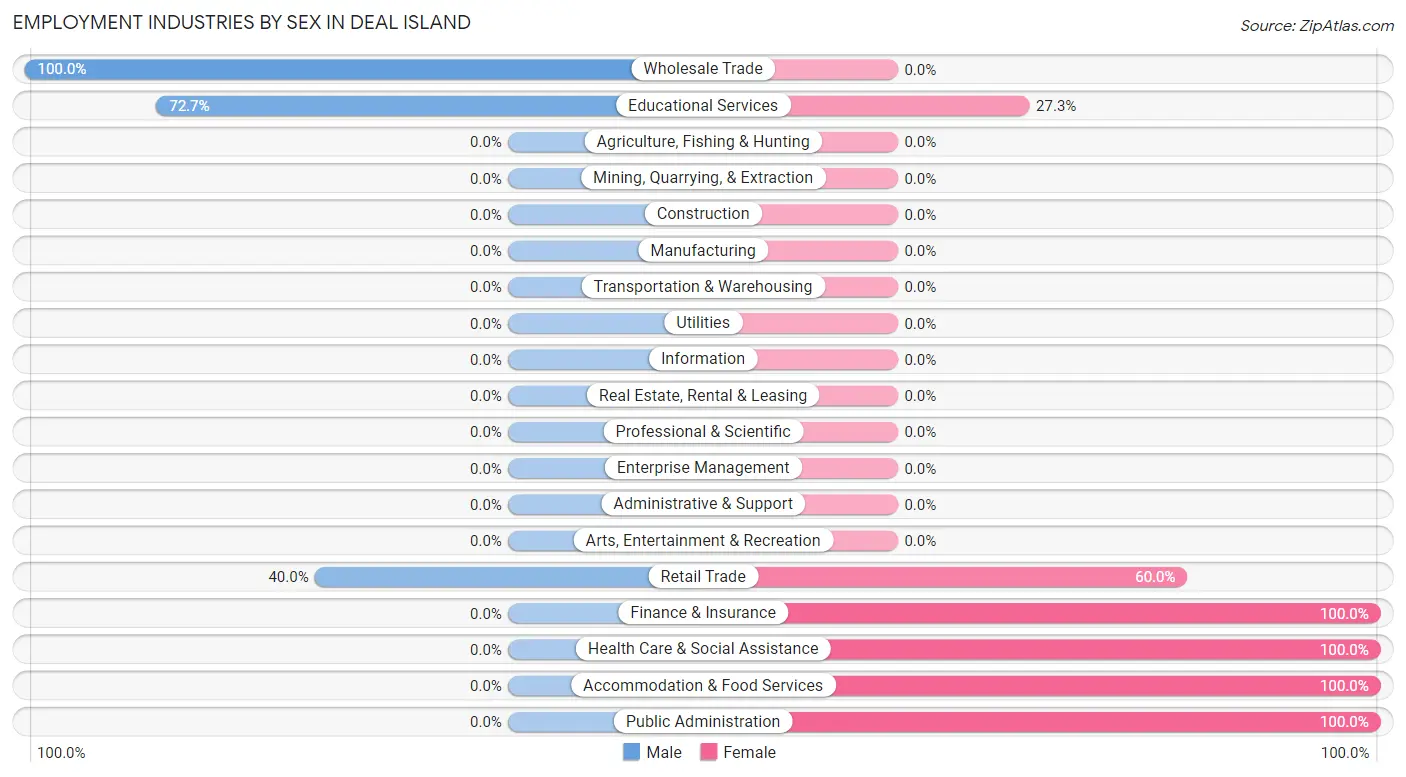
Employment Industries by Sex in Deal Island
The Deal Island industries that see more men than women are Wholesale Trade (100.0%), Educational Services (72.7%), and Retail Trade (40.0%), whereas the industries that tend to have a higher number of women are Finance & Insurance (100.0%), Health Care & Social Assistance (100.0%), and Accommodation & Food Services (100.0%).
| Industry | Male | Female |
| Agriculture, Fishing & Hunting | 0 (0.0%) | 0 (0.0%) |
| Mining, Quarrying, & Extraction | 0 (0.0%) | 0 (0.0%) |
| Construction | 0 (0.0%) | 0 (0.0%) |
| Manufacturing | 0 (0.0%) | 0 (0.0%) |
| Wholesale Trade | 18 (100.0%) | 0 (0.0%) |
| Retail Trade | 6 (40.0%) | 9 (60.0%) |
| Transportation & Warehousing | 0 (0.0%) | 0 (0.0%) |
| Utilities | 0 (0.0%) | 0 (0.0%) |
| Information | 0 (0.0%) | 0 (0.0%) |
| Finance & Insurance | 0 (0.0%) | 5 (100.0%) |
| Real Estate, Rental & Leasing | 0 (0.0%) | 0 (0.0%) |
| Professional & Scientific | 0 (0.0%) | 0 (0.0%) |
| Enterprise Management | 0 (0.0%) | 0 (0.0%) |
| Administrative & Support | 0 (0.0%) | 0 (0.0%) |
| Educational Services | 16 (72.7%) | 6 (27.3%) |
| Health Care & Social Assistance | 0 (0.0%) | 9 (100.0%) |
| Arts, Entertainment & Recreation | 0 (0.0%) | 0 (0.0%) |
| Accommodation & Food Services | 0 (0.0%) | 4 (100.0%) |
| Public Administration | 0 (0.0%) | 5 (100.0%) |
| Total | 46 (54.8%) | 38 (45.2%) |
Education in Deal Island
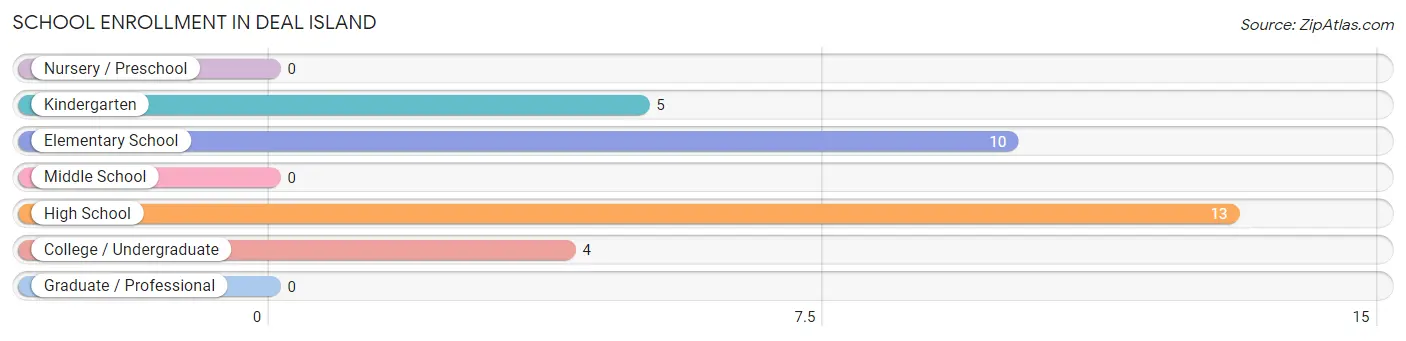
School Enrollment in Deal Island
The most common levels of schooling among the 32 students in Deal Island are high school (13 | 40.6%), elementary school (10 | 31.2%), and kindergarten (5 | 15.6%).
| School Level | # Students | % Students |
| Nursery / Preschool | 0 | 0.0% |
| Kindergarten | 5 | 15.6% |
| Elementary School | 10 | 31.2% |
| Middle School | 0 | 0.0% |
| High School | 13 | 40.6% |
| College / Undergraduate | 4 | 12.5% |
| Graduate / Professional | 0 | 0.0% |
| Total | 32 | 100.0% |
School Enrollment by Age by Funding Source in Deal Island
Out of a total of 32 students who are enrolled in schools in Deal Island, 5 (15.6%) attend a private institution, while the remaining 27 (84.4%) are enrolled in public schools. The age group of 15 to 17 year olds has the highest likelihood of being enrolled in private schools, with 5 (38.5% in the age bracket) enrolled. Conversely, the age group of 5 to 9 year old has the lowest likelihood of being enrolled in a private school, with 15 (100.0% in the age bracket) attending a public institution.
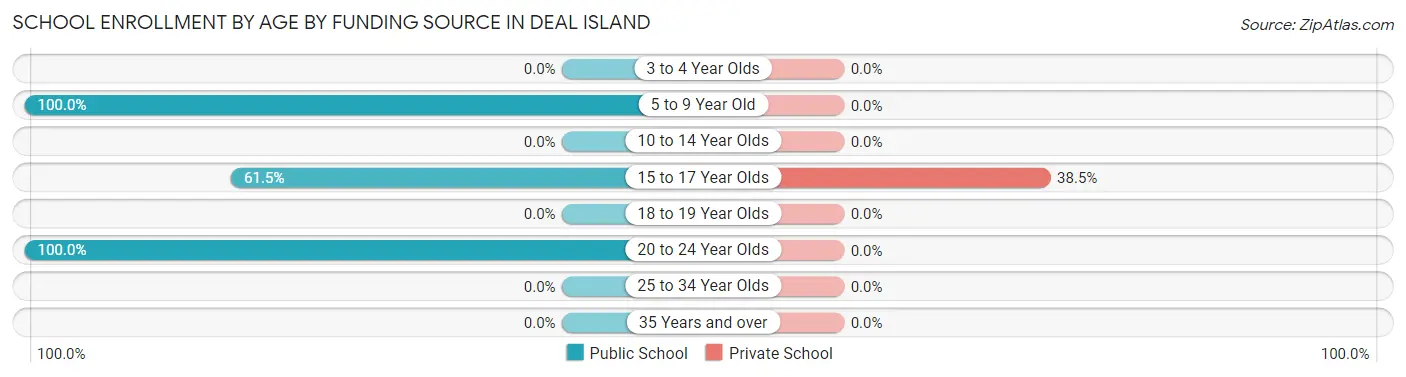
| Age Bracket | Public School | Private School |
| 3 to 4 Year Olds | 0 (0.0%) | 0 (0.0%) |
| 5 to 9 Year Old | 15 (100.0%) | 0 (0.0%) |
| 10 to 14 Year Olds | 0 (0.0%) | 0 (0.0%) |
| 15 to 17 Year Olds | 8 (61.5%) | 5 (38.5%) |
| 18 to 19 Year Olds | 0 (0.0%) | 0 (0.0%) |
| 20 to 24 Year Olds | 4 (100.0%) | 0 (0.0%) |
| 25 to 34 Year Olds | 0 (0.0%) | 0 (0.0%) |
| 35 Years and over | 0 (0.0%) | 0 (0.0%) |
| Total | 27 (84.4%) | 5 (15.6%) |
Educational Attainment by Field of Study in Deal Island
Education (10 | 20.0%), visual & performing arts (10 | 20.0%), science & technology (6 | 12.0%), arts & humanities (6 | 12.0%), and social sciences (5 | 10.0%) are the most common fields of study among 50 individuals in Deal Island who have obtained a bachelor's degree or higher.
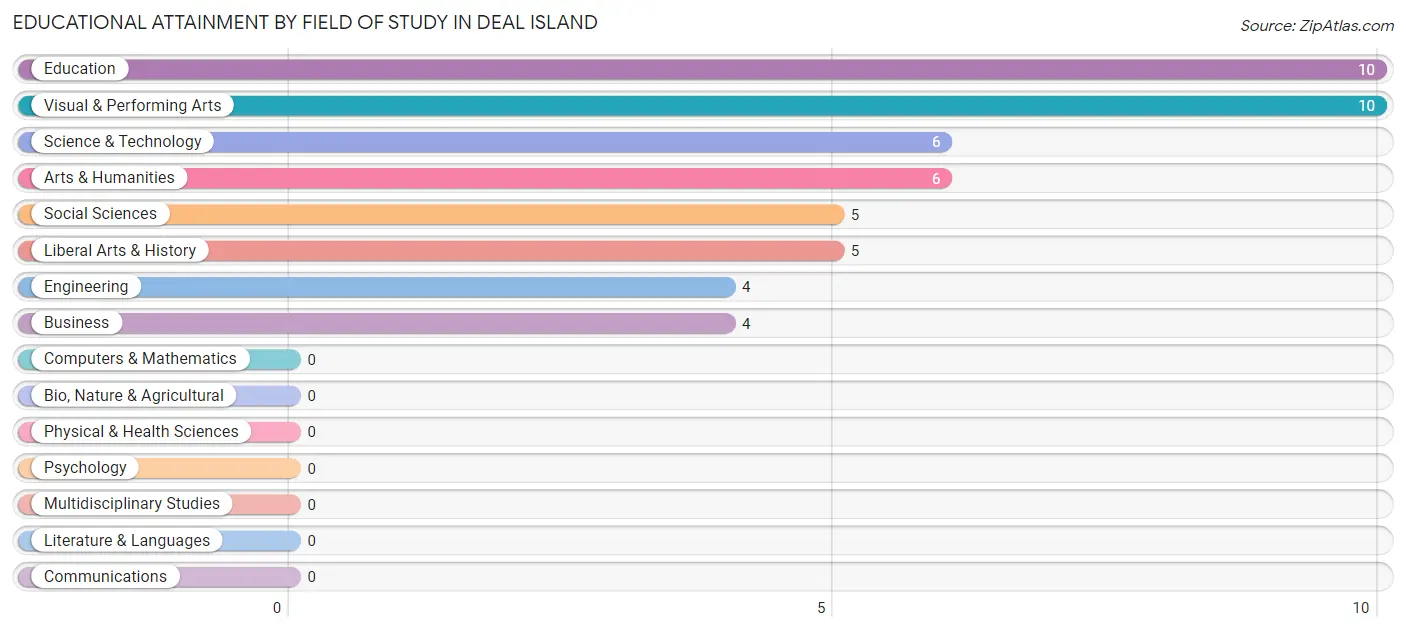
| Field of Study | # Graduates | % Graduates |
| Computers & Mathematics | 0 | 0.0% |
| Bio, Nature & Agricultural | 0 | 0.0% |
| Physical & Health Sciences | 0 | 0.0% |
| Psychology | 0 | 0.0% |
| Social Sciences | 5 | 10.0% |
| Engineering | 4 | 8.0% |
| Multidisciplinary Studies | 0 | 0.0% |
| Science & Technology | 6 | 12.0% |
| Business | 4 | 8.0% |
| Education | 10 | 20.0% |
| Literature & Languages | 0 | 0.0% |
| Liberal Arts & History | 5 | 10.0% |
| Visual & Performing Arts | 10 | 20.0% |
| Communications | 0 | 0.0% |
| Arts & Humanities | 6 | 12.0% |
| Total | 50 | 100.0% |
Transportation & Commute in Deal Island
Vehicle Availability by Sex in Deal Island
The most prevalent vehicle ownership categories in Deal Island are males with 1 vehicle (19, accounting for 46.3%) and females with 1 vehicle (11, making up 50.0%).
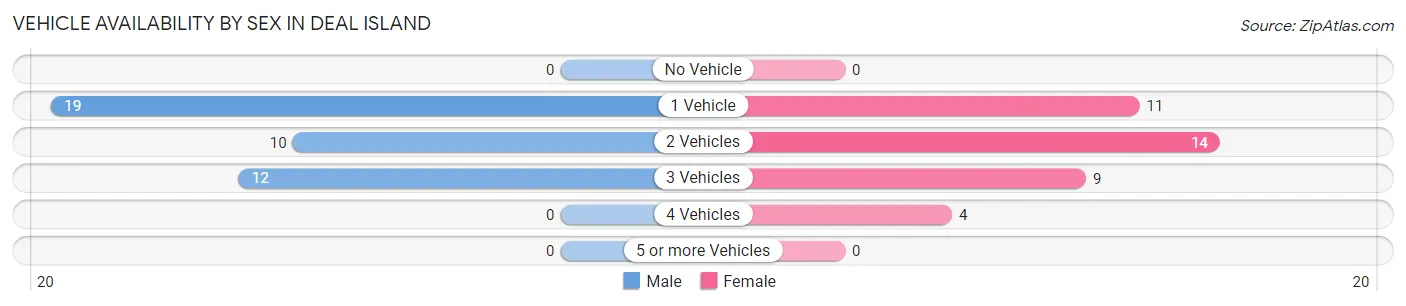
| Vehicles Available | Male | Female |
| No Vehicle | 0 (0.0%) | 0 (0.0%) |
| 1 Vehicle | 19 (46.3%) | 11 (28.9%) |
| 2 Vehicles | 10 (24.4%) | 14 (36.8%) |
| 3 Vehicles | 12 (29.3%) | 9 (23.7%) |
| 4 Vehicles | 0 (0.0%) | 4 (10.5%) |
| 5 or more Vehicles | 0 (0.0%) | 0 (0.0%) |
| Total | 41 (100.0%) | 38 (100.0%) |
Commute Time in Deal Island
The most frequently occuring commute durations in Deal Island are 45 to 59 minutes (38 commuters, 52.0%), 5 to 9 minutes (14 commuters, 19.2%), and 15 to 19 minutes (6 commuters, 8.2%).
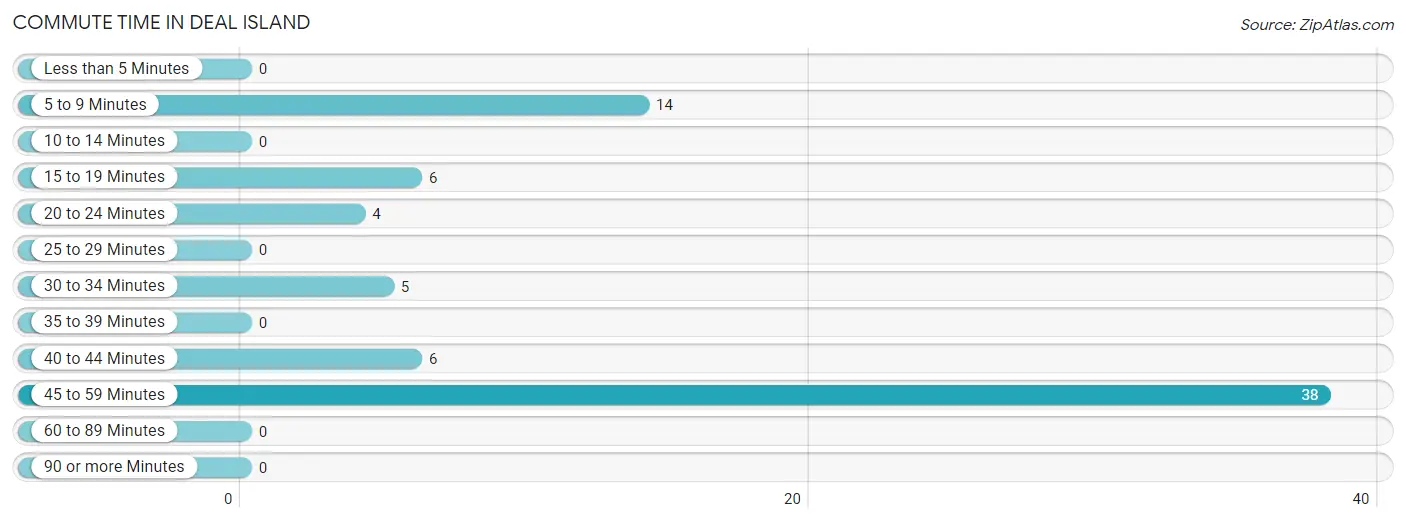
| Commute Time | # Commuters | % Commuters |
| Less than 5 Minutes | 0 | 0.0% |
| 5 to 9 Minutes | 14 | 19.2% |
| 10 to 14 Minutes | 0 | 0.0% |
| 15 to 19 Minutes | 6 | 8.2% |
| 20 to 24 Minutes | 4 | 5.5% |
| 25 to 29 Minutes | 0 | 0.0% |
| 30 to 34 Minutes | 5 | 6.9% |
| 35 to 39 Minutes | 0 | 0.0% |
| 40 to 44 Minutes | 6 | 8.2% |
| 45 to 59 Minutes | 38 | 52.0% |
| 60 to 89 Minutes | 0 | 0.0% |
| 90 or more Minutes | 0 | 0.0% |
Commute Time by Sex in Deal Island
The most common commute times in Deal Island are 45 to 59 minutes (25 commuters, 61.0%) for males and 5 to 9 minutes (14 commuters, 43.8%) for females.
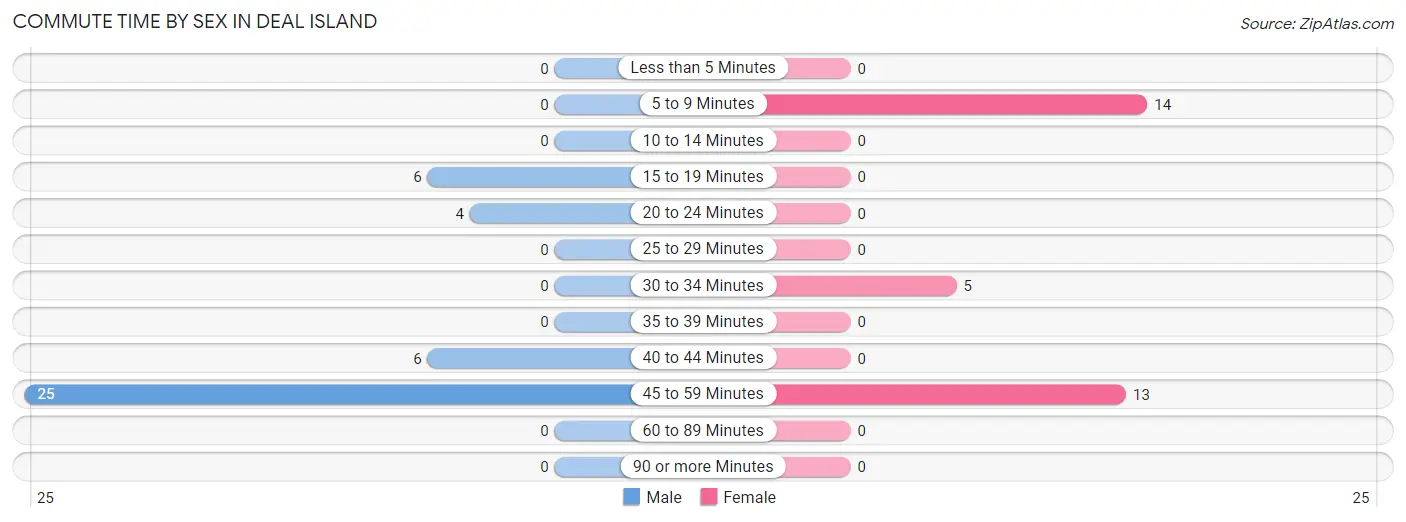
| Commute Time | Male | Female |
| Less than 5 Minutes | 0 (0.0%) | 0 (0.0%) |
| 5 to 9 Minutes | 0 (0.0%) | 14 (43.8%) |
| 10 to 14 Minutes | 0 (0.0%) | 0 (0.0%) |
| 15 to 19 Minutes | 6 (14.6%) | 0 (0.0%) |
| 20 to 24 Minutes | 4 (9.8%) | 0 (0.0%) |
| 25 to 29 Minutes | 0 (0.0%) | 0 (0.0%) |
| 30 to 34 Minutes | 0 (0.0%) | 5 (15.6%) |
| 35 to 39 Minutes | 0 (0.0%) | 0 (0.0%) |
| 40 to 44 Minutes | 6 (14.6%) | 0 (0.0%) |
| 45 to 59 Minutes | 25 (61.0%) | 13 (40.6%) |
| 60 to 89 Minutes | 0 (0.0%) | 0 (0.0%) |
| 90 or more Minutes | 0 (0.0%) | 0 (0.0%) |
Time of Departure to Work by Sex in Deal Island
The most frequent times of departure to work in Deal Island are 5:00 AM to 5:29 AM (25, 61.0%) for males and 5:00 AM to 5:29 AM (9, 28.1%) for females.
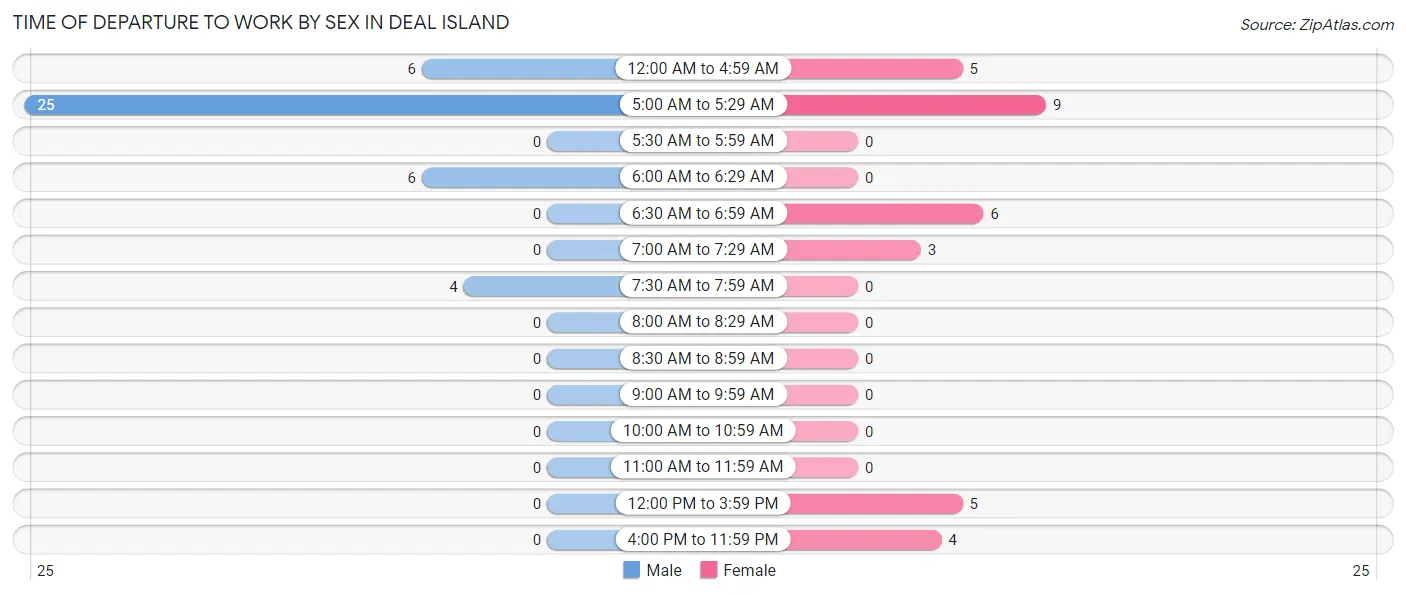
| Time of Departure | Male | Female |
| 12:00 AM to 4:59 AM | 6 (14.6%) | 5 (15.6%) |
| 5:00 AM to 5:29 AM | 25 (61.0%) | 9 (28.1%) |
| 5:30 AM to 5:59 AM | 0 (0.0%) | 0 (0.0%) |
| 6:00 AM to 6:29 AM | 6 (14.6%) | 0 (0.0%) |
| 6:30 AM to 6:59 AM | 0 (0.0%) | 6 (18.8%) |
| 7:00 AM to 7:29 AM | 0 (0.0%) | 3 (9.4%) |
| 7:30 AM to 7:59 AM | 4 (9.8%) | 0 (0.0%) |
| 8:00 AM to 8:29 AM | 0 (0.0%) | 0 (0.0%) |
| 8:30 AM to 8:59 AM | 0 (0.0%) | 0 (0.0%) |
| 9:00 AM to 9:59 AM | 0 (0.0%) | 0 (0.0%) |
| 10:00 AM to 10:59 AM | 0 (0.0%) | 0 (0.0%) |
| 11:00 AM to 11:59 AM | 0 (0.0%) | 0 (0.0%) |
| 12:00 PM to 3:59 PM | 0 (0.0%) | 5 (15.6%) |
| 4:00 PM to 11:59 PM | 0 (0.0%) | 4 (12.5%) |
| Total | 41 (100.0%) | 32 (100.0%) |
Housing Occupancy in Deal Island
Occupancy by Ownership in Deal Island
Of the total 176 dwellings in Deal Island, owner-occupied units account for 151 (85.8%), while renter-occupied units make up 25 (14.2%).
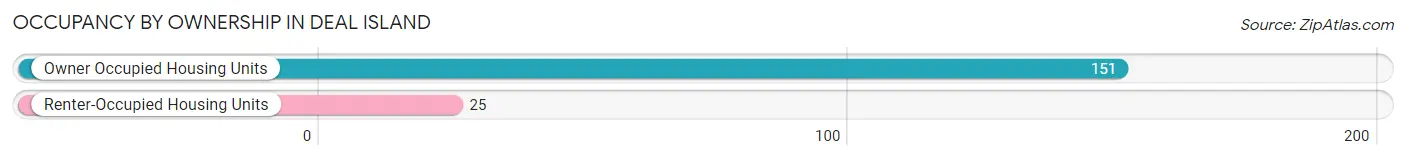
| Occupancy | # Housing Units | % Housing Units |
| Owner Occupied Housing Units | 151 | 85.8% |
| Renter-Occupied Housing Units | 25 | 14.2% |
| Total Occupied Housing Units | 176 | 100.0% |
Occupancy by Household Size in Deal Island
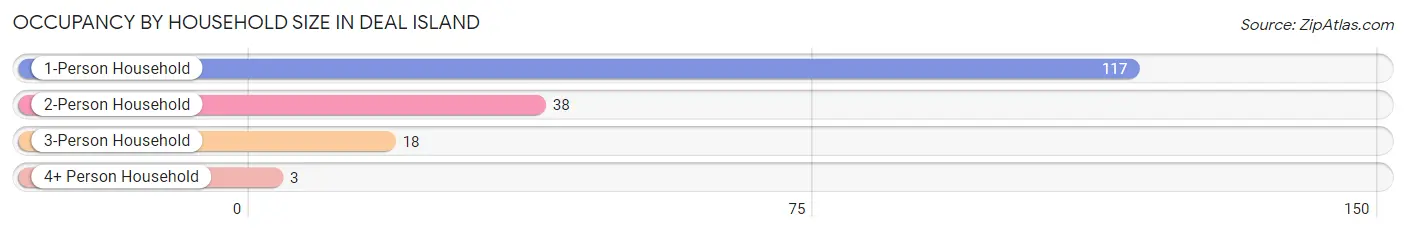
| Household Size | # Housing Units | % Housing Units |
| 1-Person Household | 117 | 66.5% |
| 2-Person Household | 38 | 21.6% |
| 3-Person Household | 18 | 10.2% |
| 4+ Person Household | 3 | 1.7% |
| Total Housing Units | 176 | 100.0% |
Occupancy by Ownership by Household Size in Deal Island
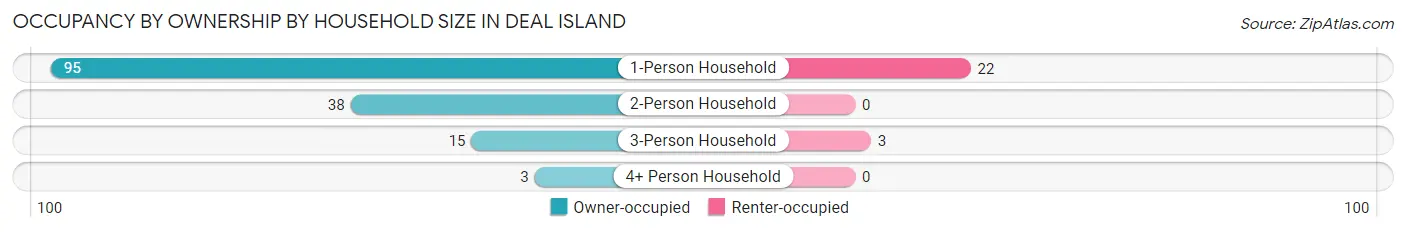
| Household Size | Owner-occupied | Renter-occupied |
| 1-Person Household | 95 (81.2%) | 22 (18.8%) |
| 2-Person Household | 38 (100.0%) | 0 (0.0%) |
| 3-Person Household | 15 (83.3%) | 3 (16.7%) |
| 4+ Person Household | 3 (100.0%) | 0 (0.0%) |
| Total Housing Units | 151 (85.8%) | 25 (14.2%) |
Occupancy by Educational Attainment in Deal Island
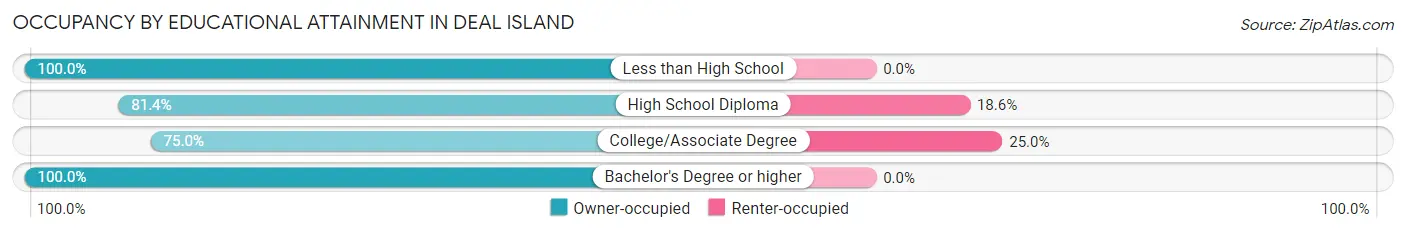
| Household Size | Owner-occupied | Renter-occupied |
| Less than High School | 31 (100.0%) | 0 (0.0%) |
| High School Diploma | 35 (81.4%) | 8 (18.6%) |
| College/Associate Degree | 51 (75.0%) | 17 (25.0%) |
| Bachelor's Degree or higher | 34 (100.0%) | 0 (0.0%) |
Occupancy by Age of Householder in Deal Island
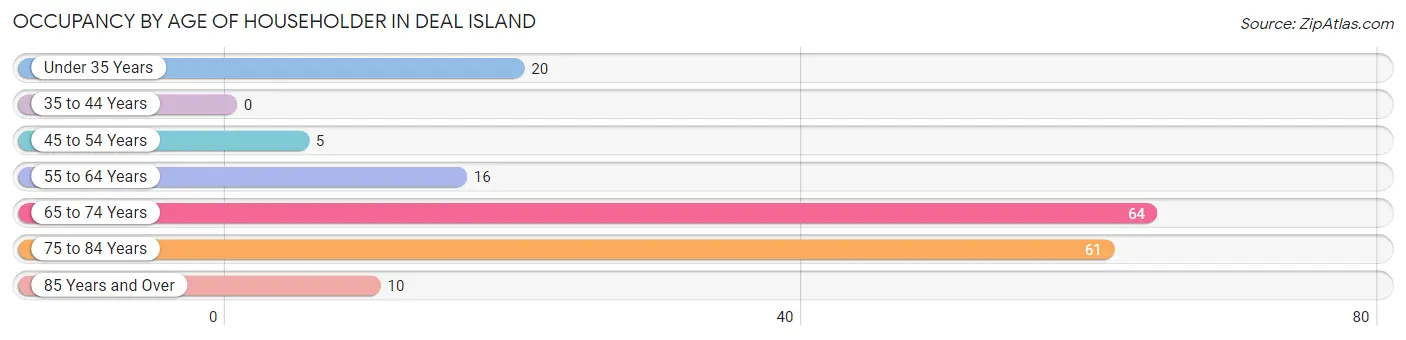
| Age Bracket | # Households | % Households |
| Under 35 Years | 20 | 11.4% |
| 35 to 44 Years | 0 | 0.0% |
| 45 to 54 Years | 5 | 2.8% |
| 55 to 64 Years | 16 | 9.1% |
| 65 to 74 Years | 64 | 36.4% |
| 75 to 84 Years | 61 | 34.7% |
| 85 Years and Over | 10 | 5.7% |
| Total | 176 | 100.0% |
Housing Finances in Deal Island
Median Income by Occupancy in Deal Island
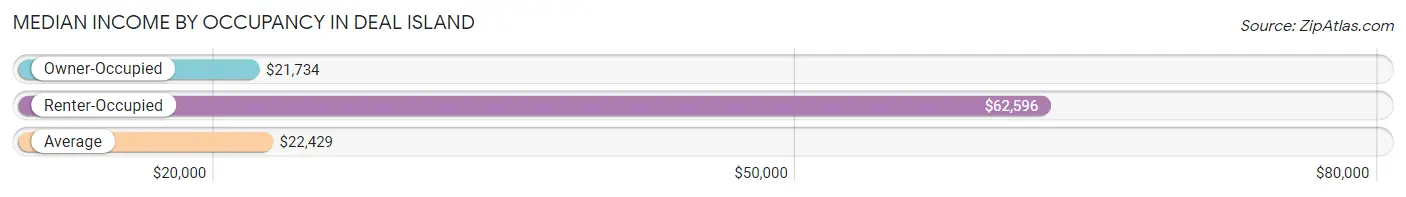
| Occupancy Type | # Households | Median Income |
| Owner-Occupied | 151 (85.8%) | $21,734 |
| Renter-Occupied | 25 (14.2%) | $62,596 |
| Average | 176 (100.0%) | $22,429 |
Occupancy by Householder Income Bracket in Deal Island
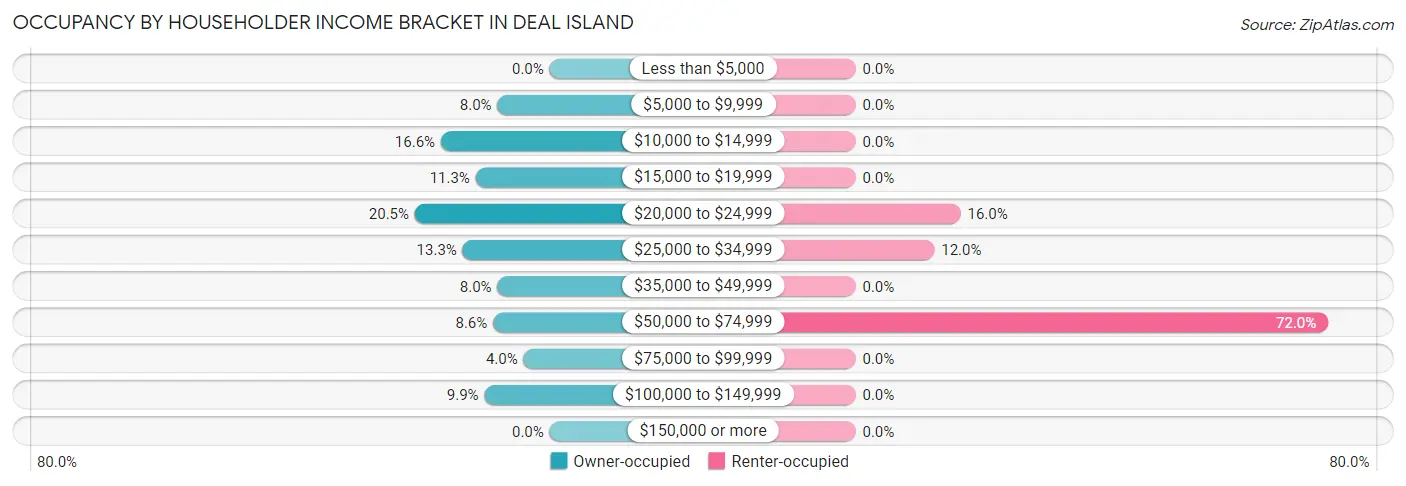
| Income Bracket | Owner-occupied | Renter-occupied |
| Less than $5,000 | 0 (0.0%) | 0 (0.0%) |
| $5,000 to $9,999 | 12 (8.0%) | 0 (0.0%) |
| $10,000 to $14,999 | 25 (16.6%) | 0 (0.0%) |
| $15,000 to $19,999 | 17 (11.3%) | 0 (0.0%) |
| $20,000 to $24,999 | 31 (20.5%) | 4 (16.0%) |
| $25,000 to $34,999 | 20 (13.3%) | 3 (12.0%) |
| $35,000 to $49,999 | 12 (8.0%) | 0 (0.0%) |
| $50,000 to $74,999 | 13 (8.6%) | 18 (72.0%) |
| $75,000 to $99,999 | 6 (4.0%) | 0 (0.0%) |
| $100,000 to $149,999 | 15 (9.9%) | 0 (0.0%) |
| $150,000 or more | 0 (0.0%) | 0 (0.0%) |
| Total | 151 (100.0%) | 25 (100.0%) |
Monthly Housing Cost Tiers in Deal Island
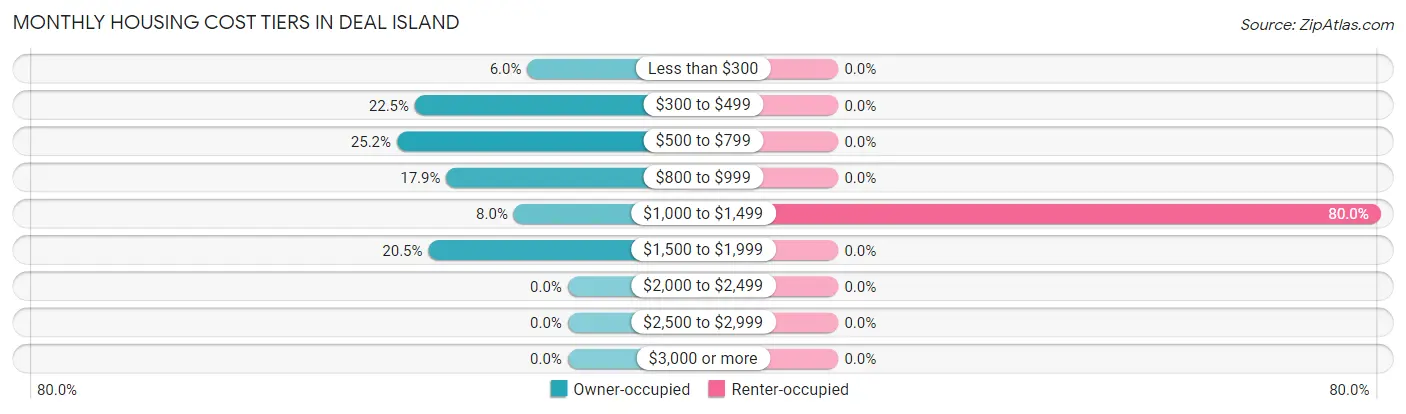
| Monthly Cost | Owner-occupied | Renter-occupied |
| Less than $300 | 9 (6.0%) | 0 (0.0%) |
| $300 to $499 | 34 (22.5%) | 0 (0.0%) |
| $500 to $799 | 38 (25.2%) | 0 (0.0%) |
| $800 to $999 | 27 (17.9%) | 0 (0.0%) |
| $1,000 to $1,499 | 12 (8.0%) | 20 (80.0%) |
| $1,500 to $1,999 | 31 (20.5%) | 0 (0.0%) |
| $2,000 to $2,499 | 0 (0.0%) | 0 (0.0%) |
| $2,500 to $2,999 | 0 (0.0%) | 0 (0.0%) |
| $3,000 or more | 0 (0.0%) | 0 (0.0%) |
| Total | 151 (100.0%) | 25 (100.0%) |
Physical Housing Characteristics in Deal Island
Housing Structures in Deal Island
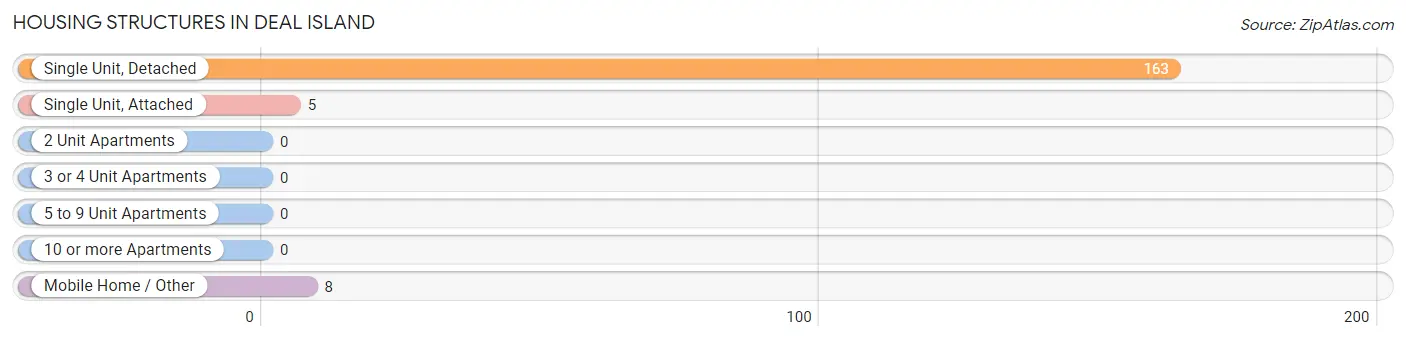
| Structure Type | # Housing Units | % Housing Units |
| Single Unit, Detached | 163 | 92.6% |
| Single Unit, Attached | 5 | 2.8% |
| 2 Unit Apartments | 0 | 0.0% |
| 3 or 4 Unit Apartments | 0 | 0.0% |
| 5 to 9 Unit Apartments | 0 | 0.0% |
| 10 or more Apartments | 0 | 0.0% |
| Mobile Home / Other | 8 | 4.5% |
| Total | 176 | 100.0% |
Housing Structures by Occupancy in Deal Island
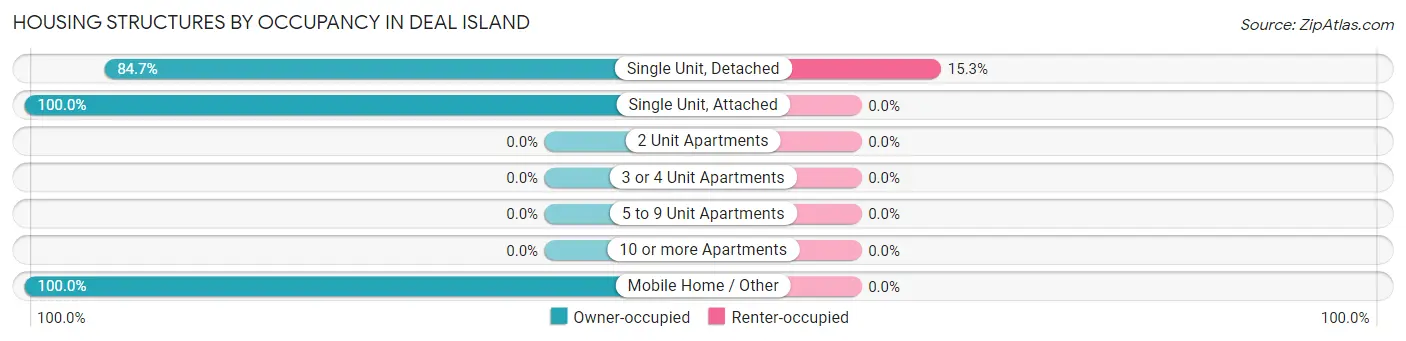
| Structure Type | Owner-occupied | Renter-occupied |
| Single Unit, Detached | 138 (84.7%) | 25 (15.3%) |
| Single Unit, Attached | 5 (100.0%) | 0 (0.0%) |
| 2 Unit Apartments | 0 (0.0%) | 0 (0.0%) |
| 3 or 4 Unit Apartments | 0 (0.0%) | 0 (0.0%) |
| 5 to 9 Unit Apartments | 0 (0.0%) | 0 (0.0%) |
| 10 or more Apartments | 0 (0.0%) | 0 (0.0%) |
| Mobile Home / Other | 8 (100.0%) | 0 (0.0%) |
| Total | 151 (85.8%) | 25 (14.2%) |
Housing Structures by Number of Rooms in Deal Island
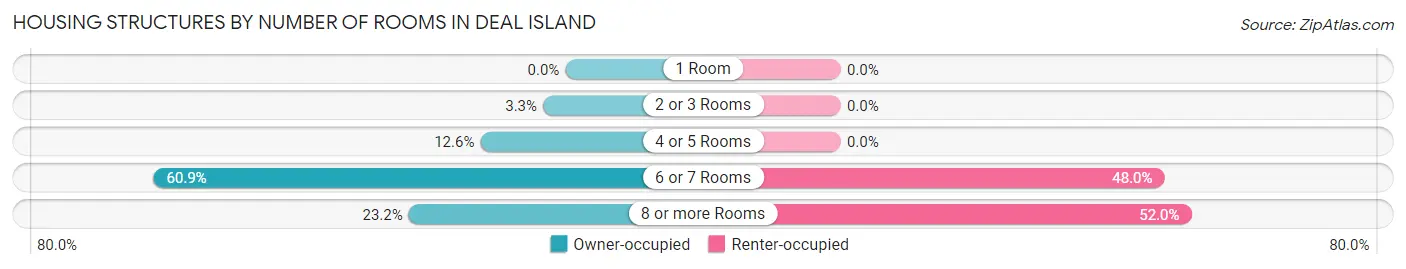
| Number of Rooms | Owner-occupied | Renter-occupied |
| 1 Room | 0 (0.0%) | 0 (0.0%) |
| 2 or 3 Rooms | 5 (3.3%) | 0 (0.0%) |
| 4 or 5 Rooms | 19 (12.6%) | 0 (0.0%) |
| 6 or 7 Rooms | 92 (60.9%) | 12 (48.0%) |
| 8 or more Rooms | 35 (23.2%) | 13 (52.0%) |
| Total | 151 (100.0%) | 25 (100.0%) |
Housing Structure by Heating Type in Deal Island
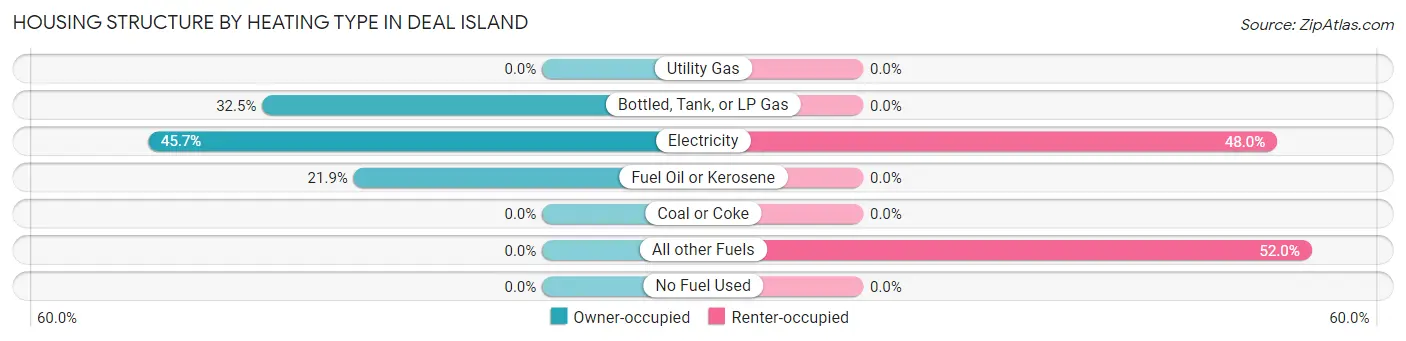
| Heating Type | Owner-occupied | Renter-occupied |
| Utility Gas | 0 (0.0%) | 0 (0.0%) |
| Bottled, Tank, or LP Gas | 49 (32.5%) | 0 (0.0%) |
| Electricity | 69 (45.7%) | 12 (48.0%) |
| Fuel Oil or Kerosene | 33 (21.8%) | 0 (0.0%) |
| Coal or Coke | 0 (0.0%) | 0 (0.0%) |
| All other Fuels | 0 (0.0%) | 13 (52.0%) |
| No Fuel Used | 0 (0.0%) | 0 (0.0%) |
| Total | 151 (100.0%) | 25 (100.0%) |
Household Vehicle Usage in Deal Island
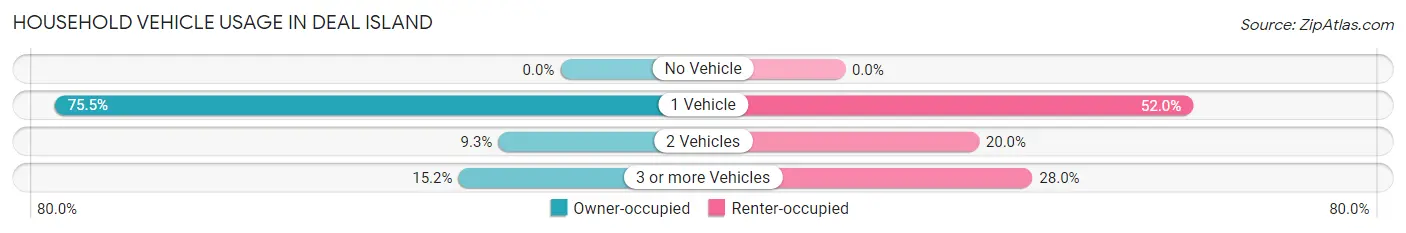
| Vehicles per Household | Owner-occupied | Renter-occupied |
| No Vehicle | 0 (0.0%) | 0 (0.0%) |
| 1 Vehicle | 114 (75.5%) | 13 (52.0%) |
| 2 Vehicles | 14 (9.3%) | 5 (20.0%) |
| 3 or more Vehicles | 23 (15.2%) | 7 (28.0%) |
| Total | 151 (100.0%) | 25 (100.0%) |
Real Estate & Mortgages in Deal Island
Real Estate and Mortgage Overview in Deal Island
| Characteristic | Without Mortgage | With Mortgage |
| Housing Units | 93 | 58 |
| Median Property Value | $134,400 | $114,000 |
| Median Household Income | $21,734 | $0 |
| Monthly Housing Costs | $522 | $0 |
| Real Estate Taxes | $1,288 | $0 |
Property Value by Mortgage Status in Deal Island
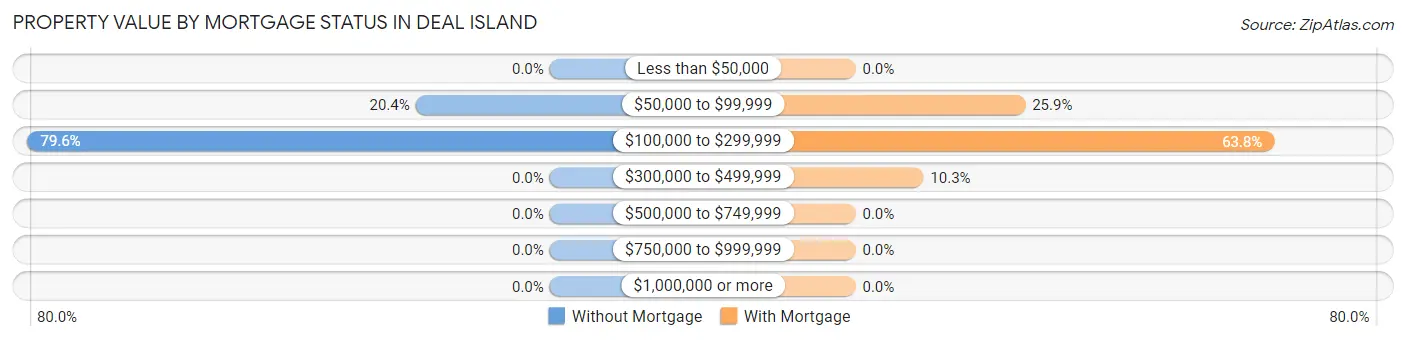
| Property Value | Without Mortgage | With Mortgage |
| Less than $50,000 | 0 (0.0%) | 0 (0.0%) |
| $50,000 to $99,999 | 19 (20.4%) | 15 (25.9%) |
| $100,000 to $299,999 | 74 (79.6%) | 37 (63.8%) |
| $300,000 to $499,999 | 0 (0.0%) | 6 (10.3%) |
| $500,000 to $749,999 | 0 (0.0%) | 0 (0.0%) |
| $750,000 to $999,999 | 0 (0.0%) | 0 (0.0%) |
| $1,000,000 or more | 0 (0.0%) | 0 (0.0%) |
| Total | 93 (100.0%) | 58 (100.0%) |
Household Income by Mortgage Status in Deal Island
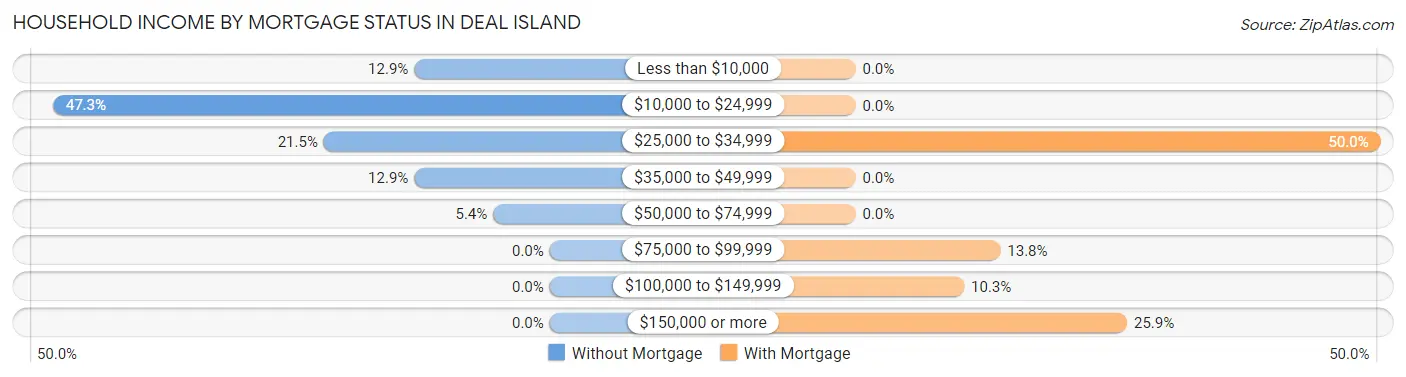
| Household Income | Without Mortgage | With Mortgage |
| Less than $10,000 | 12 (12.9%) | 0 (0.0%) |
| $10,000 to $24,999 | 44 (47.3%) | 0 (0.0%) |
| $25,000 to $34,999 | 20 (21.5%) | 29 (50.0%) |
| $35,000 to $49,999 | 12 (12.9%) | 0 (0.0%) |
| $50,000 to $74,999 | 5 (5.4%) | 0 (0.0%) |
| $75,000 to $99,999 | 0 (0.0%) | 8 (13.8%) |
| $100,000 to $149,999 | 0 (0.0%) | 6 (10.3%) |
| $150,000 or more | 0 (0.0%) | 15 (25.9%) |
| Total | 93 (100.0%) | 58 (100.0%) |
Property Value to Household Income Ratio in Deal Island
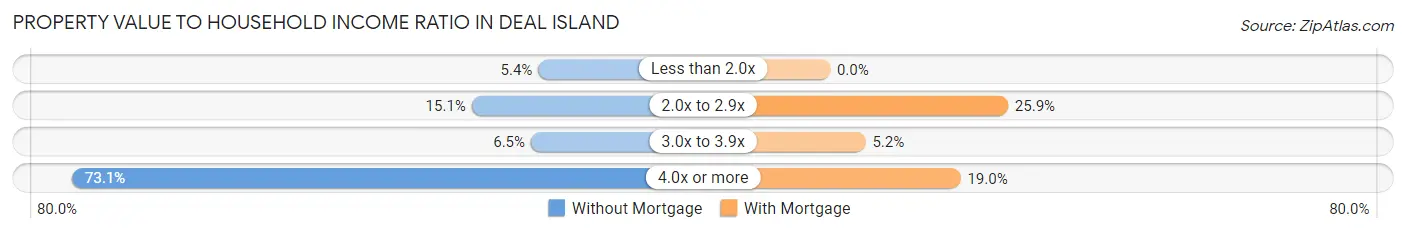
| Value-to-Income Ratio | Without Mortgage | With Mortgage |
| Less than 2.0x | 5 (5.4%) | 0 (0.0%) |
| 2.0x to 2.9x | 14 (15.0%) | 15 (25.9%) |
| 3.0x to 3.9x | 6 (6.5%) | 3 (5.2%) |
| 4.0x or more | 68 (73.1%) | 11 (19.0%) |
| Total | 93 (100.0%) | 58 (100.0%) |
Real Estate Taxes by Mortgage Status in Deal Island
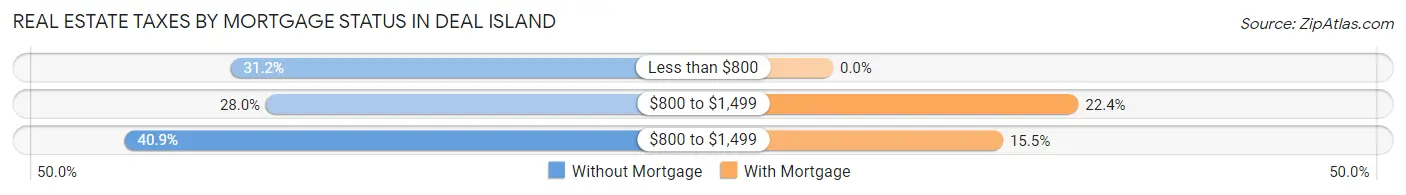
| Property Taxes | Without Mortgage | With Mortgage |
| Less than $800 | 29 (31.2%) | 0 (0.0%) |
| $800 to $1,499 | 26 (28.0%) | 13 (22.4%) |
| $800 to $1,499 | 38 (40.9%) | 9 (15.5%) |
| Total | 93 (100.0%) | 58 (100.0%) |
Health & Disability in Deal Island
Health Insurance Coverage by Age in Deal Island
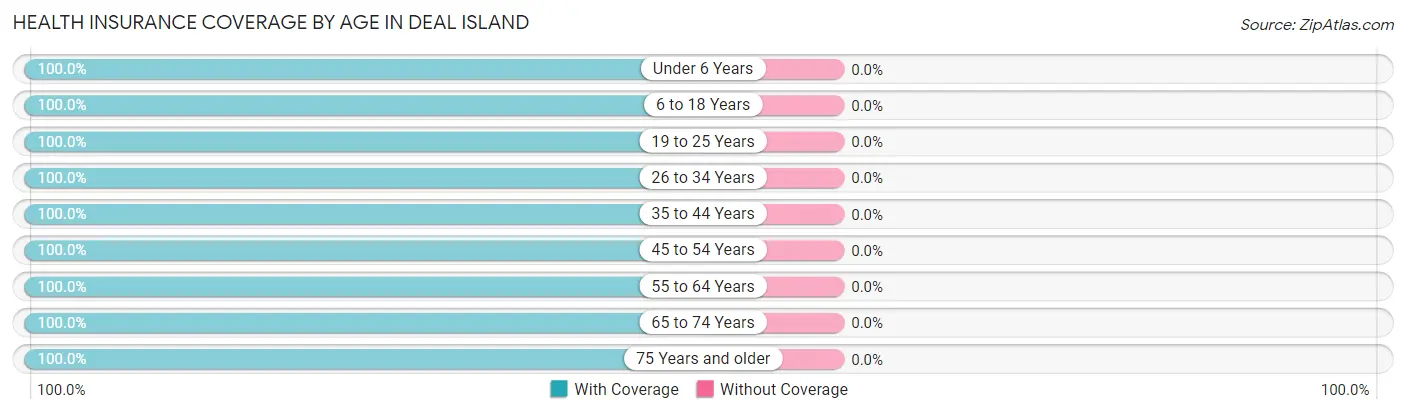
| Age Bracket | With Coverage | Without Coverage |
| Under 6 Years | 14 (100.0%) | 0 (0.0%) |
| 6 to 18 Years | 23 (100.0%) | 0 (0.0%) |
| 19 to 25 Years | 14 (100.0%) | 0 (0.0%) |
| 26 to 34 Years | 32 (100.0%) | 0 (0.0%) |
| 35 to 44 Years | 21 (100.0%) | 0 (0.0%) |
| 45 to 54 Years | 5 (100.0%) | 0 (0.0%) |
| 55 to 64 Years | 32 (100.0%) | 0 (0.0%) |
| 65 to 74 Years | 74 (100.0%) | 0 (0.0%) |
| 75 Years and older | 71 (100.0%) | 0 (0.0%) |
| Total | 286 (100.0%) | 0 (0.0%) |
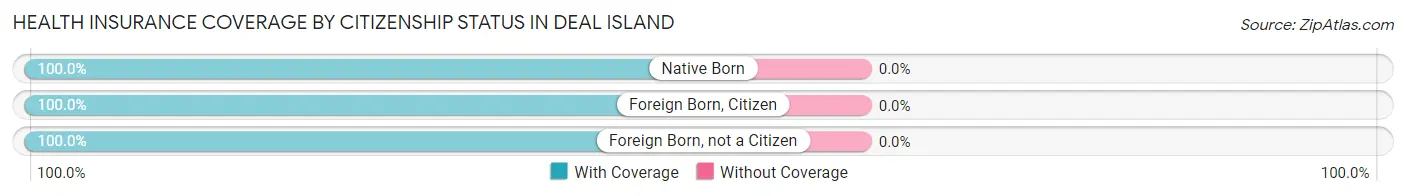
Health Insurance Coverage by Citizenship Status in Deal Island
| Citizenship Status | With Coverage | Without Coverage |
| Native Born | 14 (100.0%) | 0 (0.0%) |
| Foreign Born, Citizen | 23 (100.0%) | 0 (0.0%) |
| Foreign Born, not a Citizen | 14 (100.0%) | 0 (0.0%) |
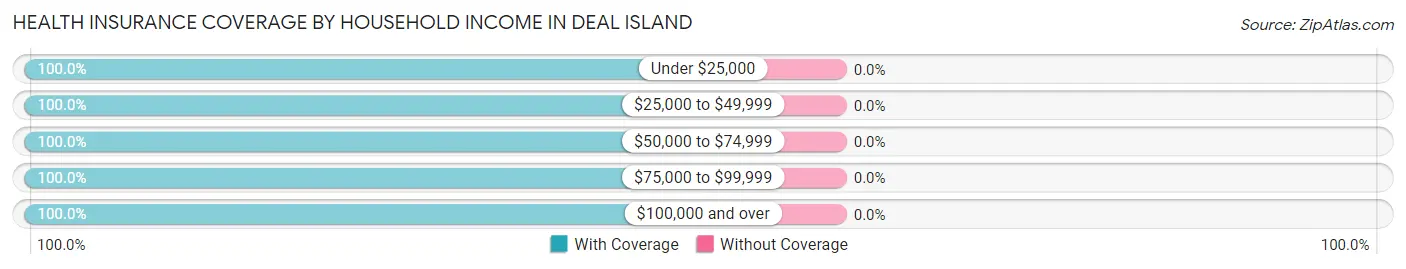
Health Insurance Coverage by Household Income in Deal Island
| Household Income | With Coverage | Without Coverage |
| Under $25,000 | 101 (100.0%) | 0 (0.0%) |
| $25,000 to $49,999 | 72 (100.0%) | 0 (0.0%) |
| $50,000 to $74,999 | 47 (100.0%) | 0 (0.0%) |
| $75,000 to $99,999 | 10 (100.0%) | 0 (0.0%) |
| $100,000 and over | 56 (100.0%) | 0 (0.0%) |
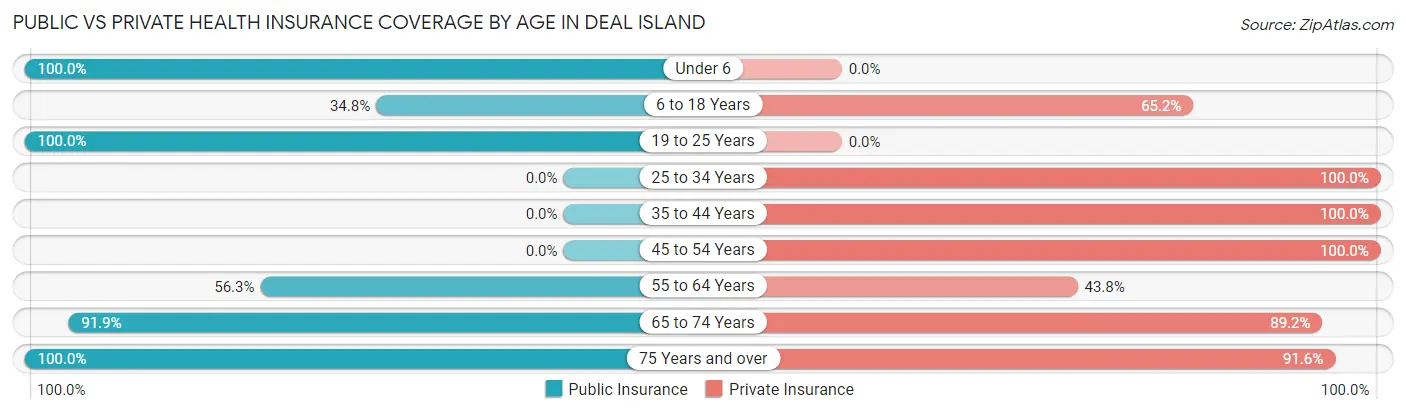
Public vs Private Health Insurance Coverage by Age in Deal Island
| Age Bracket | Public Insurance | Private Insurance |
| Under 6 | 14 (100.0%) | 0 (0.0%) |
| 6 to 18 Years | 8 (34.8%) | 15 (65.2%) |
| 19 to 25 Years | 14 (100.0%) | 0 (0.0%) |
| 25 to 34 Years | 0 (0.0%) | 32 (100.0%) |
| 35 to 44 Years | 0 (0.0%) | 21 (100.0%) |
| 45 to 54 Years | 0 (0.0%) | 5 (100.0%) |
| 55 to 64 Years | 18 (56.2%) | 14 (43.8%) |
| 65 to 74 Years | 68 (91.9%) | 66 (89.2%) |
| 75 Years and over | 71 (100.0%) | 65 (91.5%) |
| Total | 193 (67.5%) | 218 (76.2%) |
Disability Status by Sex by Age in Deal Island
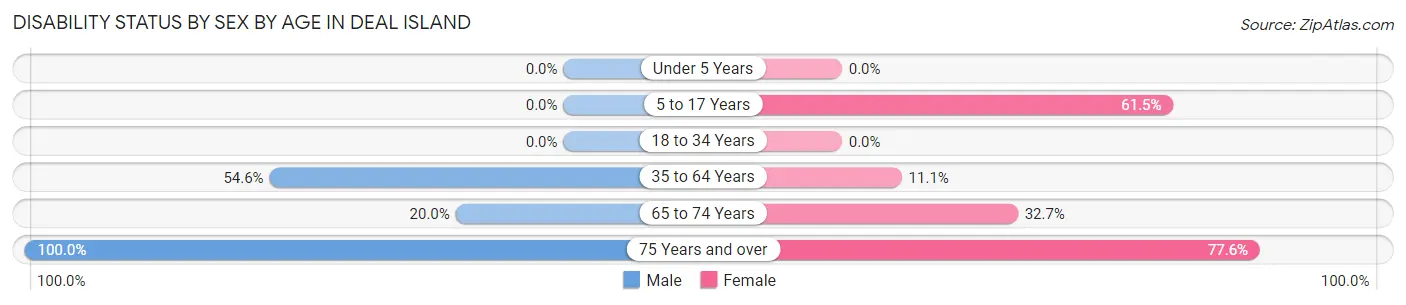
| Age Bracket | Male | Female |
| Under 5 Years | 0 (0.0%) | 0 (0.0%) |
| 5 to 17 Years | 0 (0.0%) | 8 (61.5%) |
| 18 to 34 Years | 0 (0.0%) | 0 (0.0%) |
| 35 to 64 Years | 12 (54.5%) | 4 (11.1%) |
| 65 to 74 Years | 5 (20.0%) | 16 (32.7%) |
| 75 Years and over | 4 (100.0%) | 52 (77.6%) |
Disability Class by Sex by Age in Deal Island
Disability Class: Hearing Difficulty
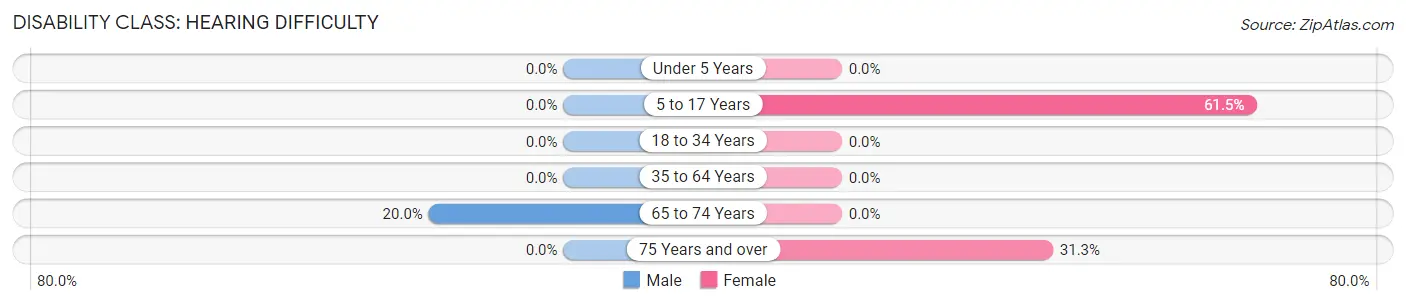
| Age Bracket | Male | Female |
| Under 5 Years | 0 (0.0%) | 0 (0.0%) |
| 5 to 17 Years | 0 (0.0%) | 8 (61.5%) |
| 18 to 34 Years | 0 (0.0%) | 0 (0.0%) |
| 35 to 64 Years | 0 (0.0%) | 0 (0.0%) |
| 65 to 74 Years | 5 (20.0%) | 0 (0.0%) |
| 75 Years and over | 0 (0.0%) | 21 (31.3%) |
Disability Class: Vision Difficulty
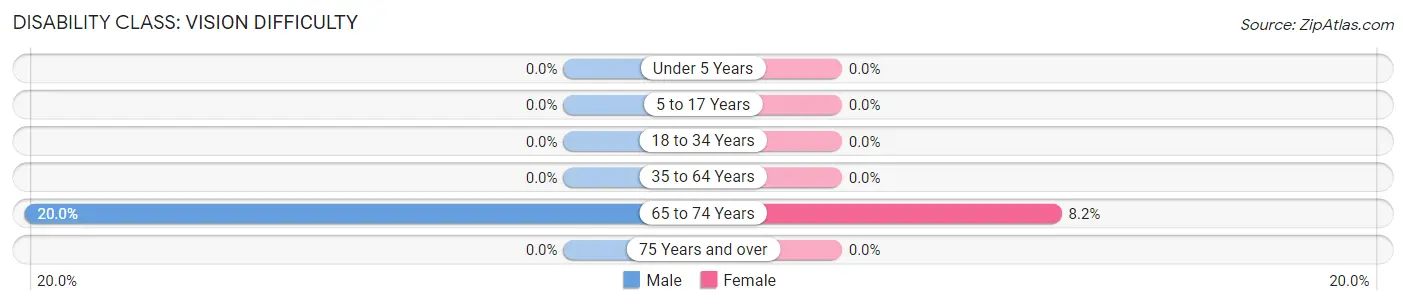
| Age Bracket | Male | Female |
| Under 5 Years | 0 (0.0%) | 0 (0.0%) |
| 5 to 17 Years | 0 (0.0%) | 0 (0.0%) |
| 18 to 34 Years | 0 (0.0%) | 0 (0.0%) |
| 35 to 64 Years | 0 (0.0%) | 0 (0.0%) |
| 65 to 74 Years | 5 (20.0%) | 4 (8.2%) |
| 75 Years and over | 0 (0.0%) | 0 (0.0%) |
Disability Class: Cognitive Difficulty
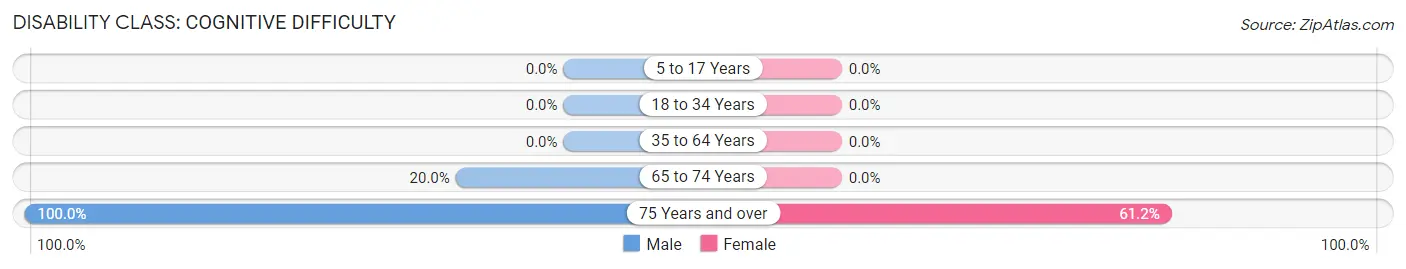
| Age Bracket | Male | Female |
| 5 to 17 Years | 0 (0.0%) | 0 (0.0%) |
| 18 to 34 Years | 0 (0.0%) | 0 (0.0%) |
| 35 to 64 Years | 0 (0.0%) | 0 (0.0%) |
| 65 to 74 Years | 5 (20.0%) | 0 (0.0%) |
| 75 Years and over | 4 (100.0%) | 41 (61.2%) |
Disability Class: Ambulatory Difficulty
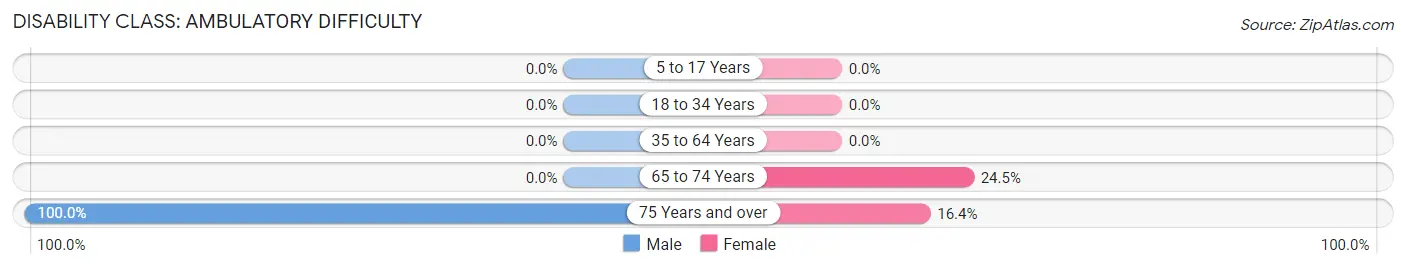
| Age Bracket | Male | Female |
| 5 to 17 Years | 0 (0.0%) | 0 (0.0%) |
| 18 to 34 Years | 0 (0.0%) | 0 (0.0%) |
| 35 to 64 Years | 0 (0.0%) | 0 (0.0%) |
| 65 to 74 Years | 0 (0.0%) | 12 (24.5%) |
| 75 Years and over | 4 (100.0%) | 11 (16.4%) |
Disability Class: Self-Care Difficulty
| Age Bracket | Male | Female |
| 5 to 17 Years | 0 (0.0%) | 0 (0.0%) |
| 18 to 34 Years | 0 (0.0%) | 0 (0.0%) |
| 35 to 64 Years | 0 (0.0%) | 0 (0.0%) |
| 65 to 74 Years | 0 (0.0%) | 0 (0.0%) |
| 75 Years and over | 0 (0.0%) | 0 (0.0%) |
Technology Access in Deal Island
Computing Device Access in Deal Island
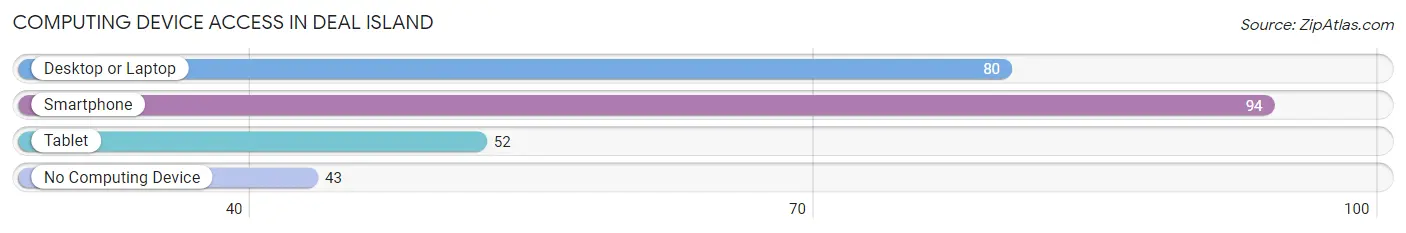
| Device Type | # Households | % Households |
| Desktop or Laptop | 80 | 45.5% |
| Smartphone | 94 | 53.4% |
| Tablet | 52 | 29.5% |
| No Computing Device | 43 | 24.4% |
| Total | 176 | 100.0% |
Internet Access in Deal Island
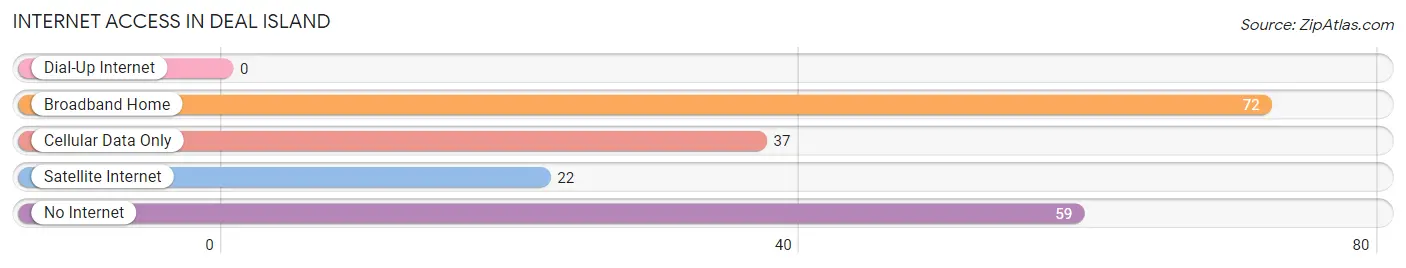
| Internet Type | # Households | % Households |
| Dial-Up Internet | 0 | 0.0% |
| Broadband Home | 72 | 40.9% |
| Cellular Data Only | 37 | 21.0% |
| Satellite Internet | 22 | 12.5% |
| No Internet | 59 | 33.5% |
| Total | 176 | 100.0% |
Deal Island Summary
Island, Maryland is a small unincorporated community located in Dorchester County, Maryland. It is situated on the eastern shore of the Chesapeake Bay, approximately 10 miles south of Cambridge. The island is bordered by the Choptank River to the north and the Nanticoke River to the south. The population of the island was estimated to be around 1,000 people in 2000.
History
The history of Island, Maryland dates back to the early 1600s when the area was first settled by English colonists. The island was originally known as “Island Plantation” and was part of the larger Dorchester County. In 1663, the island was granted to Thomas Taylor and his family. The Taylors were prominent landowners in the area and owned several plantations in the area.
In the late 1700s, the island was purchased by the prominent Dorchester County family, the Tilghmans. The Tilghmans owned the island until the early 1900s when it was sold to the Island Development Company. The company developed the island into a resort community and built a number of vacation homes and a hotel.
In the 1950s, the island was purchased by the Maryland Department of Natural Resources and became part of the Blackwater National Wildlife Refuge. The refuge is now home to a variety of wildlife, including bald eagles, ospreys, and herons.
Geography
Island, Maryland is located on the eastern shore of the Chesapeake Bay. The island is bordered by the Choptank River to the north and the Nanticoke River to the south. The island is approximately 10 miles south of Cambridge and is accessible by boat or ferry.
The island is made up of mostly marshland and is home to a variety of wildlife, including bald eagles, ospreys, and herons. The island is also home to a number of small creeks and streams, as well as a few small ponds.
Economy
The economy of Island, Maryland is largely based on tourism. The island is home to a number of vacation homes and a hotel, as well as a number of restaurants and shops. The island is also home to a number of charter fishing boats, which offer visitors the opportunity to go fishing in the Chesapeake Bay.
In addition to tourism, the island is also home to a number of small businesses, including a marina, a boat repair shop, and a seafood market.
Demographics
The population of Island, Maryland was estimated to be around 1,000 people in 2000. The majority of the population is white (90%), with the remaining 10% being African American. The median household income in the island is around $50,000, and the median age is around 40 years old. The island is home to a number of churches, including the Island United Methodist Church and the Island Baptist Church.
Common Questions
What is Per Capita Income in Deal Island?
Per Capita income in Deal Island is $25,077.
What is the Median Household income in Deal Island?
Median Household Income in Deal Island is $22,429.
What is Inequality or Gini Index in Deal Island?
Inequality or Gini Index in Deal Island is 0.41.
What is the Total Population of Deal Island?
Total Population of Deal Island is 286.
What is the Total Male Population of Deal Island?
Total Male Population of Deal Island is 101.
What is the Total Female Population of Deal Island?
Total Female Population of Deal Island is 185.
What is the Ratio of Males per 100 Females in Deal Island?
There are 54.59 Males per 100 Females in Deal Island.
What is the Ratio of Females per 100 Males in Deal Island?
There are 183.17 Females per 100 Males in Deal Island.
What is the Median Population Age in Deal Island?
Median Population Age in Deal Island is 65.2 Years.
What is the Average Family Size in Deal Island
Average Family Size in Deal Island is 2.6 People.
What is the Average Household Size in Deal Island
Average Household Size in Deal Island is 1.6 People.
How Large is the Labor Force in Deal Island?
There are 84 People in the Labor Forcein in Deal Island.
What is the Percentage of People in the Labor Force in Deal Island?
32.1% of People are in the Labor Force in Deal Island.