Tilghman Island, MD Map & Demographics
Tilghman Island Map
Tilghman Island Overview
$45,101
PER CAPITA INCOME
$75,625
AVG FAMILY INCOME
$55,208
AVG HOUSEHOLD INCOME
0.57
INEQUALITY / GINI INDEX
826
TOTAL POPULATION
459
MALE POPULATION
367
FEMALE POPULATION
125.07
MALES / 100 FEMALES
79.96
FEMALES / 100 MALES
56.7
MEDIAN AGE
2.7
AVG FAMILY SIZE
2.2
AVG HOUSEHOLD SIZE
367
LABOR FORCE [ PEOPLE ]
48.6%
PERCENT IN LABOR FORCE
1.4%
UNEMPLOYMENT RATE
Income in Tilghman Island
Income Overview in Tilghman Island
Per Capita Income in Tilghman Island is $45,101, while median incomes of families and households are $75,625 and $55,208 respectively.
| Characteristic | Number | Measure |
| Per Capita Income | 826 | $45,101 |
| Median Family Income | 248 | $75,625 |
| Mean Family Income | 248 | $132,114 |
| Median Household Income | 375 | $55,208 |
| Mean Household Income | 375 | $98,981 |
| Income Deficit | 248 | $0 |
| Wage / Income Gap (%) | 826 | 0.00% |
| Wage / Income Gap ($) | 826 | 100.00¢ per $1 |
| Gini / Inequality Index | 826 | 0.57 |
Earnings by Sex in Tilghman Island
| Sex | Number | Average Earnings |
| Male | 206 (47.5%) | $0 |
| Female | 228 (52.5%) | $0 |
| Total | 434 (100.0%) | $0 |
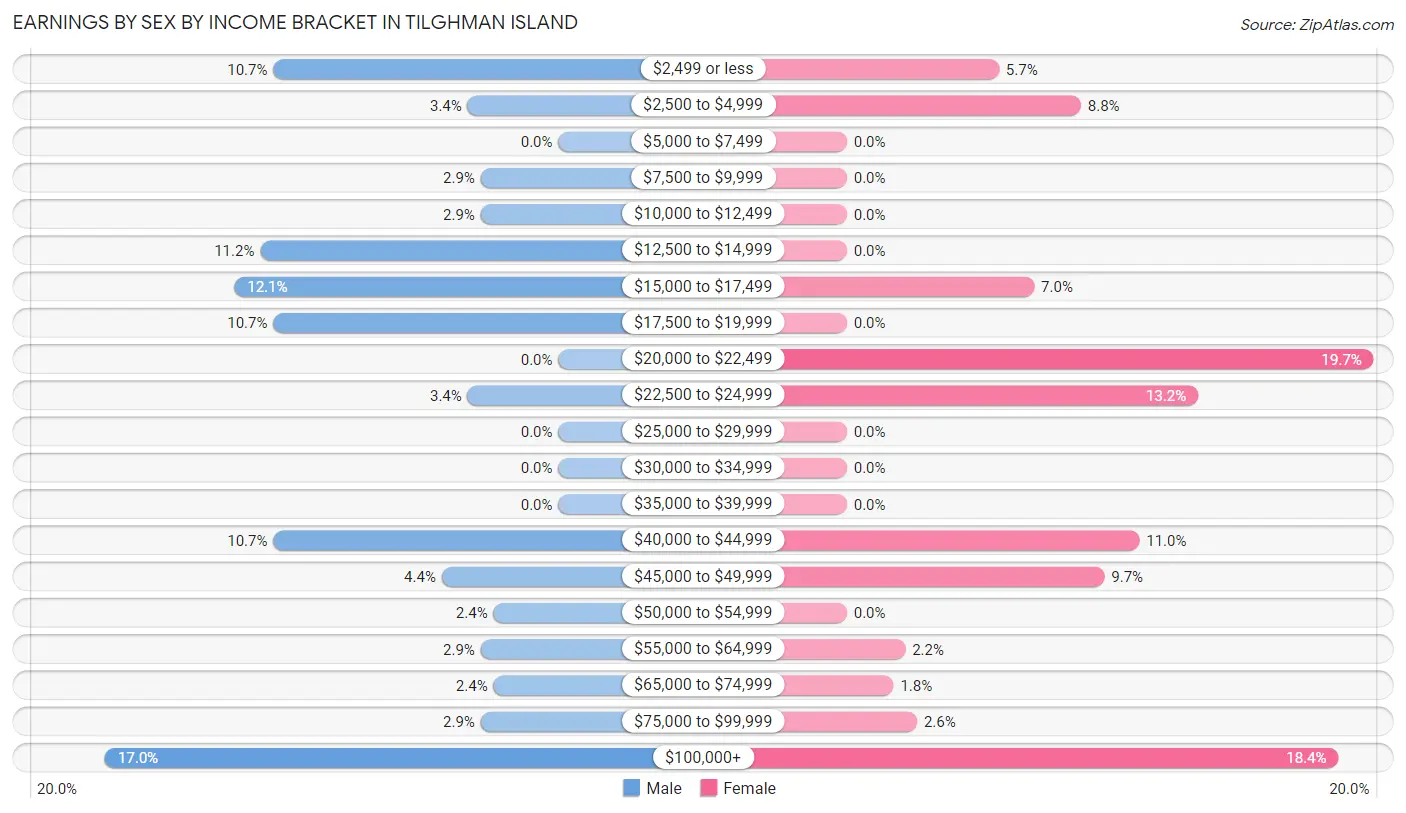
Earnings by Sex by Income Bracket in Tilghman Island
The most common earnings brackets in Tilghman Island are $100,000+ for men (35 | 17.0%) and $20,000 to $22,499 for women (45 | 19.7%).
| Income | Male | Female |
| $2,499 or less | 22 (10.7%) | 13 (5.7%) |
| $2,500 to $4,999 | 7 (3.4%) | 20 (8.8%) |
| $5,000 to $7,499 | 0 (0.0%) | 0 (0.0%) |
| $7,500 to $9,999 | 6 (2.9%) | 0 (0.0%) |
| $10,000 to $12,499 | 6 (2.9%) | 0 (0.0%) |
| $12,500 to $14,999 | 23 (11.2%) | 0 (0.0%) |
| $15,000 to $17,499 | 25 (12.1%) | 16 (7.0%) |
| $17,500 to $19,999 | 22 (10.7%) | 0 (0.0%) |
| $20,000 to $22,499 | 0 (0.0%) | 45 (19.7%) |
| $22,500 to $24,999 | 7 (3.4%) | 30 (13.2%) |
| $25,000 to $29,999 | 0 (0.0%) | 0 (0.0%) |
| $30,000 to $34,999 | 0 (0.0%) | 0 (0.0%) |
| $35,000 to $39,999 | 0 (0.0%) | 0 (0.0%) |
| $40,000 to $44,999 | 22 (10.7%) | 25 (11.0%) |
| $45,000 to $49,999 | 9 (4.4%) | 22 (9.7%) |
| $50,000 to $54,999 | 5 (2.4%) | 0 (0.0%) |
| $55,000 to $64,999 | 6 (2.9%) | 5 (2.2%) |
| $65,000 to $74,999 | 5 (2.4%) | 4 (1.8%) |
| $75,000 to $99,999 | 6 (2.9%) | 6 (2.6%) |
| $100,000+ | 35 (17.0%) | 42 (18.4%) |
| Total | 206 (100.0%) | 228 (100.0%) |
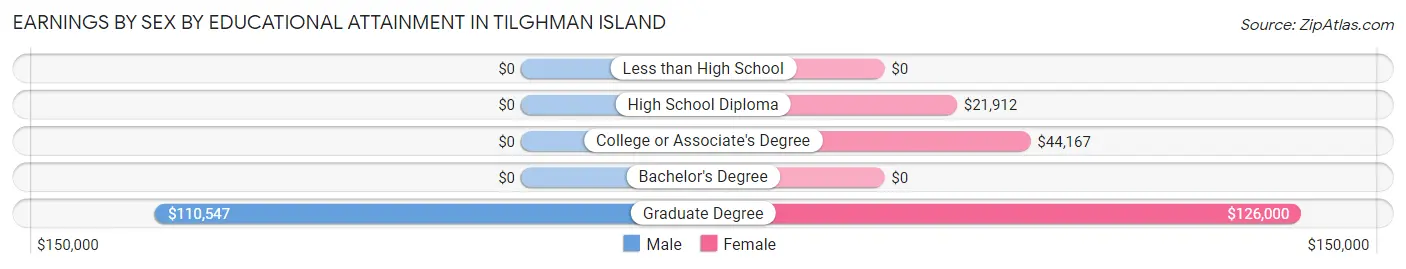
Earnings by Sex by Educational Attainment in Tilghman Island
| Educational Attainment | Male Income | Female Income |
| Less than High School | - | - |
| High School Diploma | - | - |
| College or Associate's Degree | - | - |
| Bachelor's Degree | - | - |
| Graduate Degree | $110,547 | $126,000 |
| Total | - | - |
Family Income in Tilghman Island
Family Income Brackets in Tilghman Island
According to the Tilghman Island family income data, there are 51 families falling into the $200,000+ income range, which is the most common income bracket and makes up 20.6% of all families.
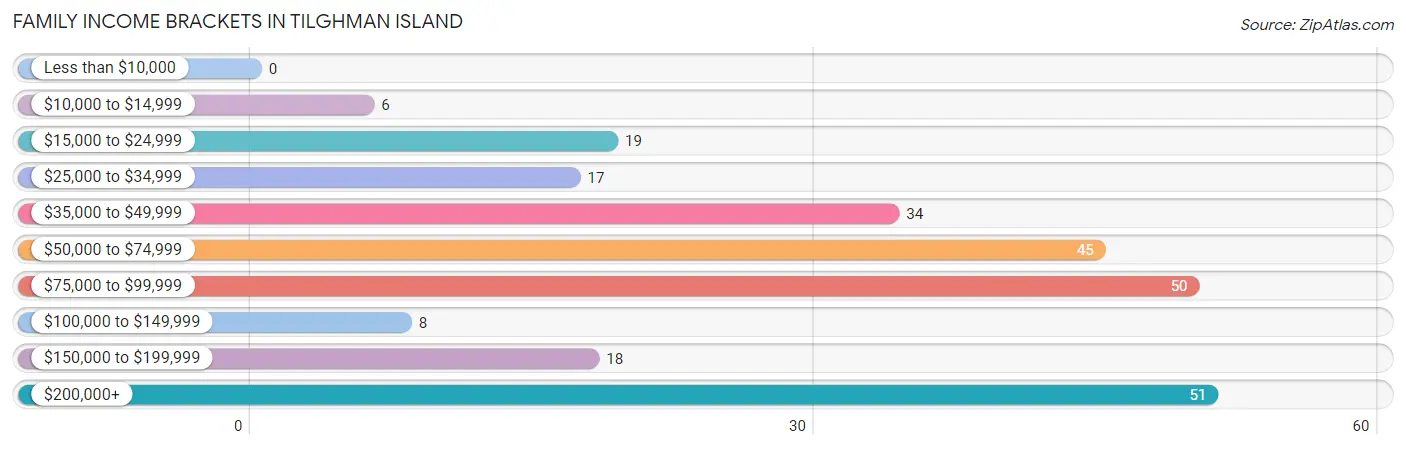
| Income Bracket | # Families | % Families |
| Less than $10,000 | 0 | 0.0% |
| $10,000 to $14,999 | 6 | 2.4% |
| $15,000 to $24,999 | 19 | 7.7% |
| $25,000 to $34,999 | 17 | 6.9% |
| $35,000 to $49,999 | 34 | 13.7% |
| $50,000 to $74,999 | 45 | 18.1% |
| $75,000 to $99,999 | 50 | 20.2% |
| $100,000 to $149,999 | 8 | 3.2% |
| $150,000 to $199,999 | 18 | 7.3% |
| $200,000+ | 51 | 20.6% |
Family Income by Famaliy Size in Tilghman Island
2-person families (138 | 55.6%) account for the highest median family income in Tilghman Island with $59,643 per family, while 2-person families (138 | 55.6%) have the highest median income of $29,822 per family member.
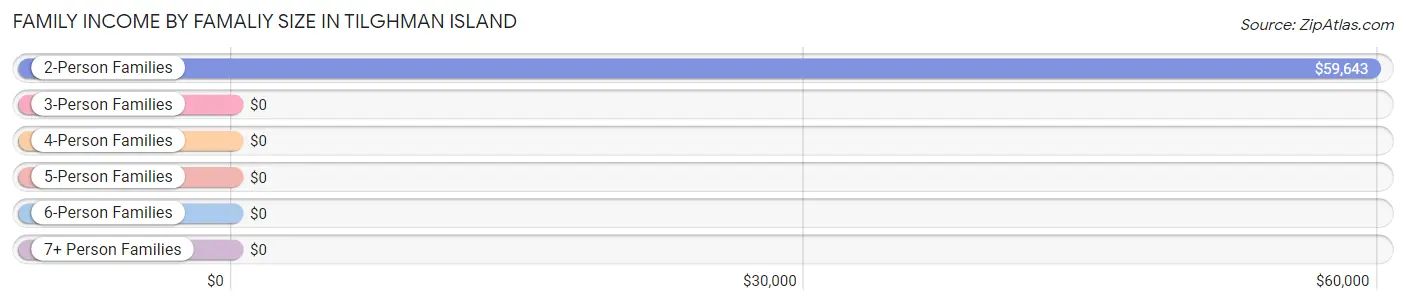
| Income Bracket | # Families | Median Income |
| 2-Person Families | 138 (55.6%) | $59,643 |
| 3-Person Families | 87 (35.1%) | $0 |
| 4-Person Families | 20 (8.1%) | $0 |
| 5-Person Families | 0 (0.0%) | $0 |
| 6-Person Families | 0 (0.0%) | $0 |
| 7+ Person Families | 3 (1.2%) | $0 |
| Total | 248 (100.0%) | $75,625 |
Family Income by Number of Earners in Tilghman Island
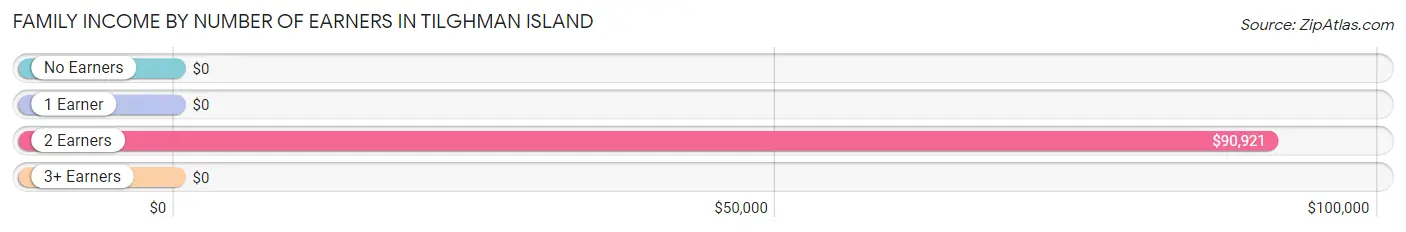
| Number of Earners | # Families | Median Income |
| No Earners | 70 (28.2%) | $0 |
| 1 Earner | 44 (17.7%) | $0 |
| 2 Earners | 118 (47.6%) | $90,921 |
| 3+ Earners | 16 (6.5%) | $0 |
| Total | 248 (100.0%) | $75,625 |
Household Income in Tilghman Island
Household Income Brackets in Tilghman Island
With 68 households falling in the category, the $50,000 to $74,999 income range is the most frequent in Tilghman Island, accounting for 18.1% of all households. In contrast, only 11 households (2.9%) fall into the $10,000 to $14,999 income bracket, making it the least populous group.
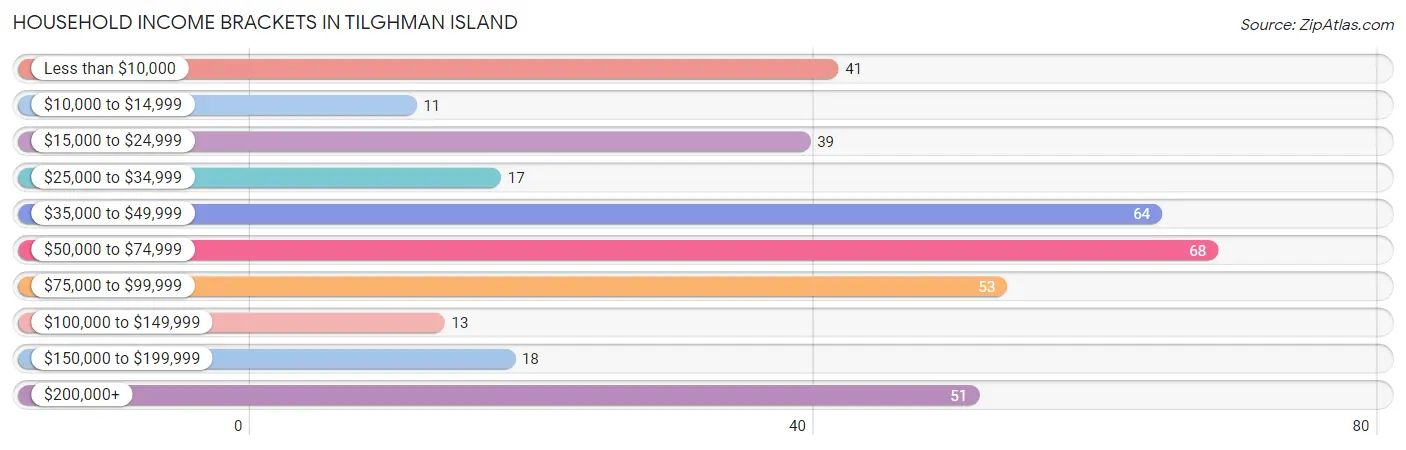
| Income Bracket | # Households | % Households |
| Less than $10,000 | 41 | 10.9% |
| $10,000 to $14,999 | 11 | 2.9% |
| $15,000 to $24,999 | 39 | 10.4% |
| $25,000 to $34,999 | 17 | 4.5% |
| $35,000 to $49,999 | 64 | 17.1% |
| $50,000 to $74,999 | 68 | 18.1% |
| $75,000 to $99,999 | 53 | 14.1% |
| $100,000 to $149,999 | 13 | 3.5% |
| $150,000 to $199,999 | 18 | 4.8% |
| $200,000+ | 51 | 13.6% |
Household Income by Householder Age in Tilghman Island
The median household income in Tilghman Island is $55,208, with the highest median household income of $72,750 found in the 45 to 64 years age bracket for the primary householder. A total of 193 households (51.5%) fall into this category.
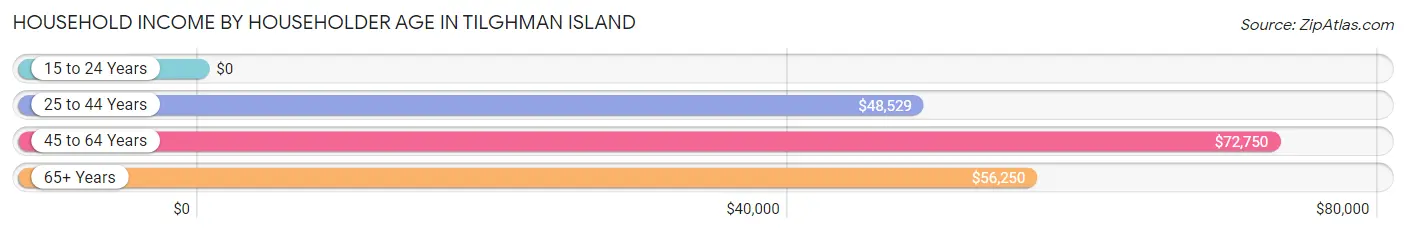
| Income Bracket | # Households | Median Income |
| 15 to 24 Years | 0 (0.0%) | $0 |
| 25 to 44 Years | 40 (10.7%) | $48,529 |
| 45 to 64 Years | 193 (51.5%) | $72,750 |
| 65+ Years | 142 (37.9%) | $56,250 |
| Total | 375 (100.0%) | $55,208 |
Poverty in Tilghman Island
Income Below Poverty by Sex and Age in Tilghman Island
With 10.2% poverty level for males and 5.7% for females among the residents of Tilghman Island, under 5 year old males and 25 to 34 year old females are the most vulnerable to poverty, with 5 males (100.0%) and 6 females (23.1%) in their respective age groups living below the poverty level.
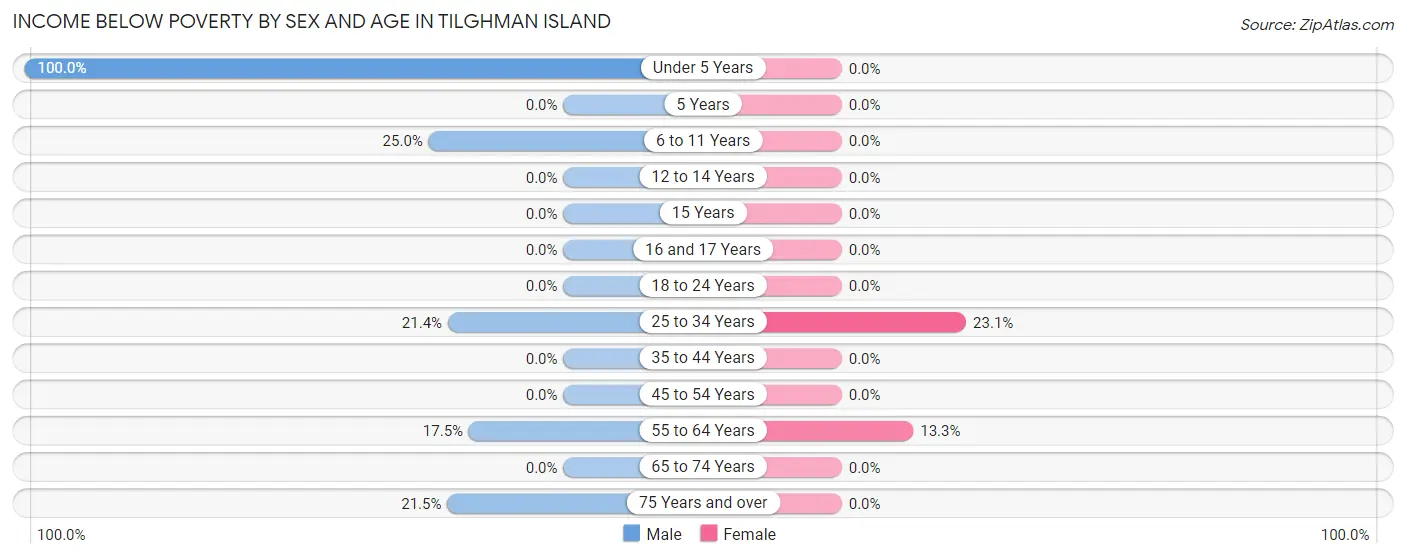
| Age Bracket | Male | Female |
| Under 5 Years | 5 (100.0%) | 0 (0.0%) |
| 5 Years | 0 (0.0%) | 0 (0.0%) |
| 6 to 11 Years | 5 (25.0%) | 0 (0.0%) |
| 12 to 14 Years | 0 (0.0%) | 0 (0.0%) |
| 15 Years | 0 (0.0%) | 0 (0.0%) |
| 16 and 17 Years | 0 (0.0%) | 0 (0.0%) |
| 18 to 24 Years | 0 (0.0%) | 0 (0.0%) |
| 25 to 34 Years | 6 (21.4%) | 6 (23.1%) |
| 35 to 44 Years | 0 (0.0%) | 0 (0.0%) |
| 45 to 54 Years | 0 (0.0%) | 0 (0.0%) |
| 55 to 64 Years | 17 (17.5%) | 15 (13.3%) |
| 65 to 74 Years | 0 (0.0%) | 0 (0.0%) |
| 75 Years and over | 14 (21.5%) | 0 (0.0%) |
| Total | 47 (10.2%) | 21 (5.7%) |
Income Above Poverty by Sex and Age in Tilghman Island
According to the poverty statistics in Tilghman Island, males aged 12 to 14 years and females aged under 5 years are the age groups that are most secure financially, with 100.0% of males and 100.0% of females in these age groups living above the poverty line.
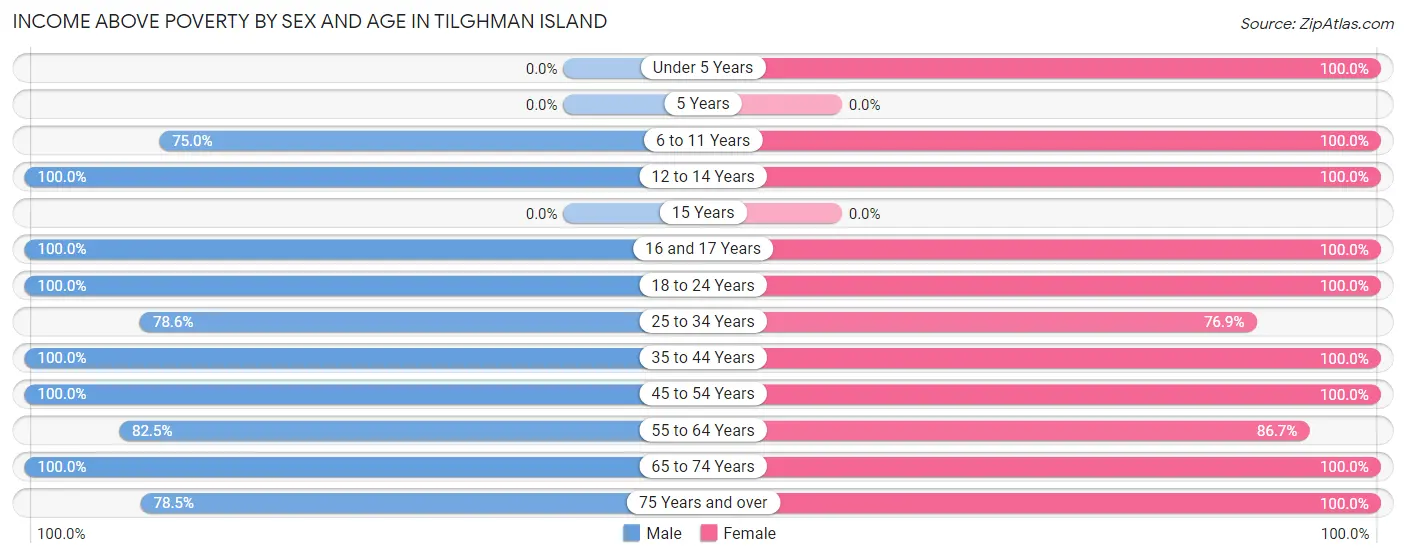
| Age Bracket | Male | Female |
| Under 5 Years | 0 (0.0%) | 6 (100.0%) |
| 5 Years | 0 (0.0%) | 0 (0.0%) |
| 6 to 11 Years | 15 (75.0%) | 10 (100.0%) |
| 12 to 14 Years | 5 (100.0%) | 25 (100.0%) |
| 15 Years | 0 (0.0%) | 0 (0.0%) |
| 16 and 17 Years | 46 (100.0%) | 5 (100.0%) |
| 18 to 24 Years | 29 (100.0%) | 28 (100.0%) |
| 25 to 34 Years | 22 (78.6%) | 20 (76.9%) |
| 35 to 44 Years | 33 (100.0%) | 20 (100.0%) |
| 45 to 54 Years | 46 (100.0%) | 62 (100.0%) |
| 55 to 64 Years | 80 (82.5%) | 98 (86.7%) |
| 65 to 74 Years | 85 (100.0%) | 67 (100.0%) |
| 75 Years and over | 51 (78.5%) | 5 (100.0%) |
| Total | 412 (89.8%) | 346 (94.3%) |
Income Below Poverty Among Married-Couple Families in Tilghman Island
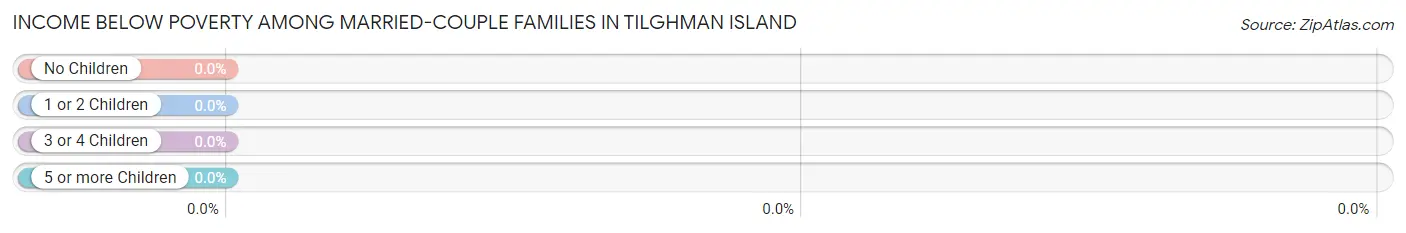
| Children | Above Poverty | Below Poverty |
| No Children | 160 (100.0%) | 0 (0.0%) |
| 1 or 2 Children | 39 (100.0%) | 0 (0.0%) |
| 3 or 4 Children | 0 (0.0%) | 0 (0.0%) |
| 5 or more Children | 3 (100.0%) | 0 (0.0%) |
| Total | 202 (100.0%) | 0 (0.0%) |
Income Below Poverty Among Single-Parent Households in Tilghman Island
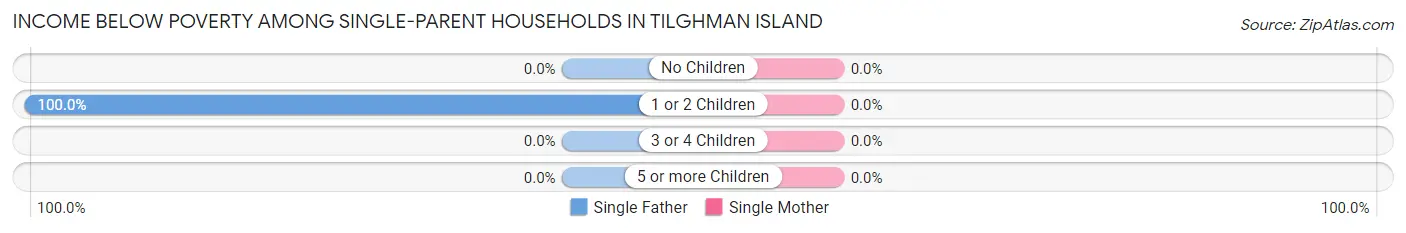
| Children | Single Father | Single Mother |
| No Children | 0 (0.0%) | 0 (0.0%) |
| 1 or 2 Children | 6 (100.0%) | 0 (0.0%) |
| 3 or 4 Children | 0 (0.0%) | 0 (0.0%) |
| 5 or more Children | 0 (0.0%) | 0 (0.0%) |
| Total | 6 (24.0%) | 0 (0.0%) |
Income Below Poverty Among Married-Couple vs Single-Parent Households in Tilghman Island
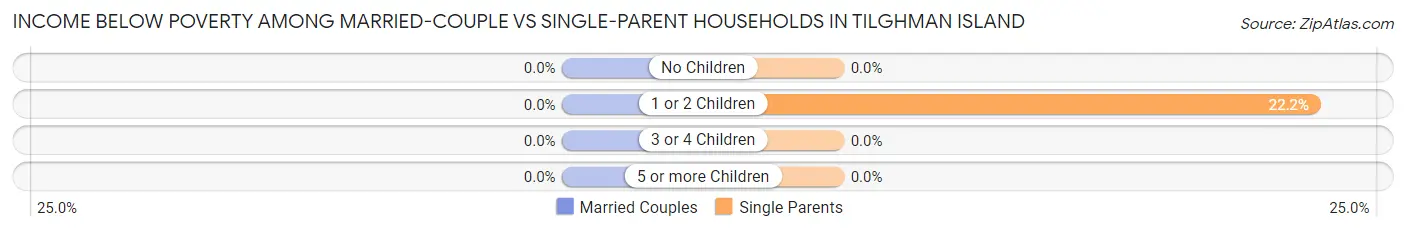
| Children | Married-Couple Families | Single-Parent Households |
| No Children | 0 (0.0%) | 0 (0.0%) |
| 1 or 2 Children | 0 (0.0%) | 6 (22.2%) |
| 3 or 4 Children | 0 (0.0%) | 0 (0.0%) |
| 5 or more Children | 0 (0.0%) | 0 (0.0%) |
| Total | 0 (0.0%) | 6 (13.0%) |
Race in Tilghman Island
The most populous races in Tilghman Island are White / Caucasian (821 | 99.4%), Hispanic or Latino (28 | 3.4%), and Asian (5 | 0.6%).
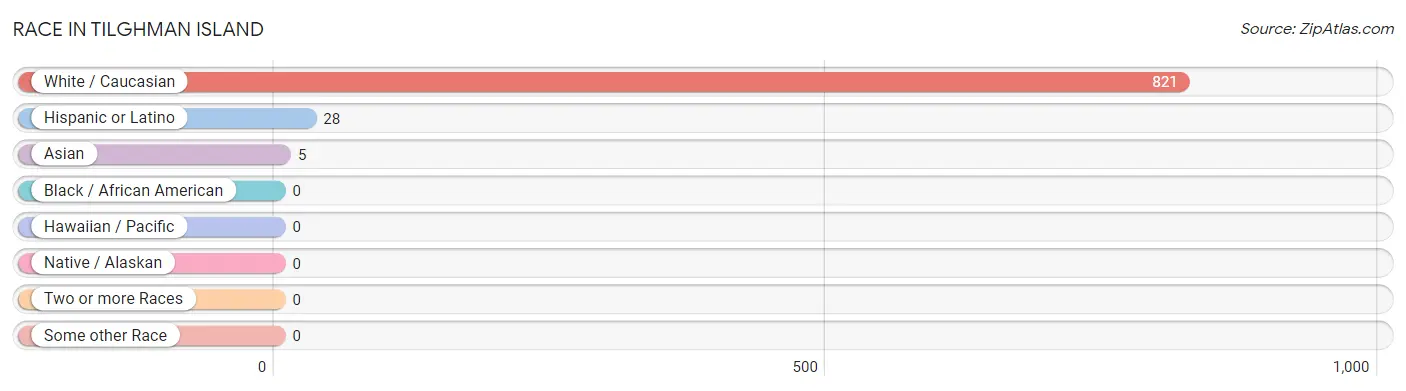
| Race | # Population | % Population |
| Asian | 5 | 0.6% |
| Black / African American | 0 | 0.0% |
| Hawaiian / Pacific | 0 | 0.0% |
| Hispanic or Latino | 28 | 3.4% |
| Native / Alaskan | 0 | 0.0% |
| White / Caucasian | 821 | 99.4% |
| Two or more Races | 0 | 0.0% |
| Some other Race | 0 | 0.0% |
| Total | 826 | 100.0% |
Ancestry in Tilghman Island
The most populous ancestries reported in Tilghman Island are English (316 | 38.3%), German (184 | 22.3%), Irish (128 | 15.5%), Italian (67 | 8.1%), and Scottish (66 | 8.0%), together accounting for 92.1% of all Tilghman Island residents.
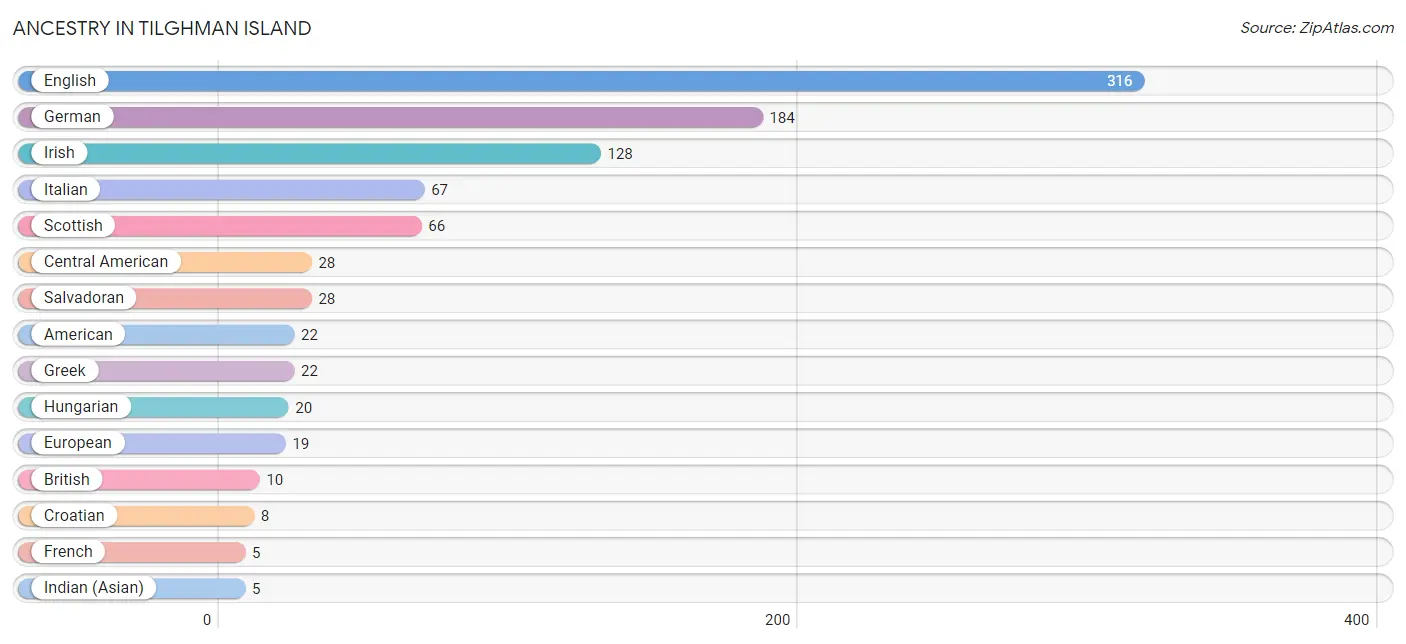
| Ancestry | # Population | % Population |
| American | 22 | 2.7% |
| British | 10 | 1.2% |
| Central American | 28 | 3.4% |
| Croatian | 8 | 1.0% |
| English | 316 | 38.3% |
| European | 19 | 2.3% |
| French | 5 | 0.6% |
| German | 184 | 22.3% |
| Greek | 22 | 2.7% |
| Hungarian | 20 | 2.4% |
| Indian (Asian) | 5 | 0.6% |
| Irish | 128 | 15.5% |
| Italian | 67 | 8.1% |
| Salvadoran | 28 | 3.4% |
| Scottish | 66 | 8.0% |
| Sri Lankan | 5 | 0.6% |
| Swedish | 4 | 0.5% | View All 17 Rows |
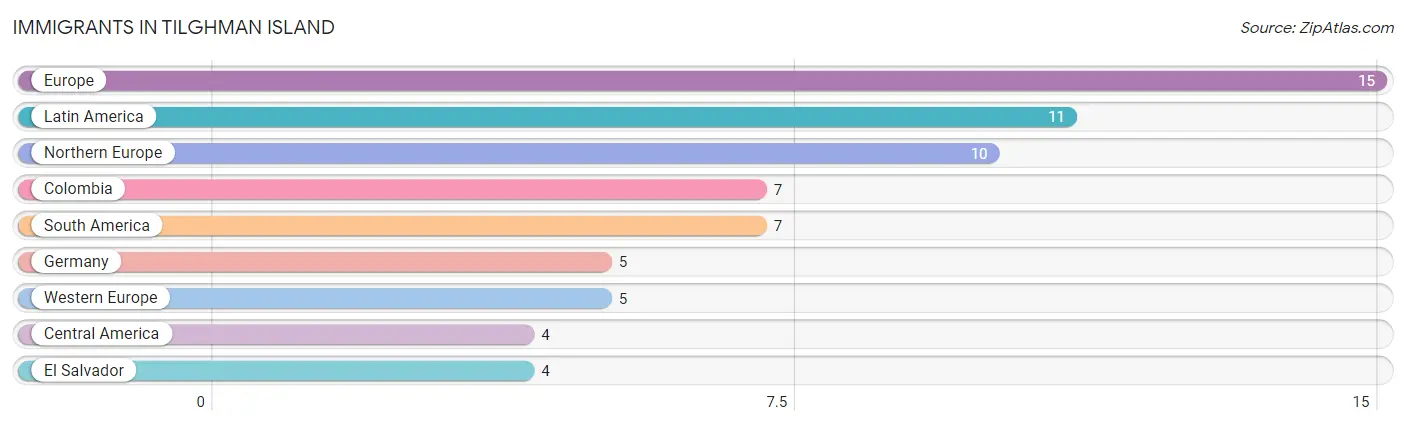
Immigrants in Tilghman Island
The most numerous immigrant groups reported in Tilghman Island came from Europe (15 | 1.8%), Latin America (11 | 1.3%), Northern Europe (10 | 1.2%), Colombia (7 | 0.9%), and South America (7 | 0.9%), together accounting for 6.1% of all Tilghman Island residents.
| Immigration Origin | # Population | % Population |
| Central America | 4 | 0.5% |
| Colombia | 7 | 0.9% |
| El Salvador | 4 | 0.5% |
| Europe | 15 | 1.8% |
| Germany | 5 | 0.6% |
| Latin America | 11 | 1.3% |
| Northern Europe | 10 | 1.2% |
| South America | 7 | 0.9% |
| Western Europe | 5 | 0.6% | View All 9 Rows |
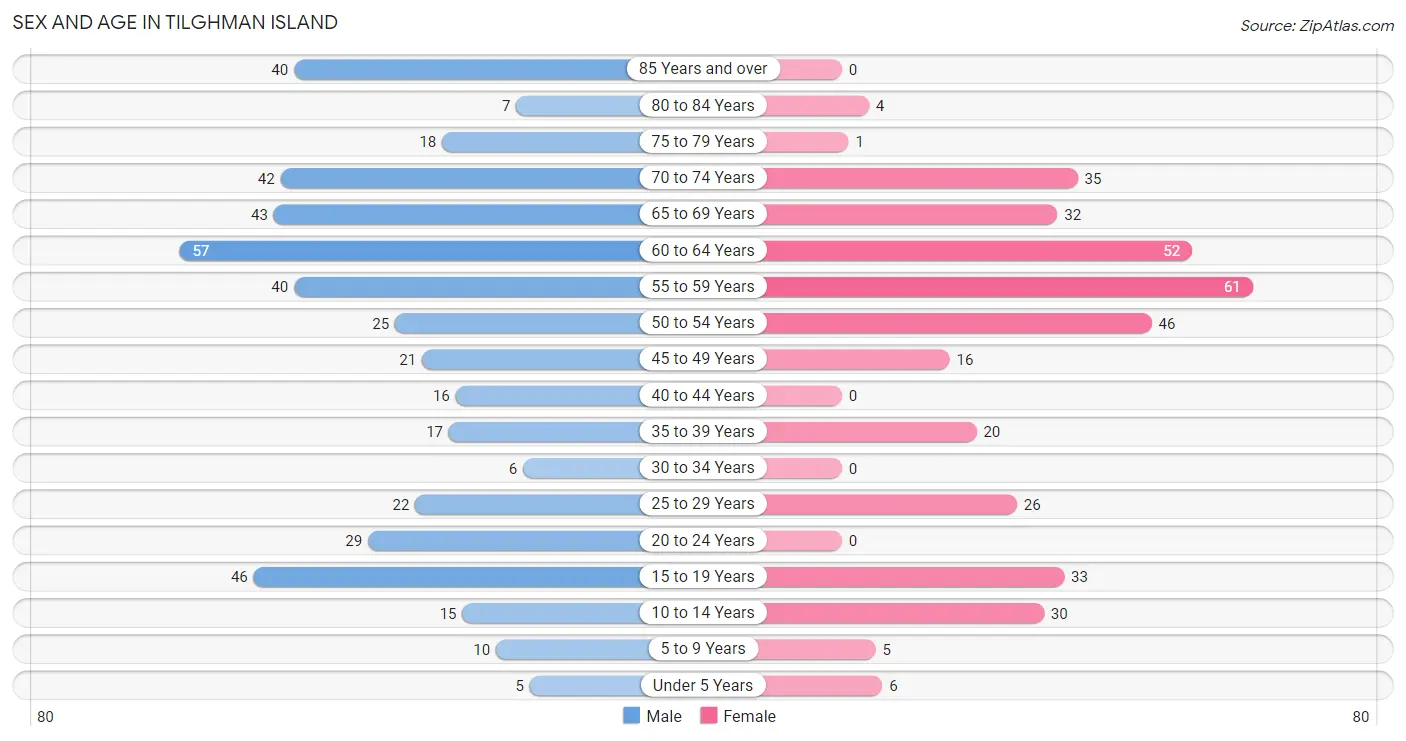
Sex and Age in Tilghman Island
Sex and Age in Tilghman Island
The most populous age groups in Tilghman Island are 60 to 64 Years (57 | 12.4%) for men and 55 to 59 Years (61 | 16.6%) for women.
| Age Bracket | Male | Female |
| Under 5 Years | 5 (1.1%) | 6 (1.6%) |
| 5 to 9 Years | 10 (2.2%) | 5 (1.4%) |
| 10 to 14 Years | 15 (3.3%) | 30 (8.2%) |
| 15 to 19 Years | 46 (10.0%) | 33 (9.0%) |
| 20 to 24 Years | 29 (6.3%) | 0 (0.0%) |
| 25 to 29 Years | 22 (4.8%) | 26 (7.1%) |
| 30 to 34 Years | 6 (1.3%) | 0 (0.0%) |
| 35 to 39 Years | 17 (3.7%) | 20 (5.4%) |
| 40 to 44 Years | 16 (3.5%) | 0 (0.0%) |
| 45 to 49 Years | 21 (4.6%) | 16 (4.4%) |
| 50 to 54 Years | 25 (5.4%) | 46 (12.5%) |
| 55 to 59 Years | 40 (8.7%) | 61 (16.6%) |
| 60 to 64 Years | 57 (12.4%) | 52 (14.2%) |
| 65 to 69 Years | 43 (9.4%) | 32 (8.7%) |
| 70 to 74 Years | 42 (9.1%) | 35 (9.5%) |
| 75 to 79 Years | 18 (3.9%) | 1 (0.3%) |
| 80 to 84 Years | 7 (1.5%) | 4 (1.1%) |
| 85 Years and over | 40 (8.7%) | 0 (0.0%) |
| Total | 459 (100.0%) | 367 (100.0%) |
Families and Households in Tilghman Island
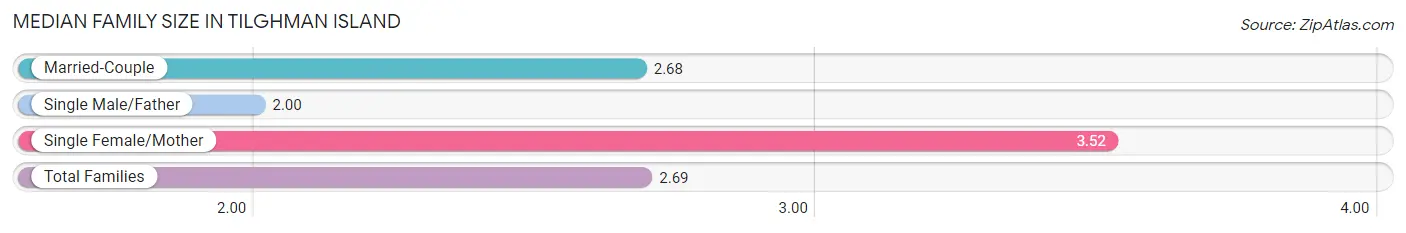
Median Family Size in Tilghman Island
The median family size in Tilghman Island is 2.69 persons per family, with single female/mother families (21 | 8.5%) accounting for the largest median family size of 3.52 persons per family. On the other hand, single male/father families (25 | 10.1%) represent the smallest median family size with 2.00 persons per family.
| Family Type | # Families | Family Size |
| Married-Couple | 202 (81.5%) | 2.68 |
| Single Male/Father | 25 (10.1%) | 2.00 |
| Single Female/Mother | 21 (8.5%) | 3.52 |
| Total Families | 248 (100.0%) | 2.69 |
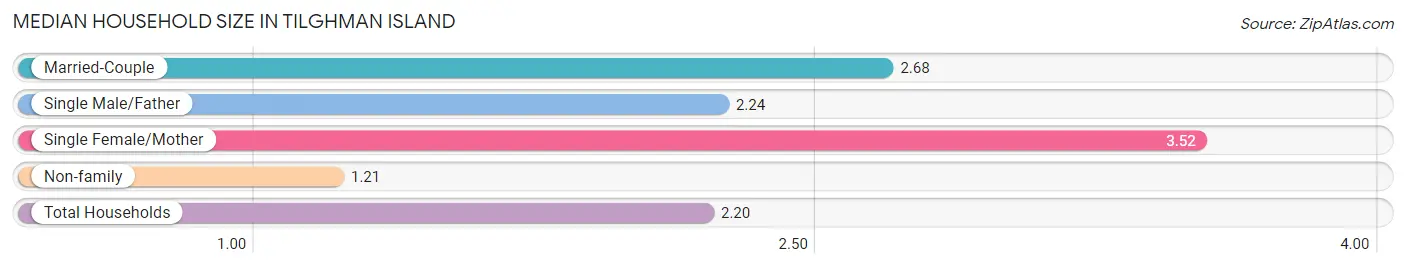
Median Household Size in Tilghman Island
The median household size in Tilghman Island is 2.20 persons per household, with single female/mother households (21 | 5.6%) accounting for the largest median household size of 3.52 persons per household. non-family households (127 | 33.9%) represent the smallest median household size with 1.21 persons per household.
| Household Type | # Households | Household Size |
| Married-Couple | 202 (53.9%) | 2.68 |
| Single Male/Father | 25 (6.7%) | 2.24 |
| Single Female/Mother | 21 (5.6%) | 3.52 |
| Non-family | 127 (33.9%) | 1.21 |
| Total Households | 375 (100.0%) | 2.20 |
Household Size by Marriage Status in Tilghman Island
Out of a total of 375 households in Tilghman Island, 248 (66.1%) are family households, while 127 (33.9%) are nonfamily households. The most numerous type of family households are 2-person households, comprising 138, and the most common type of nonfamily households are 1-person households, comprising 105.
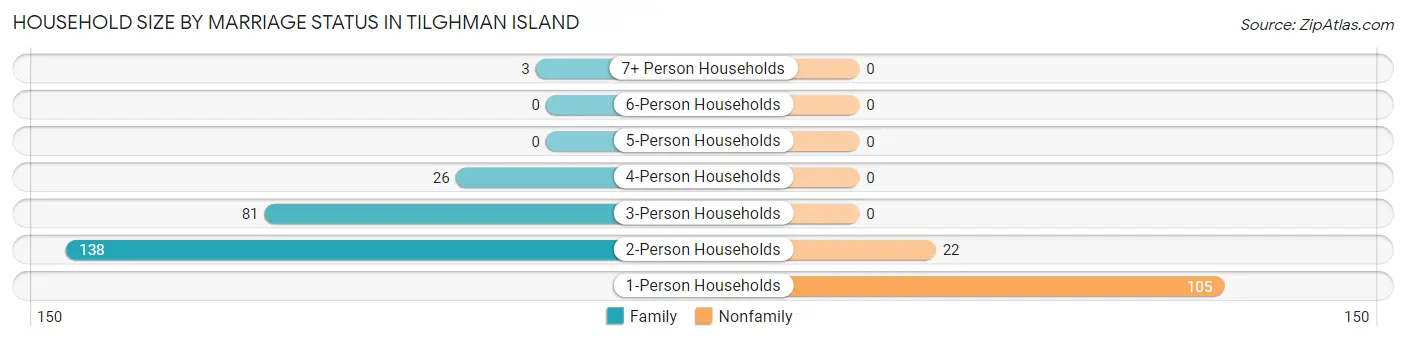
| Household Size | Family Households | Nonfamily Households |
| 1-Person Households | - | 105 (28.0%) |
| 2-Person Households | 138 (36.8%) | 22 (5.9%) |
| 3-Person Households | 81 (21.6%) | 0 (0.0%) |
| 4-Person Households | 26 (6.9%) | 0 (0.0%) |
| 5-Person Households | 0 (0.0%) | 0 (0.0%) |
| 6-Person Households | 0 (0.0%) | 0 (0.0%) |
| 7+ Person Households | 3 (0.8%) | 0 (0.0%) |
| Total | 248 (66.1%) | 127 (33.9%) |
Female Fertility in Tilghman Island
Fertility by Age in Tilghman Island
| Age Bracket | Women with Births | Births / 1,000 Women |
| 15 to 19 years | 0 (0.0%) | 0.0 |
| 20 to 34 years | 0 (0.0%) | 0.0 |
| 35 to 50 years | 0 (0.0%) | 0.0 |
| Total | 0 (0.0%) | 0.0 |
Fertility by Age by Marriage Status in Tilghman Island
| Age Bracket | Married | Unmarried |
| 15 to 19 years | 0 (0.0%) | 0 (0.0%) |
| 20 to 34 years | 0 (0.0%) | 0 (0.0%) |
| 35 to 50 years | 0 (0.0%) | 0 (0.0%) |
| Total | 0 (0.0%) | 0 (0.0%) |
Fertility by Education in Tilghman Island
| Educational Attainment | Women with Births | Births / 1,000 Women |
| Less than High School | 0 (0.0%) | 0.0 |
| High School Diploma | 0 (0.0%) | 0.0 |
| College or Associate's Degree | 0 (0.0%) | 0.0 |
| Bachelor's Degree | 0 (0.0%) | 0.0 |
| Graduate Degree | 0 (0.0%) | 0.0 |
| Total | 0 (0.0%) | 0.0 |
Fertility by Education by Marriage Status in Tilghman Island
| Educational Attainment | Married | Unmarried |
| Less than High School | 0 (0.0%) | 0 (0.0%) |
| High School Diploma | 0 (0.0%) | 0 (0.0%) |
| College or Associate's Degree | 0 (0.0%) | 0 (0.0%) |
| Bachelor's Degree | 0 (0.0%) | 0 (0.0%) |
| Graduate Degree | 0 (0.0%) | 0 (0.0%) |
| Total | 0 (0.0%) | 0 (0.0%) |
Employment Characteristics in Tilghman Island
Employment by Class of Employer in Tilghman Island
Among the 356 employed individuals in Tilghman Island, private company employees (180 | 50.6%), self-employed (not incorporated) (70 | 19.7%), and self-employed (incorporated) (63 | 17.7%) make up the most common classes of employment.
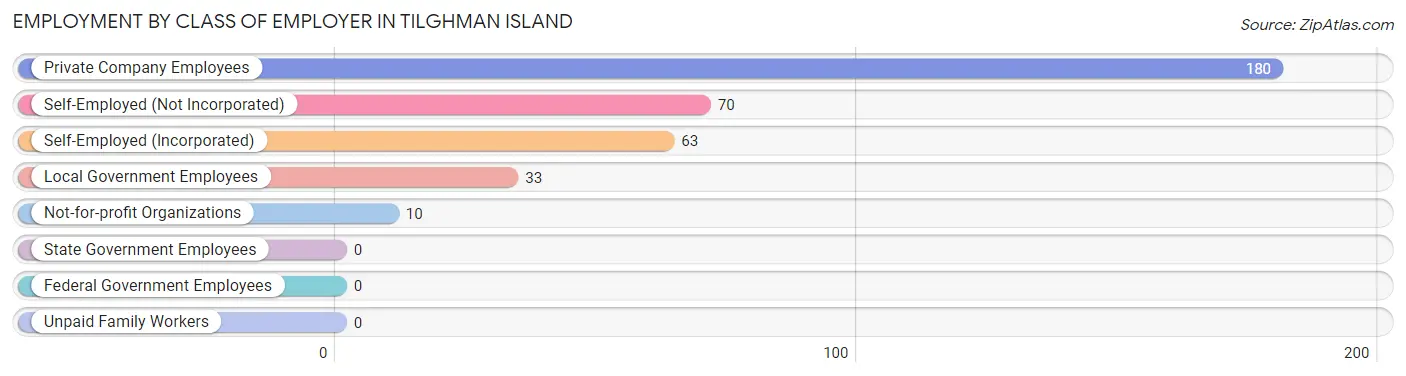
| Employer Class | # Employees | % Employees |
| Private Company Employees | 180 | 50.6% |
| Self-Employed (Incorporated) | 63 | 17.7% |
| Self-Employed (Not Incorporated) | 70 | 19.7% |
| Not-for-profit Organizations | 10 | 2.8% |
| Local Government Employees | 33 | 9.3% |
| State Government Employees | 0 | 0.0% |
| Federal Government Employees | 0 | 0.0% |
| Unpaid Family Workers | 0 | 0.0% |
| Total | 356 | 100.0% |
Employment Status by Age in Tilghman Island
According to the labor force statistics for Tilghman Island, out of the total population over 16 years of age (755), 48.6% or 367 individuals are in the labor force, with 1.4% or 5 of them unemployed. The age group with the highest labor force participation rate is 30 to 34 years, with 100.0% or 6 individuals in the labor force. Within the labor force, the 60 to 64 years age range has the highest percentage of unemployed individuals, with 10.9% or 5 of them being unemployed.
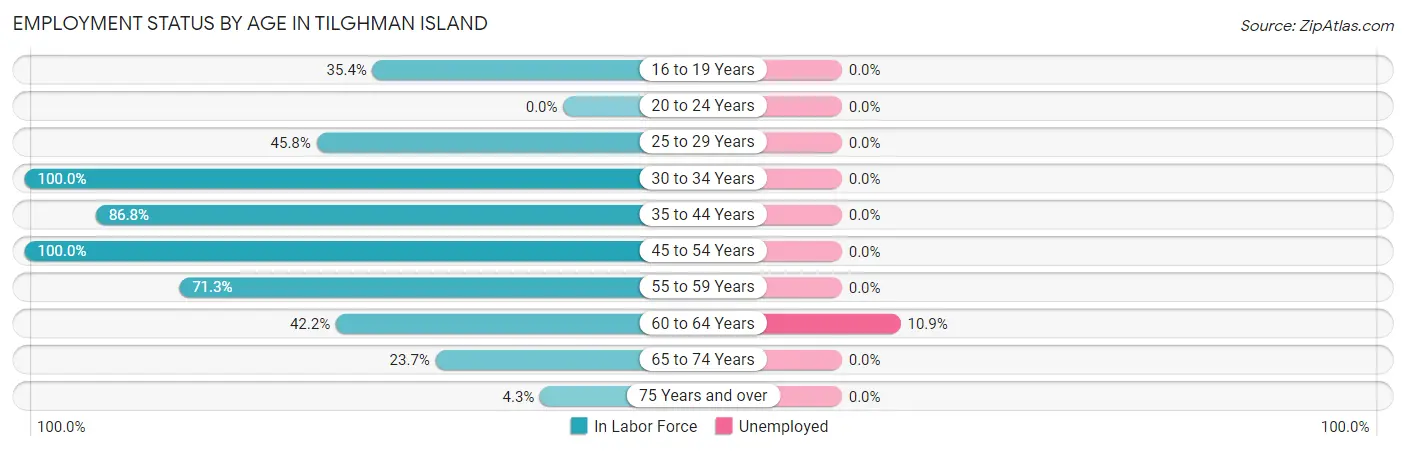
| Age Bracket | In Labor Force | Unemployed |
| 16 to 19 Years | 28 (35.4%) | 0 (0.0%) |
| 20 to 24 Years | 0 (0.0%) | 0 (0.0%) |
| 25 to 29 Years | 22 (45.8%) | 0 (0.0%) |
| 30 to 34 Years | 6 (100.0%) | 0 (0.0%) |
| 35 to 44 Years | 46 (86.8%) | 0 (0.0%) |
| 45 to 54 Years | 108 (100.0%) | 0 (0.0%) |
| 55 to 59 Years | 72 (71.3%) | 0 (0.0%) |
| 60 to 64 Years | 46 (42.2%) | 5 (10.9%) |
| 65 to 74 Years | 36 (23.7%) | 0 (0.0%) |
| 75 Years and over | 3 (4.3%) | 0 (0.0%) |
| Total | 367 (48.6%) | 5 (1.4%) |
Employment Status by Educational Attainment in Tilghman Island
According to labor force statistics for Tilghman Island, 70.6% of individuals (300) out of the total population between 25 and 64 years of age (425) are in the labor force, with 1.7% or 5 of them being unemployed. The group with the highest labor force participation rate are those with the educational attainment of college / associate degree, with 84.4% or 119 individuals in the labor force. Within the labor force, individuals with college / associate degree education have the highest percentage of unemployment, with 4.2% or 5 of them being unemployed.
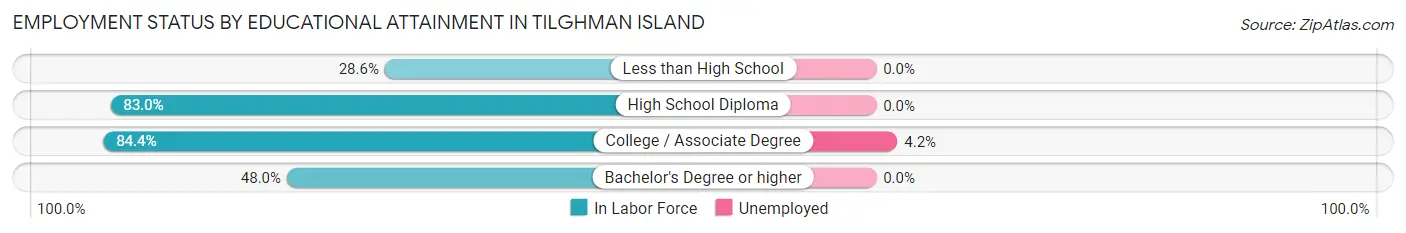
| Educational Attainment | In Labor Force | Unemployed |
| Less than High School | 10 (28.6%) | 0 (0.0%) |
| High School Diploma | 122 (83.0%) | 0 (0.0%) |
| College / Associate Degree | 119 (84.4%) | 6 (4.2%) |
| Bachelor's Degree or higher | 49 (48.0%) | 0 (0.0%) |
| Total | 300 (70.6%) | 7 (1.7%) |
Employment Occupations by Sex in Tilghman Island
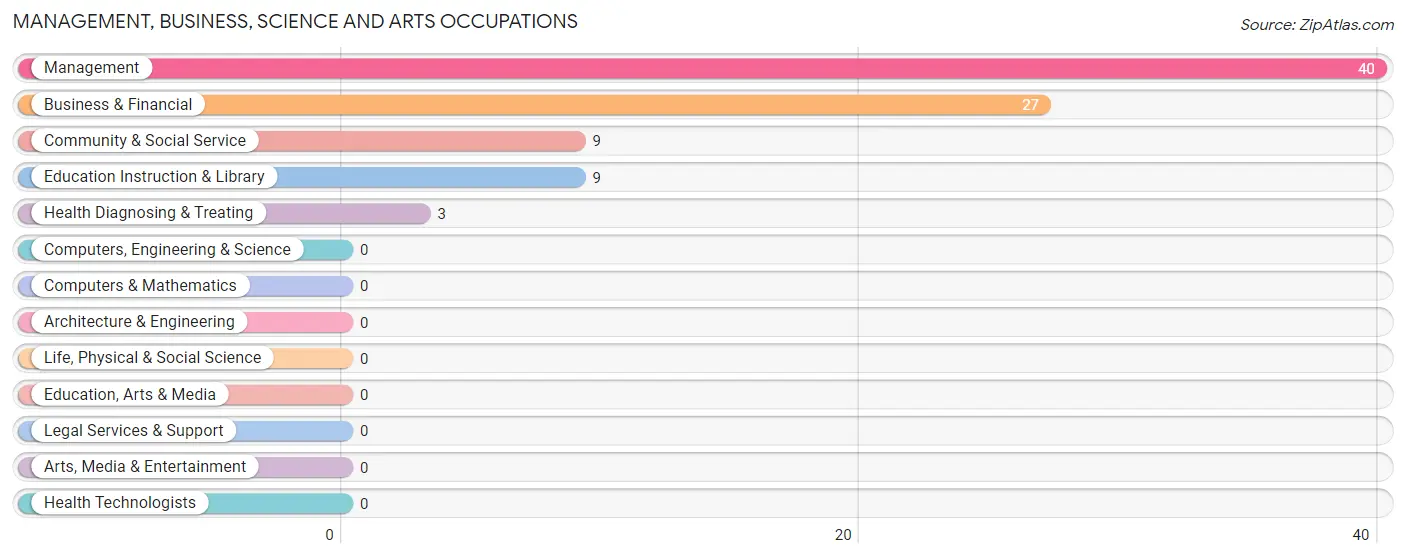
Management, Business, Science and Arts Occupations
The most common Management, Business, Science and Arts occupations in Tilghman Island are Management (40 | 11.1%), Business & Financial (27 | 7.5%), Community & Social Service (9 | 2.5%), Education Instruction & Library (9 | 2.5%), and Health Diagnosing & Treating (3 | 0.8%).
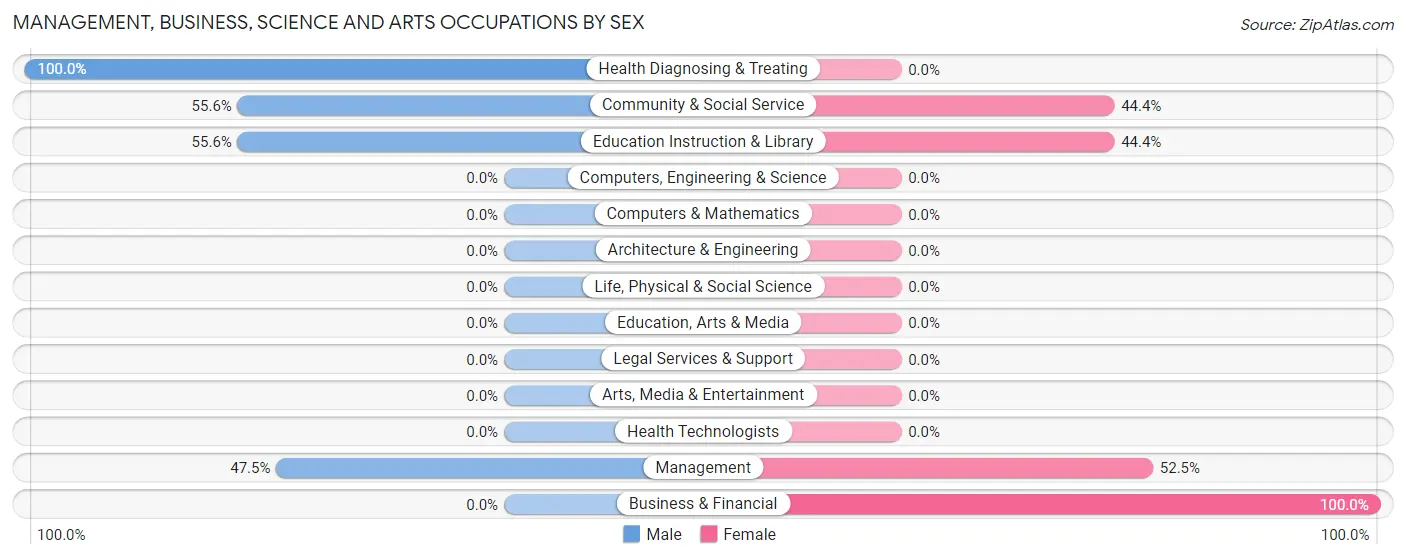
Management, Business, Science and Arts Occupations by Sex
Within the Management, Business, Science and Arts occupations in Tilghman Island, the most male-oriented occupations are Health Diagnosing & Treating (100.0%), Community & Social Service (55.6%), and Education Instruction & Library (55.6%), while the most female-oriented occupations are Business & Financial (100.0%), Management (52.5%), and Community & Social Service (44.4%).
| Occupation | Male | Female |
| Management | 19 (47.5%) | 21 (52.5%) |
| Business & Financial | 0 (0.0%) | 27 (100.0%) |
| Computers, Engineering & Science | 0 (0.0%) | 0 (0.0%) |
| Computers & Mathematics | 0 (0.0%) | 0 (0.0%) |
| Architecture & Engineering | 0 (0.0%) | 0 (0.0%) |
| Life, Physical & Social Science | 0 (0.0%) | 0 (0.0%) |
| Community & Social Service | 5 (55.6%) | 4 (44.4%) |
| Education, Arts & Media | 0 (0.0%) | 0 (0.0%) |
| Legal Services & Support | 0 (0.0%) | 0 (0.0%) |
| Education Instruction & Library | 5 (55.6%) | 4 (44.4%) |
| Arts, Media & Entertainment | 0 (0.0%) | 0 (0.0%) |
| Health Diagnosing & Treating | 3 (100.0%) | 0 (0.0%) |
| Health Technologists | 0 (0.0%) | 0 (0.0%) |
| Total (Category) | 27 (34.2%) | 52 (65.8%) |
| Total (Overall) | 157 (43.4%) | 205 (56.6%) |
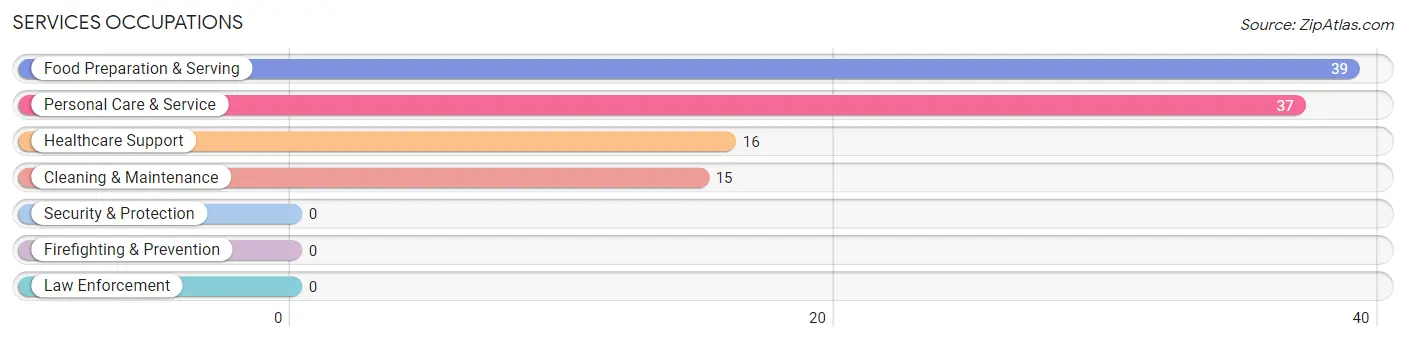
Services Occupations
The most common Services occupations in Tilghman Island are Food Preparation & Serving (39 | 10.8%), Personal Care & Service (37 | 10.2%), Healthcare Support (16 | 4.4%), and Cleaning & Maintenance (15 | 4.1%).
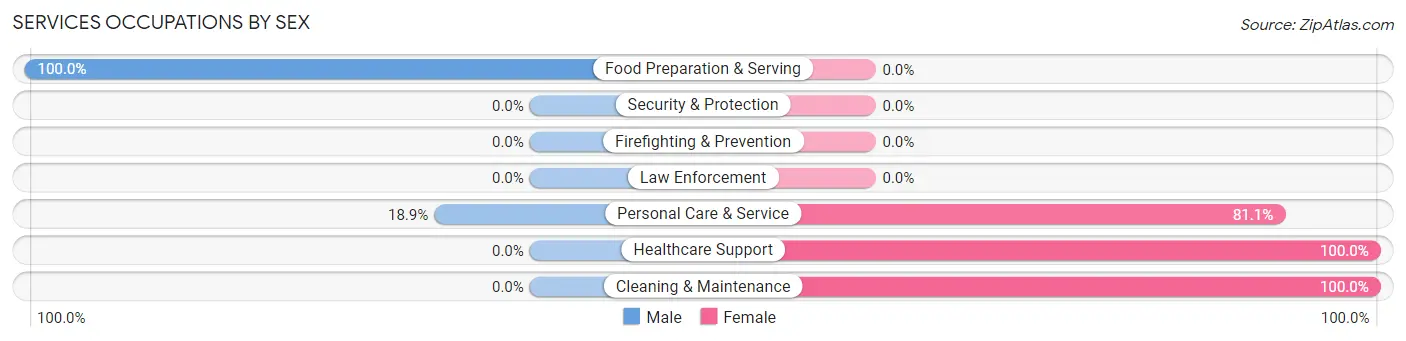
Services Occupations by Sex
Within the Services occupations in Tilghman Island, the most male-oriented occupations are Food Preparation & Serving (100.0%), and Personal Care & Service (18.9%), while the most female-oriented occupations are Healthcare Support (100.0%), Cleaning & Maintenance (100.0%), and Personal Care & Service (81.1%).
| Occupation | Male | Female |
| Healthcare Support | 0 (0.0%) | 16 (100.0%) |
| Security & Protection | 0 (0.0%) | 0 (0.0%) |
| Firefighting & Prevention | 0 (0.0%) | 0 (0.0%) |
| Law Enforcement | 0 (0.0%) | 0 (0.0%) |
| Food Preparation & Serving | 39 (100.0%) | 0 (0.0%) |
| Cleaning & Maintenance | 0 (0.0%) | 15 (100.0%) |
| Personal Care & Service | 7 (18.9%) | 30 (81.1%) |
| Total (Category) | 46 (43.0%) | 61 (57.0%) |
| Total (Overall) | 157 (43.4%) | 205 (56.6%) |
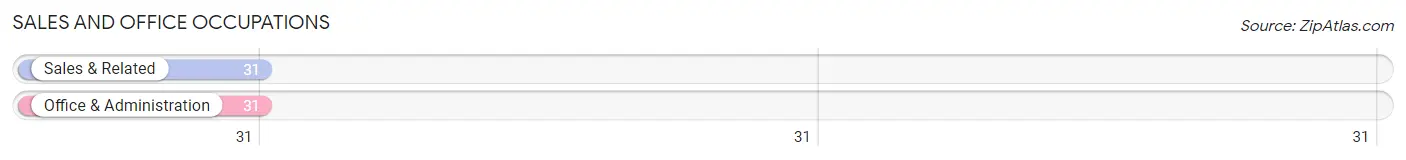
Sales and Office Occupations
The most common Sales and Office occupations in Tilghman Island are Sales & Related (31 | 8.6%), and Office & Administration (31 | 8.6%).
Sales and Office Occupations by Sex
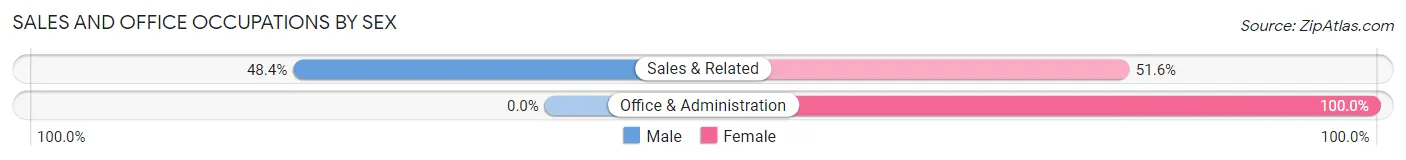
| Occupation | Male | Female |
| Sales & Related | 15 (48.4%) | 16 (51.6%) |
| Office & Administration | 0 (0.0%) | 31 (100.0%) |
| Total (Category) | 15 (24.2%) | 47 (75.8%) |
| Total (Overall) | 157 (43.4%) | 205 (56.6%) |
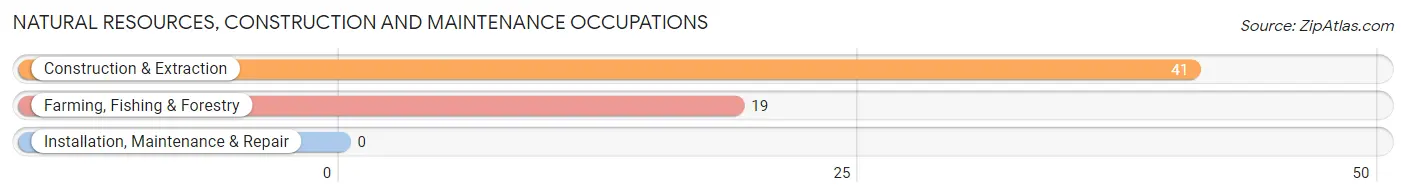
Natural Resources, Construction and Maintenance Occupations
The most common Natural Resources, Construction and Maintenance occupations in Tilghman Island are Construction & Extraction (41 | 11.3%), and Farming, Fishing & Forestry (19 | 5.2%).
Natural Resources, Construction and Maintenance Occupations by Sex
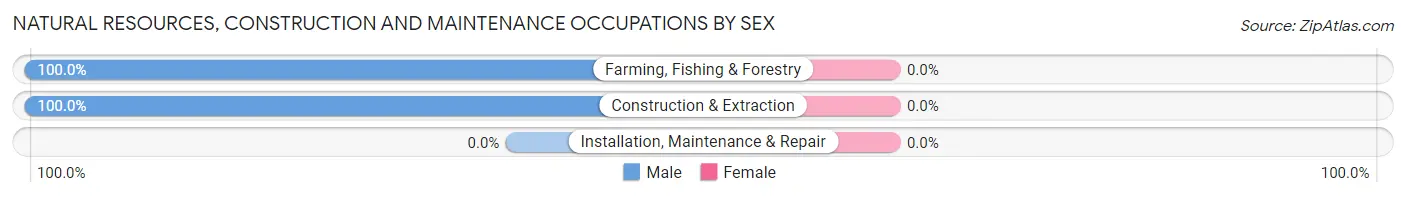
| Occupation | Male | Female |
| Farming, Fishing & Forestry | 19 (100.0%) | 0 (0.0%) |
| Construction & Extraction | 41 (100.0%) | 0 (0.0%) |
| Installation, Maintenance & Repair | 0 (0.0%) | 0 (0.0%) |
| Total (Category) | 60 (100.0%) | 0 (0.0%) |
| Total (Overall) | 157 (43.4%) | 205 (56.6%) |
Production, Transportation and Moving Occupations
The most common Production, Transportation and Moving occupations in Tilghman Island are Production (48 | 13.3%), and Transportation (6 | 1.7%).
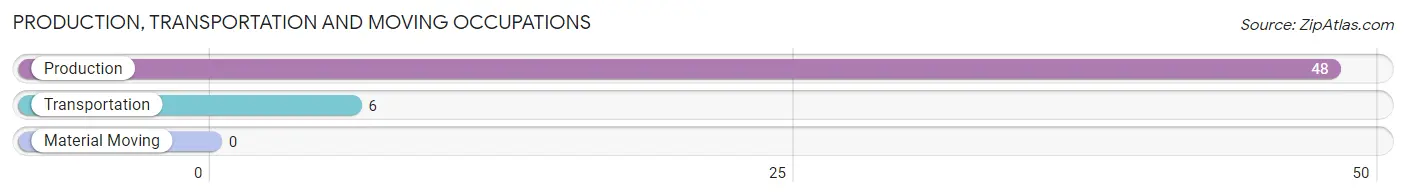
Production, Transportation and Moving Occupations by Sex
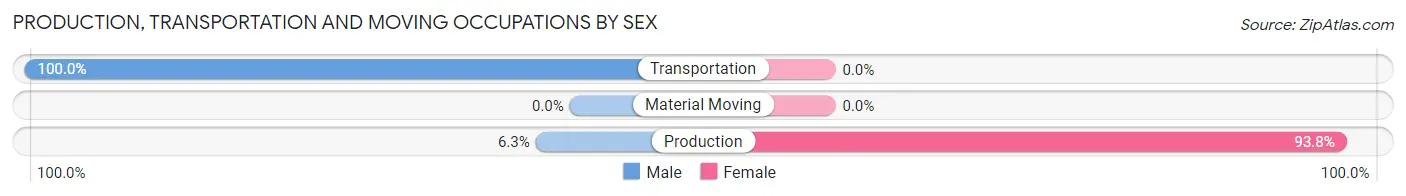
| Occupation | Male | Female |
| Production | 3 (6.2%) | 45 (93.8%) |
| Transportation | 6 (100.0%) | 0 (0.0%) |
| Material Moving | 0 (0.0%) | 0 (0.0%) |
| Total (Category) | 9 (16.7%) | 45 (83.3%) |
| Total (Overall) | 157 (43.4%) | 205 (56.6%) |
Employment Industries by Sex in Tilghman Island
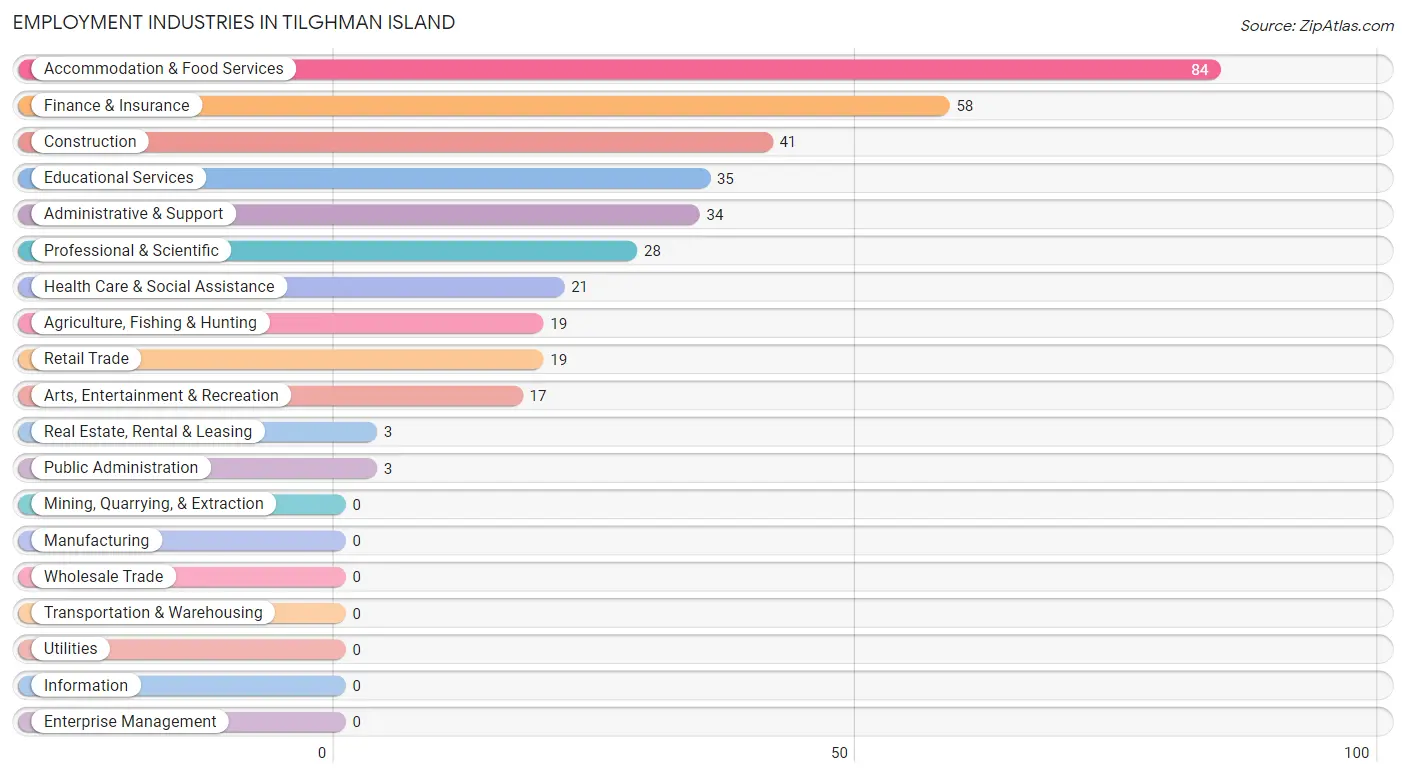
Employment Industries in Tilghman Island
The major employment industries in Tilghman Island include Accommodation & Food Services (84 | 23.2%), Finance & Insurance (58 | 16.0%), Construction (41 | 11.3%), Educational Services (35 | 9.7%), and Administrative & Support (34 | 9.4%).
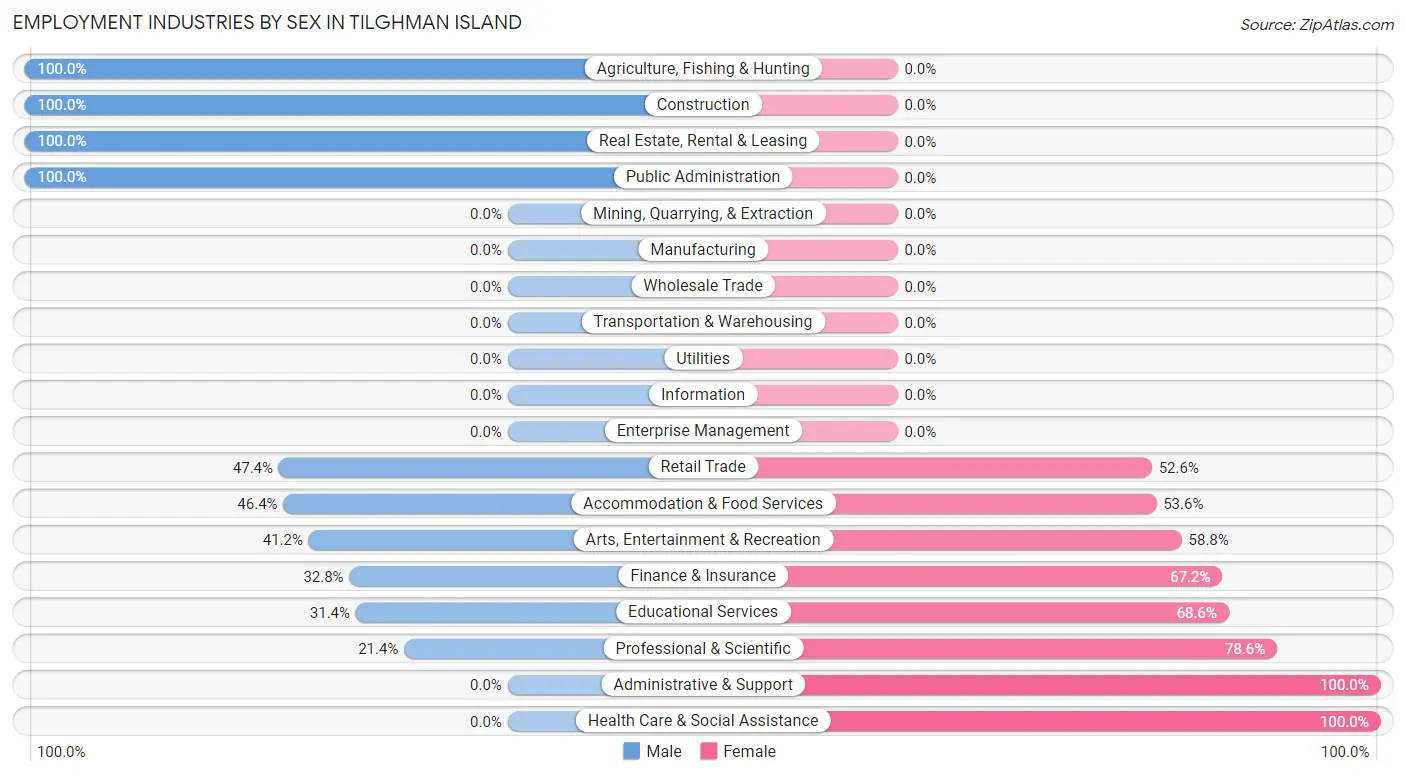
Employment Industries by Sex in Tilghman Island
The Tilghman Island industries that see more men than women are Agriculture, Fishing & Hunting (100.0%), Construction (100.0%), and Real Estate, Rental & Leasing (100.0%), whereas the industries that tend to have a higher number of women are Administrative & Support (100.0%), Health Care & Social Assistance (100.0%), and Professional & Scientific (78.6%).
| Industry | Male | Female |
| Agriculture, Fishing & Hunting | 19 (100.0%) | 0 (0.0%) |
| Mining, Quarrying, & Extraction | 0 (0.0%) | 0 (0.0%) |
| Construction | 41 (100.0%) | 0 (0.0%) |
| Manufacturing | 0 (0.0%) | 0 (0.0%) |
| Wholesale Trade | 0 (0.0%) | 0 (0.0%) |
| Retail Trade | 9 (47.4%) | 10 (52.6%) |
| Transportation & Warehousing | 0 (0.0%) | 0 (0.0%) |
| Utilities | 0 (0.0%) | 0 (0.0%) |
| Information | 0 (0.0%) | 0 (0.0%) |
| Finance & Insurance | 19 (32.8%) | 39 (67.2%) |
| Real Estate, Rental & Leasing | 3 (100.0%) | 0 (0.0%) |
| Professional & Scientific | 6 (21.4%) | 22 (78.6%) |
| Enterprise Management | 0 (0.0%) | 0 (0.0%) |
| Administrative & Support | 0 (0.0%) | 34 (100.0%) |
| Educational Services | 11 (31.4%) | 24 (68.6%) |
| Health Care & Social Assistance | 0 (0.0%) | 21 (100.0%) |
| Arts, Entertainment & Recreation | 7 (41.2%) | 10 (58.8%) |
| Accommodation & Food Services | 39 (46.4%) | 45 (53.6%) |
| Public Administration | 3 (100.0%) | 0 (0.0%) |
| Total | 157 (43.4%) | 205 (56.6%) |
Education in Tilghman Island
School Enrollment in Tilghman Island
The most common levels of schooling among the 122 students in Tilghman Island are high school (76 | 62.3%), elementary school (25 | 20.5%), and middle school (10 | 8.2%).
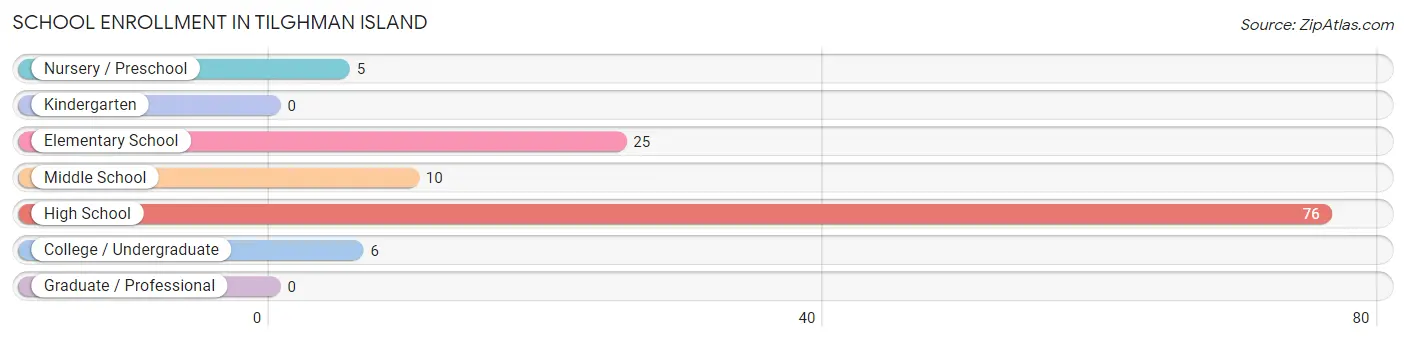
| School Level | # Students | % Students |
| Nursery / Preschool | 5 | 4.1% |
| Kindergarten | 0 | 0.0% |
| Elementary School | 25 | 20.5% |
| Middle School | 10 | 8.2% |
| High School | 76 | 62.3% |
| College / Undergraduate | 6 | 4.9% |
| Graduate / Professional | 0 | 0.0% |
| Total | 122 | 100.0% |
School Enrollment by Age by Funding Source in Tilghman Island
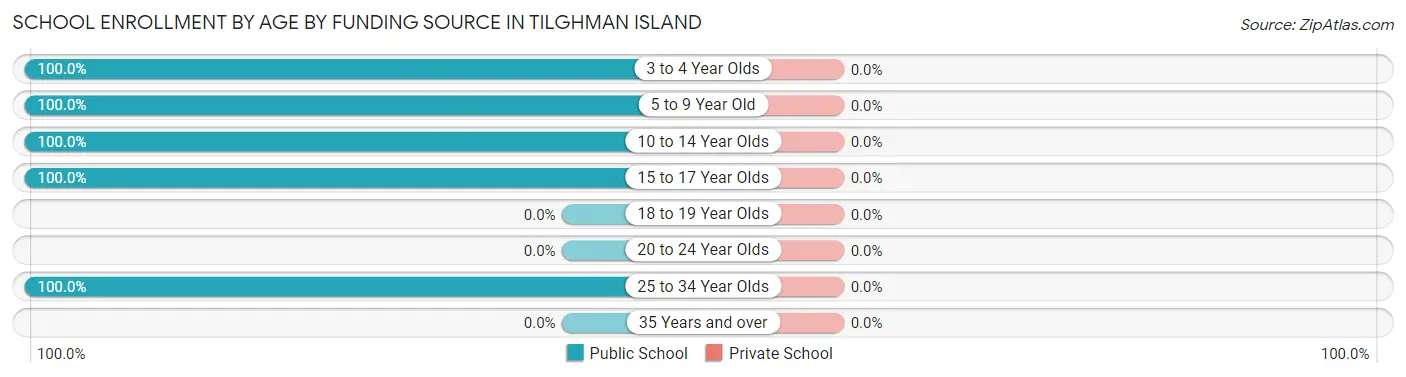
| Age Bracket | Public School | Private School |
| 3 to 4 Year Olds | 5 (100.0%) | 0 (0.0%) |
| 5 to 9 Year Old | 15 (100.0%) | 0 (0.0%) |
| 10 to 14 Year Olds | 45 (100.0%) | 0 (0.0%) |
| 15 to 17 Year Olds | 51 (100.0%) | 0 (0.0%) |
| 18 to 19 Year Olds | 0 (0.0%) | 0 (0.0%) |
| 20 to 24 Year Olds | 0 (0.0%) | 0 (0.0%) |
| 25 to 34 Year Olds | 6 (100.0%) | 0 (0.0%) |
| 35 Years and over | 0 (0.0%) | 0 (0.0%) |
| Total | 122 (100.0%) | 0 (0.0%) |
Educational Attainment by Field of Study in Tilghman Island
Business (52 | 34.7%), social sciences (22 | 14.7%), bio, nature & agricultural (20 | 13.3%), physical & health sciences (13 | 8.7%), and engineering (10 | 6.7%) are the most common fields of study among 150 individuals in Tilghman Island who have obtained a bachelor's degree or higher.
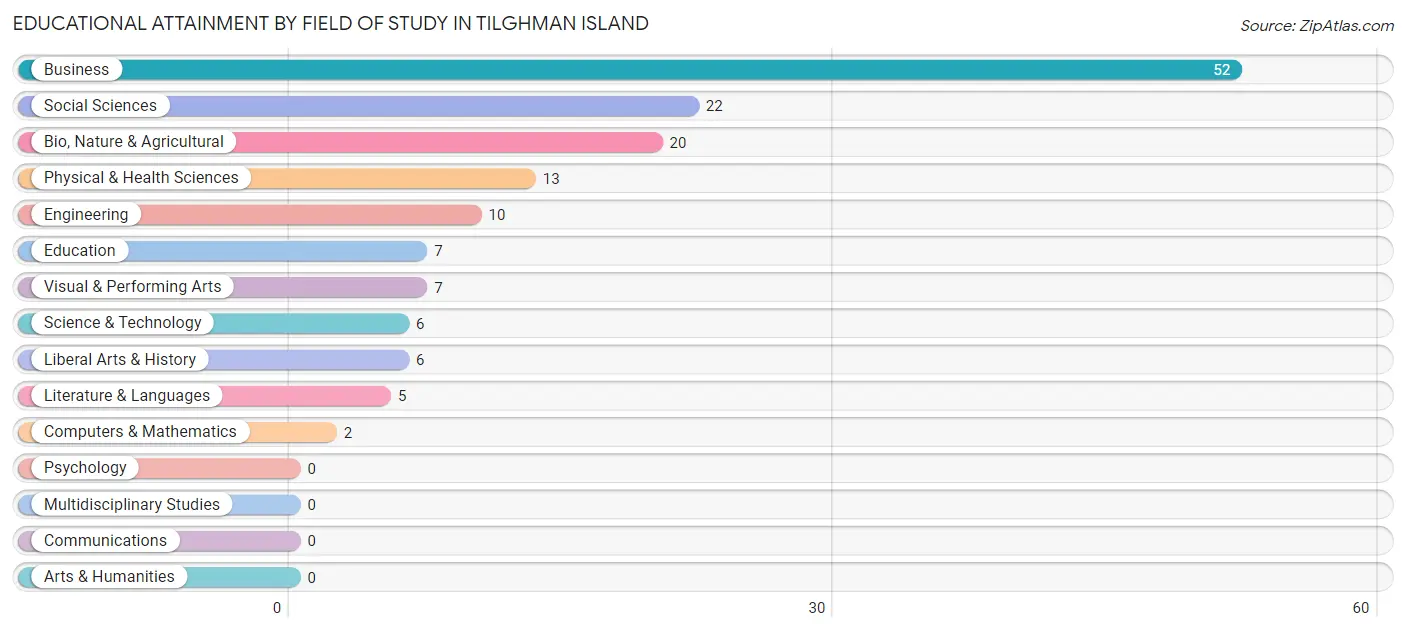
| Field of Study | # Graduates | % Graduates |
| Computers & Mathematics | 2 | 1.3% |
| Bio, Nature & Agricultural | 20 | 13.3% |
| Physical & Health Sciences | 13 | 8.7% |
| Psychology | 0 | 0.0% |
| Social Sciences | 22 | 14.7% |
| Engineering | 10 | 6.7% |
| Multidisciplinary Studies | 0 | 0.0% |
| Science & Technology | 6 | 4.0% |
| Business | 52 | 34.7% |
| Education | 7 | 4.7% |
| Literature & Languages | 5 | 3.3% |
| Liberal Arts & History | 6 | 4.0% |
| Visual & Performing Arts | 7 | 4.7% |
| Communications | 0 | 0.0% |
| Arts & Humanities | 0 | 0.0% |
| Total | 150 | 100.0% |
Transportation & Commute in Tilghman Island
Vehicle Availability by Sex in Tilghman Island
The most prevalent vehicle ownership categories in Tilghman Island are males with 2 vehicles (105, accounting for 69.5%) and females with 2 vehicles (112, making up 51.2%).
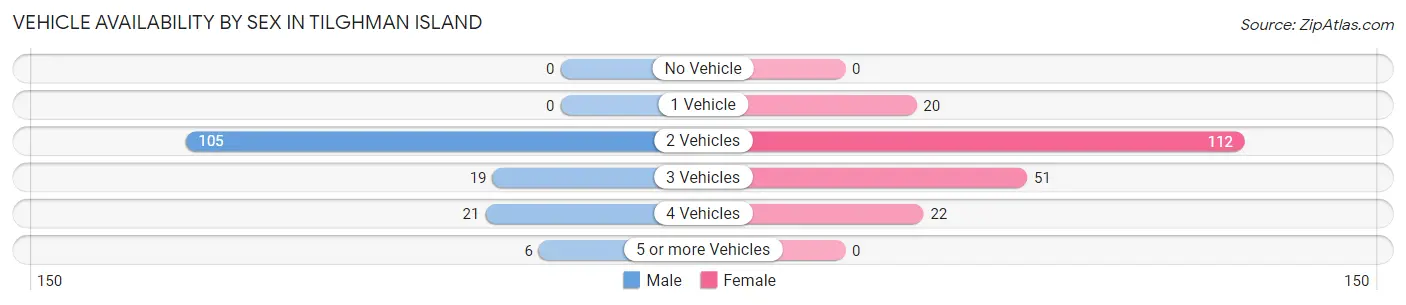
| Vehicles Available | Male | Female |
| No Vehicle | 0 (0.0%) | 0 (0.0%) |
| 1 Vehicle | 0 (0.0%) | 20 (9.8%) |
| 2 Vehicles | 105 (69.5%) | 112 (54.6%) |
| 3 Vehicles | 19 (12.6%) | 51 (24.9%) |
| 4 Vehicles | 21 (13.9%) | 22 (10.7%) |
| 5 or more Vehicles | 6 (4.0%) | 0 (0.0%) |
| Total | 151 (100.0%) | 205 (100.0%) |
Commute Time in Tilghman Island
The most frequently occuring commute durations in Tilghman Island are less than 5 minutes (70 commuters, 26.0%), 20 to 24 minutes (64 commuters, 23.8%), and 90 or more minutes (37 commuters, 13.8%).
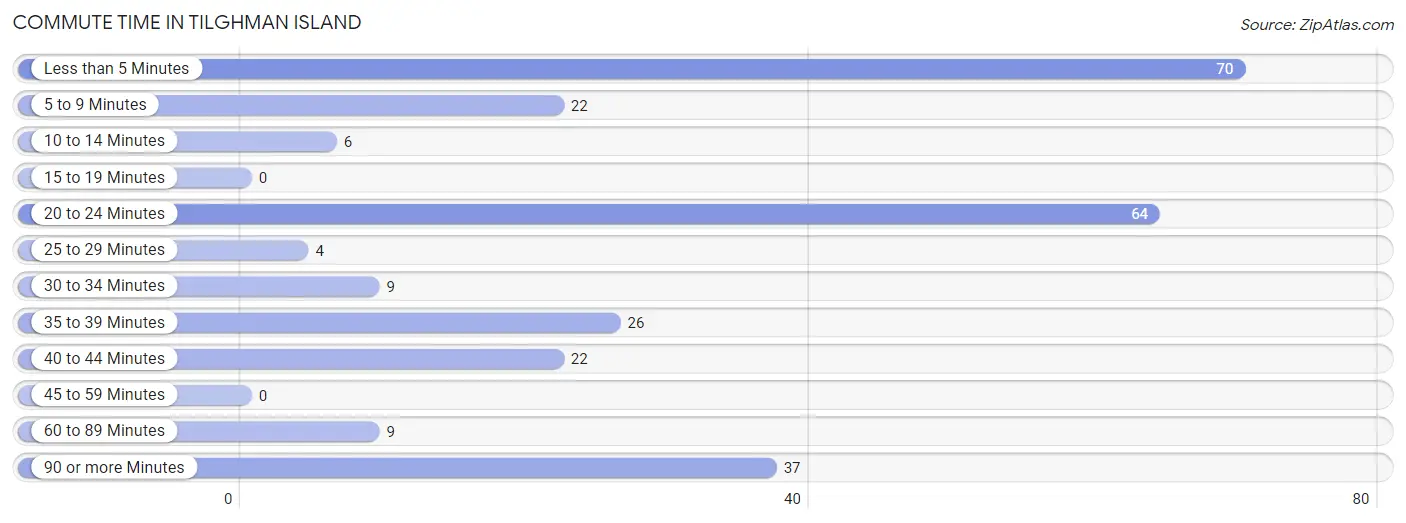
| Commute Time | # Commuters | % Commuters |
| Less than 5 Minutes | 70 | 26.0% |
| 5 to 9 Minutes | 22 | 8.2% |
| 10 to 14 Minutes | 6 | 2.2% |
| 15 to 19 Minutes | 0 | 0.0% |
| 20 to 24 Minutes | 64 | 23.8% |
| 25 to 29 Minutes | 4 | 1.5% |
| 30 to 34 Minutes | 9 | 3.4% |
| 35 to 39 Minutes | 26 | 9.7% |
| 40 to 44 Minutes | 22 | 8.2% |
| 45 to 59 Minutes | 0 | 0.0% |
| 60 to 89 Minutes | 9 | 3.4% |
| 90 or more Minutes | 37 | 13.8% |
Commute Time by Sex in Tilghman Island
The most common commute times in Tilghman Island are less than 5 minutes (50 commuters, 43.1%) for males and 20 to 24 minutes (49 commuters, 32.0%) for females.
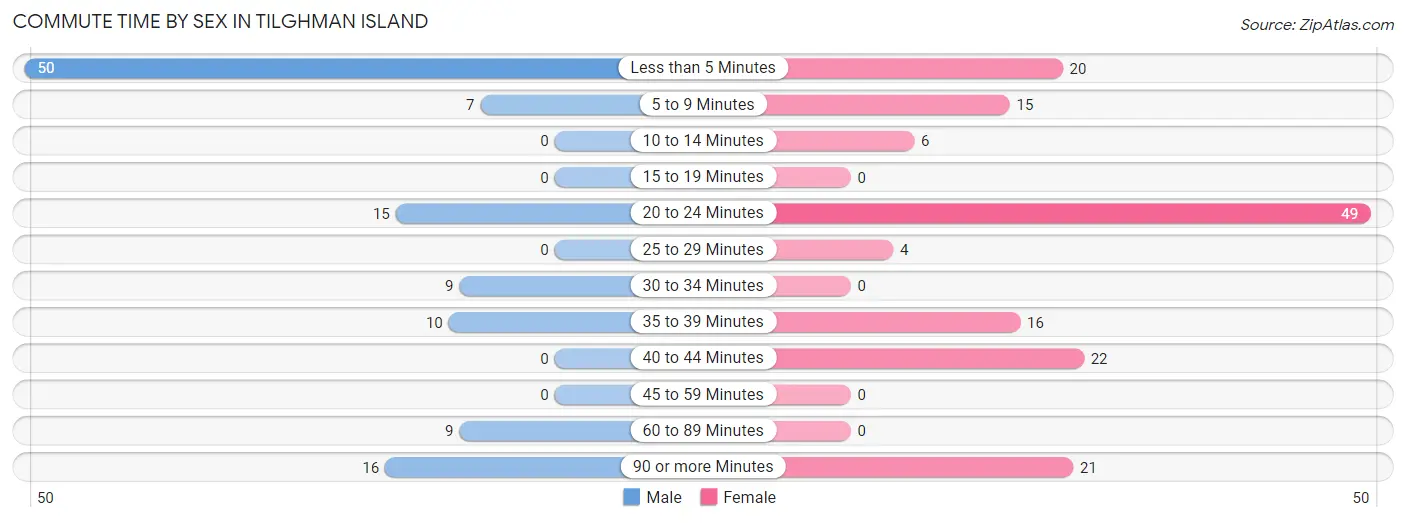
| Commute Time | Male | Female |
| Less than 5 Minutes | 50 (43.1%) | 20 (13.1%) |
| 5 to 9 Minutes | 7 (6.0%) | 15 (9.8%) |
| 10 to 14 Minutes | 0 (0.0%) | 6 (3.9%) |
| 15 to 19 Minutes | 0 (0.0%) | 0 (0.0%) |
| 20 to 24 Minutes | 15 (12.9%) | 49 (32.0%) |
| 25 to 29 Minutes | 0 (0.0%) | 4 (2.6%) |
| 30 to 34 Minutes | 9 (7.8%) | 0 (0.0%) |
| 35 to 39 Minutes | 10 (8.6%) | 16 (10.5%) |
| 40 to 44 Minutes | 0 (0.0%) | 22 (14.4%) |
| 45 to 59 Minutes | 0 (0.0%) | 0 (0.0%) |
| 60 to 89 Minutes | 9 (7.8%) | 0 (0.0%) |
| 90 or more Minutes | 16 (13.8%) | 21 (13.7%) |
Time of Departure to Work by Sex in Tilghman Island
The most frequent times of departure to work in Tilghman Island are 7:00 AM to 7:29 AM (39, 33.6%) for males and 9:00 AM to 9:59 AM (45, 29.4%) for females.
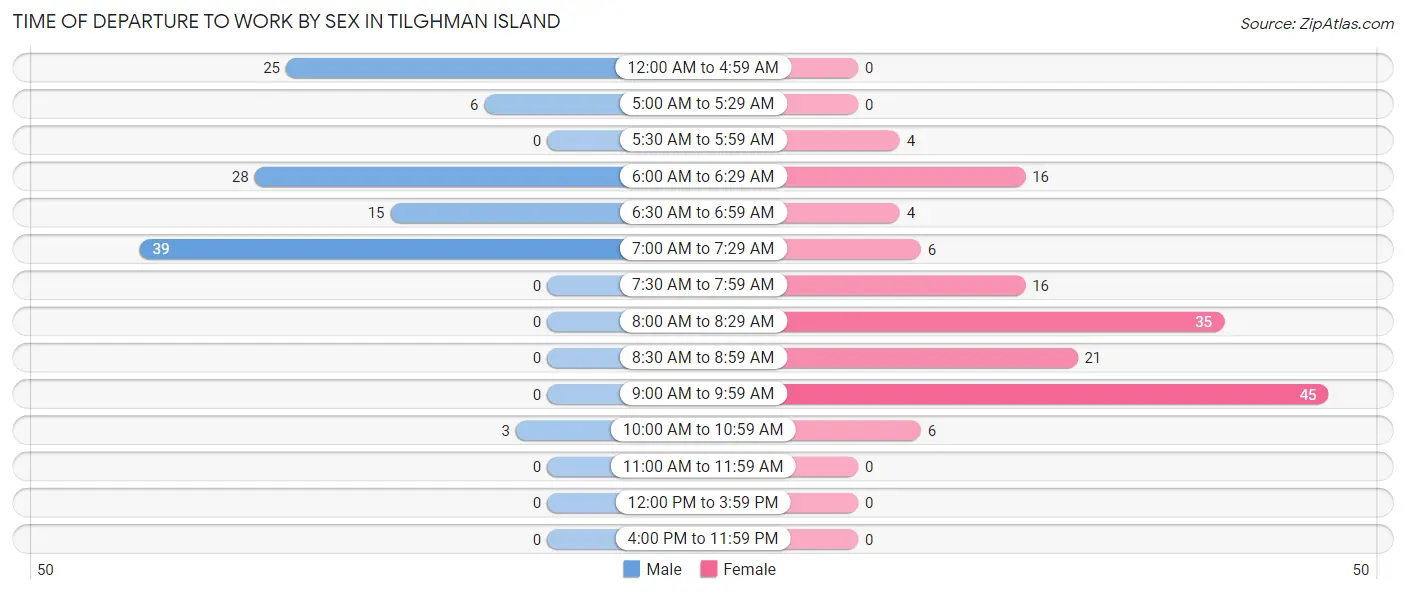
| Time of Departure | Male | Female |
| 12:00 AM to 4:59 AM | 25 (21.5%) | 0 (0.0%) |
| 5:00 AM to 5:29 AM | 6 (5.2%) | 0 (0.0%) |
| 5:30 AM to 5:59 AM | 0 (0.0%) | 4 (2.6%) |
| 6:00 AM to 6:29 AM | 28 (24.1%) | 16 (10.5%) |
| 6:30 AM to 6:59 AM | 15 (12.9%) | 4 (2.6%) |
| 7:00 AM to 7:29 AM | 39 (33.6%) | 6 (3.9%) |
| 7:30 AM to 7:59 AM | 0 (0.0%) | 16 (10.5%) |
| 8:00 AM to 8:29 AM | 0 (0.0%) | 35 (22.9%) |
| 8:30 AM to 8:59 AM | 0 (0.0%) | 21 (13.7%) |
| 9:00 AM to 9:59 AM | 0 (0.0%) | 45 (29.4%) |
| 10:00 AM to 10:59 AM | 3 (2.6%) | 6 (3.9%) |
| 11:00 AM to 11:59 AM | 0 (0.0%) | 0 (0.0%) |
| 12:00 PM to 3:59 PM | 0 (0.0%) | 0 (0.0%) |
| 4:00 PM to 11:59 PM | 0 (0.0%) | 0 (0.0%) |
| Total | 116 (100.0%) | 153 (100.0%) |
Housing Occupancy in Tilghman Island
Occupancy by Ownership in Tilghman Island
Of the total 375 dwellings in Tilghman Island, owner-occupied units account for 336 (89.6%), while renter-occupied units make up 39 (10.4%).
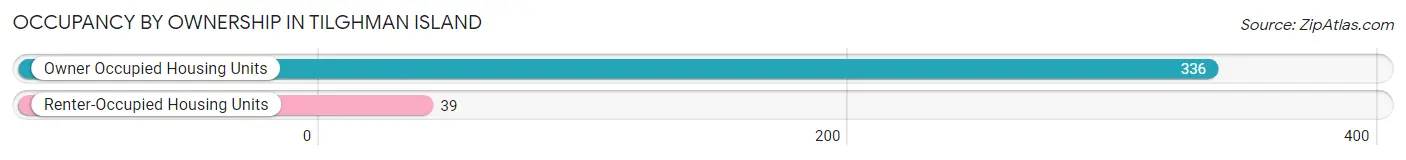
| Occupancy | # Housing Units | % Housing Units |
| Owner Occupied Housing Units | 336 | 89.6% |
| Renter-Occupied Housing Units | 39 | 10.4% |
| Total Occupied Housing Units | 375 | 100.0% |
Occupancy by Household Size in Tilghman Island
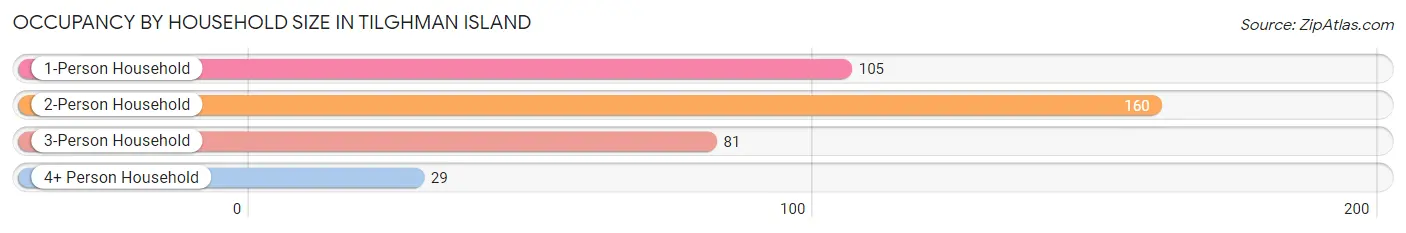
| Household Size | # Housing Units | % Housing Units |
| 1-Person Household | 105 | 28.0% |
| 2-Person Household | 160 | 42.7% |
| 3-Person Household | 81 | 21.6% |
| 4+ Person Household | 29 | 7.7% |
| Total Housing Units | 375 | 100.0% |
Occupancy by Ownership by Household Size in Tilghman Island
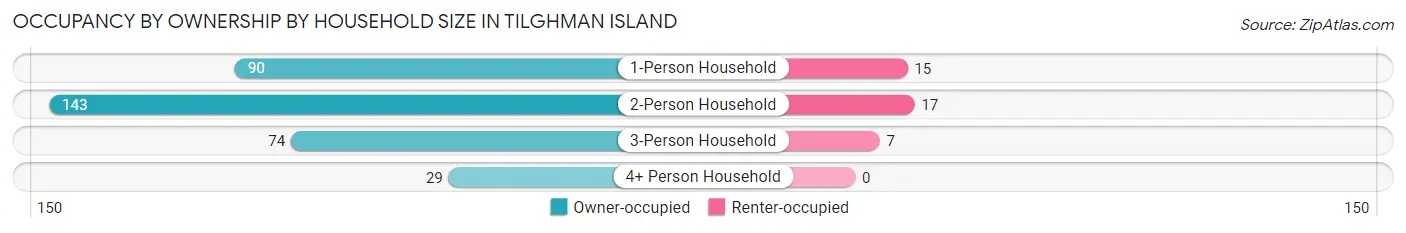
| Household Size | Owner-occupied | Renter-occupied |
| 1-Person Household | 90 (85.7%) | 15 (14.3%) |
| 2-Person Household | 143 (89.4%) | 17 (10.6%) |
| 3-Person Household | 74 (91.4%) | 7 (8.6%) |
| 4+ Person Household | 29 (100.0%) | 0 (0.0%) |
| Total Housing Units | 336 (89.6%) | 39 (10.4%) |
Occupancy by Educational Attainment in Tilghman Island
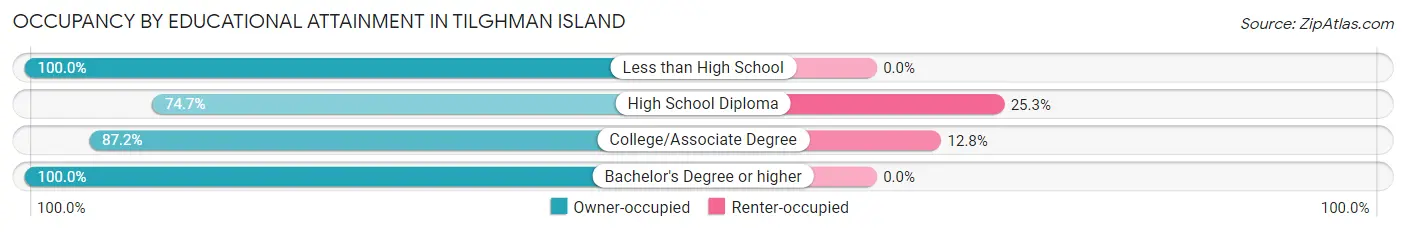
| Household Size | Owner-occupied | Renter-occupied |
| Less than High School | 73 (100.0%) | 0 (0.0%) |
| High School Diploma | 65 (74.7%) | 22 (25.3%) |
| College/Associate Degree | 116 (87.2%) | 17 (12.8%) |
| Bachelor's Degree or higher | 82 (100.0%) | 0 (0.0%) |
Occupancy by Age of Householder in Tilghman Island
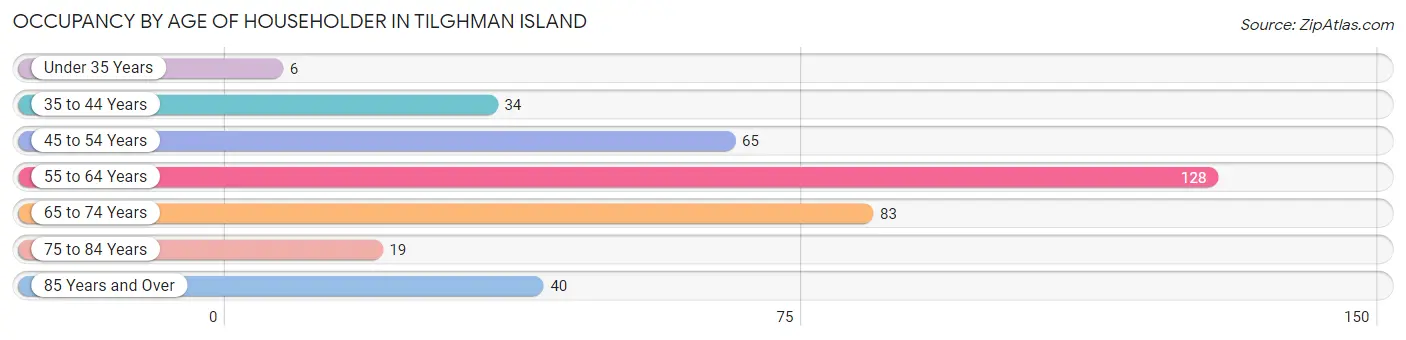
| Age Bracket | # Households | % Households |
| Under 35 Years | 6 | 1.6% |
| 35 to 44 Years | 34 | 9.1% |
| 45 to 54 Years | 65 | 17.3% |
| 55 to 64 Years | 128 | 34.1% |
| 65 to 74 Years | 83 | 22.1% |
| 75 to 84 Years | 19 | 5.1% |
| 85 Years and Over | 40 | 10.7% |
| Total | 375 | 100.0% |
Housing Finances in Tilghman Island
Median Income by Occupancy in Tilghman Island
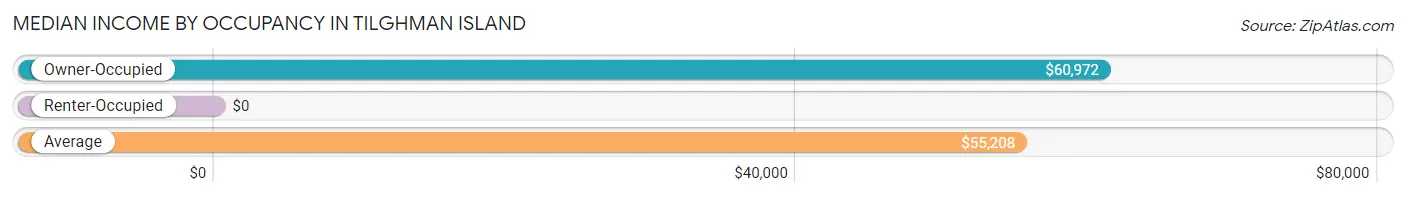
| Occupancy Type | # Households | Median Income |
| Owner-Occupied | 336 (89.6%) | $60,972 |
| Renter-Occupied | 39 (10.4%) | $0 |
| Average | 375 (100.0%) | $55,208 |
Occupancy by Householder Income Bracket in Tilghman Island
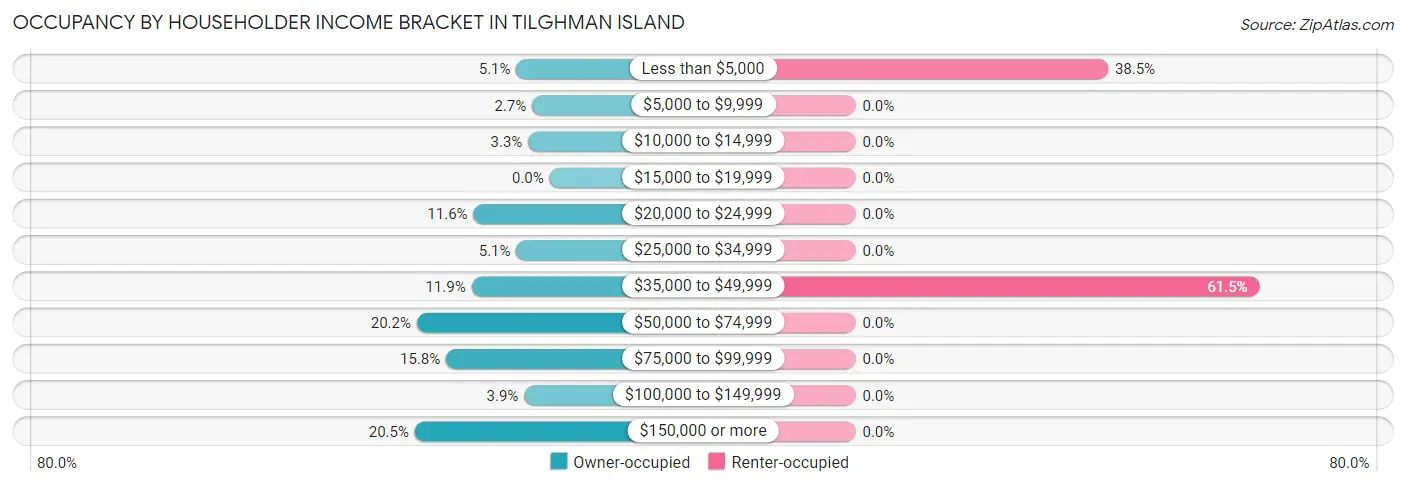
| Income Bracket | Owner-occupied | Renter-occupied |
| Less than $5,000 | 17 (5.1%) | 15 (38.5%) |
| $5,000 to $9,999 | 9 (2.7%) | 0 (0.0%) |
| $10,000 to $14,999 | 11 (3.3%) | 0 (0.0%) |
| $15,000 to $19,999 | 0 (0.0%) | 0 (0.0%) |
| $20,000 to $24,999 | 39 (11.6%) | 0 (0.0%) |
| $25,000 to $34,999 | 17 (5.1%) | 0 (0.0%) |
| $35,000 to $49,999 | 40 (11.9%) | 24 (61.5%) |
| $50,000 to $74,999 | 68 (20.2%) | 0 (0.0%) |
| $75,000 to $99,999 | 53 (15.8%) | 0 (0.0%) |
| $100,000 to $149,999 | 13 (3.9%) | 0 (0.0%) |
| $150,000 or more | 69 (20.5%) | 0 (0.0%) |
| Total | 336 (100.0%) | 39 (100.0%) |
Monthly Housing Cost Tiers in Tilghman Island
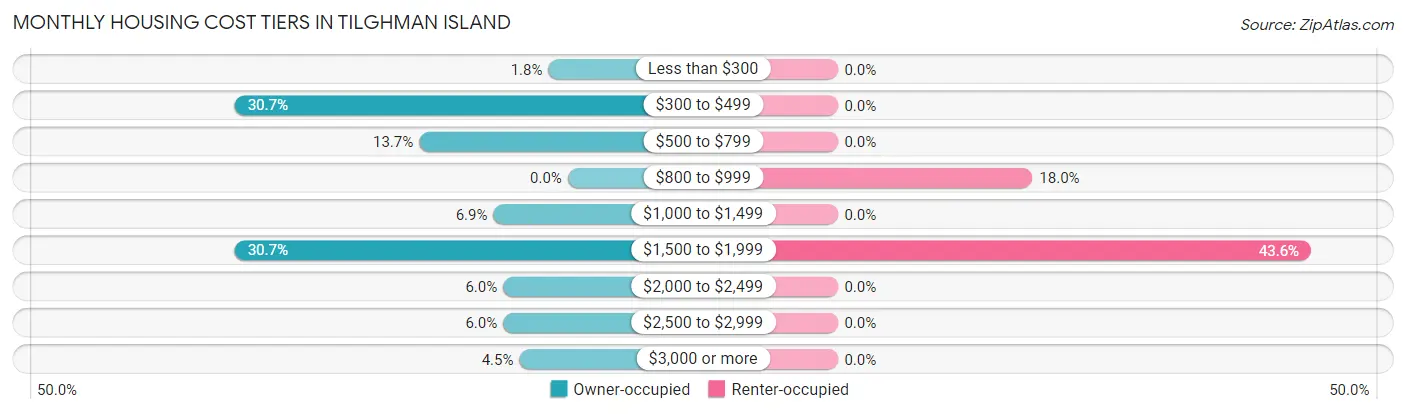
| Monthly Cost | Owner-occupied | Renter-occupied |
| Less than $300 | 6 (1.8%) | 0 (0.0%) |
| $300 to $499 | 103 (30.6%) | 0 (0.0%) |
| $500 to $799 | 46 (13.7%) | 0 (0.0%) |
| $800 to $999 | 0 (0.0%) | 7 (17.9%) |
| $1,000 to $1,499 | 23 (6.9%) | 0 (0.0%) |
| $1,500 to $1,999 | 103 (30.6%) | 17 (43.6%) |
| $2,000 to $2,499 | 20 (5.9%) | 0 (0.0%) |
| $2,500 to $2,999 | 20 (5.9%) | 0 (0.0%) |
| $3,000 or more | 15 (4.5%) | 0 (0.0%) |
| Total | 336 (100.0%) | 39 (100.0%) |
Physical Housing Characteristics in Tilghman Island
Housing Structures in Tilghman Island
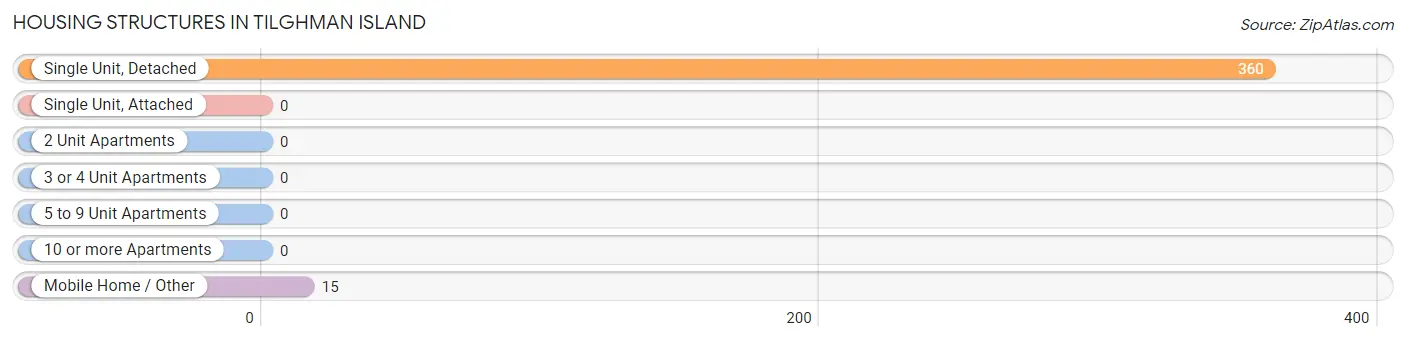
| Structure Type | # Housing Units | % Housing Units |
| Single Unit, Detached | 360 | 96.0% |
| Single Unit, Attached | 0 | 0.0% |
| 2 Unit Apartments | 0 | 0.0% |
| 3 or 4 Unit Apartments | 0 | 0.0% |
| 5 to 9 Unit Apartments | 0 | 0.0% |
| 10 or more Apartments | 0 | 0.0% |
| Mobile Home / Other | 15 | 4.0% |
| Total | 375 | 100.0% |
Housing Structures by Occupancy in Tilghman Island
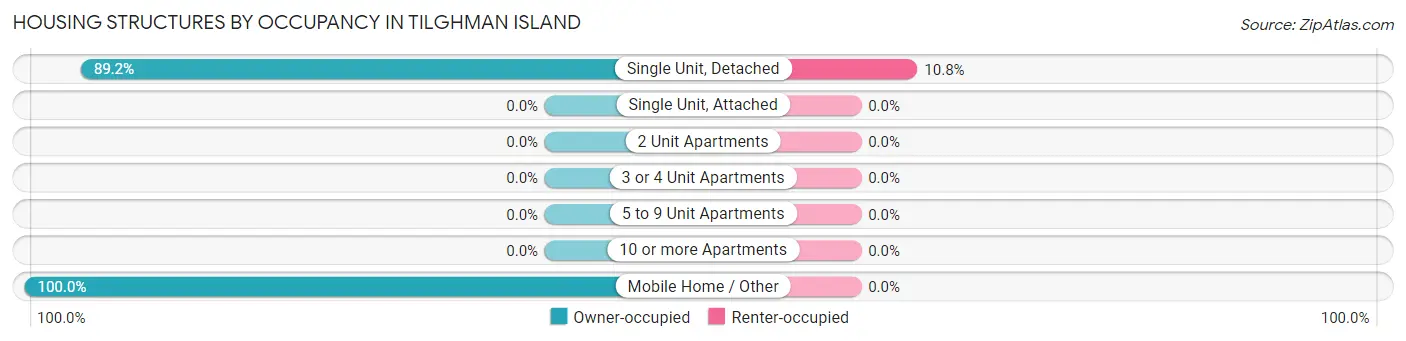
| Structure Type | Owner-occupied | Renter-occupied |
| Single Unit, Detached | 321 (89.2%) | 39 (10.8%) |
| Single Unit, Attached | 0 (0.0%) | 0 (0.0%) |
| 2 Unit Apartments | 0 (0.0%) | 0 (0.0%) |
| 3 or 4 Unit Apartments | 0 (0.0%) | 0 (0.0%) |
| 5 to 9 Unit Apartments | 0 (0.0%) | 0 (0.0%) |
| 10 or more Apartments | 0 (0.0%) | 0 (0.0%) |
| Mobile Home / Other | 15 (100.0%) | 0 (0.0%) |
| Total | 336 (89.6%) | 39 (10.4%) |
Housing Structures by Number of Rooms in Tilghman Island
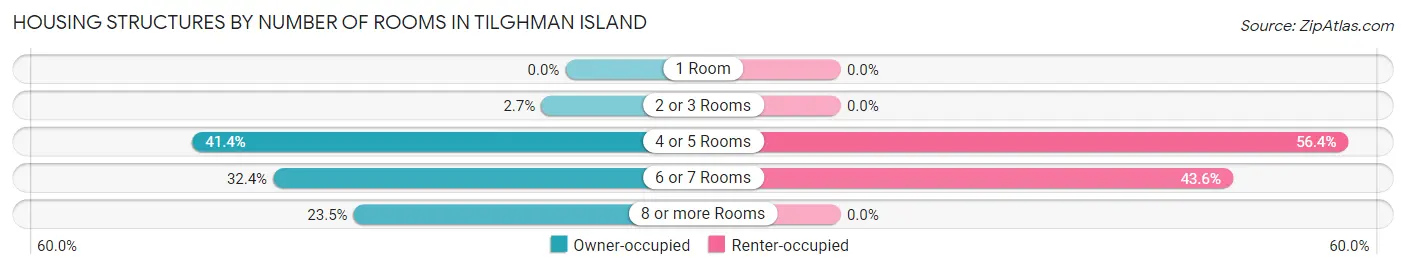
| Number of Rooms | Owner-occupied | Renter-occupied |
| 1 Room | 0 (0.0%) | 0 (0.0%) |
| 2 or 3 Rooms | 9 (2.7%) | 0 (0.0%) |
| 4 or 5 Rooms | 139 (41.4%) | 22 (56.4%) |
| 6 or 7 Rooms | 109 (32.4%) | 17 (43.6%) |
| 8 or more Rooms | 79 (23.5%) | 0 (0.0%) |
| Total | 336 (100.0%) | 39 (100.0%) |
Housing Structure by Heating Type in Tilghman Island
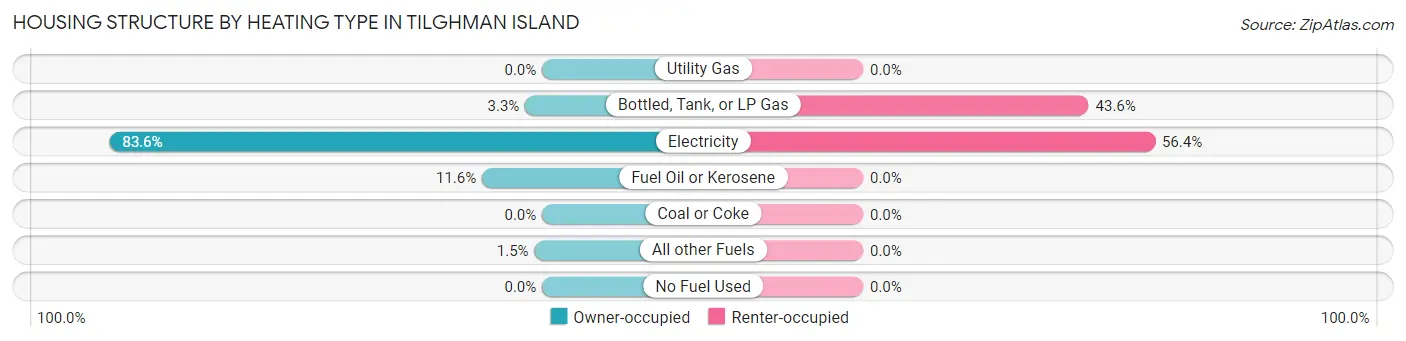
| Heating Type | Owner-occupied | Renter-occupied |
| Utility Gas | 0 (0.0%) | 0 (0.0%) |
| Bottled, Tank, or LP Gas | 11 (3.3%) | 17 (43.6%) |
| Electricity | 281 (83.6%) | 22 (56.4%) |
| Fuel Oil or Kerosene | 39 (11.6%) | 0 (0.0%) |
| Coal or Coke | 0 (0.0%) | 0 (0.0%) |
| All other Fuels | 5 (1.5%) | 0 (0.0%) |
| No Fuel Used | 0 (0.0%) | 0 (0.0%) |
| Total | 336 (100.0%) | 39 (100.0%) |
Household Vehicle Usage in Tilghman Island
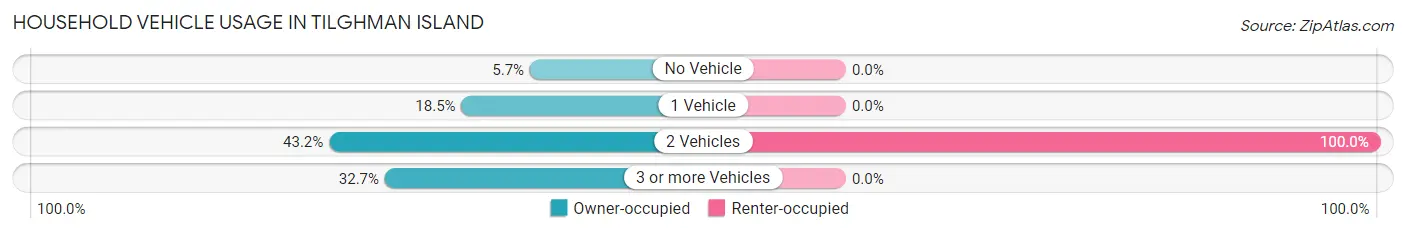
| Vehicles per Household | Owner-occupied | Renter-occupied |
| No Vehicle | 19 (5.7%) | 0 (0.0%) |
| 1 Vehicle | 62 (18.4%) | 0 (0.0%) |
| 2 Vehicles | 145 (43.1%) | 39 (100.0%) |
| 3 or more Vehicles | 110 (32.7%) | 0 (0.0%) |
| Total | 336 (100.0%) | 39 (100.0%) |
Real Estate & Mortgages in Tilghman Island
Real Estate and Mortgage Overview in Tilghman Island
| Characteristic | Without Mortgage | With Mortgage |
| Housing Units | 165 | 171 |
| Median Property Value | $253,300 | $415,600 |
| Median Household Income | $40,288 | $39 |
| Monthly Housing Costs | $437 | $15 |
| Real Estate Taxes | $1,177 | $0 |
Property Value by Mortgage Status in Tilghman Island
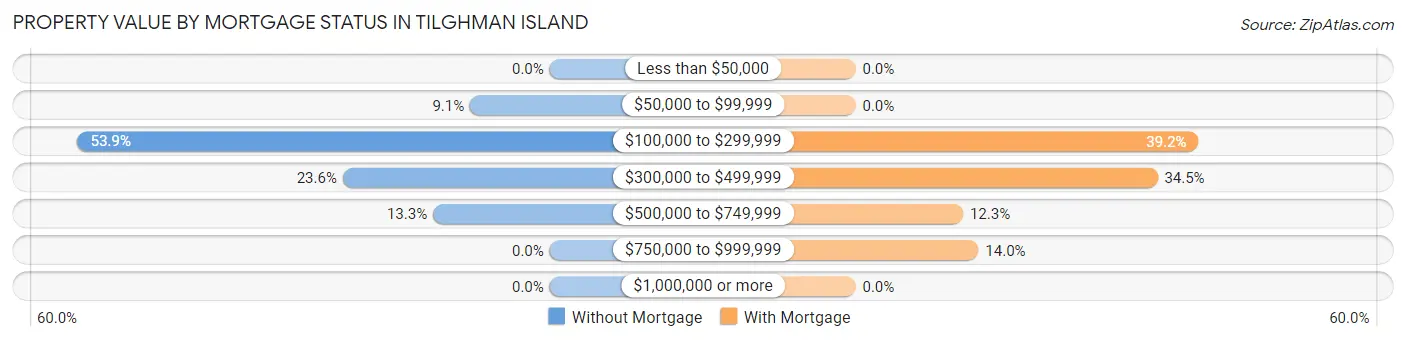
| Property Value | Without Mortgage | With Mortgage |
| Less than $50,000 | 0 (0.0%) | 0 (0.0%) |
| $50,000 to $99,999 | 15 (9.1%) | 0 (0.0%) |
| $100,000 to $299,999 | 89 (53.9%) | 67 (39.2%) |
| $300,000 to $499,999 | 39 (23.6%) | 59 (34.5%) |
| $500,000 to $749,999 | 22 (13.3%) | 21 (12.3%) |
| $750,000 to $999,999 | 0 (0.0%) | 24 (14.0%) |
| $1,000,000 or more | 0 (0.0%) | 0 (0.0%) |
| Total | 165 (100.0%) | 171 (100.0%) |
Household Income by Mortgage Status in Tilghman Island
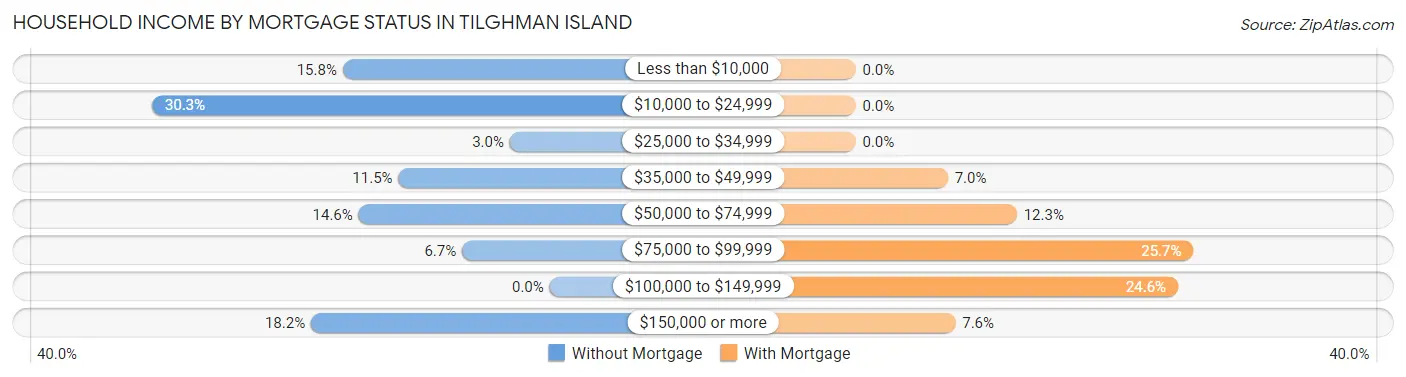
| Household Income | Without Mortgage | With Mortgage |
| Less than $10,000 | 26 (15.8%) | 0 (0.0%) |
| $10,000 to $24,999 | 50 (30.3%) | 0 (0.0%) |
| $25,000 to $34,999 | 5 (3.0%) | 0 (0.0%) |
| $35,000 to $49,999 | 19 (11.5%) | 12 (7.0%) |
| $50,000 to $74,999 | 24 (14.5%) | 21 (12.3%) |
| $75,000 to $99,999 | 11 (6.7%) | 44 (25.7%) |
| $100,000 to $149,999 | 0 (0.0%) | 42 (24.6%) |
| $150,000 or more | 30 (18.2%) | 13 (7.6%) |
| Total | 165 (100.0%) | 171 (100.0%) |
Property Value to Household Income Ratio in Tilghman Island
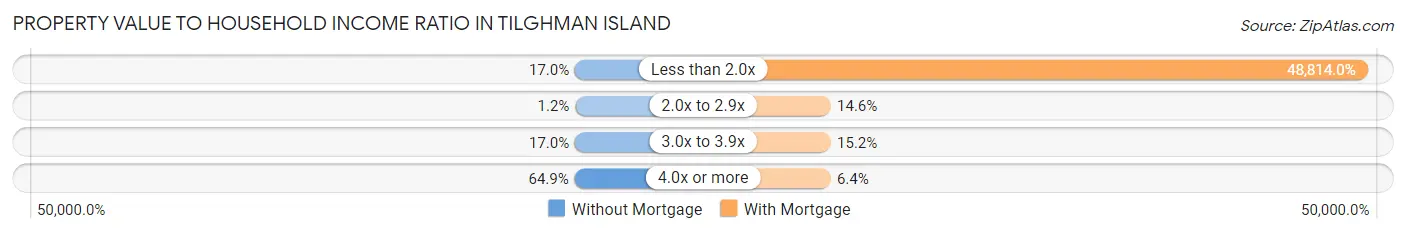
| Value-to-Income Ratio | Without Mortgage | With Mortgage |
| Less than 2.0x | 28 (17.0%) | 83,472 (48,814.0%) |
| 2.0x to 2.9x | 2 (1.2%) | 25 (14.6%) |
| 3.0x to 3.9x | 28 (17.0%) | 26 (15.2%) |
| 4.0x or more | 107 (64.8%) | 11 (6.4%) |
| Total | 165 (100.0%) | 171 (100.0%) |
Real Estate Taxes by Mortgage Status in Tilghman Island
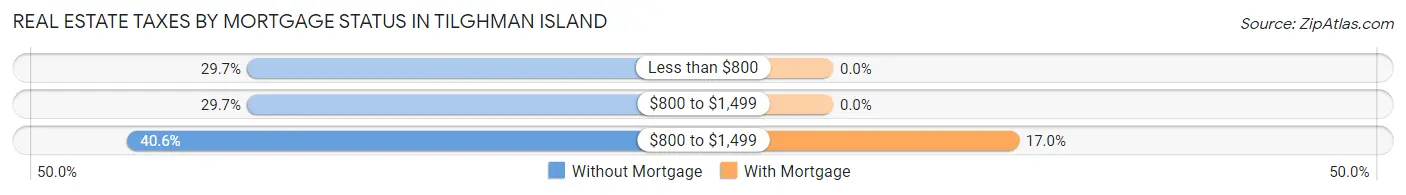
| Property Taxes | Without Mortgage | With Mortgage |
| Less than $800 | 49 (29.7%) | 0 (0.0%) |
| $800 to $1,499 | 49 (29.7%) | 0 (0.0%) |
| $800 to $1,499 | 67 (40.6%) | 29 (17.0%) |
| Total | 165 (100.0%) | 171 (100.0%) |
Health & Disability in Tilghman Island
Health Insurance Coverage by Age in Tilghman Island
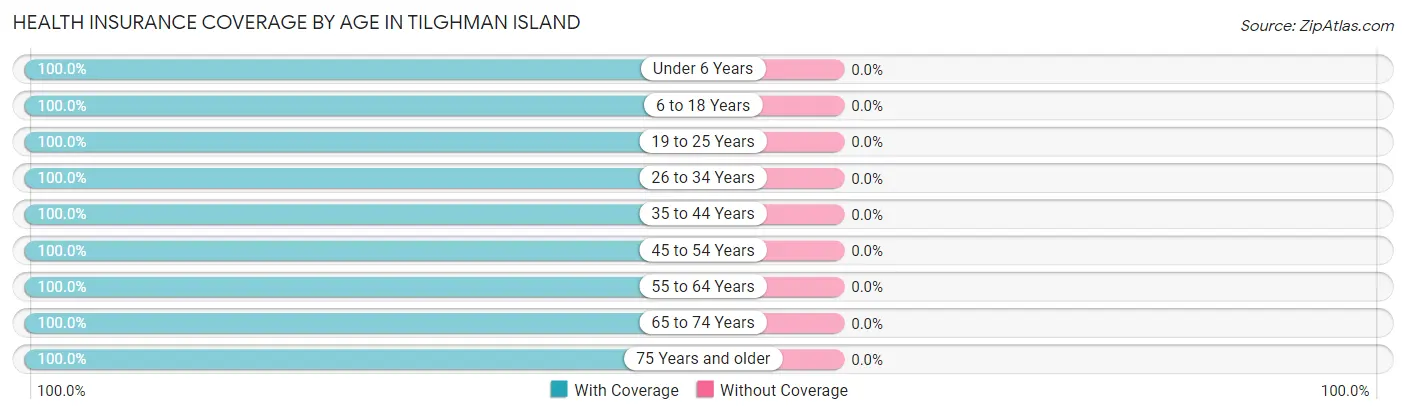
| Age Bracket | With Coverage | Without Coverage |
| Under 6 Years | 11 (100.0%) | 0 (0.0%) |
| 6 to 18 Years | 111 (100.0%) | 0 (0.0%) |
| 19 to 25 Years | 57 (100.0%) | 0 (0.0%) |
| 26 to 34 Years | 54 (100.0%) | 0 (0.0%) |
| 35 to 44 Years | 53 (100.0%) | 0 (0.0%) |
| 45 to 54 Years | 108 (100.0%) | 0 (0.0%) |
| 55 to 64 Years | 210 (100.0%) | 0 (0.0%) |
| 65 to 74 Years | 152 (100.0%) | 0 (0.0%) |
| 75 Years and older | 70 (100.0%) | 0 (0.0%) |
| Total | 826 (100.0%) | 0 (0.0%) |
Health Insurance Coverage by Citizenship Status in Tilghman Island
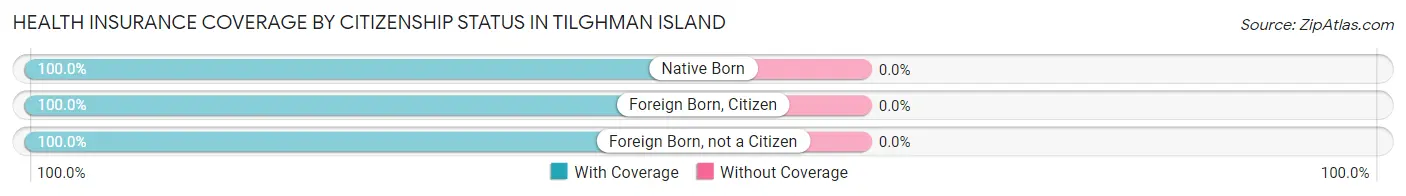
| Citizenship Status | With Coverage | Without Coverage |
| Native Born | 11 (100.0%) | 0 (0.0%) |
| Foreign Born, Citizen | 111 (100.0%) | 0 (0.0%) |
| Foreign Born, not a Citizen | 57 (100.0%) | 0 (0.0%) |
Health Insurance Coverage by Household Income in Tilghman Island
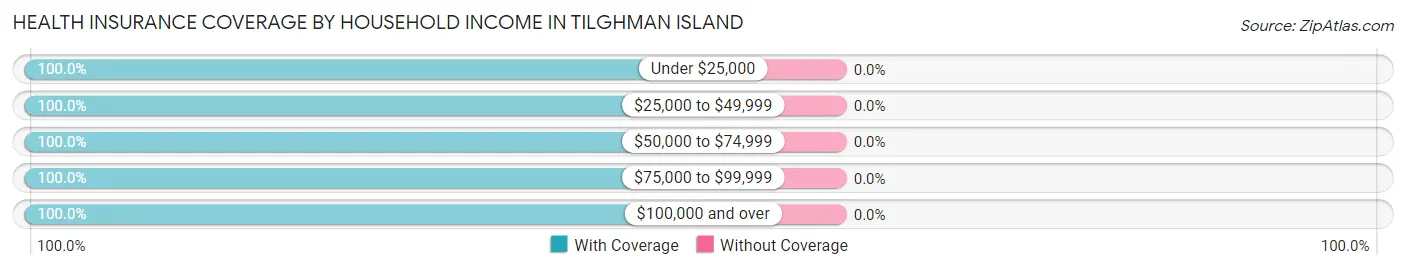
| Household Income | With Coverage | Without Coverage |
| Under $25,000 | 122 (100.0%) | 0 (0.0%) |
| $25,000 to $49,999 | 196 (100.0%) | 0 (0.0%) |
| $50,000 to $74,999 | 149 (100.0%) | 0 (0.0%) |
| $75,000 to $99,999 | 143 (100.0%) | 0 (0.0%) |
| $100,000 and over | 216 (100.0%) | 0 (0.0%) |
Public vs Private Health Insurance Coverage by Age in Tilghman Island
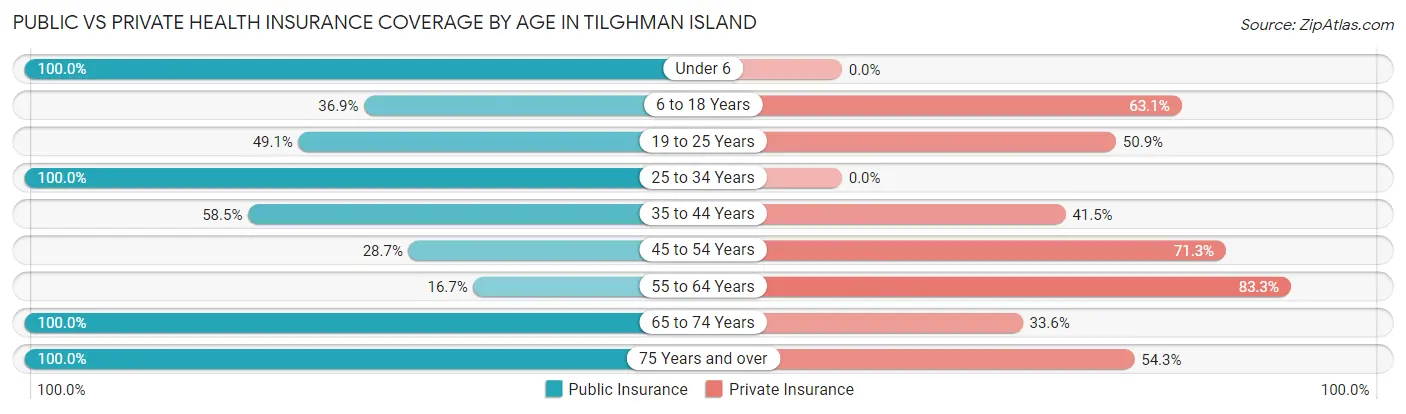
| Age Bracket | Public Insurance | Private Insurance |
| Under 6 | 11 (100.0%) | 0 (0.0%) |
| 6 to 18 Years | 41 (36.9%) | 70 (63.1%) |
| 19 to 25 Years | 28 (49.1%) | 29 (50.9%) |
| 25 to 34 Years | 54 (100.0%) | 0 (0.0%) |
| 35 to 44 Years | 31 (58.5%) | 22 (41.5%) |
| 45 to 54 Years | 31 (28.7%) | 77 (71.3%) |
| 55 to 64 Years | 35 (16.7%) | 175 (83.3%) |
| 65 to 74 Years | 152 (100.0%) | 51 (33.6%) |
| 75 Years and over | 70 (100.0%) | 38 (54.3%) |
| Total | 453 (54.8%) | 462 (55.9%) |
Disability Status by Sex by Age in Tilghman Island
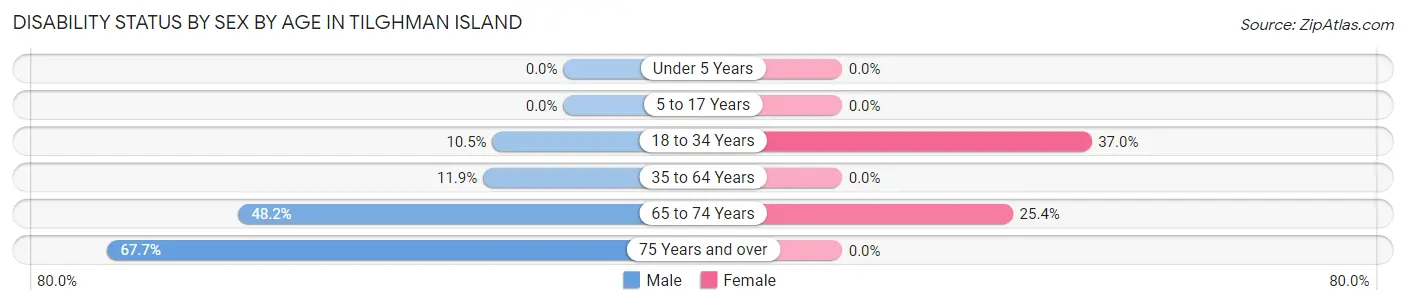
| Age Bracket | Male | Female |
| Under 5 Years | 0 (0.0%) | 0 (0.0%) |
| 5 to 17 Years | 0 (0.0%) | 0 (0.0%) |
| 18 to 34 Years | 6 (10.5%) | 20 (37.0%) |
| 35 to 64 Years | 21 (11.9%) | 0 (0.0%) |
| 65 to 74 Years | 41 (48.2%) | 17 (25.4%) |
| 75 Years and over | 44 (67.7%) | 0 (0.0%) |
Disability Class by Sex by Age in Tilghman Island
Disability Class: Hearing Difficulty
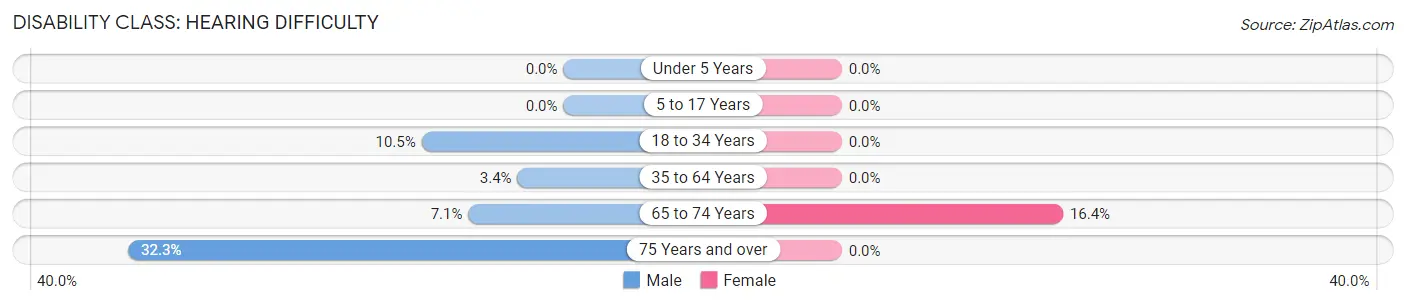
| Age Bracket | Male | Female |
| Under 5 Years | 0 (0.0%) | 0 (0.0%) |
| 5 to 17 Years | 0 (0.0%) | 0 (0.0%) |
| 18 to 34 Years | 6 (10.5%) | 0 (0.0%) |
| 35 to 64 Years | 6 (3.4%) | 0 (0.0%) |
| 65 to 74 Years | 6 (7.1%) | 11 (16.4%) |
| 75 Years and over | 21 (32.3%) | 0 (0.0%) |
Disability Class: Vision Difficulty
| Age Bracket | Male | Female |
| Under 5 Years | 0 (0.0%) | 0 (0.0%) |
| 5 to 17 Years | 0 (0.0%) | 0 (0.0%) |
| 18 to 34 Years | 0 (0.0%) | 0 (0.0%) |
| 35 to 64 Years | 0 (0.0%) | 0 (0.0%) |
| 65 to 74 Years | 0 (0.0%) | 0 (0.0%) |
| 75 Years and over | 0 (0.0%) | 0 (0.0%) |
Disability Class: Cognitive Difficulty
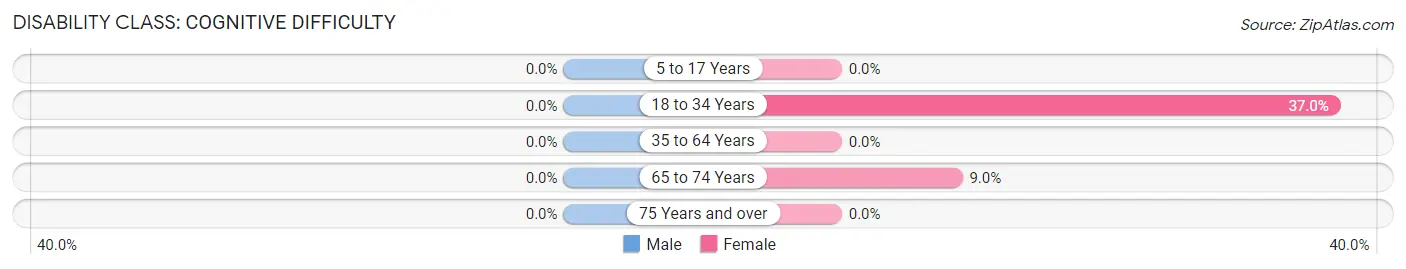
| Age Bracket | Male | Female |
| 5 to 17 Years | 0 (0.0%) | 0 (0.0%) |
| 18 to 34 Years | 0 (0.0%) | 20 (37.0%) |
| 35 to 64 Years | 0 (0.0%) | 0 (0.0%) |
| 65 to 74 Years | 0 (0.0%) | 6 (9.0%) |
| 75 Years and over | 0 (0.0%) | 0 (0.0%) |
Disability Class: Ambulatory Difficulty
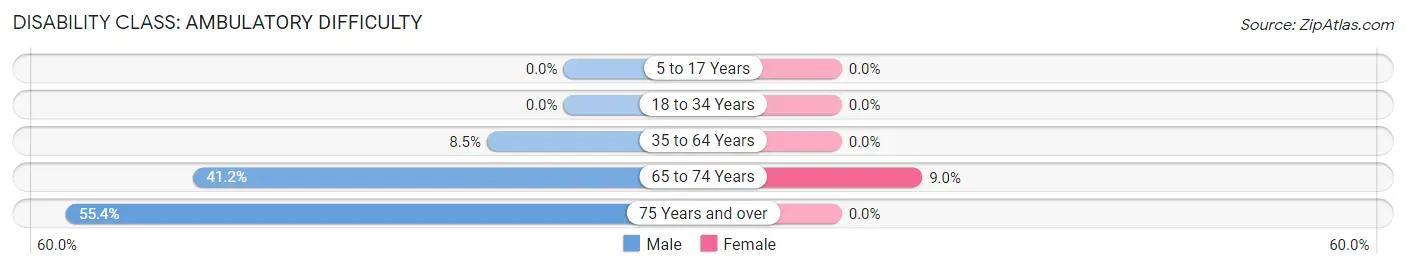
| Age Bracket | Male | Female |
| 5 to 17 Years | 0 (0.0%) | 0 (0.0%) |
| 18 to 34 Years | 0 (0.0%) | 0 (0.0%) |
| 35 to 64 Years | 15 (8.5%) | 0 (0.0%) |
| 65 to 74 Years | 35 (41.2%) | 6 (9.0%) |
| 75 Years and over | 36 (55.4%) | 0 (0.0%) |
Disability Class: Self-Care Difficulty
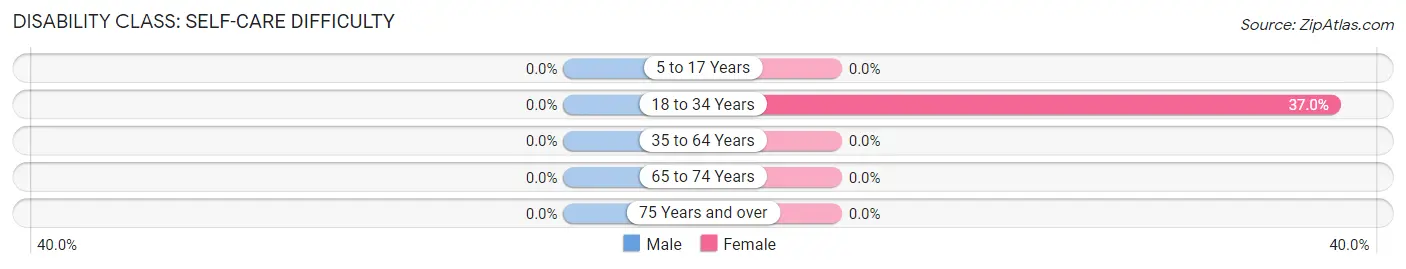
| Age Bracket | Male | Female |
| 5 to 17 Years | 0 (0.0%) | 0 (0.0%) |
| 18 to 34 Years | 0 (0.0%) | 20 (37.0%) |
| 35 to 64 Years | 0 (0.0%) | 0 (0.0%) |
| 65 to 74 Years | 0 (0.0%) | 0 (0.0%) |
| 75 Years and over | 0 (0.0%) | 0 (0.0%) |
Technology Access in Tilghman Island
Computing Device Access in Tilghman Island
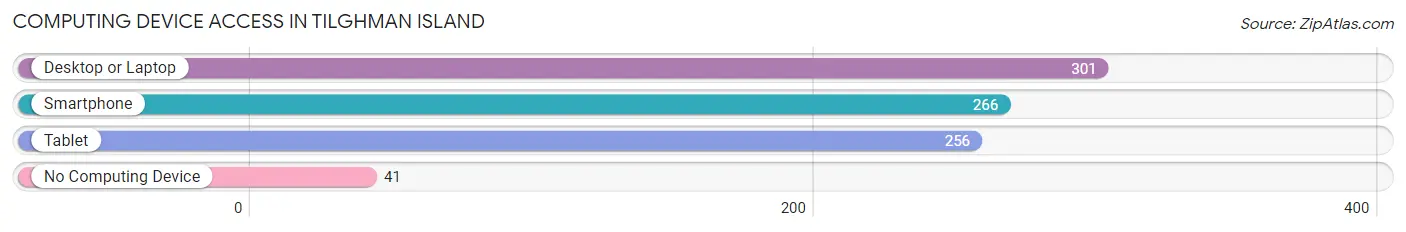
| Device Type | # Households | % Households |
| Desktop or Laptop | 301 | 80.3% |
| Smartphone | 266 | 70.9% |
| Tablet | 256 | 68.3% |
| No Computing Device | 41 | 10.9% |
| Total | 375 | 100.0% |
Internet Access in Tilghman Island
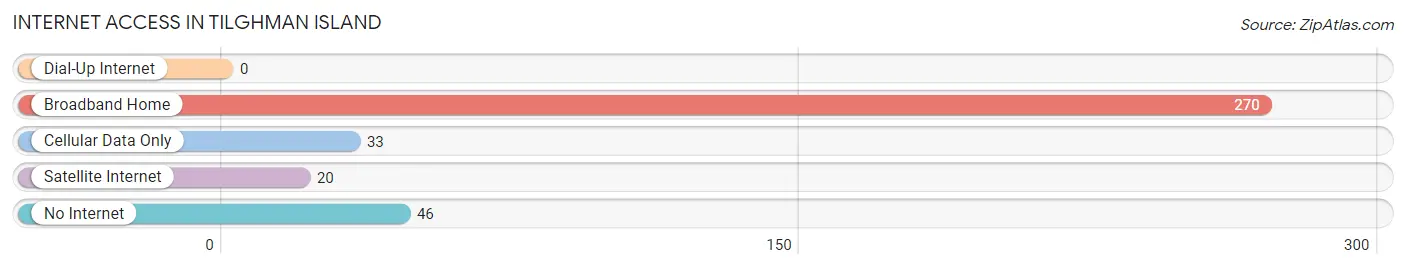
| Internet Type | # Households | % Households |
| Dial-Up Internet | 0 | 0.0% |
| Broadband Home | 270 | 72.0% |
| Cellular Data Only | 33 | 8.8% |
| Satellite Internet | 20 | 5.3% |
| No Internet | 46 | 12.3% |
| Total | 375 | 100.0% |
Tilghman Island Summary
Tilghman Island is a small island located in Talbot County, Maryland, United States. It is situated on the Chesapeake Bay, about two miles east of the town of Easton. The island is home to a small fishing village and is a popular tourist destination.
Geography
Tilghman Island is located in Talbot County, Maryland, on the Chesapeake Bay. It is approximately two miles east of the town of Easton. The island is approximately two miles long and one mile wide. It is bordered by the Choptank River to the north and the Miles River to the south. The island is connected to the mainland by a bridge that crosses the Choptank River.
The island is mostly flat, with an elevation of about 10 feet above sea level. The terrain is mostly marshland, with some areas of higher ground. The island is home to a variety of wildlife, including ospreys, bald eagles, and herons.
History
Tilghman Island has a long and rich history. The island was first settled by the English in the early 1600s. The island was named after Colonel Tench Tilghman, a Revolutionary War hero who was born on the island in 1744.
In the late 1800s, the island became a popular destination for tourists. The island was home to several resorts, including the Tilghman Island Hotel, which was built in 1891. The hotel was destroyed by a fire in the early 1900s.
In the early 1900s, the island became a popular destination for waterfowl hunters. The island was also home to several oyster packing houses, which were used to process and ship oysters to markets in Baltimore and other cities.
In the late 1900s, the island became a popular destination for recreational boaters. The island is home to several marinas, which offer boat slips and other services.
Economy
Tilghman Island has a small, but vibrant economy. The island is home to several businesses, including restaurants, marinas, and a variety of shops. The island is also home to several seafood processing plants, which process and ship oysters, crabs, and other seafood to markets in Baltimore and other cities.
The island is also home to several charter fishing operations, which offer fishing trips for tourists. The island is also home to several boatyards, which offer boat repair and maintenance services.
Demographics
As of the 2010 census, the population of Tilghman Island was 1,092. The population is predominantly white (94.3%), with a small percentage of African Americans (3.2%) and other races (2.5%). The median household income is $50,000, and the median age is 44.
Conclusion
Tilghman Island is a small island located in Talbot County, Maryland, United States. It is situated on the Chesapeake Bay, about two miles east of the town of Easton. The island is home to a small fishing village and is a popular tourist destination. The island has a long and rich history, and is home to a variety of businesses, including restaurants, marinas, and seafood processing plants. The population of Tilghman Island is predominantly white, with a median household income of $50,000 and a median age of 44.
Common Questions
What is Per Capita Income in Tilghman Island?
Per Capita income in Tilghman Island is $45,101.
What is the Median Family Income in Tilghman Island?
Median Family Income in Tilghman Island is $75,625.
What is the Median Household income in Tilghman Island?
Median Household Income in Tilghman Island is $55,208.
What is Inequality or Gini Index in Tilghman Island?
Inequality or Gini Index in Tilghman Island is 0.57.
What is the Total Population of Tilghman Island?
Total Population of Tilghman Island is 826.
What is the Total Male Population of Tilghman Island?
Total Male Population of Tilghman Island is 459.
What is the Total Female Population of Tilghman Island?
Total Female Population of Tilghman Island is 367.
What is the Ratio of Males per 100 Females in Tilghman Island?
There are 125.07 Males per 100 Females in Tilghman Island.
What is the Ratio of Females per 100 Males in Tilghman Island?
There are 79.96 Females per 100 Males in Tilghman Island.
What is the Median Population Age in Tilghman Island?
Median Population Age in Tilghman Island is 56.7 Years.
What is the Average Family Size in Tilghman Island
Average Family Size in Tilghman Island is 2.7 People.
What is the Average Household Size in Tilghman Island
Average Household Size in Tilghman Island is 2.2 People.
How Large is the Labor Force in Tilghman Island?
There are 367 People in the Labor Forcein in Tilghman Island.
What is the Percentage of People in the Labor Force in Tilghman Island?
48.6% of People are in the Labor Force in Tilghman Island.
What is the Unemployment Rate in Tilghman Island?
Unemployment Rate in Tilghman Island is 1.4%.