Essex, MA Map & Demographics
Essex Map
Essex Overview
$55,647
PER CAPITA INCOME
$152,083
AVG FAMILY INCOME
$143,615
AVG HOUSEHOLD INCOME
50.3%
WAGE / INCOME GAP [ % ]
49.7¢/ $1
WAGE / INCOME GAP [ $ ]
0.41
INEQUALITY / GINI INDEX
1,880
TOTAL POPULATION
930
MALE POPULATION
950
FEMALE POPULATION
97.89
MALES / 100 FEMALES
102.15
FEMALES / 100 MALES
39.4
MEDIAN AGE
3.3
AVG FAMILY SIZE
2.8
AVG HOUSEHOLD SIZE
1,090
LABOR FORCE [ PEOPLE ]
75.1%
PERCENT IN LABOR FORCE
1.1%
UNEMPLOYMENT RATE
Essex Zip Codes
Essex Area Codes
Income in Essex
Income Overview in Essex
Per Capita Income in Essex is $55,647, while median incomes of families and households are $152,083 and $143,615 respectively.
| Characteristic | Number | Measure |
| Per Capita Income | 1,880 | $55,647 |
| Median Family Income | 493 | $152,083 |
| Mean Family Income | 493 | $170,521 |
| Median Household Income | 669 | $143,615 |
| Mean Household Income | 669 | $153,763 |
| Income Deficit | 493 | $0 |
| Wage / Income Gap (%) | 1,880 | 50.34% |
| Wage / Income Gap ($) | 1,880 | 49.66¢ per $1 |
| Gini / Inequality Index | 1,880 | 0.41 |
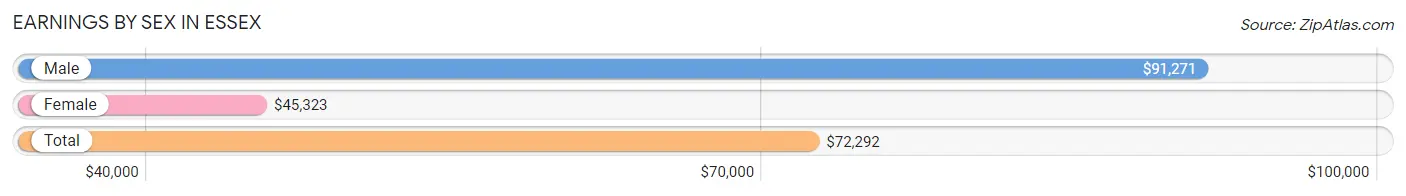
Earnings by Sex in Essex
Average Earnings in Essex are $72,292, $91,271 for men and $45,323 for women, a difference of 50.3%.
| Sex | Number | Average Earnings |
| Male | 549 (46.9%) | $91,271 |
| Female | 622 (53.1%) | $45,323 |
| Total | 1,171 (100.0%) | $72,292 |
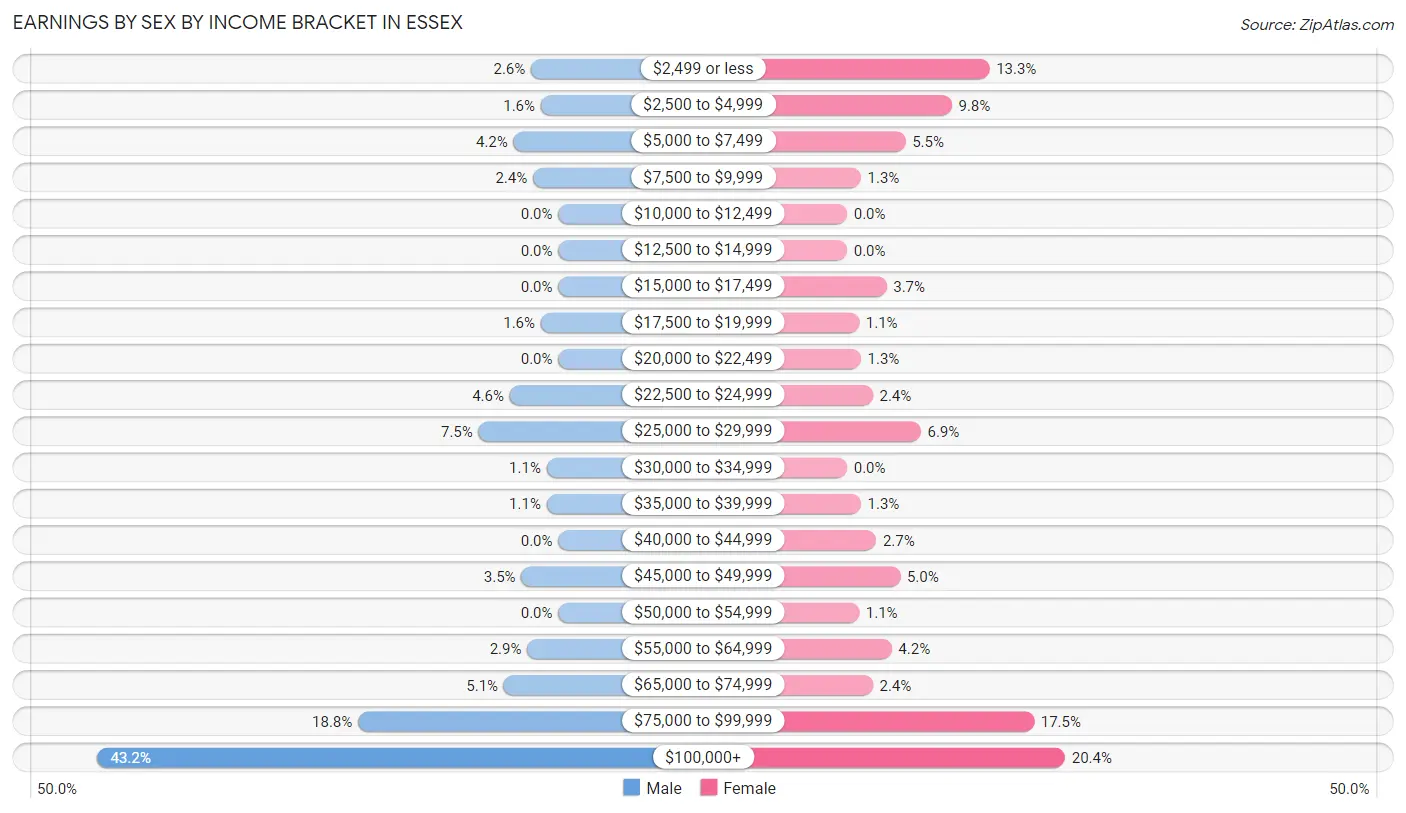
Earnings by Sex by Income Bracket in Essex
The most common earnings brackets in Essex are $100,000+ for men (237 | 43.2%) and $100,000+ for women (127 | 20.4%).
| Income | Male | Female |
| $2,499 or less | 14 (2.5%) | 83 (13.3%) |
| $2,500 to $4,999 | 9 (1.6%) | 61 (9.8%) |
| $5,000 to $7,499 | 23 (4.2%) | 34 (5.5%) |
| $7,500 to $9,999 | 13 (2.4%) | 8 (1.3%) |
| $10,000 to $12,499 | 0 (0.0%) | 0 (0.0%) |
| $12,500 to $14,999 | 0 (0.0%) | 0 (0.0%) |
| $15,000 to $17,499 | 0 (0.0%) | 23 (3.7%) |
| $17,500 to $19,999 | 9 (1.6%) | 7 (1.1%) |
| $20,000 to $22,499 | 0 (0.0%) | 8 (1.3%) |
| $22,500 to $24,999 | 25 (4.5%) | 15 (2.4%) |
| $25,000 to $29,999 | 41 (7.5%) | 43 (6.9%) |
| $30,000 to $34,999 | 6 (1.1%) | 0 (0.0%) |
| $35,000 to $39,999 | 6 (1.1%) | 8 (1.3%) |
| $40,000 to $44,999 | 0 (0.0%) | 17 (2.7%) |
| $45,000 to $49,999 | 19 (3.5%) | 31 (5.0%) |
| $50,000 to $54,999 | 0 (0.0%) | 7 (1.1%) |
| $55,000 to $64,999 | 16 (2.9%) | 26 (4.2%) |
| $65,000 to $74,999 | 28 (5.1%) | 15 (2.4%) |
| $75,000 to $99,999 | 103 (18.8%) | 109 (17.5%) |
| $100,000+ | 237 (43.2%) | 127 (20.4%) |
| Total | 549 (100.0%) | 622 (100.0%) |
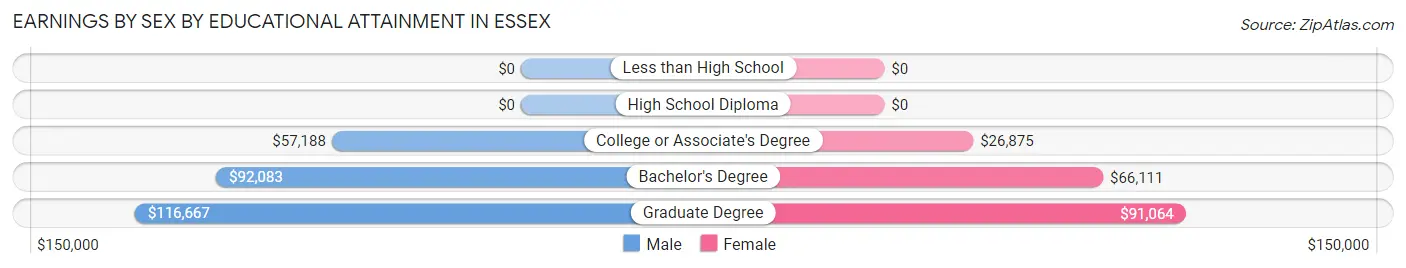
Earnings by Sex by Educational Attainment in Essex
Average earnings in Essex are $91,979 for men and $71,458 for women, a difference of 22.3%. Men with an educational attainment of graduate degree enjoy the highest average annual earnings of $116,667, while those with college or associate's degree education earn the least with $57,188. Women with an educational attainment of graduate degree earn the most with the average annual earnings of $91,064, while those with college or associate's degree education have the smallest earnings of $26,875.
| Educational Attainment | Male Income | Female Income |
| Less than High School | - | - |
| High School Diploma | - | - |
| College or Associate's Degree | $57,188 | $26,875 |
| Bachelor's Degree | $92,083 | $66,111 |
| Graduate Degree | $116,667 | $91,064 |
| Total | $91,979 | $71,458 |
Family Income in Essex
Family Income Brackets in Essex
According to the Essex family income data, there are 130 families falling into the $150,000 to $199,999 income range, which is the most common income bracket and makes up 26.4% of all families.
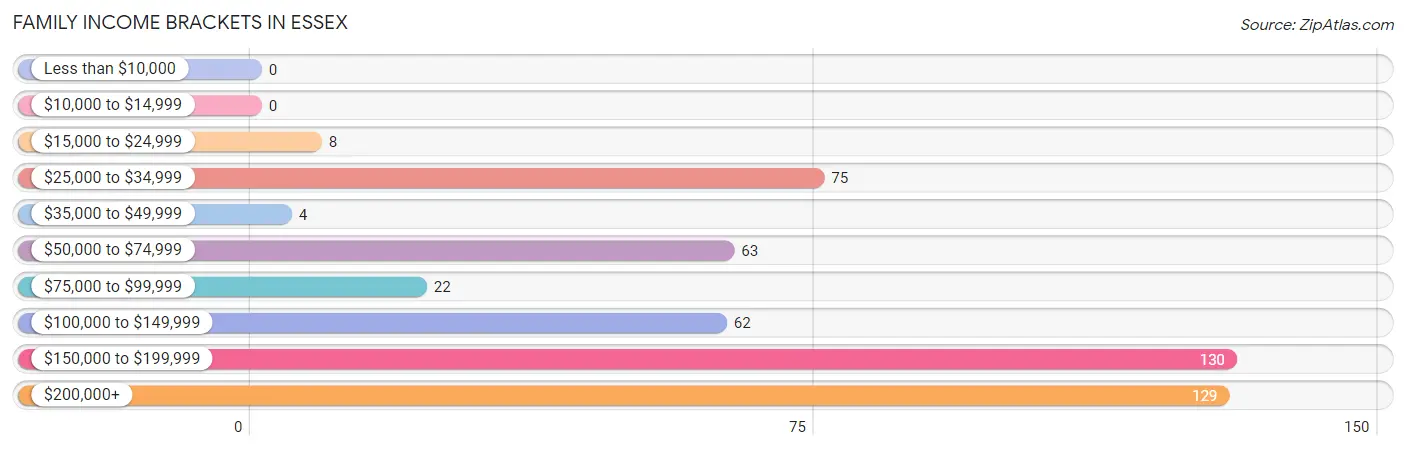
| Income Bracket | # Families | % Families |
| Less than $10,000 | 0 | 0.0% |
| $10,000 to $14,999 | 0 | 0.0% |
| $15,000 to $24,999 | 8 | 1.6% |
| $25,000 to $34,999 | 75 | 15.2% |
| $35,000 to $49,999 | 4 | 0.8% |
| $50,000 to $74,999 | 63 | 12.8% |
| $75,000 to $99,999 | 22 | 4.5% |
| $100,000 to $149,999 | 62 | 12.6% |
| $150,000 to $199,999 | 130 | 26.4% |
| $200,000+ | 129 | 26.2% |
Family Income by Famaliy Size in Essex
4-person families (146 | 29.6%) account for the highest median family income in Essex with $217,500 per family, while 4-person families (146 | 29.6%) have the highest median income of $54,375 per family member.
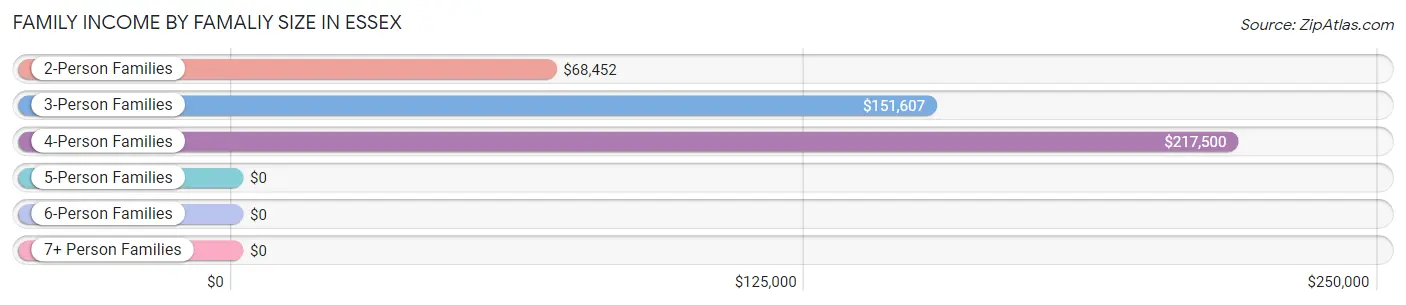
| Income Bracket | # Families | Median Income |
| 2-Person Families | 190 (38.5%) | $68,452 |
| 3-Person Families | 91 (18.5%) | $151,607 |
| 4-Person Families | 146 (29.6%) | $217,500 |
| 5-Person Families | 19 (3.8%) | $0 |
| 6-Person Families | 47 (9.5%) | $0 |
| 7+ Person Families | 0 (0.0%) | $0 |
| Total | 493 (100.0%) | $152,083 |
Family Income by Number of Earners in Essex
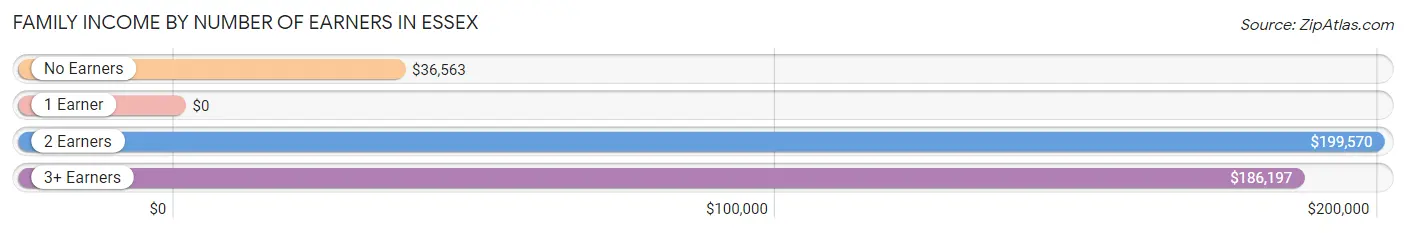
| Number of Earners | # Families | Median Income |
| No Earners | 43 (8.7%) | $36,563 |
| 1 Earner | 114 (23.1%) | $0 |
| 2 Earners | 243 (49.3%) | $199,570 |
| 3+ Earners | 93 (18.9%) | $186,197 |
| Total | 493 (100.0%) | $152,083 |
Household Income in Essex
Household Income Brackets in Essex
With 153 households falling in the category, the $200,000+ income range is the most frequent in Essex, accounting for 22.9% of all households.
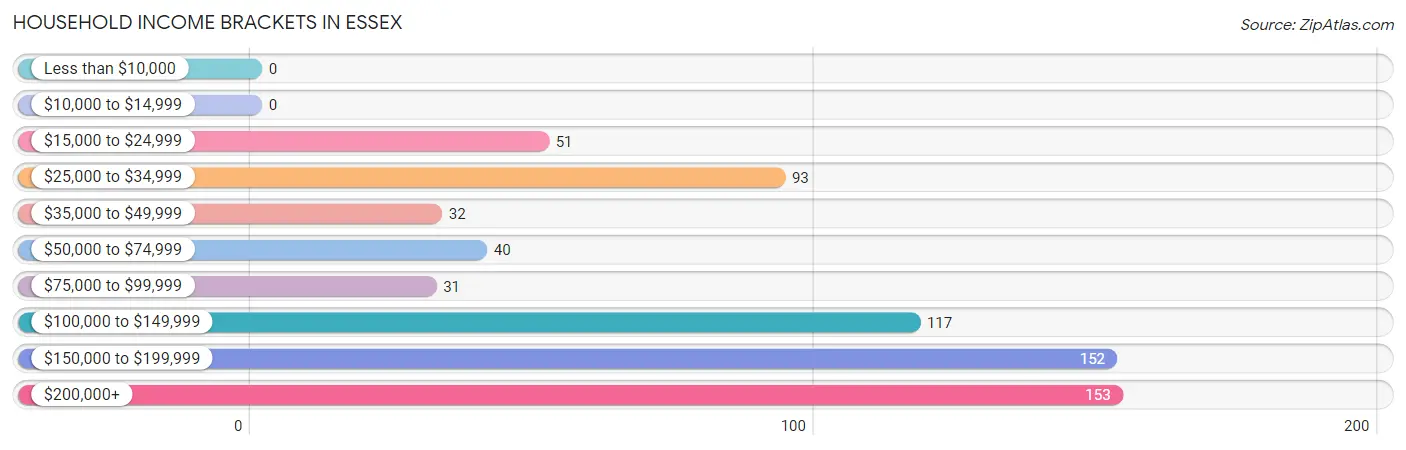
| Income Bracket | # Households | % Households |
| Less than $10,000 | 0 | 0.0% |
| $10,000 to $14,999 | 0 | 0.0% |
| $15,000 to $24,999 | 51 | 7.6% |
| $25,000 to $34,999 | 93 | 13.9% |
| $35,000 to $49,999 | 32 | 4.8% |
| $50,000 to $74,999 | 40 | 6.0% |
| $75,000 to $99,999 | 31 | 4.6% |
| $100,000 to $149,999 | 117 | 17.5% |
| $150,000 to $199,999 | 152 | 22.7% |
| $200,000+ | 153 | 22.9% |
Household Income by Householder Age in Essex
The median household income in Essex is $143,615, with the highest median household income of $173,913 found in the 45 to 64 years age bracket for the primary householder. A total of 334 households (49.9%) fall into this category.
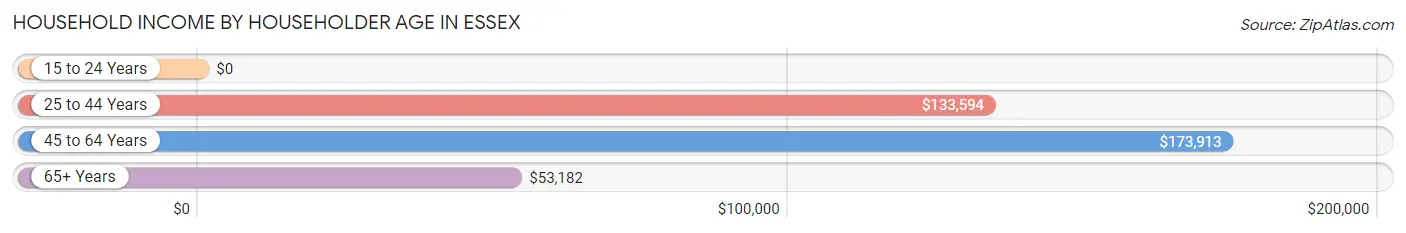
| Income Bracket | # Households | Median Income |
| 15 to 24 Years | 0 (0.0%) | $0 |
| 25 to 44 Years | 169 (25.3%) | $133,594 |
| 45 to 64 Years | 334 (49.9%) | $173,913 |
| 65+ Years | 166 (24.8%) | $53,182 |
| Total | 669 (100.0%) | $143,615 |
Poverty in Essex
Income Below Poverty by Sex and Age in Essex
With 14.3% poverty level for males and 4.5% for females among the residents of Essex, 15 year old males and 35 to 44 year old females are the most vulnerable to poverty, with 8 males (100.0%) and 31 females (25.6%) in their respective age groups living below the poverty level.
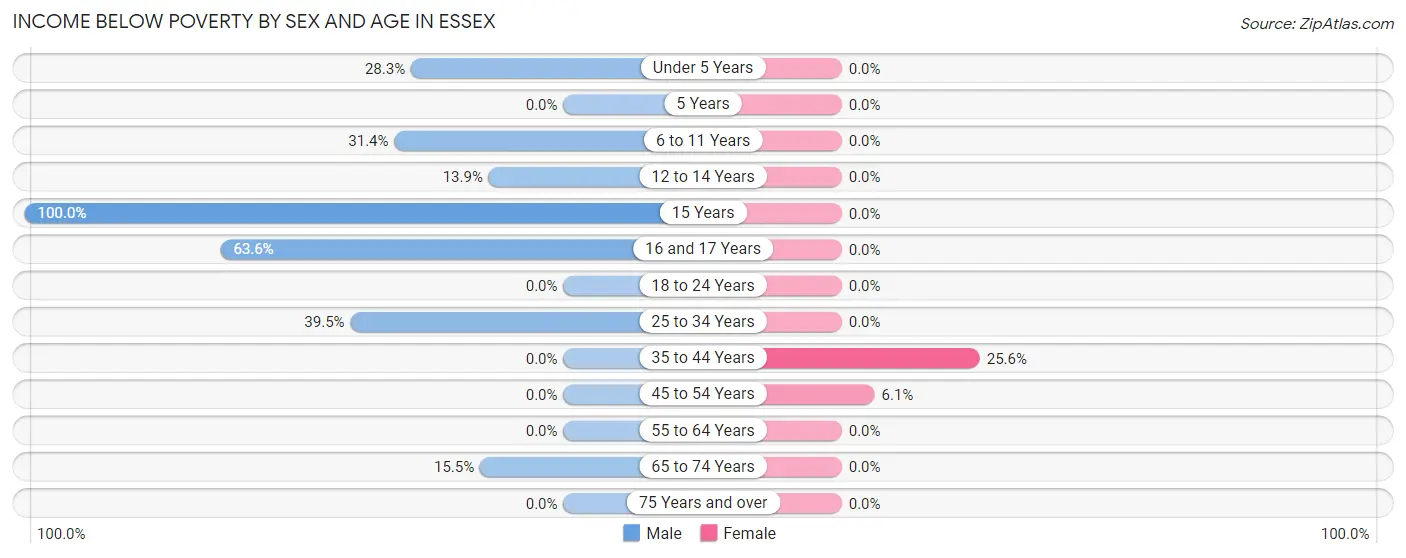
| Age Bracket | Male | Female |
| Under 5 Years | 28 (28.3%) | 0 (0.0%) |
| 5 Years | 0 (0.0%) | 0 (0.0%) |
| 6 to 11 Years | 32 (31.4%) | 0 (0.0%) |
| 12 to 14 Years | 9 (13.9%) | 0 (0.0%) |
| 15 Years | 8 (100.0%) | 0 (0.0%) |
| 16 and 17 Years | 7 (63.6%) | 0 (0.0%) |
| 18 to 24 Years | 0 (0.0%) | 0 (0.0%) |
| 25 to 34 Years | 34 (39.5%) | 0 (0.0%) |
| 35 to 44 Years | 0 (0.0%) | 31 (25.6%) |
| 45 to 54 Years | 0 (0.0%) | 12 (6.1%) |
| 55 to 64 Years | 0 (0.0%) | 0 (0.0%) |
| 65 to 74 Years | 15 (15.5%) | 0 (0.0%) |
| 75 Years and over | 0 (0.0%) | 0 (0.0%) |
| Total | 133 (14.3%) | 43 (4.5%) |
Income Above Poverty by Sex and Age in Essex
According to the poverty statistics in Essex, males aged 5 years and females aged under 5 years are the age groups that are most secure financially, with 100.0% of males and 100.0% of females in these age groups living above the poverty line.
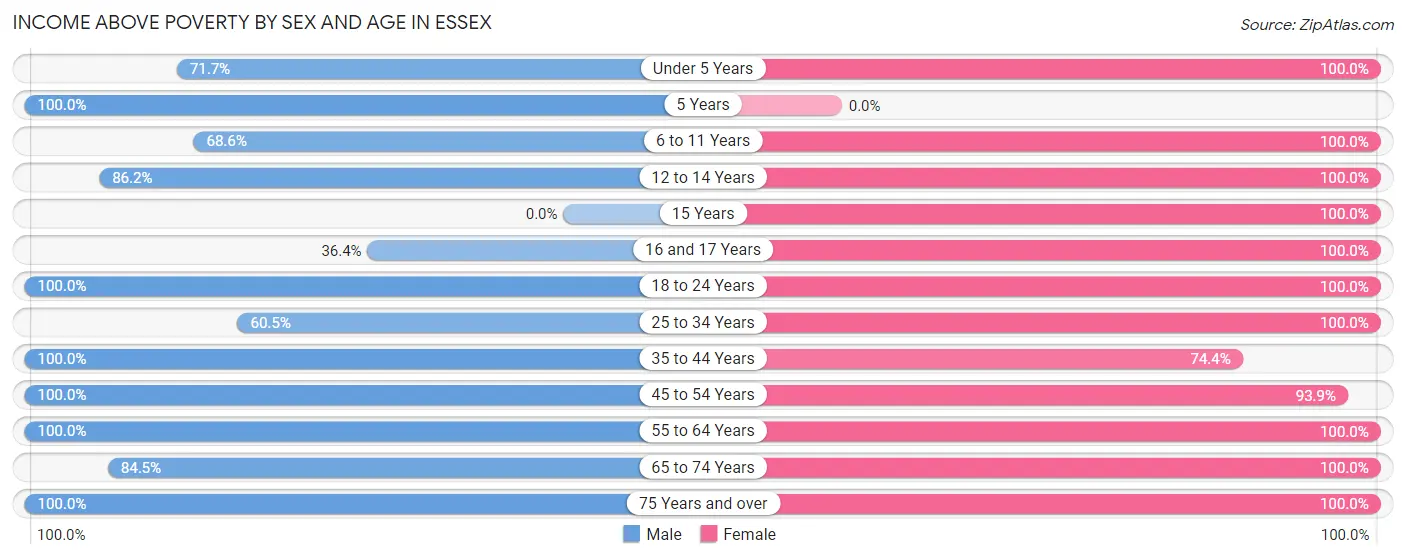
| Age Bracket | Male | Female |
| Under 5 Years | 71 (71.7%) | 63 (100.0%) |
| 5 Years | 9 (100.0%) | 0 (0.0%) |
| 6 to 11 Years | 70 (68.6%) | 21 (100.0%) |
| 12 to 14 Years | 56 (86.2%) | 9 (100.0%) |
| 15 Years | 0 (0.0%) | 53 (100.0%) |
| 16 and 17 Years | 4 (36.4%) | 114 (100.0%) |
| 18 to 24 Years | 23 (100.0%) | 31 (100.0%) |
| 25 to 34 Years | 52 (60.5%) | 82 (100.0%) |
| 35 to 44 Years | 108 (100.0%) | 90 (74.4%) |
| 45 to 54 Years | 149 (100.0%) | 185 (93.9%) |
| 55 to 64 Years | 130 (100.0%) | 131 (100.0%) |
| 65 to 74 Years | 82 (84.5%) | 55 (100.0%) |
| 75 Years and over | 43 (100.0%) | 73 (100.0%) |
| Total | 797 (85.7%) | 907 (95.5%) |
Income Below Poverty Among Married-Couple Families in Essex
The poverty statistics for married-couple families in Essex show that 8.5% or 34 of the total 398 families live below the poverty line. Families with 1 or 2 children have the highest poverty rate of 17.0%, comprising of 34 families. On the other hand, families with no children have the lowest poverty rate of 0.0%, which includes 0 families.
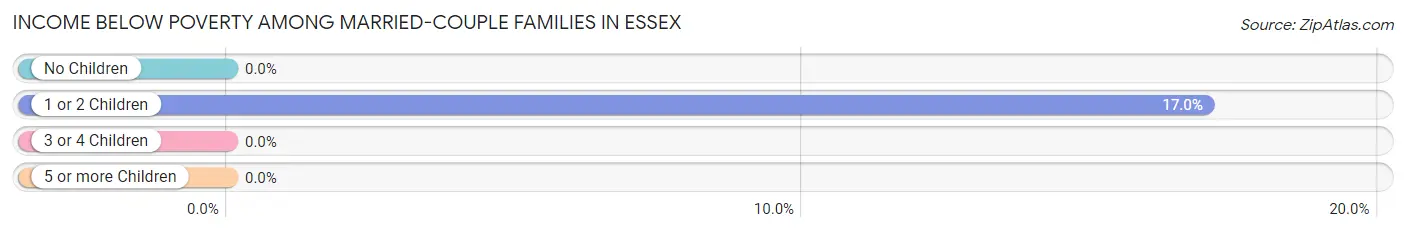
| Children | Above Poverty | Below Poverty |
| No Children | 141 (100.0%) | 0 (0.0%) |
| 1 or 2 Children | 166 (83.0%) | 34 (17.0%) |
| 3 or 4 Children | 57 (100.0%) | 0 (0.0%) |
| 5 or more Children | 0 (0.0%) | 0 (0.0%) |
| Total | 364 (91.5%) | 34 (8.5%) |
Income Below Poverty Among Single-Parent Households in Essex
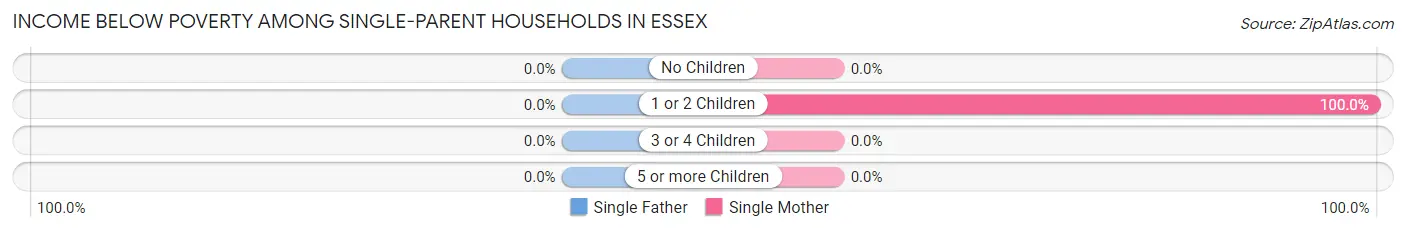
| Children | Single Father | Single Mother |
| No Children | 0 (0.0%) | 0 (0.0%) |
| 1 or 2 Children | 0 (0.0%) | 8 (100.0%) |
| 3 or 4 Children | 0 (0.0%) | 0 (0.0%) |
| 5 or more Children | 0 (0.0%) | 0 (0.0%) |
| Total | 0 (0.0%) | 8 (15.4%) |
Income Below Poverty Among Married-Couple vs Single-Parent Households in Essex
The poverty data for Essex shows that 34 of the married-couple family households (8.5%) and 8 of the single-parent households (8.4%) are living below the poverty level. Within the married-couple family households, those with 1 or 2 children have the highest poverty rate, with 34 households (17.0%) falling below the poverty line. Among the single-parent households, those with 1 or 2 children have the highest poverty rate, with 8 household (57.1%) living below poverty.
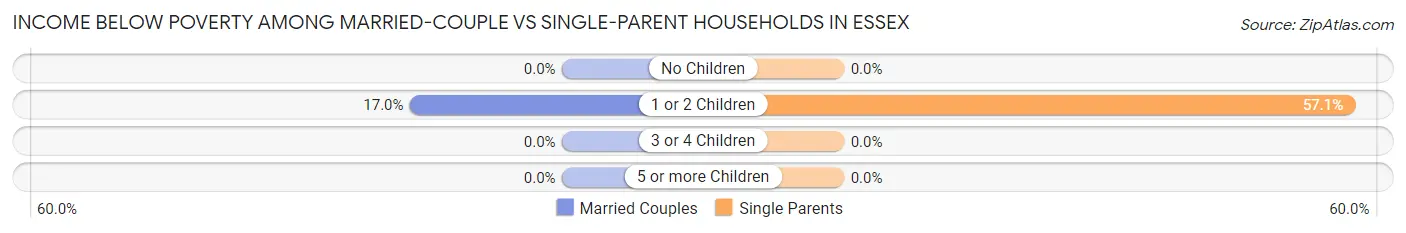
| Children | Married-Couple Families | Single-Parent Households |
| No Children | 0 (0.0%) | 0 (0.0%) |
| 1 or 2 Children | 34 (17.0%) | 8 (57.1%) |
| 3 or 4 Children | 0 (0.0%) | 0 (0.0%) |
| 5 or more Children | 0 (0.0%) | 0 (0.0%) |
| Total | 34 (8.5%) | 8 (8.4%) |
Race in Essex
The most populous races in Essex are White / Caucasian (1,864 | 99.2%), Hispanic or Latino (16 | 0.9%), and Two or more Races (8 | 0.4%).
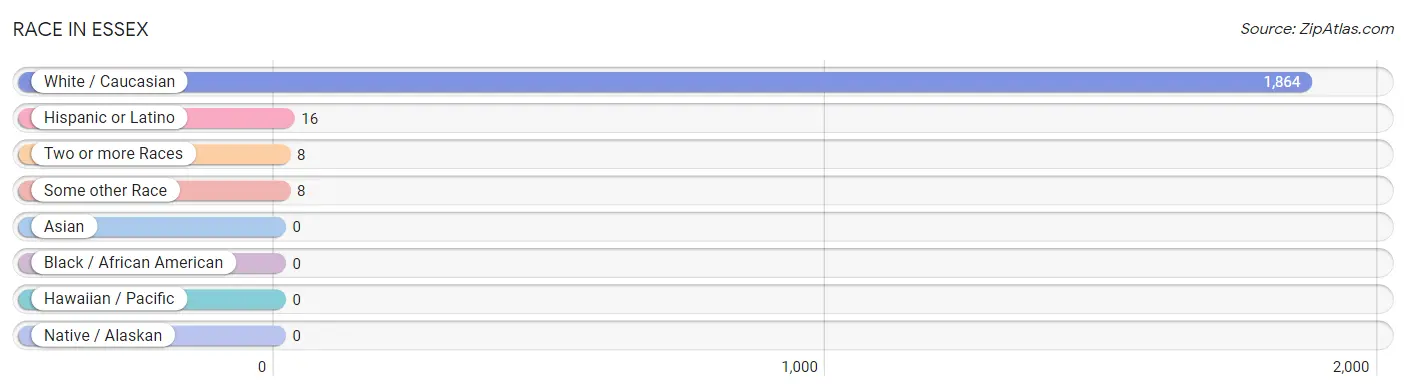
| Race | # Population | % Population |
| Asian | 0 | 0.0% |
| Black / African American | 0 | 0.0% |
| Hawaiian / Pacific | 0 | 0.0% |
| Hispanic or Latino | 16 | 0.9% |
| Native / Alaskan | 0 | 0.0% |
| White / Caucasian | 1,864 | 99.2% |
| Two or more Races | 8 | 0.4% |
| Some other Race | 8 | 0.4% |
| Total | 1,880 | 100.0% |
Ancestry in Essex
The most populous ancestries reported in Essex are English (453 | 24.1%), Irish (220 | 11.7%), Italian (198 | 10.5%), French Canadian (95 | 5.1%), and Scottish (78 | 4.2%), together accounting for 55.5% of all Essex residents.
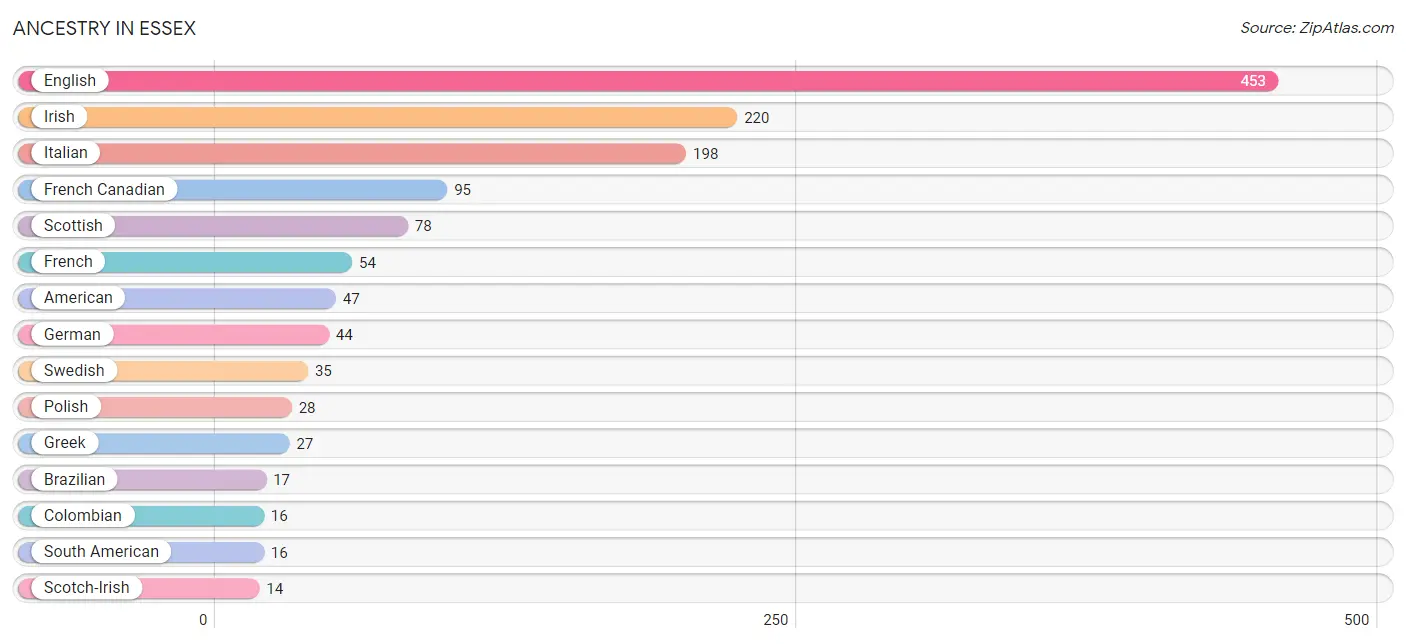
| Ancestry | # Population | % Population |
| American | 47 | 2.5% |
| Austrian | 6 | 0.3% |
| Brazilian | 17 | 0.9% |
| Burmese | 8 | 0.4% |
| Canadian | 5 | 0.3% |
| Colombian | 16 | 0.9% |
| Dutch | 12 | 0.6% |
| Eastern European | 11 | 0.6% |
| English | 453 | 24.1% |
| European | 13 | 0.7% |
| French | 54 | 2.9% |
| French Canadian | 95 | 5.1% |
| German | 44 | 2.3% |
| Greek | 27 | 1.4% |
| Irish | 220 | 11.7% |
| Italian | 198 | 10.5% |
| Polish | 28 | 1.5% |
| Scotch-Irish | 14 | 0.7% |
| Scottish | 78 | 4.2% |
| South American | 16 | 0.9% |
| Swedish | 35 | 1.9% | View All 21 Rows |
Immigrants in Essex
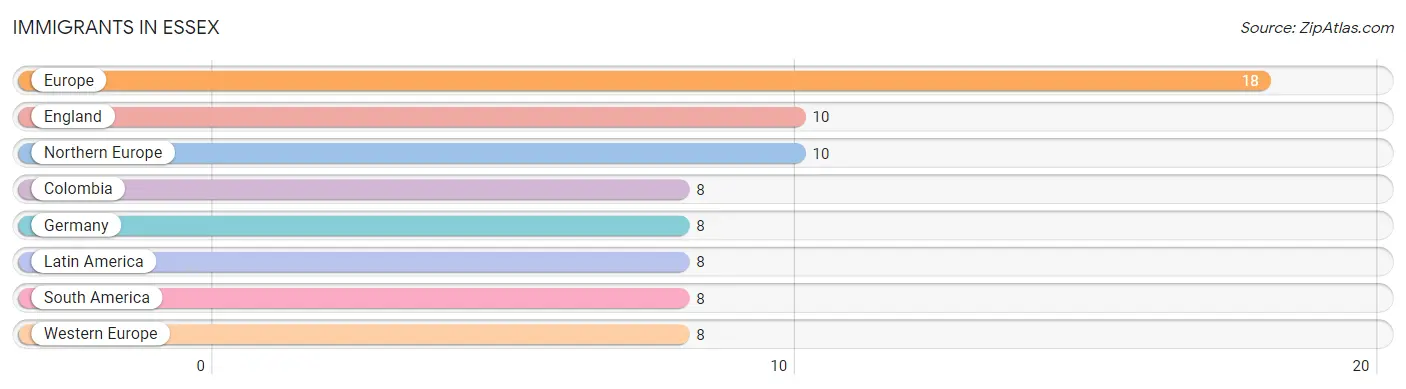
The most numerous immigrant groups reported in Essex came from Europe (18 | 1.0%), England (10 | 0.5%), Northern Europe (10 | 0.5%), Colombia (8 | 0.4%), and Germany (8 | 0.4%), together accounting for 2.9% of all Essex residents.
| Immigration Origin | # Population | % Population |
| Colombia | 8 | 0.4% |
| England | 10 | 0.5% |
| Europe | 18 | 1.0% |
| Germany | 8 | 0.4% |
| Latin America | 8 | 0.4% |
| Northern Europe | 10 | 0.5% |
| South America | 8 | 0.4% |
| Western Europe | 8 | 0.4% | View All 8 Rows |
Sex and Age in Essex
Sex and Age in Essex
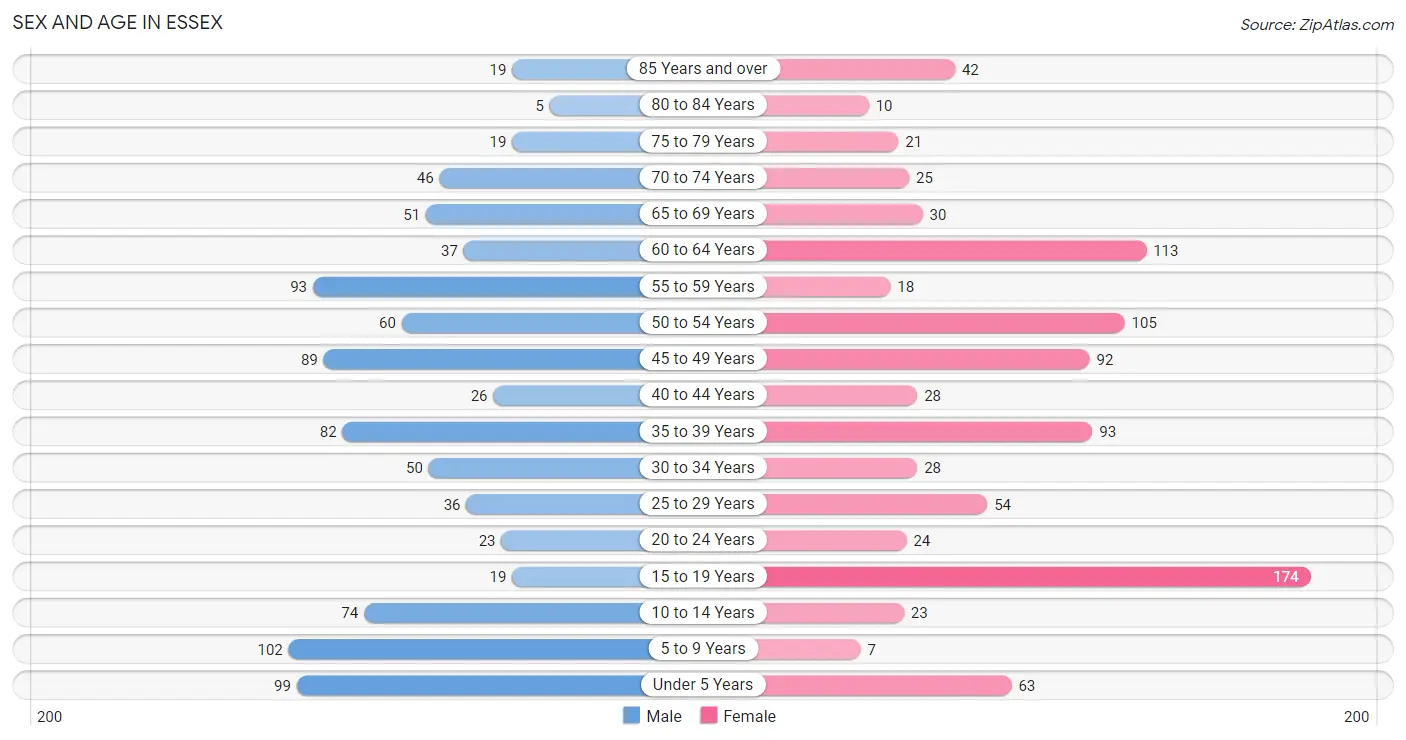
The most populous age groups in Essex are 5 to 9 Years (102 | 11.0%) for men and 15 to 19 Years (174 | 18.3%) for women.
| Age Bracket | Male | Female |
| Under 5 Years | 99 (10.6%) | 63 (6.6%) |
| 5 to 9 Years | 102 (11.0%) | 7 (0.7%) |
| 10 to 14 Years | 74 (8.0%) | 23 (2.4%) |
| 15 to 19 Years | 19 (2.0%) | 174 (18.3%) |
| 20 to 24 Years | 23 (2.5%) | 24 (2.5%) |
| 25 to 29 Years | 36 (3.9%) | 54 (5.7%) |
| 30 to 34 Years | 50 (5.4%) | 28 (2.9%) |
| 35 to 39 Years | 82 (8.8%) | 93 (9.8%) |
| 40 to 44 Years | 26 (2.8%) | 28 (2.9%) |
| 45 to 49 Years | 89 (9.6%) | 92 (9.7%) |
| 50 to 54 Years | 60 (6.5%) | 105 (11.1%) |
| 55 to 59 Years | 93 (10.0%) | 18 (1.9%) |
| 60 to 64 Years | 37 (4.0%) | 113 (11.9%) |
| 65 to 69 Years | 51 (5.5%) | 30 (3.2%) |
| 70 to 74 Years | 46 (5.0%) | 25 (2.6%) |
| 75 to 79 Years | 19 (2.0%) | 21 (2.2%) |
| 80 to 84 Years | 5 (0.5%) | 10 (1.1%) |
| 85 Years and over | 19 (2.0%) | 42 (4.4%) |
| Total | 930 (100.0%) | 950 (100.0%) |
Families and Households in Essex
Median Family Size in Essex
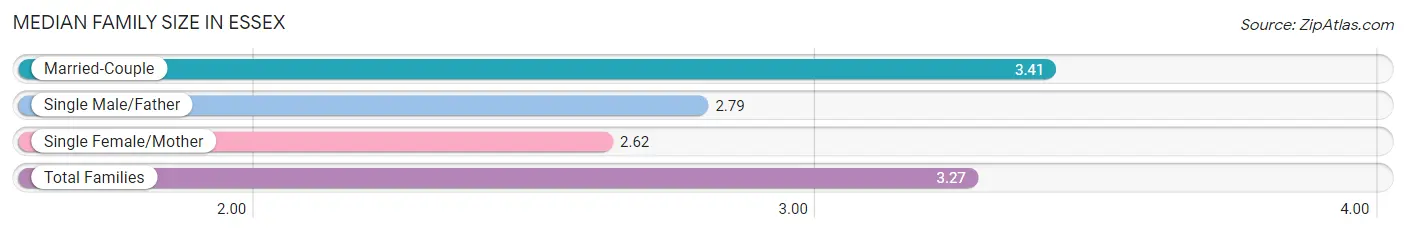
The median family size in Essex is 3.27 persons per family, with married-couple families (398 | 80.7%) accounting for the largest median family size of 3.41 persons per family. On the other hand, single female/mother families (52 | 10.5%) represent the smallest median family size with 2.62 persons per family.
| Family Type | # Families | Family Size |
| Married-Couple | 398 (80.7%) | 3.41 |
| Single Male/Father | 43 (8.7%) | 2.79 |
| Single Female/Mother | 52 (10.5%) | 2.62 |
| Total Families | 493 (100.0%) | 3.27 |
Median Household Size in Essex
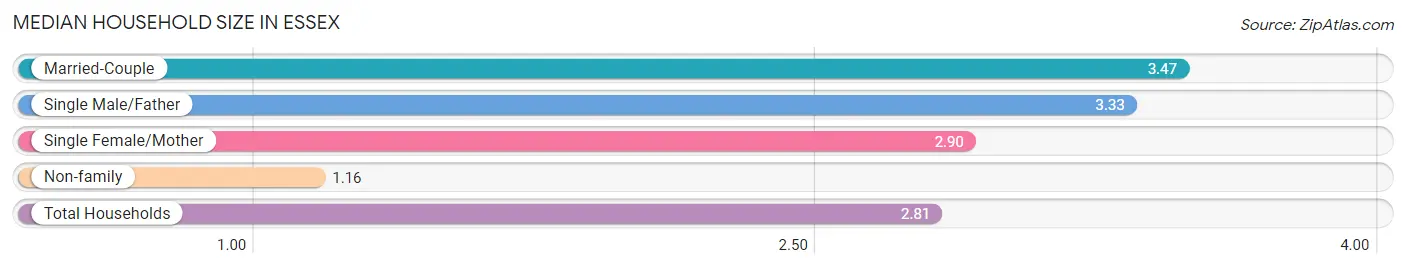
The median household size in Essex is 2.81 persons per household, with married-couple households (398 | 59.5%) accounting for the largest median household size of 3.47 persons per household. non-family households (176 | 26.3%) represent the smallest median household size with 1.16 persons per household.
| Household Type | # Households | Household Size |
| Married-Couple | 398 (59.5%) | 3.47 |
| Single Male/Father | 43 (6.4%) | 3.33 |
| Single Female/Mother | 52 (7.8%) | 2.90 |
| Non-family | 176 (26.3%) | 1.16 |
| Total Households | 669 (100.0%) | 2.81 |
Household Size by Marriage Status in Essex
Out of a total of 669 households in Essex, 493 (73.7%) are family households, while 176 (26.3%) are nonfamily households. The most numerous type of family households are 4-person households, comprising 159, and the most common type of nonfamily households are 1-person households, comprising 165.
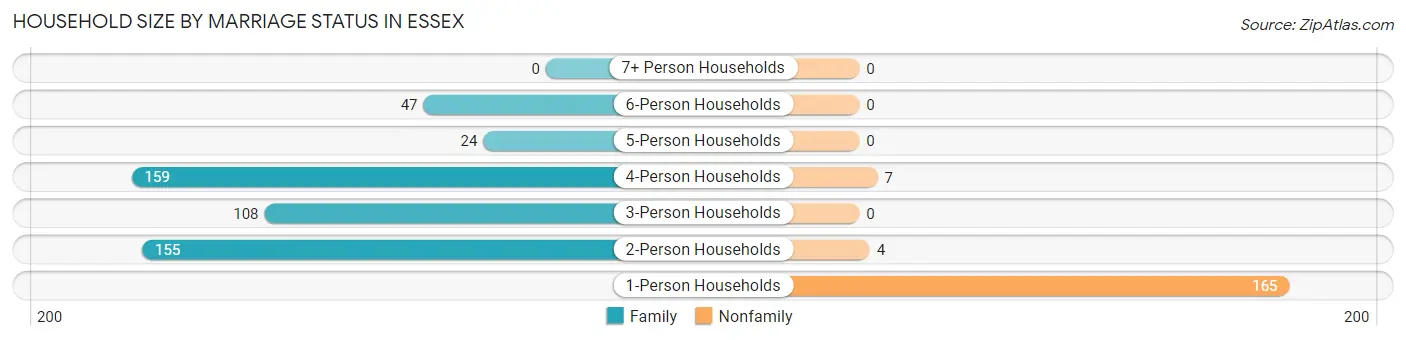
| Household Size | Family Households | Nonfamily Households |
| 1-Person Households | - | 165 (24.7%) |
| 2-Person Households | 155 (23.2%) | 4 (0.6%) |
| 3-Person Households | 108 (16.1%) | 0 (0.0%) |
| 4-Person Households | 159 (23.8%) | 7 (1.1%) |
| 5-Person Households | 24 (3.6%) | 0 (0.0%) |
| 6-Person Households | 47 (7.0%) | 0 (0.0%) |
| 7+ Person Households | 0 (0.0%) | 0 (0.0%) |
| Total | 493 (73.7%) | 176 (26.3%) |
Female Fertility in Essex
Fertility by Age in Essex
Average fertility rate in Essex is 42.0 births per 1,000 women. Women in the age bracket of 20 to 34 years have the highest fertility rate with 198.0 births per 1,000 women. Women in the age bracket of 20 to 34 years acount for 100.0% of all women with births.
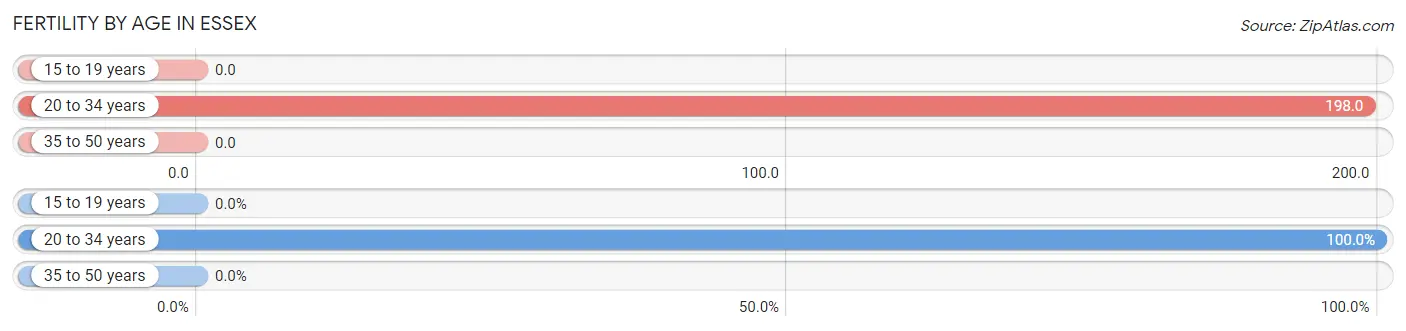
| Age Bracket | Women with Births | Births / 1,000 Women |
| 15 to 19 years | 0 (0.0%) | 0.0 |
| 20 to 34 years | 21 (100.0%) | 198.0 |
| 35 to 50 years | 0 (0.0%) | 0.0 |
| Total | 21 (100.0%) | 42.0 |
Fertility by Age by Marriage Status in Essex
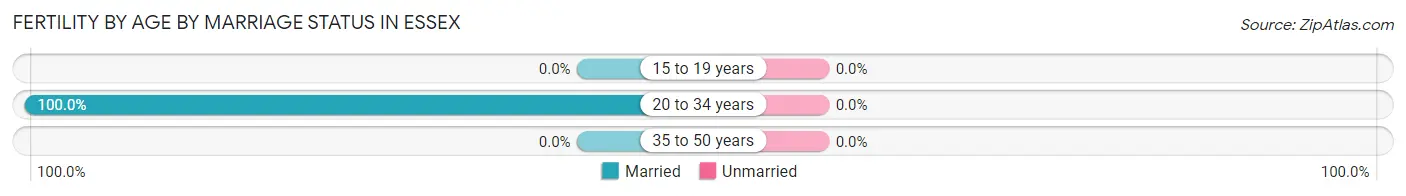
| Age Bracket | Married | Unmarried |
| 15 to 19 years | 0 (0.0%) | 0 (0.0%) |
| 20 to 34 years | 21 (100.0%) | 0 (0.0%) |
| 35 to 50 years | 0 (0.0%) | 0 (0.0%) |
| Total | 21 (100.0%) | 0 (0.0%) |
Fertility by Education in Essex
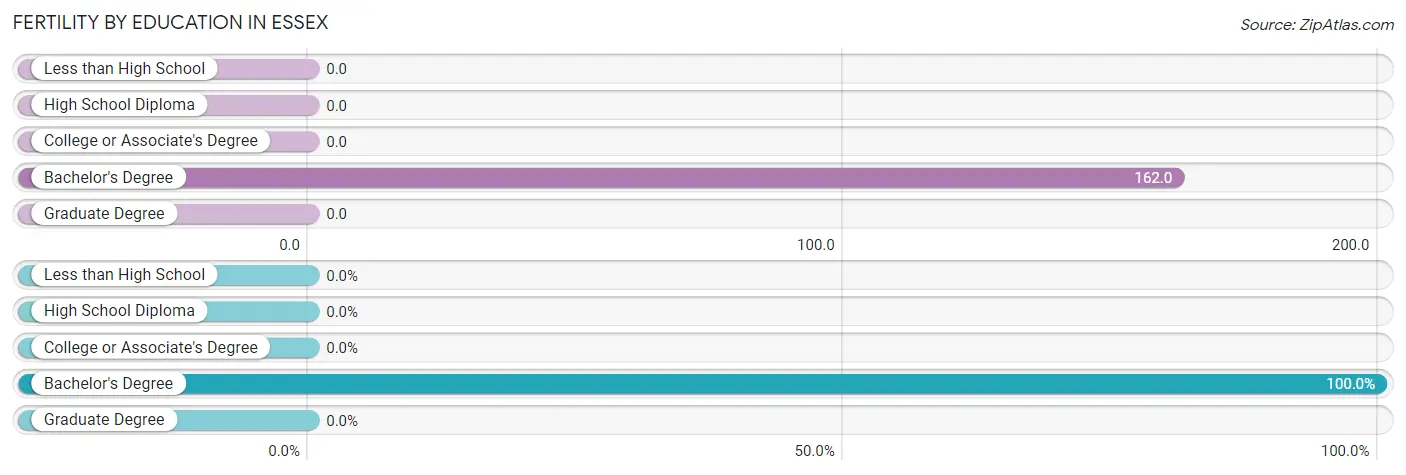
| Educational Attainment | Women with Births | Births / 1,000 Women |
| Less than High School | 0 (0.0%) | 0.0 |
| High School Diploma | 0 (0.0%) | 0.0 |
| College or Associate's Degree | 0 (0.0%) | 0.0 |
| Bachelor's Degree | 21 (100.0%) | 162.0 |
| Graduate Degree | 0 (0.0%) | 0.0 |
| Total | 21 (100.0%) | 42.0 |
Fertility by Education by Marriage Status in Essex
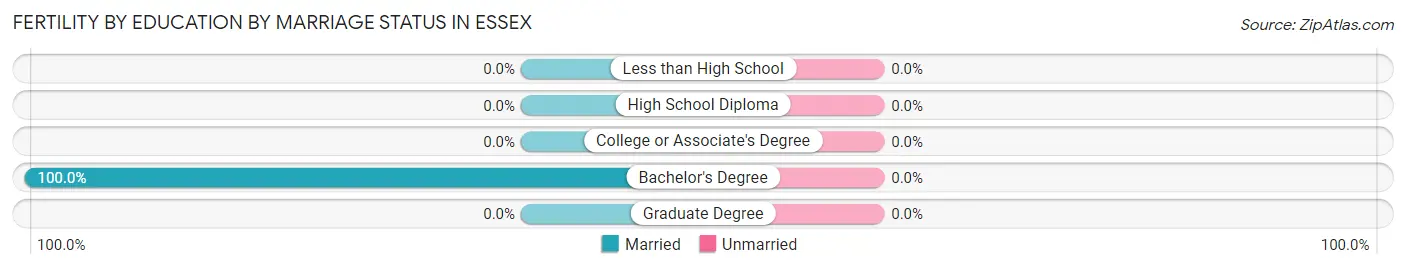
| Educational Attainment | Married | Unmarried |
| Less than High School | 0 (0.0%) | 0 (0.0%) |
| High School Diploma | 0 (0.0%) | 0 (0.0%) |
| College or Associate's Degree | 0 (0.0%) | 0 (0.0%) |
| Bachelor's Degree | 21 (100.0%) | 0 (0.0%) |
| Graduate Degree | 0 (0.0%) | 0 (0.0%) |
| Total | 21 (100.0%) | 0 (0.0%) |
Employment Characteristics in Essex
Employment by Class of Employer in Essex
Among the 951 employed individuals in Essex, private company employees (544 | 57.2%), not-for-profit organizations (175 | 18.4%), and self-employed (not incorporated) (69 | 7.3%) make up the most common classes of employment.
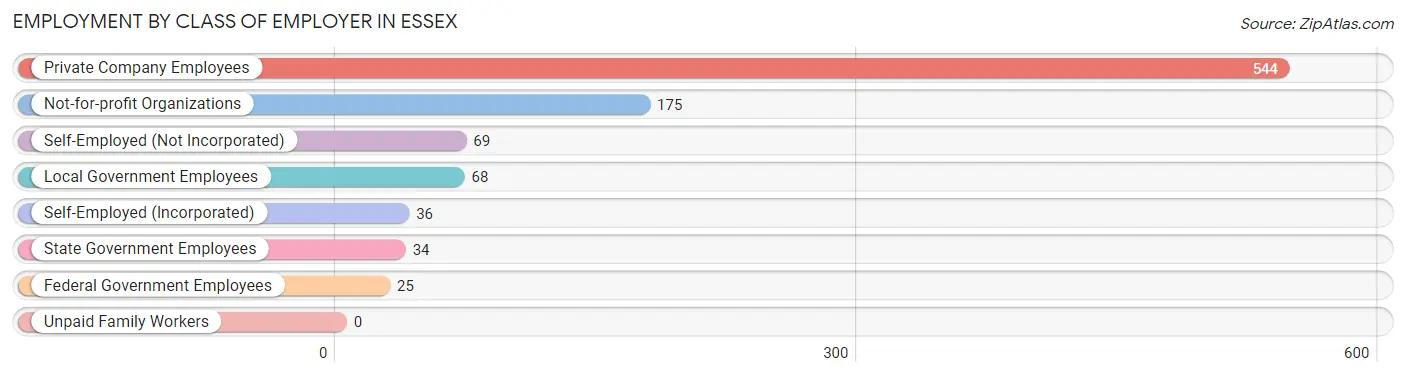
| Employer Class | # Employees | % Employees |
| Private Company Employees | 544 | 57.2% |
| Self-Employed (Incorporated) | 36 | 3.8% |
| Self-Employed (Not Incorporated) | 69 | 7.3% |
| Not-for-profit Organizations | 175 | 18.4% |
| Local Government Employees | 68 | 7.1% |
| State Government Employees | 34 | 3.6% |
| Federal Government Employees | 25 | 2.6% |
| Unpaid Family Workers | 0 | 0.0% |
| Total | 951 | 100.0% |
Employment Status by Age in Essex
According to the labor force statistics for Essex, out of the total population over 16 years of age (1,451), 75.1% or 1,090 individuals are in the labor force, with 1.1% or 12 of them unemployed. The age group with the highest labor force participation rate is 30 to 34 years, with 100.0% or 78 individuals in the labor force. Within the labor force, the 65 to 74 years age range has the highest percentage of unemployed individuals, with 12.3% or 7 of them being unemployed.
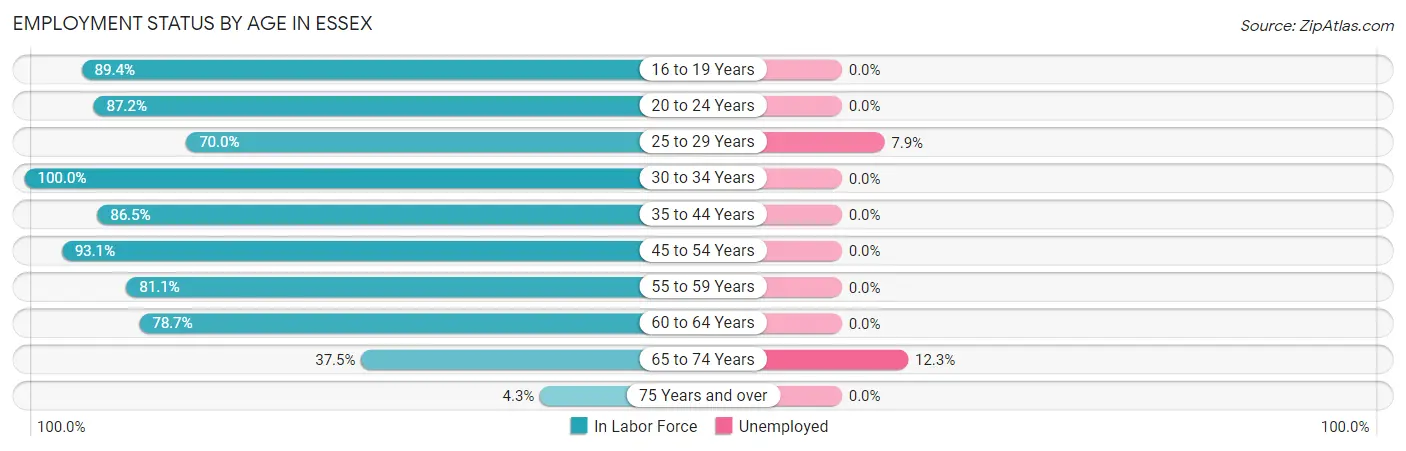
| Age Bracket | In Labor Force | Unemployed |
| 16 to 19 Years | 118 (89.4%) | 0 (0.0%) |
| 20 to 24 Years | 41 (87.2%) | 0 (0.0%) |
| 25 to 29 Years | 63 (70.0%) | 5 (7.9%) |
| 30 to 34 Years | 78 (100.0%) | 0 (0.0%) |
| 35 to 44 Years | 198 (86.5%) | 0 (0.0%) |
| 45 to 54 Years | 322 (93.1%) | 0 (0.0%) |
| 55 to 59 Years | 90 (81.1%) | 0 (0.0%) |
| 60 to 64 Years | 118 (78.7%) | 0 (0.0%) |
| 65 to 74 Years | 57 (37.5%) | 7 (12.3%) |
| 75 Years and over | 5 (4.3%) | 0 (0.0%) |
| Total | 1,090 (75.1%) | 12 (1.1%) |
Employment Status by Educational Attainment in Essex
According to labor force statistics for Essex, 86.6% of individuals (869) out of the total population between 25 and 64 years of age (1,004) are in the labor force, with 0.6% or 5 of them being unemployed. The group with the highest labor force participation rate are those with the educational attainment of bachelor's degree or higher, with 92.7% or 622 individuals in the labor force. Within the labor force, individuals with high school diploma education have the highest percentage of unemployment, with 4.6% or 5 of them being unemployed.
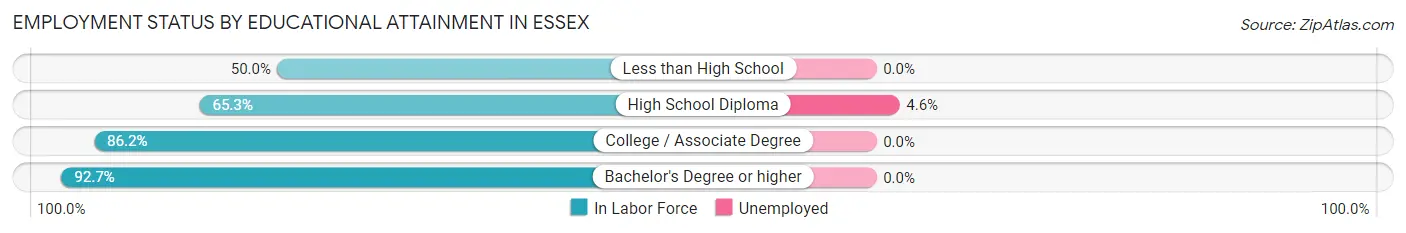
| Educational Attainment | In Labor Force | Unemployed |
| Less than High School | 7 (50.0%) | 0 (0.0%) |
| High School Diploma | 109 (65.3%) | 8 (4.6%) |
| College / Associate Degree | 131 (86.2%) | 0 (0.0%) |
| Bachelor's Degree or higher | 622 (92.7%) | 0 (0.0%) |
| Total | 869 (86.6%) | 6 (0.6%) |
Employment Occupations by Sex in Essex
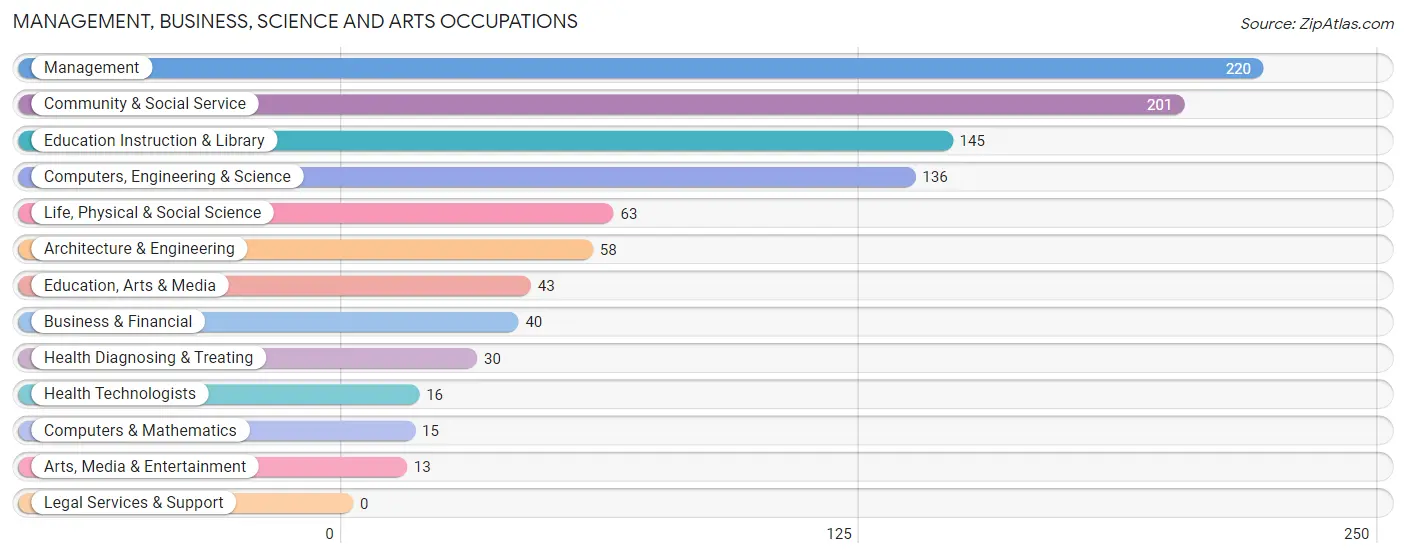
Management, Business, Science and Arts Occupations
The most common Management, Business, Science and Arts occupations in Essex are Management (220 | 20.4%), Community & Social Service (201 | 18.6%), Education Instruction & Library (145 | 13.5%), Computers, Engineering & Science (136 | 12.6%), and Life, Physical & Social Science (63 | 5.8%).
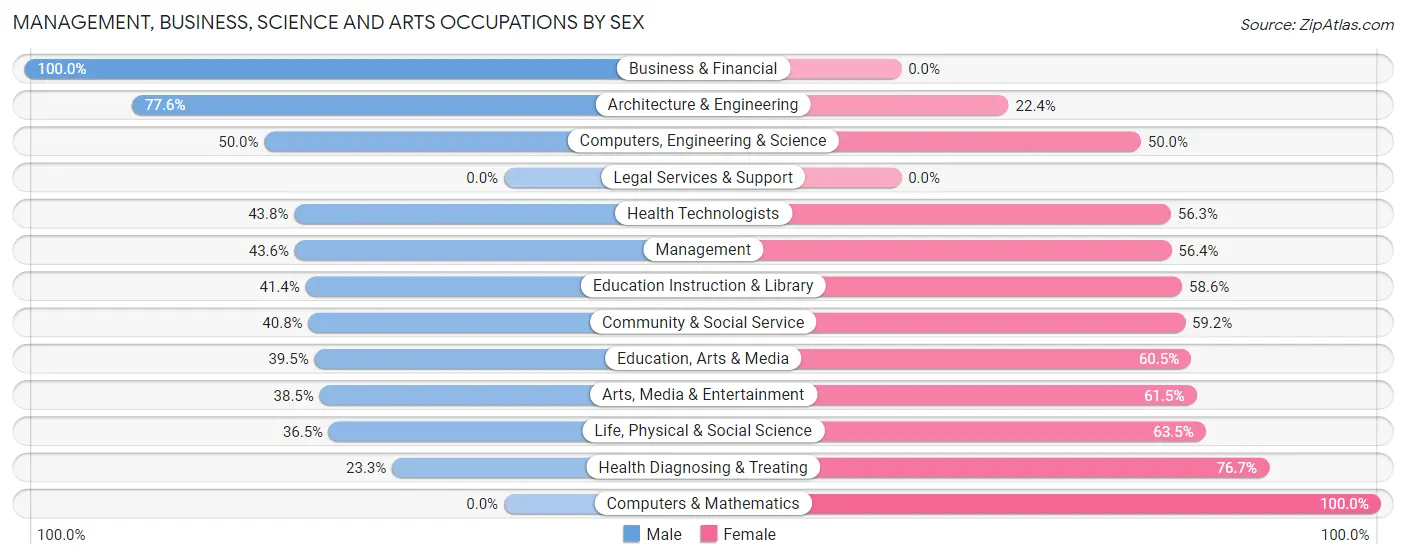
Management, Business, Science and Arts Occupations by Sex
Within the Management, Business, Science and Arts occupations in Essex, the most male-oriented occupations are Business & Financial (100.0%), Architecture & Engineering (77.6%), and Computers, Engineering & Science (50.0%), while the most female-oriented occupations are Computers & Mathematics (100.0%), Health Diagnosing & Treating (76.7%), and Life, Physical & Social Science (63.5%).
| Occupation | Male | Female |
| Management | 96 (43.6%) | 124 (56.4%) |
| Business & Financial | 40 (100.0%) | 0 (0.0%) |
| Computers, Engineering & Science | 68 (50.0%) | 68 (50.0%) |
| Computers & Mathematics | 0 (0.0%) | 15 (100.0%) |
| Architecture & Engineering | 45 (77.6%) | 13 (22.4%) |
| Life, Physical & Social Science | 23 (36.5%) | 40 (63.5%) |
| Community & Social Service | 82 (40.8%) | 119 (59.2%) |
| Education, Arts & Media | 17 (39.5%) | 26 (60.5%) |
| Legal Services & Support | 0 (0.0%) | 0 (0.0%) |
| Education Instruction & Library | 60 (41.4%) | 85 (58.6%) |
| Arts, Media & Entertainment | 5 (38.5%) | 8 (61.5%) |
| Health Diagnosing & Treating | 7 (23.3%) | 23 (76.7%) |
| Health Technologists | 7 (43.8%) | 9 (56.2%) |
| Total (Category) | 293 (46.7%) | 334 (53.3%) |
| Total (Overall) | 508 (47.1%) | 570 (52.9%) |
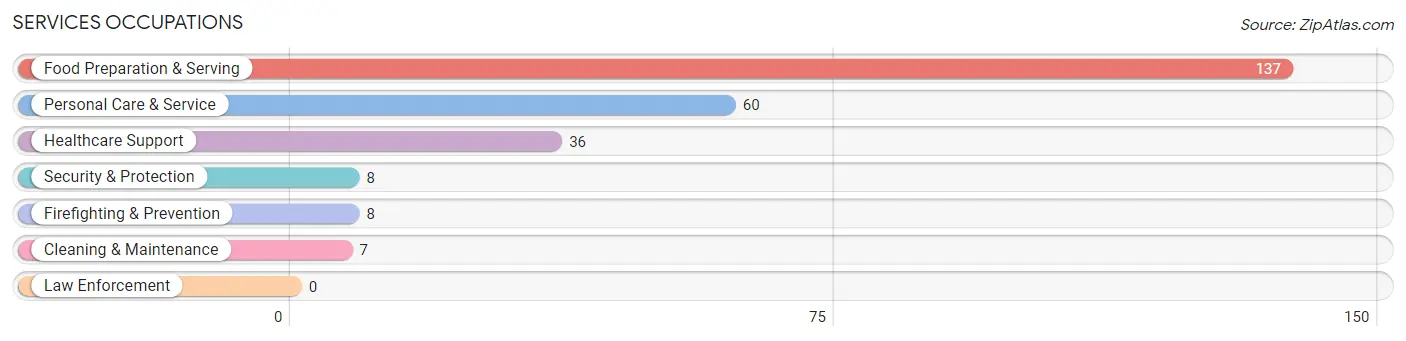
Services Occupations
The most common Services occupations in Essex are Food Preparation & Serving (137 | 12.7%), Personal Care & Service (60 | 5.6%), Healthcare Support (36 | 3.3%), Security & Protection (8 | 0.7%), and Firefighting & Prevention (8 | 0.7%).
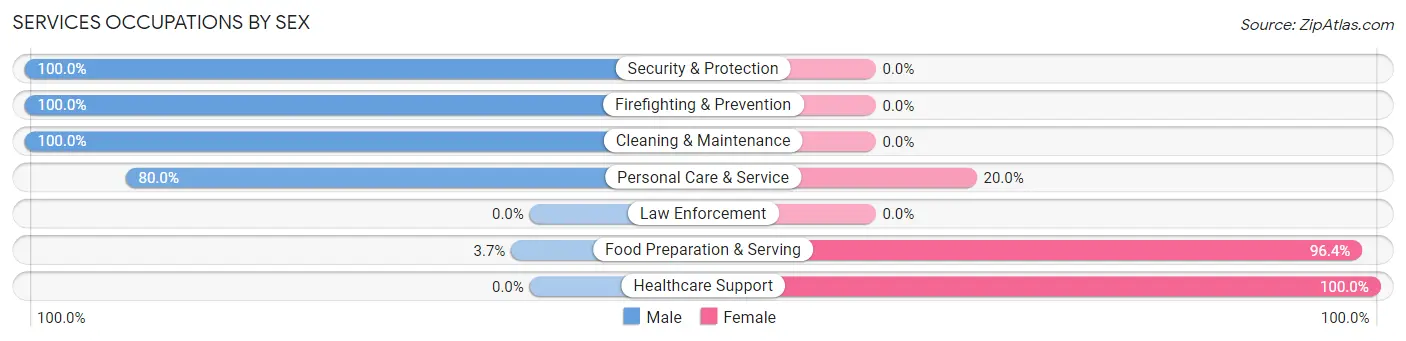
Services Occupations by Sex
Within the Services occupations in Essex, the most male-oriented occupations are Security & Protection (100.0%), Firefighting & Prevention (100.0%), and Cleaning & Maintenance (100.0%), while the most female-oriented occupations are Healthcare Support (100.0%), Food Preparation & Serving (96.4%), and Personal Care & Service (20.0%).
| Occupation | Male | Female |
| Healthcare Support | 0 (0.0%) | 36 (100.0%) |
| Security & Protection | 8 (100.0%) | 0 (0.0%) |
| Firefighting & Prevention | 8 (100.0%) | 0 (0.0%) |
| Law Enforcement | 0 (0.0%) | 0 (0.0%) |
| Food Preparation & Serving | 5 (3.6%) | 132 (96.4%) |
| Cleaning & Maintenance | 7 (100.0%) | 0 (0.0%) |
| Personal Care & Service | 48 (80.0%) | 12 (20.0%) |
| Total (Category) | 68 (27.4%) | 180 (72.6%) |
| Total (Overall) | 508 (47.1%) | 570 (52.9%) |
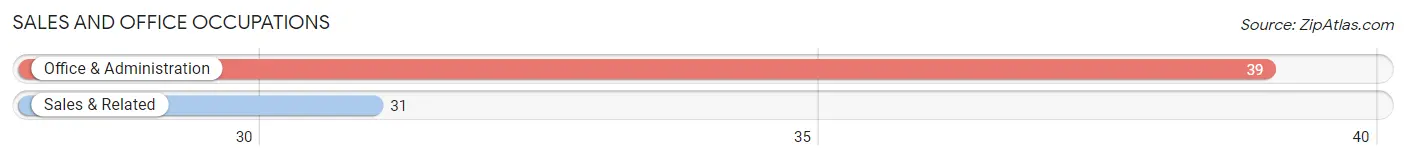
Sales and Office Occupations
The most common Sales and Office occupations in Essex are Office & Administration (39 | 3.6%), and Sales & Related (31 | 2.9%).
Sales and Office Occupations by Sex
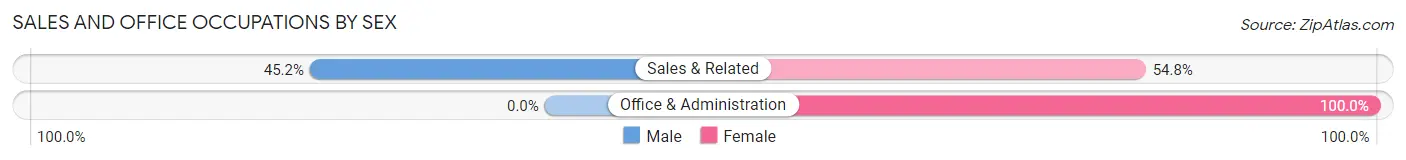
| Occupation | Male | Female |
| Sales & Related | 14 (45.2%) | 17 (54.8%) |
| Office & Administration | 0 (0.0%) | 39 (100.0%) |
| Total (Category) | 14 (20.0%) | 56 (80.0%) |
| Total (Overall) | 508 (47.1%) | 570 (52.9%) |
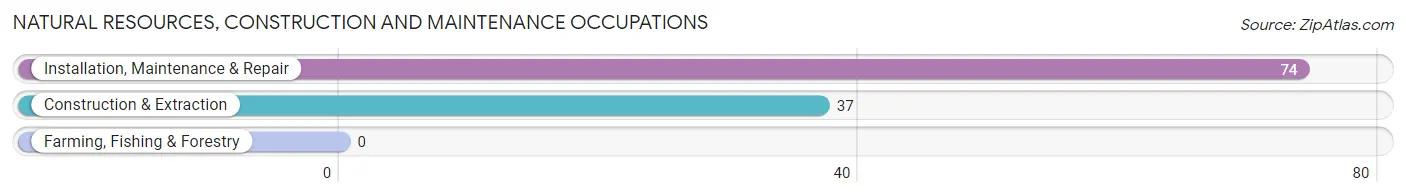
Natural Resources, Construction and Maintenance Occupations
The most common Natural Resources, Construction and Maintenance occupations in Essex are Installation, Maintenance & Repair (74 | 6.9%), and Construction & Extraction (37 | 3.4%).
Natural Resources, Construction and Maintenance Occupations by Sex
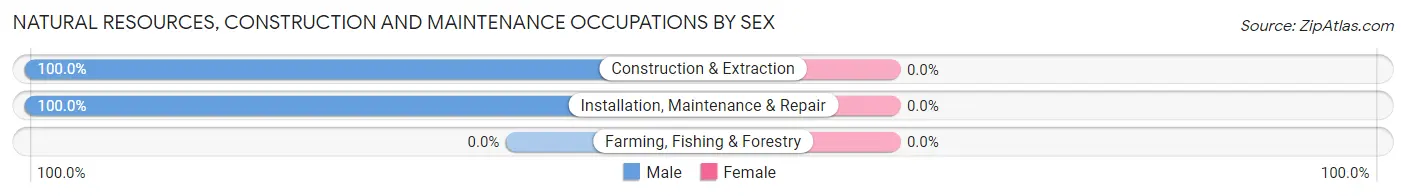
| Occupation | Male | Female |
| Farming, Fishing & Forestry | 0 (0.0%) | 0 (0.0%) |
| Construction & Extraction | 37 (100.0%) | 0 (0.0%) |
| Installation, Maintenance & Repair | 74 (100.0%) | 0 (0.0%) |
| Total (Category) | 111 (100.0%) | 0 (0.0%) |
| Total (Overall) | 508 (47.1%) | 570 (52.9%) |
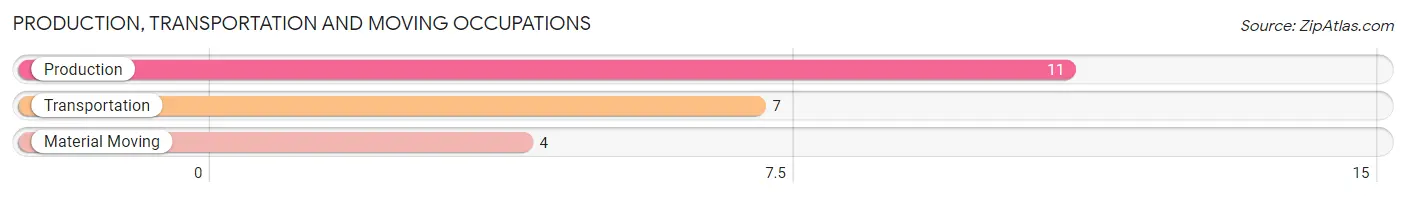
Production, Transportation and Moving Occupations
The most common Production, Transportation and Moving occupations in Essex are Production (11 | 1.0%), Transportation (7 | 0.6%), and Material Moving (4 | 0.4%).
Production, Transportation and Moving Occupations by Sex
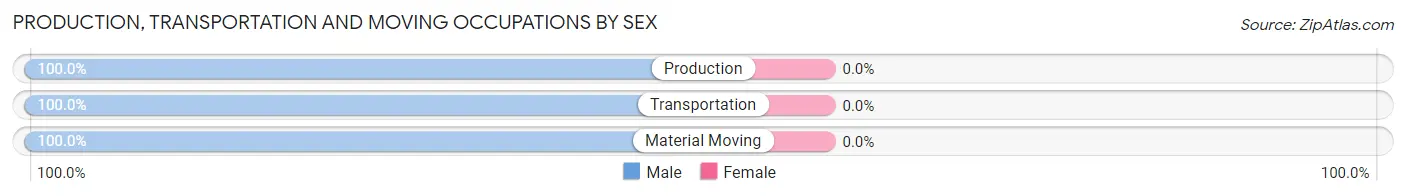
| Occupation | Male | Female |
| Production | 11 (100.0%) | 0 (0.0%) |
| Transportation | 7 (100.0%) | 0 (0.0%) |
| Material Moving | 4 (100.0%) | 0 (0.0%) |
| Total (Category) | 22 (100.0%) | 0 (0.0%) |
| Total (Overall) | 508 (47.1%) | 570 (52.9%) |
Employment Industries by Sex in Essex
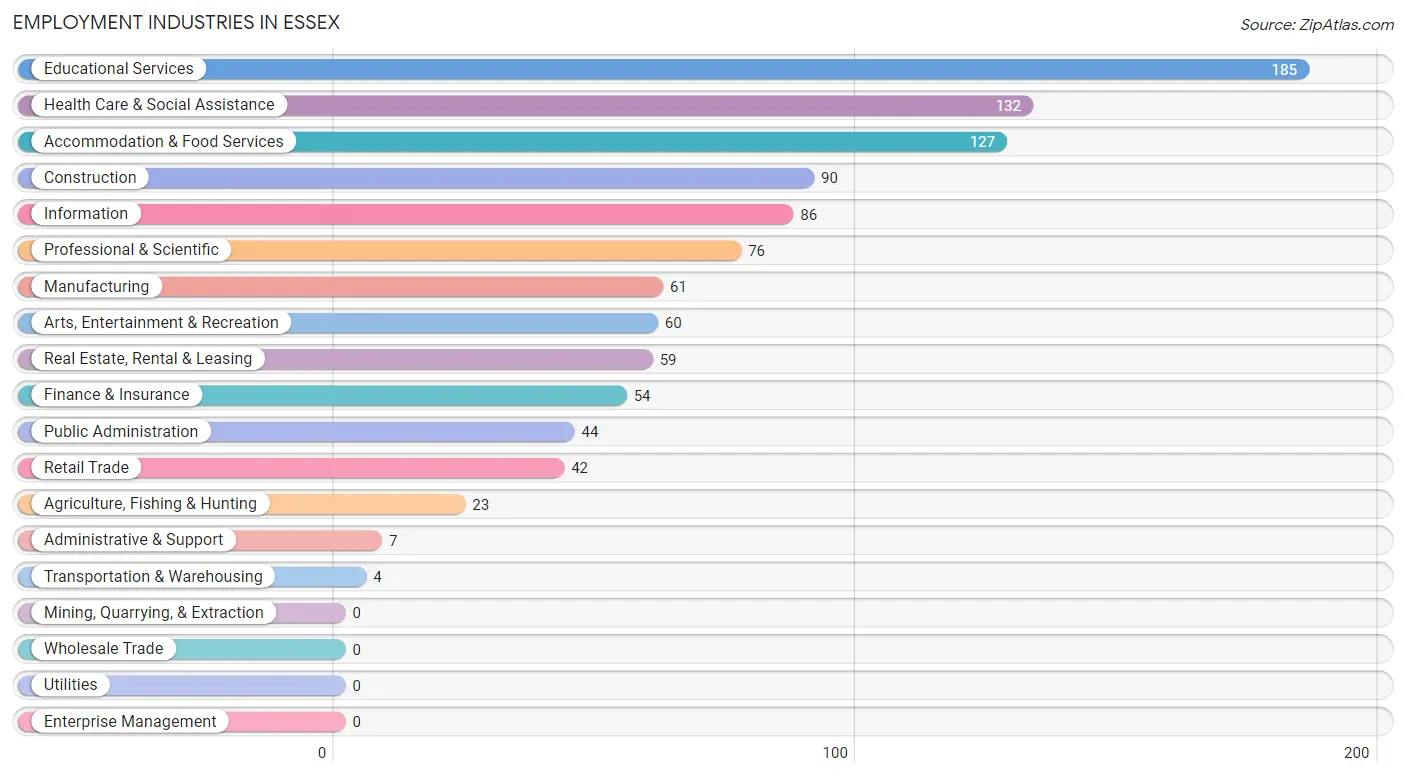
Employment Industries in Essex
The major employment industries in Essex include Educational Services (185 | 17.2%), Health Care & Social Assistance (132 | 12.2%), Accommodation & Food Services (127 | 11.8%), Construction (90 | 8.4%), and Information (86 | 8.0%).
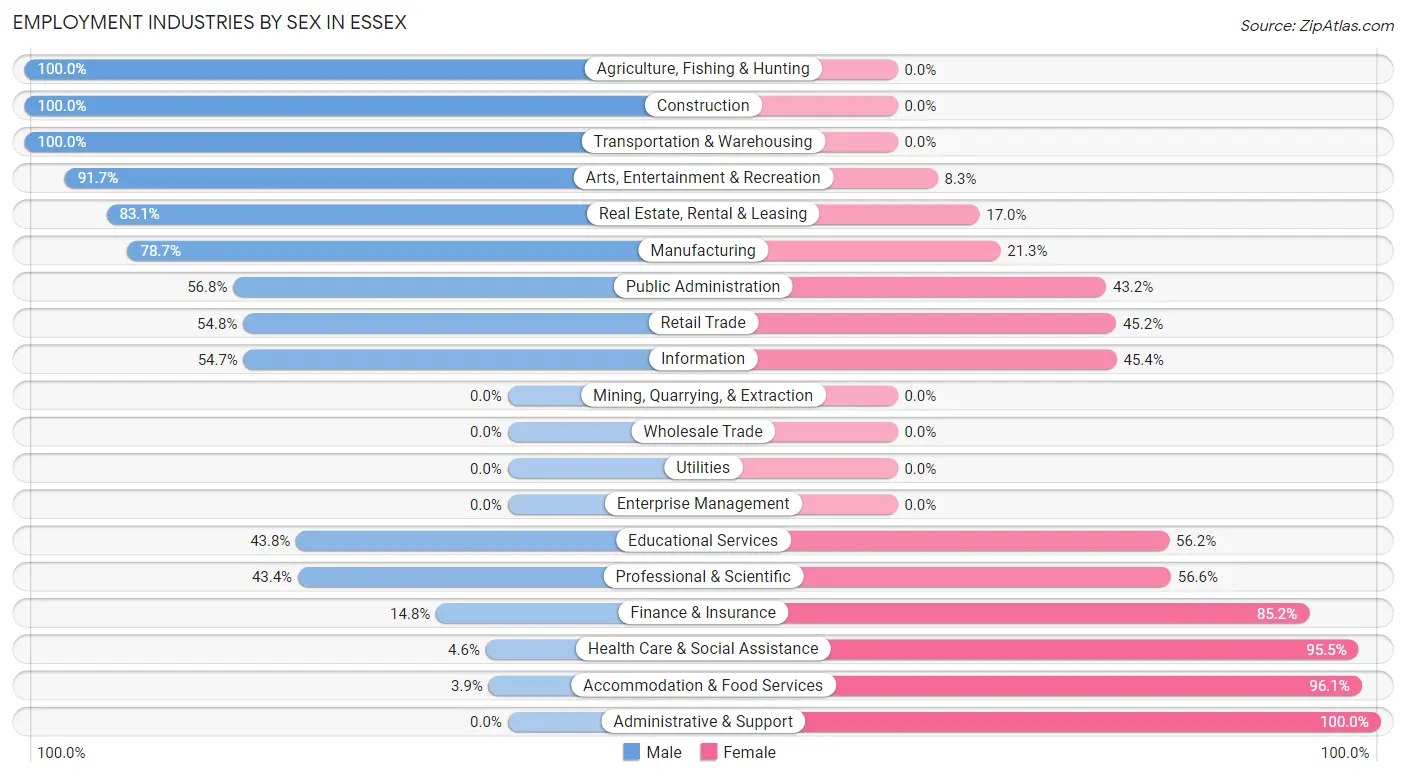
Employment Industries by Sex in Essex
The Essex industries that see more men than women are Agriculture, Fishing & Hunting (100.0%), Construction (100.0%), and Transportation & Warehousing (100.0%), whereas the industries that tend to have a higher number of women are Administrative & Support (100.0%), Accommodation & Food Services (96.1%), and Health Care & Social Assistance (95.5%).
| Industry | Male | Female |
| Agriculture, Fishing & Hunting | 23 (100.0%) | 0 (0.0%) |
| Mining, Quarrying, & Extraction | 0 (0.0%) | 0 (0.0%) |
| Construction | 90 (100.0%) | 0 (0.0%) |
| Manufacturing | 48 (78.7%) | 13 (21.3%) |
| Wholesale Trade | 0 (0.0%) | 0 (0.0%) |
| Retail Trade | 23 (54.8%) | 19 (45.2%) |
| Transportation & Warehousing | 4 (100.0%) | 0 (0.0%) |
| Utilities | 0 (0.0%) | 0 (0.0%) |
| Information | 47 (54.6%) | 39 (45.4%) |
| Finance & Insurance | 8 (14.8%) | 46 (85.2%) |
| Real Estate, Rental & Leasing | 49 (83.1%) | 10 (17.0%) |
| Professional & Scientific | 33 (43.4%) | 43 (56.6%) |
| Enterprise Management | 0 (0.0%) | 0 (0.0%) |
| Administrative & Support | 0 (0.0%) | 7 (100.0%) |
| Educational Services | 81 (43.8%) | 104 (56.2%) |
| Health Care & Social Assistance | 6 (4.5%) | 126 (95.5%) |
| Arts, Entertainment & Recreation | 55 (91.7%) | 5 (8.3%) |
| Accommodation & Food Services | 5 (3.9%) | 122 (96.1%) |
| Public Administration | 25 (56.8%) | 19 (43.2%) |
| Total | 508 (47.1%) | 570 (52.9%) |
Education in Essex
School Enrollment in Essex
The most common levels of schooling among the 437 students in Essex are high school (193 | 44.2%), elementary school (100 | 22.9%), and middle school (97 | 22.2%).
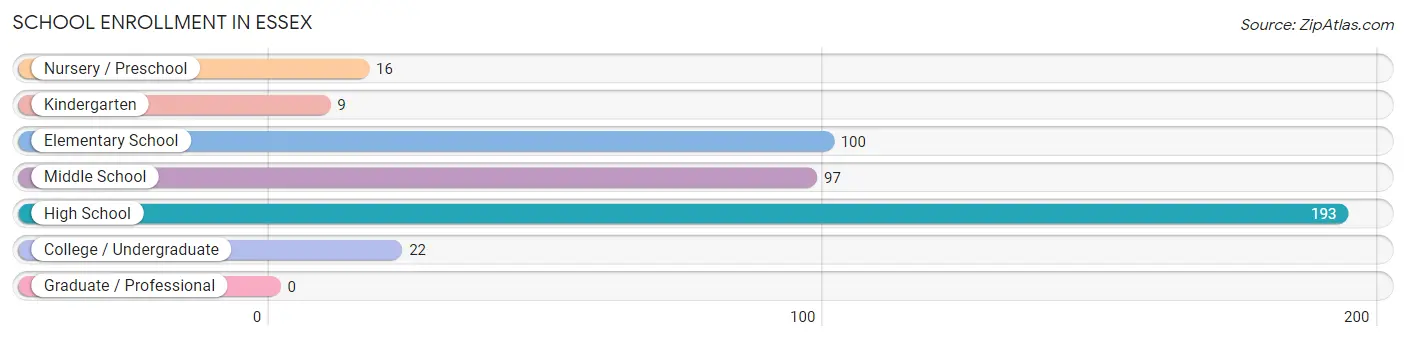
| School Level | # Students | % Students |
| Nursery / Preschool | 16 | 3.7% |
| Kindergarten | 9 | 2.1% |
| Elementary School | 100 | 22.9% |
| Middle School | 97 | 22.2% |
| High School | 193 | 44.2% |
| College / Undergraduate | 22 | 5.0% |
| Graduate / Professional | 0 | 0.0% |
| Total | 437 | 100.0% |
School Enrollment by Age by Funding Source in Essex
Out of a total of 437 students who are enrolled in schools in Essex, 51 (11.7%) attend a private institution, while the remaining 386 (88.3%) are enrolled in public schools. The age group of 35 years and over has the highest likelihood of being enrolled in private schools, with 8 (100.0% in the age bracket) enrolled. Conversely, the age group of 5 to 9 year old has the lowest likelihood of being enrolled in a private school, with 109 (100.0% in the age bracket) attending a public institution.
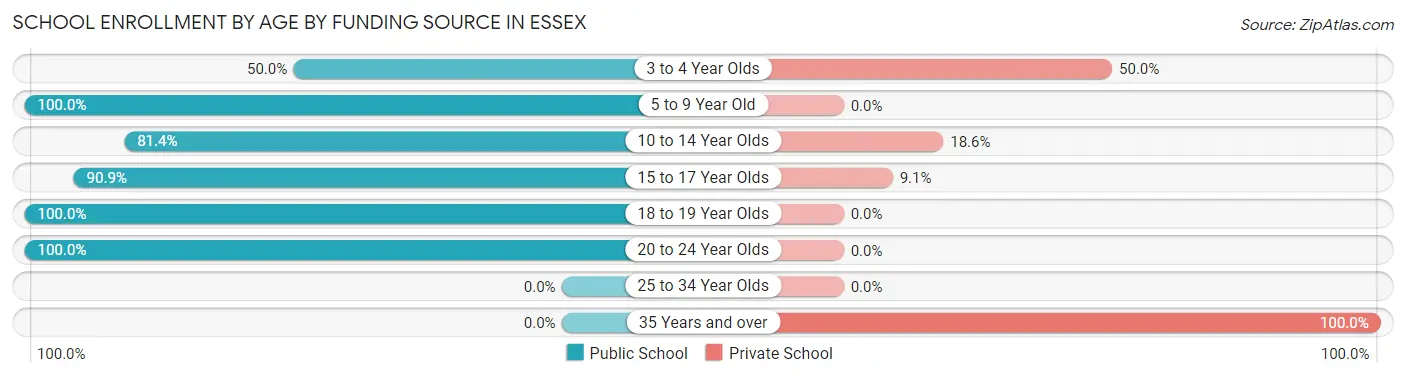
| Age Bracket | Public School | Private School |
| 3 to 4 Year Olds | 8 (50.0%) | 8 (50.0%) |
| 5 to 9 Year Old | 109 (100.0%) | 0 (0.0%) |
| 10 to 14 Year Olds | 79 (81.4%) | 18 (18.6%) |
| 15 to 17 Year Olds | 169 (90.9%) | 17 (9.1%) |
| 18 to 19 Year Olds | 7 (100.0%) | 0 (0.0%) |
| 20 to 24 Year Olds | 14 (100.0%) | 0 (0.0%) |
| 25 to 34 Year Olds | 0 (0.0%) | 0 (0.0%) |
| 35 Years and over | 0 (0.0%) | 8 (100.0%) |
| Total | 386 (88.3%) | 51 (11.7%) |
Educational Attainment by Field of Study in Essex
Science & technology (122 | 14.7%), business (111 | 13.3%), education (110 | 13.2%), bio, nature & agricultural (79 | 9.5%), and literature & languages (75 | 9.0%) are the most common fields of study among 832 individuals in Essex who have obtained a bachelor's degree or higher.
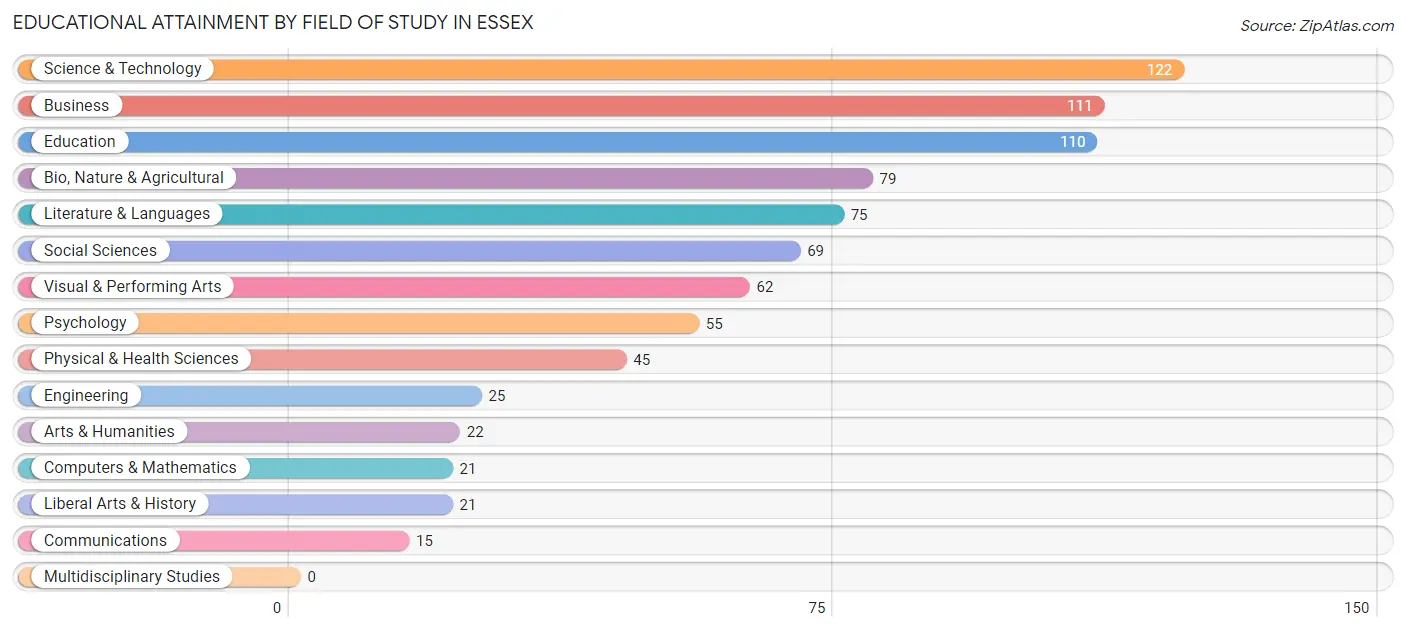
| Field of Study | # Graduates | % Graduates |
| Computers & Mathematics | 21 | 2.5% |
| Bio, Nature & Agricultural | 79 | 9.5% |
| Physical & Health Sciences | 45 | 5.4% |
| Psychology | 55 | 6.6% |
| Social Sciences | 69 | 8.3% |
| Engineering | 25 | 3.0% |
| Multidisciplinary Studies | 0 | 0.0% |
| Science & Technology | 122 | 14.7% |
| Business | 111 | 13.3% |
| Education | 110 | 13.2% |
| Literature & Languages | 75 | 9.0% |
| Liberal Arts & History | 21 | 2.5% |
| Visual & Performing Arts | 62 | 7.4% |
| Communications | 15 | 1.8% |
| Arts & Humanities | 22 | 2.6% |
| Total | 832 | 100.0% |
Transportation & Commute in Essex
Vehicle Availability by Sex in Essex
The most prevalent vehicle ownership categories in Essex are males with 2 vehicles (325, accounting for 72.5%) and females with 2 vehicles (320, making up 64.6%).
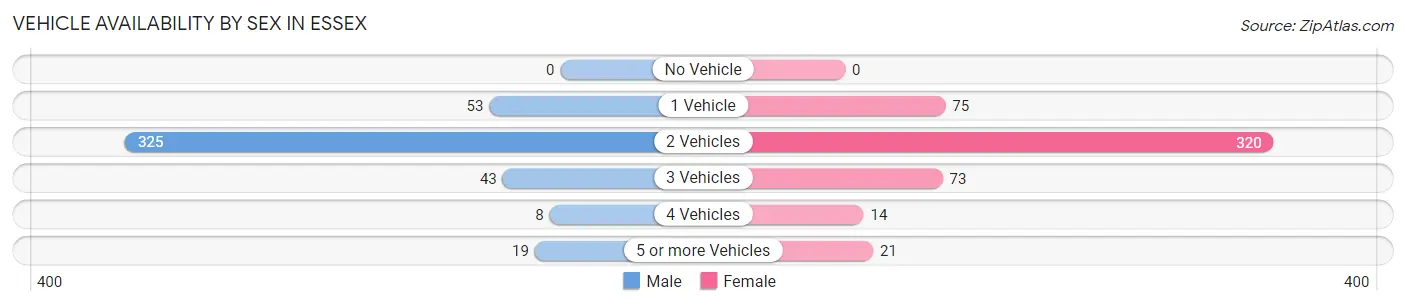
| Vehicles Available | Male | Female |
| No Vehicle | 0 (0.0%) | 0 (0.0%) |
| 1 Vehicle | 53 (11.8%) | 75 (14.9%) |
| 2 Vehicles | 325 (72.5%) | 320 (63.6%) |
| 3 Vehicles | 43 (9.6%) | 73 (14.5%) |
| 4 Vehicles | 8 (1.8%) | 14 (2.8%) |
| 5 or more Vehicles | 19 (4.2%) | 21 (4.2%) |
| Total | 448 (100.0%) | 503 (100.0%) |
Commute Time in Essex
The most frequently occuring commute durations in Essex are 10 to 14 minutes (203 commuters, 26.2%), 60 to 89 minutes (145 commuters, 18.7%), and 15 to 19 minutes (134 commuters, 17.3%).
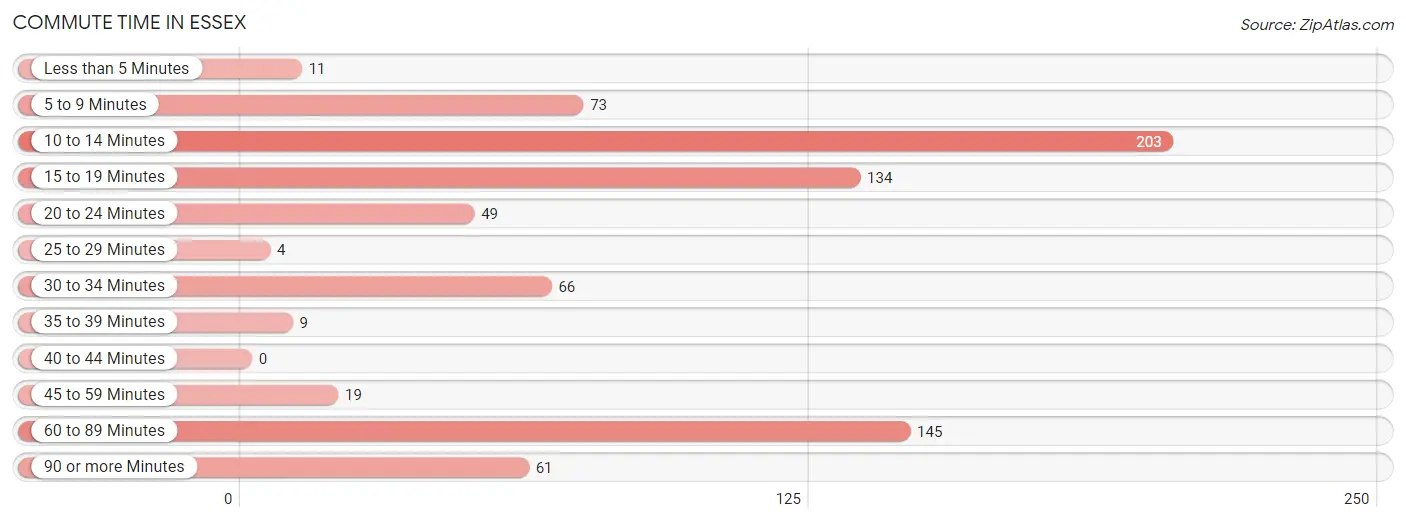
| Commute Time | # Commuters | % Commuters |
| Less than 5 Minutes | 11 | 1.4% |
| 5 to 9 Minutes | 73 | 9.4% |
| 10 to 14 Minutes | 203 | 26.2% |
| 15 to 19 Minutes | 134 | 17.3% |
| 20 to 24 Minutes | 49 | 6.3% |
| 25 to 29 Minutes | 4 | 0.5% |
| 30 to 34 Minutes | 66 | 8.5% |
| 35 to 39 Minutes | 9 | 1.2% |
| 40 to 44 Minutes | 0 | 0.0% |
| 45 to 59 Minutes | 19 | 2.5% |
| 60 to 89 Minutes | 145 | 18.7% |
| 90 or more Minutes | 61 | 7.9% |
Commute Time by Sex in Essex
The most common commute times in Essex are 60 to 89 minutes (98 commuters, 25.7%) for males and 10 to 14 minutes (136 commuters, 34.6%) for females.
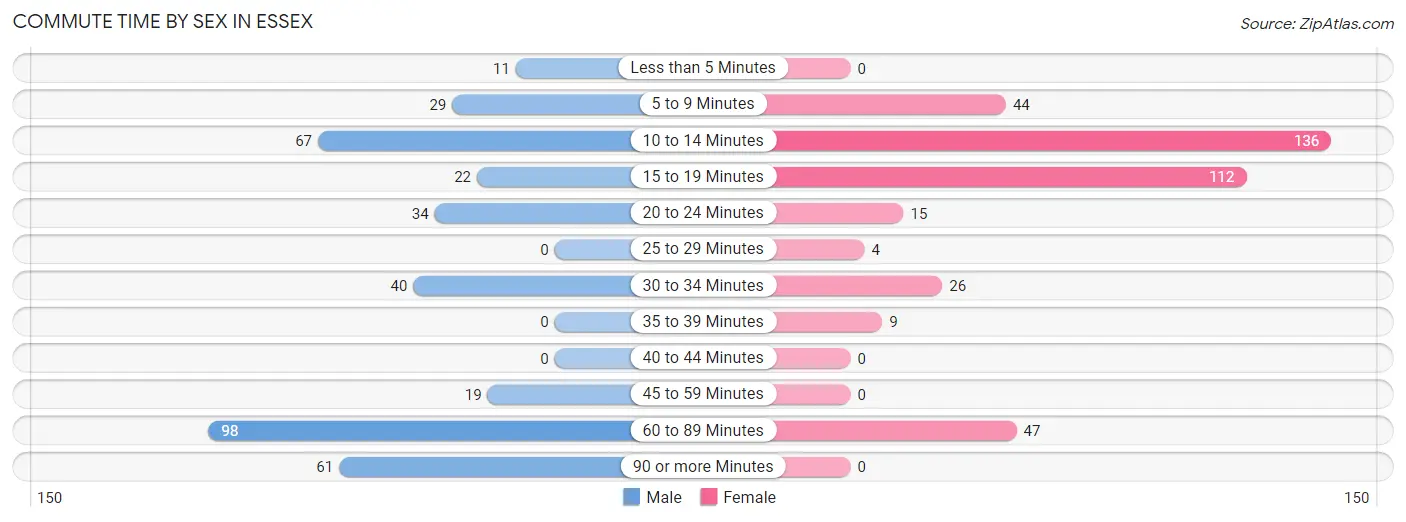
| Commute Time | Male | Female |
| Less than 5 Minutes | 11 (2.9%) | 0 (0.0%) |
| 5 to 9 Minutes | 29 (7.6%) | 44 (11.2%) |
| 10 to 14 Minutes | 67 (17.6%) | 136 (34.6%) |
| 15 to 19 Minutes | 22 (5.8%) | 112 (28.5%) |
| 20 to 24 Minutes | 34 (8.9%) | 15 (3.8%) |
| 25 to 29 Minutes | 0 (0.0%) | 4 (1.0%) |
| 30 to 34 Minutes | 40 (10.5%) | 26 (6.6%) |
| 35 to 39 Minutes | 0 (0.0%) | 9 (2.3%) |
| 40 to 44 Minutes | 0 (0.0%) | 0 (0.0%) |
| 45 to 59 Minutes | 19 (5.0%) | 0 (0.0%) |
| 60 to 89 Minutes | 98 (25.7%) | 47 (12.0%) |
| 90 or more Minutes | 61 (16.0%) | 0 (0.0%) |
Time of Departure to Work by Sex in Essex
The most frequent times of departure to work in Essex are 6:30 AM to 6:59 AM (90, 23.6%) for males and 7:30 AM to 7:59 AM (160, 40.7%) for females.
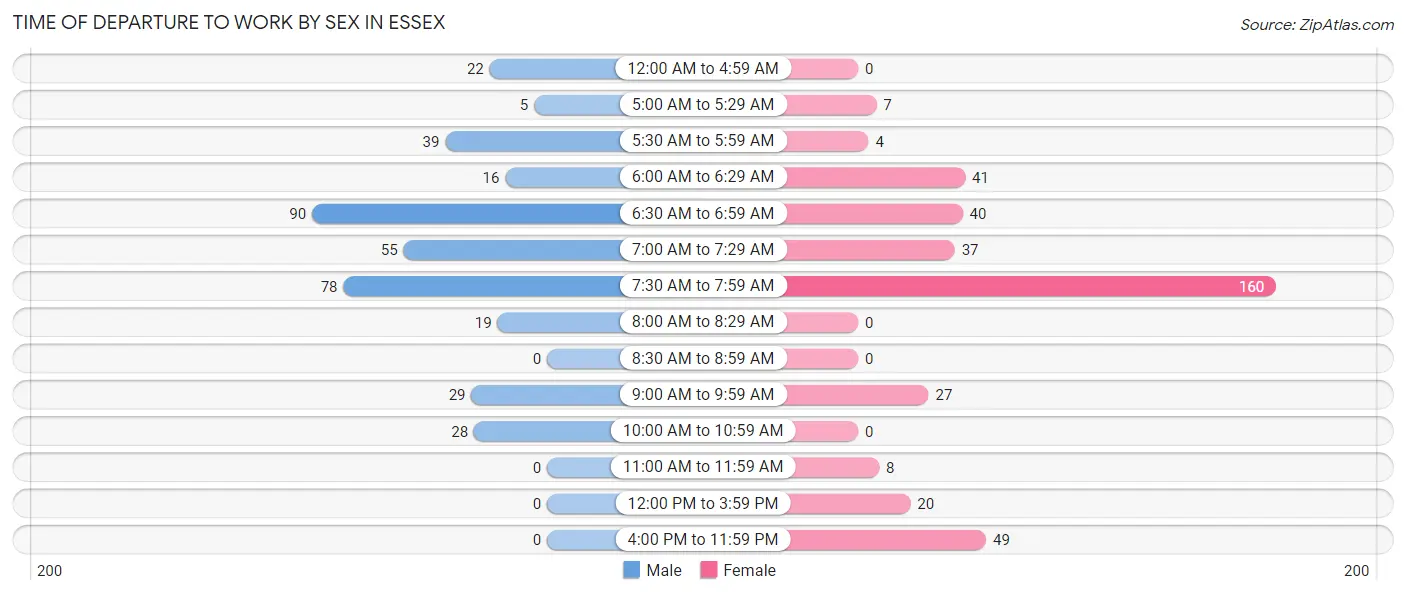
| Time of Departure | Male | Female |
| 12:00 AM to 4:59 AM | 22 (5.8%) | 0 (0.0%) |
| 5:00 AM to 5:29 AM | 5 (1.3%) | 7 (1.8%) |
| 5:30 AM to 5:59 AM | 39 (10.2%) | 4 (1.0%) |
| 6:00 AM to 6:29 AM | 16 (4.2%) | 41 (10.4%) |
| 6:30 AM to 6:59 AM | 90 (23.6%) | 40 (10.2%) |
| 7:00 AM to 7:29 AM | 55 (14.4%) | 37 (9.4%) |
| 7:30 AM to 7:59 AM | 78 (20.5%) | 160 (40.7%) |
| 8:00 AM to 8:29 AM | 19 (5.0%) | 0 (0.0%) |
| 8:30 AM to 8:59 AM | 0 (0.0%) | 0 (0.0%) |
| 9:00 AM to 9:59 AM | 29 (7.6%) | 27 (6.9%) |
| 10:00 AM to 10:59 AM | 28 (7.3%) | 0 (0.0%) |
| 11:00 AM to 11:59 AM | 0 (0.0%) | 8 (2.0%) |
| 12:00 PM to 3:59 PM | 0 (0.0%) | 20 (5.1%) |
| 4:00 PM to 11:59 PM | 0 (0.0%) | 49 (12.5%) |
| Total | 381 (100.0%) | 393 (100.0%) |
Housing Occupancy in Essex
Occupancy by Ownership in Essex
Of the total 669 dwellings in Essex, owner-occupied units account for 570 (85.2%), while renter-occupied units make up 99 (14.8%).
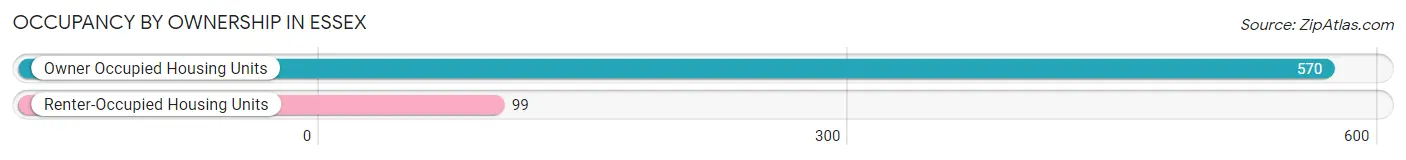
| Occupancy | # Housing Units | % Housing Units |
| Owner Occupied Housing Units | 570 | 85.2% |
| Renter-Occupied Housing Units | 99 | 14.8% |
| Total Occupied Housing Units | 669 | 100.0% |
Occupancy by Household Size in Essex
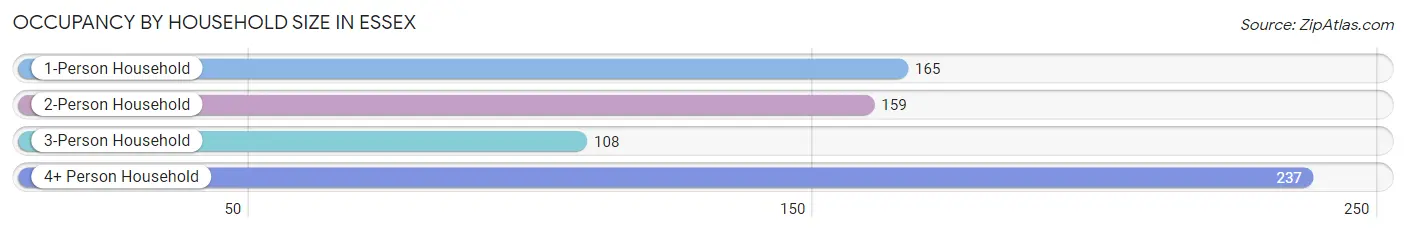
| Household Size | # Housing Units | % Housing Units |
| 1-Person Household | 165 | 24.7% |
| 2-Person Household | 159 | 23.8% |
| 3-Person Household | 108 | 16.1% |
| 4+ Person Household | 237 | 35.4% |
| Total Housing Units | 669 | 100.0% |
Occupancy by Ownership by Household Size in Essex
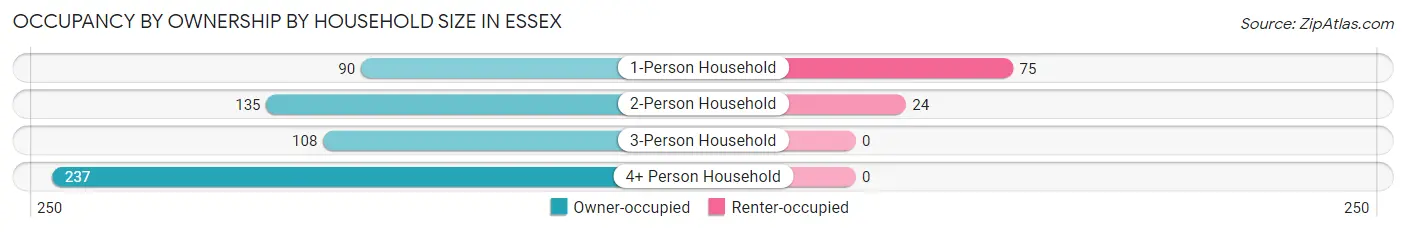
| Household Size | Owner-occupied | Renter-occupied |
| 1-Person Household | 90 (54.5%) | 75 (45.5%) |
| 2-Person Household | 135 (84.9%) | 24 (15.1%) |
| 3-Person Household | 108 (100.0%) | 0 (0.0%) |
| 4+ Person Household | 237 (100.0%) | 0 (0.0%) |
| Total Housing Units | 570 (85.2%) | 99 (14.8%) |
Occupancy by Educational Attainment in Essex
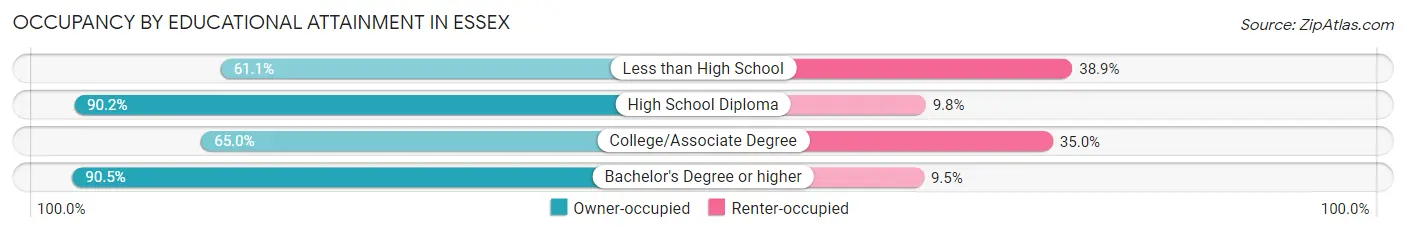
| Household Size | Owner-occupied | Renter-occupied |
| Less than High School | 11 (61.1%) | 7 (38.9%) |
| High School Diploma | 101 (90.2%) | 11 (9.8%) |
| College/Associate Degree | 76 (65.0%) | 41 (35.0%) |
| Bachelor's Degree or higher | 382 (90.5%) | 40 (9.5%) |
Occupancy by Age of Householder in Essex
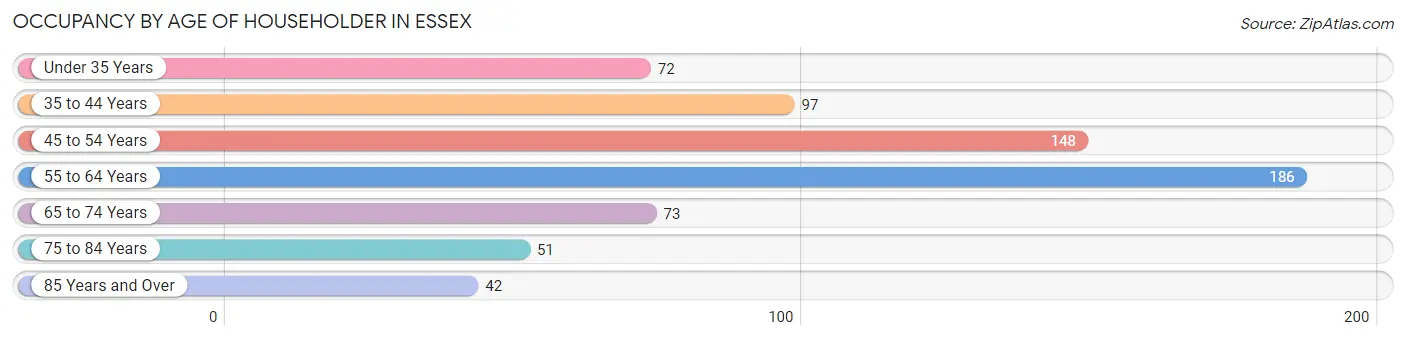
| Age Bracket | # Households | % Households |
| Under 35 Years | 72 | 10.8% |
| 35 to 44 Years | 97 | 14.5% |
| 45 to 54 Years | 148 | 22.1% |
| 55 to 64 Years | 186 | 27.8% |
| 65 to 74 Years | 73 | 10.9% |
| 75 to 84 Years | 51 | 7.6% |
| 85 Years and Over | 42 | 6.3% |
| Total | 669 | 100.0% |
Housing Finances in Essex
Median Income by Occupancy in Essex
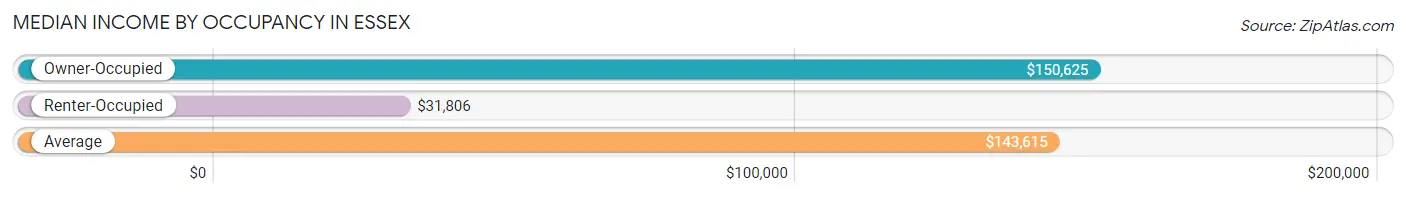
| Occupancy Type | # Households | Median Income |
| Owner-Occupied | 570 (85.2%) | $150,625 |
| Renter-Occupied | 99 (14.8%) | $31,806 |
| Average | 669 (100.0%) | $143,615 |
Occupancy by Householder Income Bracket in Essex
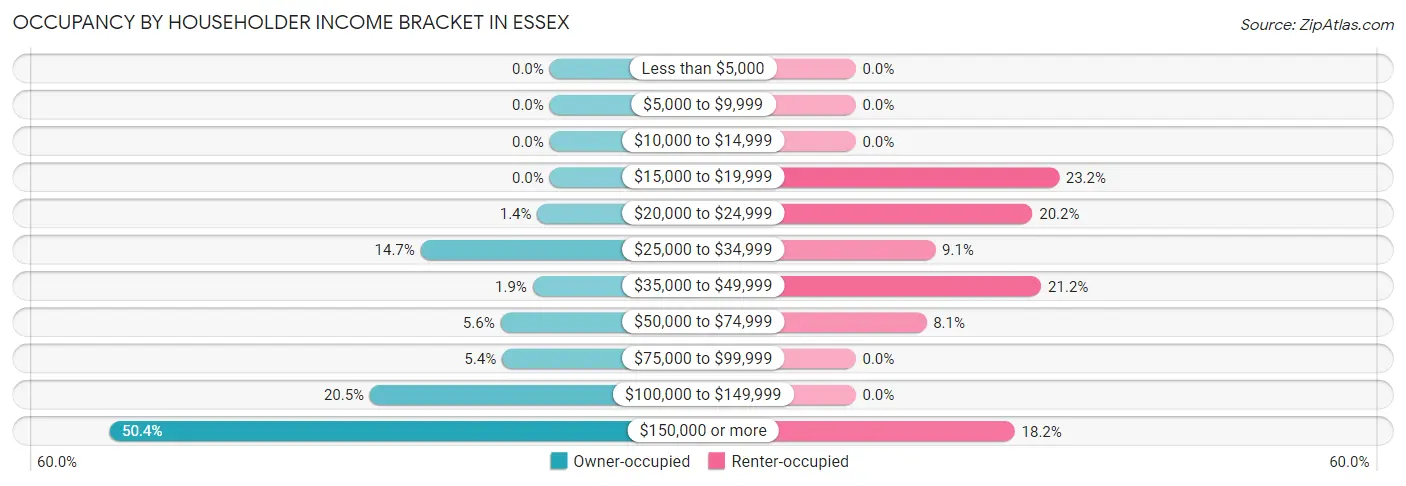
| Income Bracket | Owner-occupied | Renter-occupied |
| Less than $5,000 | 0 (0.0%) | 0 (0.0%) |
| $5,000 to $9,999 | 0 (0.0%) | 0 (0.0%) |
| $10,000 to $14,999 | 0 (0.0%) | 0 (0.0%) |
| $15,000 to $19,999 | 0 (0.0%) | 23 (23.2%) |
| $20,000 to $24,999 | 8 (1.4%) | 20 (20.2%) |
| $25,000 to $34,999 | 84 (14.7%) | 9 (9.1%) |
| $35,000 to $49,999 | 11 (1.9%) | 21 (21.2%) |
| $50,000 to $74,999 | 32 (5.6%) | 8 (8.1%) |
| $75,000 to $99,999 | 31 (5.4%) | 0 (0.0%) |
| $100,000 to $149,999 | 117 (20.5%) | 0 (0.0%) |
| $150,000 or more | 287 (50.3%) | 18 (18.2%) |
| Total | 570 (100.0%) | 99 (100.0%) |
Monthly Housing Cost Tiers in Essex
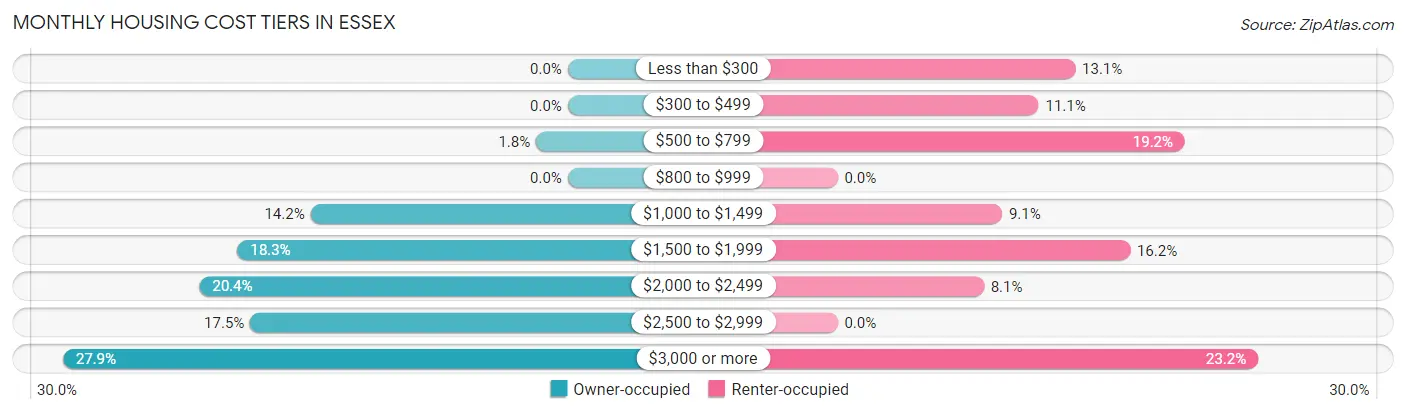
| Monthly Cost | Owner-occupied | Renter-occupied |
| Less than $300 | 0 (0.0%) | 13 (13.1%) |
| $300 to $499 | 0 (0.0%) | 11 (11.1%) |
| $500 to $799 | 10 (1.8%) | 19 (19.2%) |
| $800 to $999 | 0 (0.0%) | 0 (0.0%) |
| $1,000 to $1,499 | 81 (14.2%) | 9 (9.1%) |
| $1,500 to $1,999 | 104 (18.2%) | 16 (16.2%) |
| $2,000 to $2,499 | 116 (20.3%) | 8 (8.1%) |
| $2,500 to $2,999 | 100 (17.5%) | 0 (0.0%) |
| $3,000 or more | 159 (27.9%) | 23 (23.2%) |
| Total | 570 (100.0%) | 99 (100.0%) |
Physical Housing Characteristics in Essex
Housing Structures in Essex
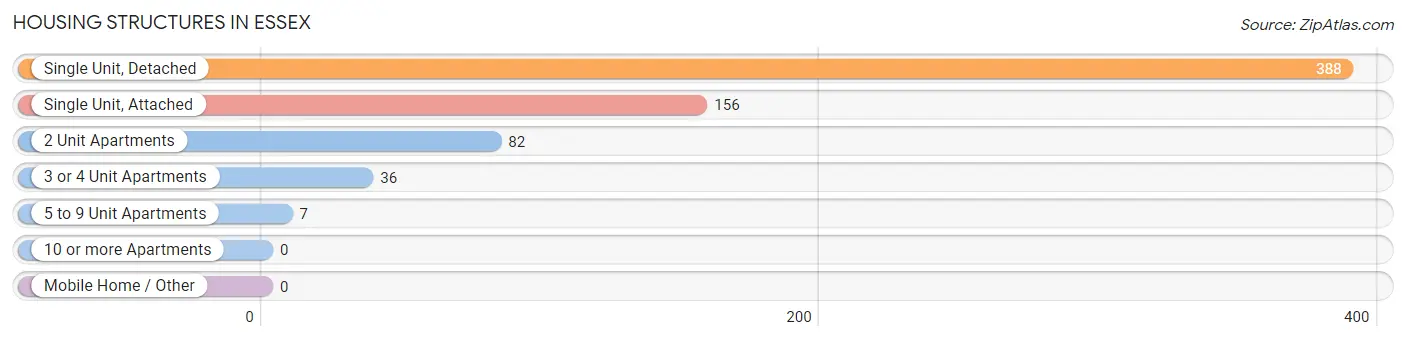
| Structure Type | # Housing Units | % Housing Units |
| Single Unit, Detached | 388 | 58.0% |
| Single Unit, Attached | 156 | 23.3% |
| 2 Unit Apartments | 82 | 12.3% |
| 3 or 4 Unit Apartments | 36 | 5.4% |
| 5 to 9 Unit Apartments | 7 | 1.1% |
| 10 or more Apartments | 0 | 0.0% |
| Mobile Home / Other | 0 | 0.0% |
| Total | 669 | 100.0% |
Housing Structures by Occupancy in Essex
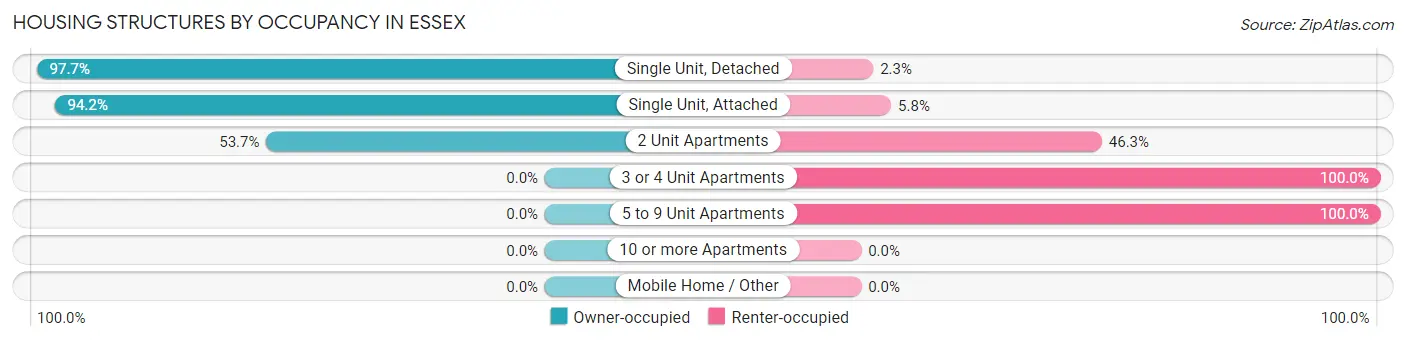
| Structure Type | Owner-occupied | Renter-occupied |
| Single Unit, Detached | 379 (97.7%) | 9 (2.3%) |
| Single Unit, Attached | 147 (94.2%) | 9 (5.8%) |
| 2 Unit Apartments | 44 (53.7%) | 38 (46.3%) |
| 3 or 4 Unit Apartments | 0 (0.0%) | 36 (100.0%) |
| 5 to 9 Unit Apartments | 0 (0.0%) | 7 (100.0%) |
| 10 or more Apartments | 0 (0.0%) | 0 (0.0%) |
| Mobile Home / Other | 0 (0.0%) | 0 (0.0%) |
| Total | 570 (85.2%) | 99 (14.8%) |
Housing Structures by Number of Rooms in Essex
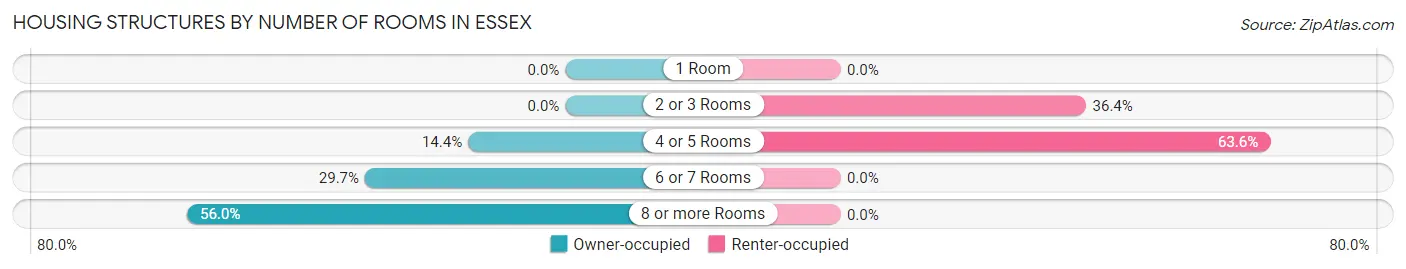
| Number of Rooms | Owner-occupied | Renter-occupied |
| 1 Room | 0 (0.0%) | 0 (0.0%) |
| 2 or 3 Rooms | 0 (0.0%) | 36 (36.4%) |
| 4 or 5 Rooms | 82 (14.4%) | 63 (63.6%) |
| 6 or 7 Rooms | 169 (29.6%) | 0 (0.0%) |
| 8 or more Rooms | 319 (56.0%) | 0 (0.0%) |
| Total | 570 (100.0%) | 99 (100.0%) |
Housing Structure by Heating Type in Essex
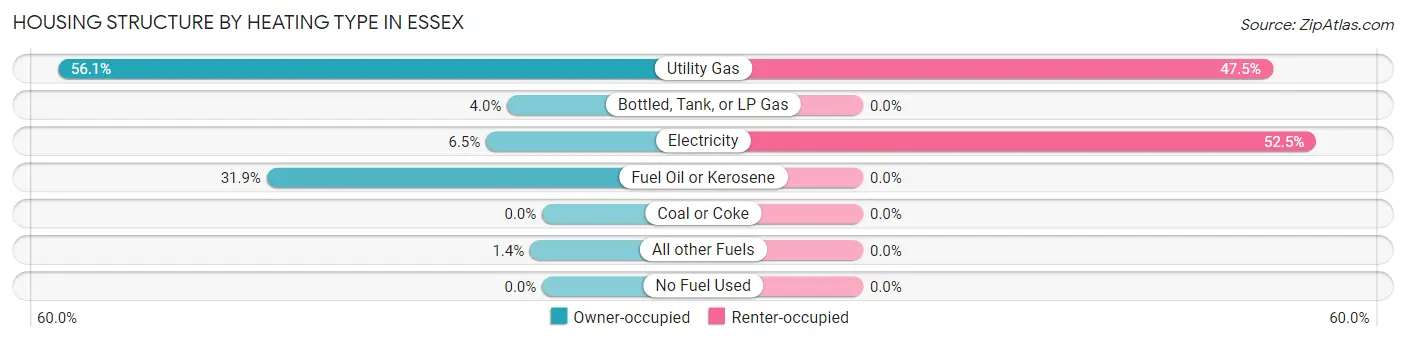
| Heating Type | Owner-occupied | Renter-occupied |
| Utility Gas | 320 (56.1%) | 47 (47.5%) |
| Bottled, Tank, or LP Gas | 23 (4.0%) | 0 (0.0%) |
| Electricity | 37 (6.5%) | 52 (52.5%) |
| Fuel Oil or Kerosene | 182 (31.9%) | 0 (0.0%) |
| Coal or Coke | 0 (0.0%) | 0 (0.0%) |
| All other Fuels | 8 (1.4%) | 0 (0.0%) |
| No Fuel Used | 0 (0.0%) | 0 (0.0%) |
| Total | 570 (100.0%) | 99 (100.0%) |
Household Vehicle Usage in Essex
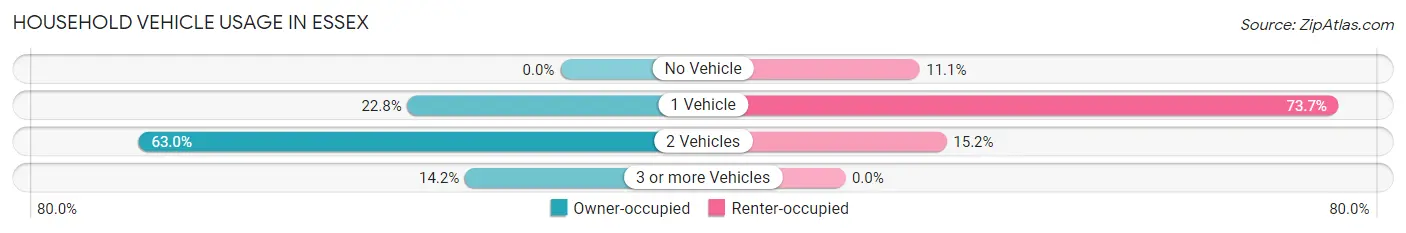
| Vehicles per Household | Owner-occupied | Renter-occupied |
| No Vehicle | 0 (0.0%) | 11 (11.1%) |
| 1 Vehicle | 130 (22.8%) | 73 (73.7%) |
| 2 Vehicles | 359 (63.0%) | 15 (15.1%) |
| 3 or more Vehicles | 81 (14.2%) | 0 (0.0%) |
| Total | 570 (100.0%) | 99 (100.0%) |
Real Estate & Mortgages in Essex
Real Estate and Mortgage Overview in Essex
| Characteristic | Without Mortgage | With Mortgage |
| Housing Units | 141 | 429 |
| Median Property Value | $776,900 | $653,300 |
| Median Household Income | $144,750 | $217 |
| Monthly Housing Costs | $1,501 | $159 |
| Real Estate Taxes | $10,001 | $34 |
Property Value by Mortgage Status in Essex
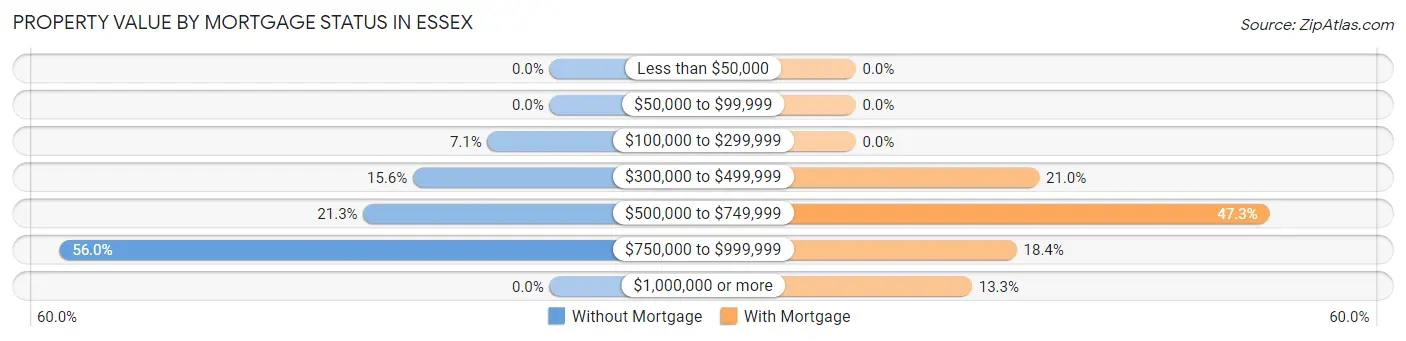
| Property Value | Without Mortgage | With Mortgage |
| Less than $50,000 | 0 (0.0%) | 0 (0.0%) |
| $50,000 to $99,999 | 0 (0.0%) | 0 (0.0%) |
| $100,000 to $299,999 | 10 (7.1%) | 0 (0.0%) |
| $300,000 to $499,999 | 22 (15.6%) | 90 (21.0%) |
| $500,000 to $749,999 | 30 (21.3%) | 203 (47.3%) |
| $750,000 to $999,999 | 79 (56.0%) | 79 (18.4%) |
| $1,000,000 or more | 0 (0.0%) | 57 (13.3%) |
| Total | 141 (100.0%) | 429 (100.0%) |
Household Income by Mortgage Status in Essex
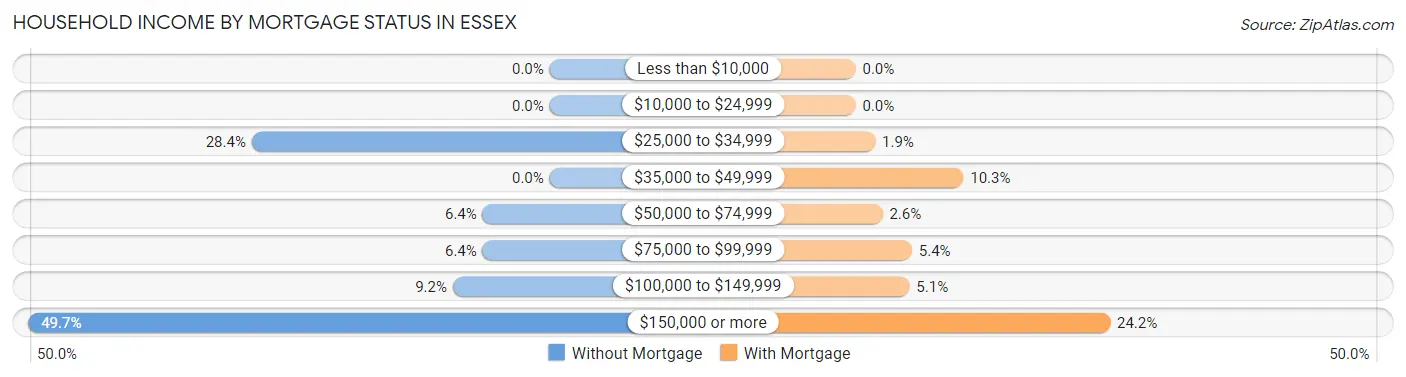
| Household Income | Without Mortgage | With Mortgage |
| Less than $10,000 | 0 (0.0%) | 0 (0.0%) |
| $10,000 to $24,999 | 0 (0.0%) | 0 (0.0%) |
| $25,000 to $34,999 | 40 (28.4%) | 8 (1.9%) |
| $35,000 to $49,999 | 0 (0.0%) | 44 (10.3%) |
| $50,000 to $74,999 | 9 (6.4%) | 11 (2.6%) |
| $75,000 to $99,999 | 9 (6.4%) | 23 (5.4%) |
| $100,000 to $149,999 | 13 (9.2%) | 22 (5.1%) |
| $150,000 or more | 70 (49.6%) | 104 (24.2%) |
| Total | 141 (100.0%) | 429 (100.0%) |
Property Value to Household Income Ratio in Essex
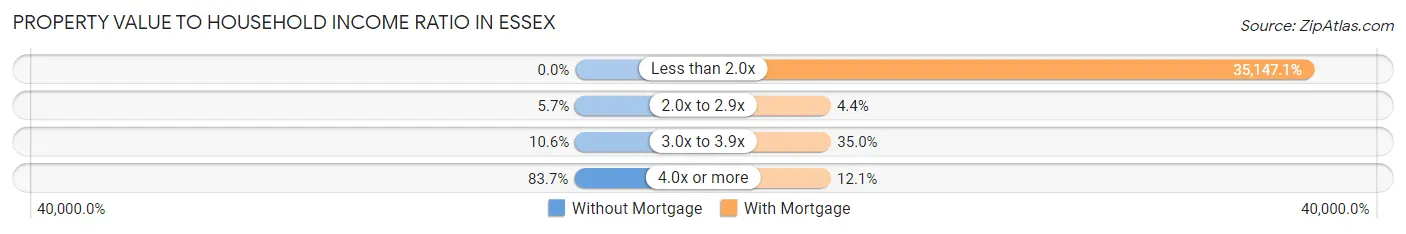
| Value-to-Income Ratio | Without Mortgage | With Mortgage |
| Less than 2.0x | 0 (0.0%) | 150,781 (35,147.1%) |
| 2.0x to 2.9x | 8 (5.7%) | 19 (4.4%) |
| 3.0x to 3.9x | 15 (10.6%) | 150 (35.0%) |
| 4.0x or more | 118 (83.7%) | 52 (12.1%) |
| Total | 141 (100.0%) | 429 (100.0%) |
Real Estate Taxes by Mortgage Status in Essex
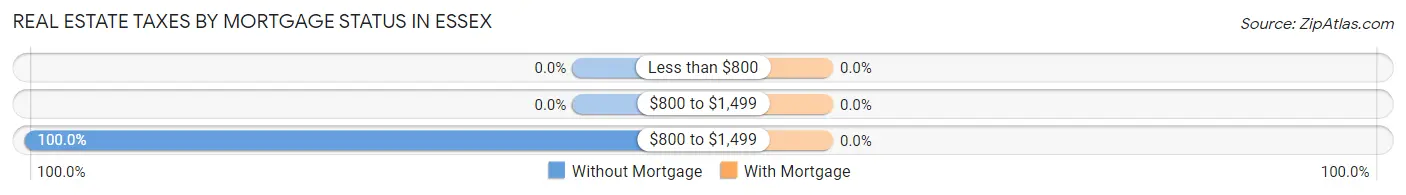
| Property Taxes | Without Mortgage | With Mortgage |
| Less than $800 | 0 (0.0%) | 0 (0.0%) |
| $800 to $1,499 | 0 (0.0%) | 0 (0.0%) |
| $800 to $1,499 | 141 (100.0%) | 0 (0.0%) |
| Total | 141 (100.0%) | 429 (100.0%) |
Health & Disability in Essex
Health Insurance Coverage by Age in Essex
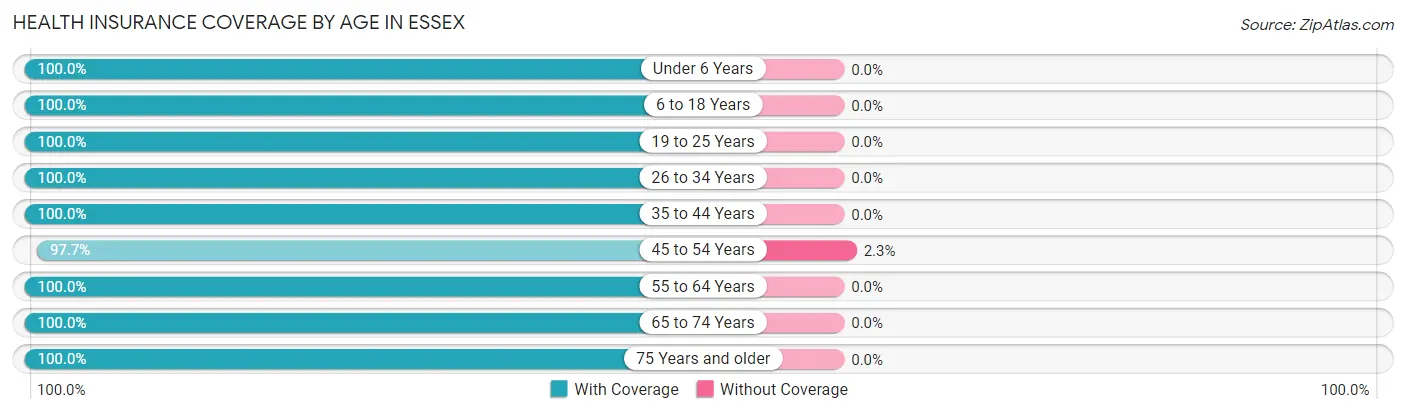
| Age Bracket | With Coverage | Without Coverage |
| Under 6 Years | 171 (100.0%) | 0 (0.0%) |
| 6 to 18 Years | 383 (100.0%) | 0 (0.0%) |
| 19 to 25 Years | 124 (100.0%) | 0 (0.0%) |
| 26 to 34 Years | 98 (100.0%) | 0 (0.0%) |
| 35 to 44 Years | 229 (100.0%) | 0 (0.0%) |
| 45 to 54 Years | 338 (97.7%) | 8 (2.3%) |
| 55 to 64 Years | 261 (100.0%) | 0 (0.0%) |
| 65 to 74 Years | 152 (100.0%) | 0 (0.0%) |
| 75 Years and older | 116 (100.0%) | 0 (0.0%) |
| Total | 1,872 (99.6%) | 8 (0.4%) |
Health Insurance Coverage by Citizenship Status in Essex
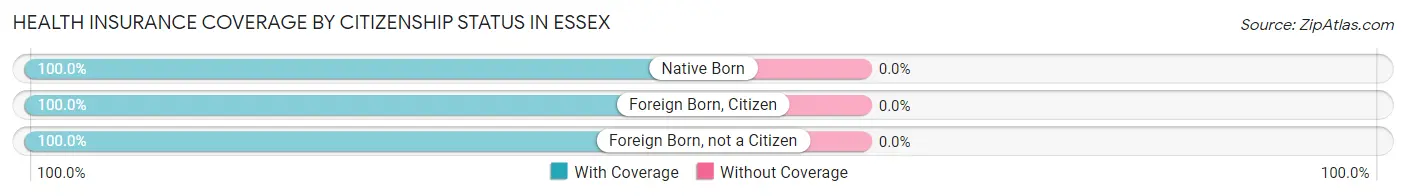
| Citizenship Status | With Coverage | Without Coverage |
| Native Born | 171 (100.0%) | 0 (0.0%) |
| Foreign Born, Citizen | 383 (100.0%) | 0 (0.0%) |
| Foreign Born, not a Citizen | 124 (100.0%) | 0 (0.0%) |
Health Insurance Coverage by Household Income in Essex
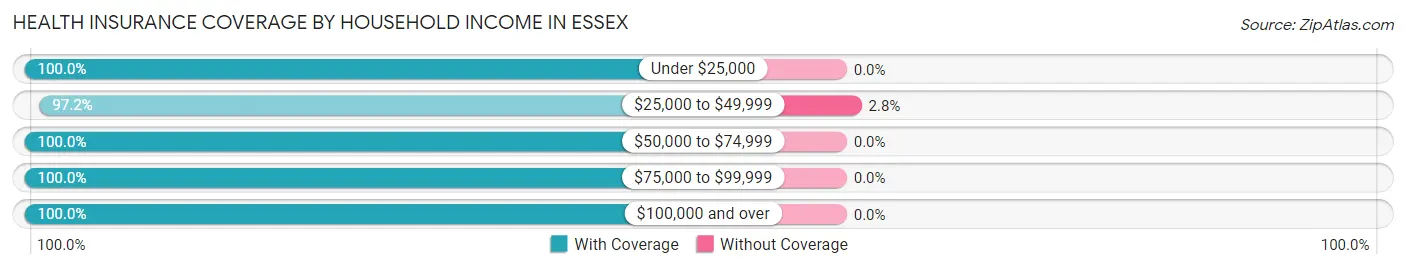
| Household Income | With Coverage | Without Coverage |
| Under $25,000 | 76 (100.0%) | 0 (0.0%) |
| $25,000 to $49,999 | 280 (97.2%) | 8 (2.8%) |
| $50,000 to $74,999 | 79 (100.0%) | 0 (0.0%) |
| $75,000 to $99,999 | 72 (100.0%) | 0 (0.0%) |
| $100,000 and over | 1,365 (100.0%) | 0 (0.0%) |
Public vs Private Health Insurance Coverage by Age in Essex
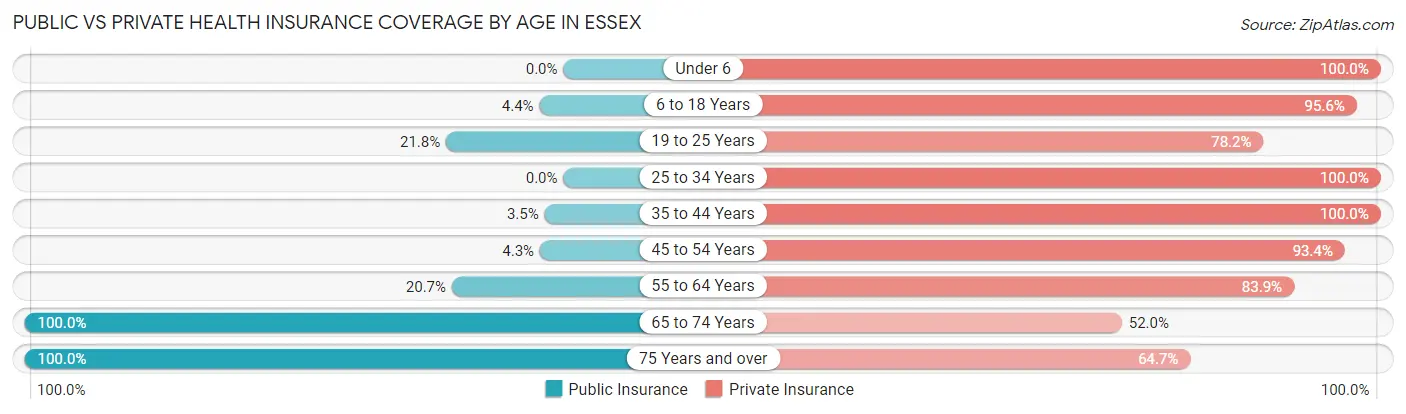
| Age Bracket | Public Insurance | Private Insurance |
| Under 6 | 0 (0.0%) | 171 (100.0%) |
| 6 to 18 Years | 17 (4.4%) | 366 (95.6%) |
| 19 to 25 Years | 27 (21.8%) | 97 (78.2%) |
| 25 to 34 Years | 0 (0.0%) | 98 (100.0%) |
| 35 to 44 Years | 8 (3.5%) | 229 (100.0%) |
| 45 to 54 Years | 15 (4.3%) | 323 (93.3%) |
| 55 to 64 Years | 54 (20.7%) | 219 (83.9%) |
| 65 to 74 Years | 152 (100.0%) | 79 (52.0%) |
| 75 Years and over | 116 (100.0%) | 75 (64.7%) |
| Total | 389 (20.7%) | 1,657 (88.1%) |
Disability Status by Sex by Age in Essex
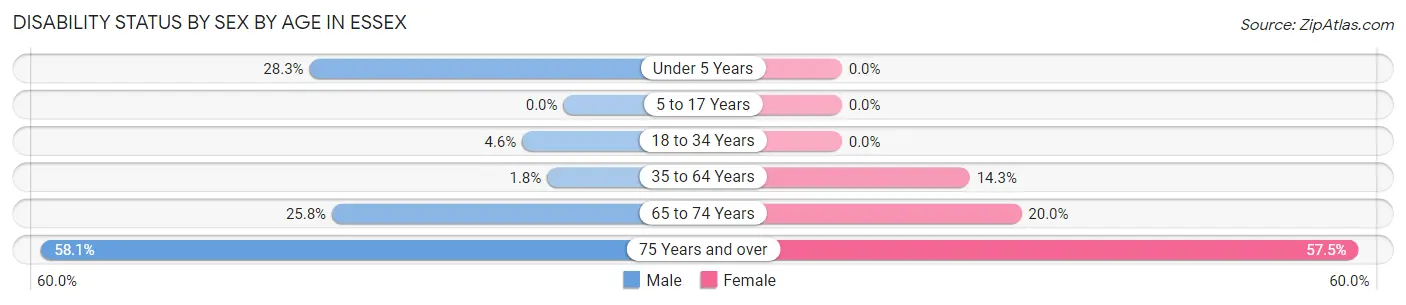
| Age Bracket | Male | Female |
| Under 5 Years | 28 (28.3%) | 0 (0.0%) |
| 5 to 17 Years | 0 (0.0%) | 0 (0.0%) |
| 18 to 34 Years | 5 (4.6%) | 0 (0.0%) |
| 35 to 64 Years | 7 (1.8%) | 64 (14.2%) |
| 65 to 74 Years | 25 (25.8%) | 11 (20.0%) |
| 75 Years and over | 25 (58.1%) | 42 (57.5%) |
Disability Class by Sex by Age in Essex
Disability Class: Hearing Difficulty
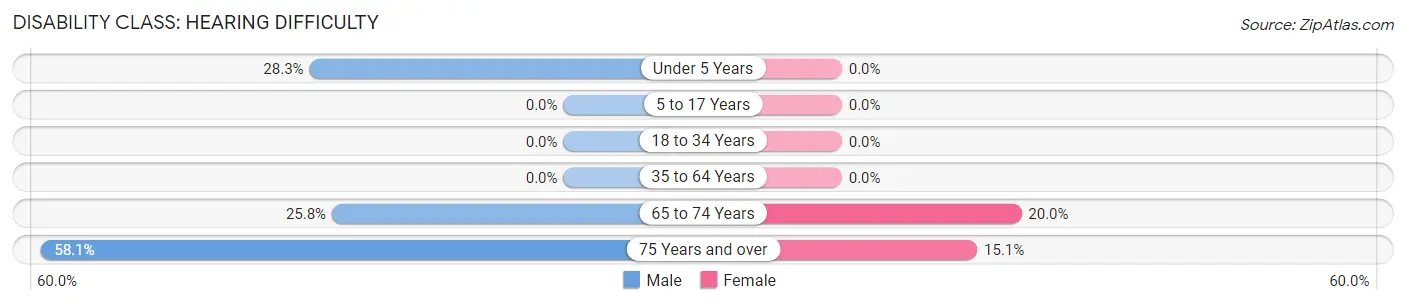
| Age Bracket | Male | Female |
| Under 5 Years | 28 (28.3%) | 0 (0.0%) |
| 5 to 17 Years | 0 (0.0%) | 0 (0.0%) |
| 18 to 34 Years | 0 (0.0%) | 0 (0.0%) |
| 35 to 64 Years | 0 (0.0%) | 0 (0.0%) |
| 65 to 74 Years | 25 (25.8%) | 11 (20.0%) |
| 75 Years and over | 25 (58.1%) | 11 (15.1%) |
Disability Class: Vision Difficulty
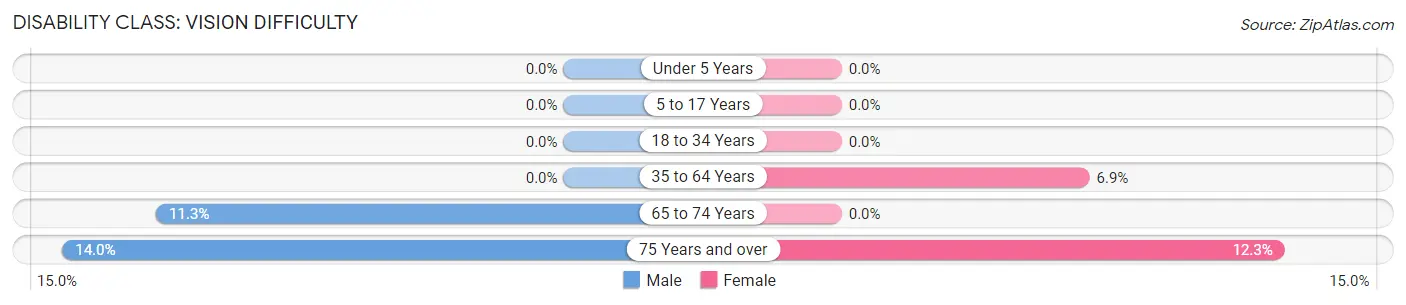
| Age Bracket | Male | Female |
| Under 5 Years | 0 (0.0%) | 0 (0.0%) |
| 5 to 17 Years | 0 (0.0%) | 0 (0.0%) |
| 18 to 34 Years | 0 (0.0%) | 0 (0.0%) |
| 35 to 64 Years | 0 (0.0%) | 31 (6.9%) |
| 65 to 74 Years | 11 (11.3%) | 0 (0.0%) |
| 75 Years and over | 6 (14.0%) | 9 (12.3%) |
Disability Class: Cognitive Difficulty
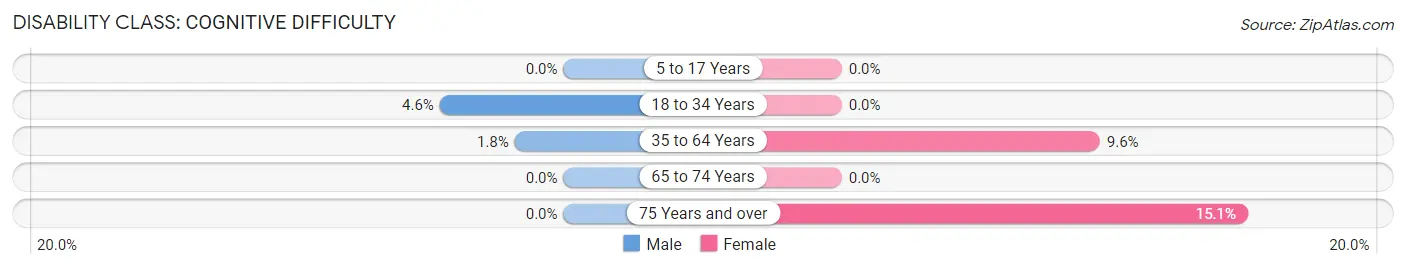
| Age Bracket | Male | Female |
| 5 to 17 Years | 0 (0.0%) | 0 (0.0%) |
| 18 to 34 Years | 5 (4.6%) | 0 (0.0%) |
| 35 to 64 Years | 7 (1.8%) | 43 (9.6%) |
| 65 to 74 Years | 0 (0.0%) | 0 (0.0%) |
| 75 Years and over | 0 (0.0%) | 11 (15.1%) |
Disability Class: Ambulatory Difficulty
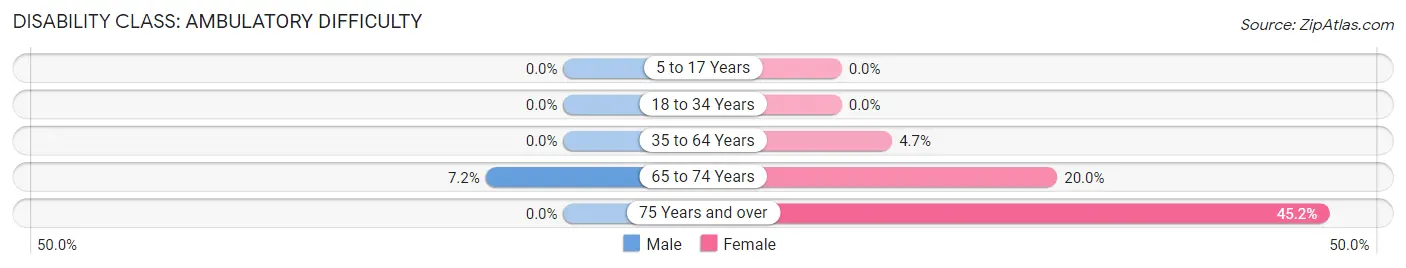
| Age Bracket | Male | Female |
| 5 to 17 Years | 0 (0.0%) | 0 (0.0%) |
| 18 to 34 Years | 0 (0.0%) | 0 (0.0%) |
| 35 to 64 Years | 0 (0.0%) | 21 (4.7%) |
| 65 to 74 Years | 7 (7.2%) | 11 (20.0%) |
| 75 Years and over | 0 (0.0%) | 33 (45.2%) |
Disability Class: Self-Care Difficulty
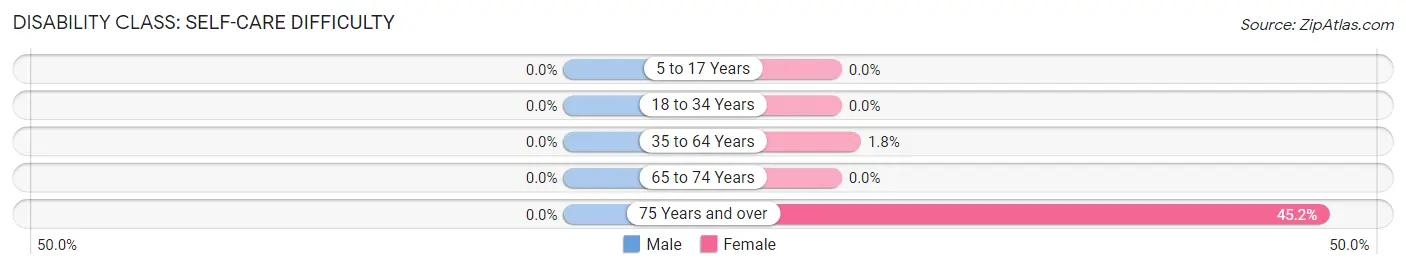
| Age Bracket | Male | Female |
| 5 to 17 Years | 0 (0.0%) | 0 (0.0%) |
| 18 to 34 Years | 0 (0.0%) | 0 (0.0%) |
| 35 to 64 Years | 0 (0.0%) | 8 (1.8%) |
| 65 to 74 Years | 0 (0.0%) | 0 (0.0%) |
| 75 Years and over | 0 (0.0%) | 33 (45.2%) |
Technology Access in Essex
Computing Device Access in Essex
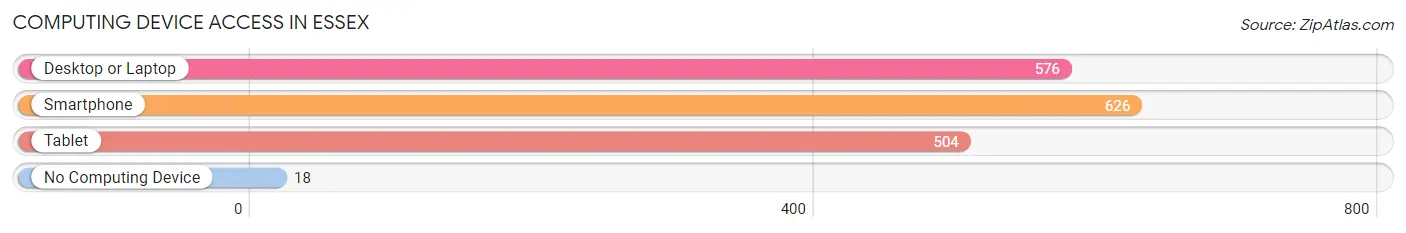
| Device Type | # Households | % Households |
| Desktop or Laptop | 576 | 86.1% |
| Smartphone | 626 | 93.6% |
| Tablet | 504 | 75.3% |
| No Computing Device | 18 | 2.7% |
| Total | 669 | 100.0% |
Internet Access in Essex
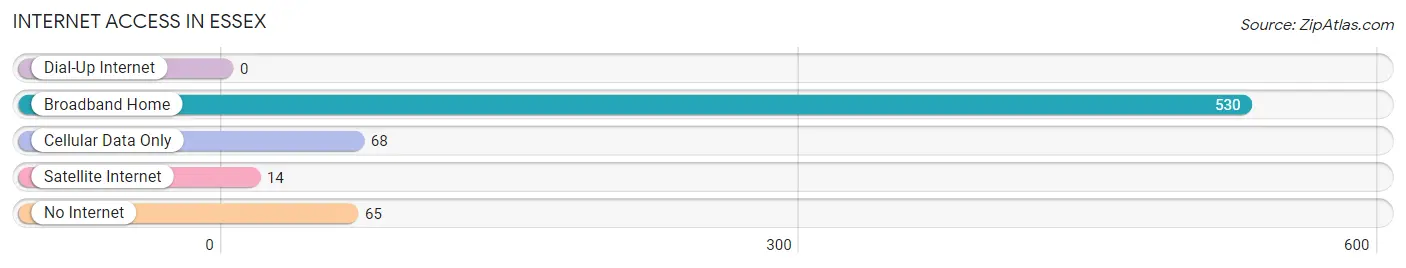
| Internet Type | # Households | % Households |
| Dial-Up Internet | 0 | 0.0% |
| Broadband Home | 530 | 79.2% |
| Cellular Data Only | 68 | 10.2% |
| Satellite Internet | 14 | 2.1% |
| No Internet | 65 | 9.7% |
| Total | 669 | 100.0% |
Essex Summary
Essex, Massachusetts is a small town located in the northeastern part of the state, about 25 miles north of Boston. It is bordered by the towns of Ipswich, Hamilton, Wenham, and Manchester-by-the-Sea. The town has a population of approximately 3,500 people and covers an area of about 10 square miles.
History
Essex was first settled in 1634 by a group of settlers from Ipswich. The town was originally part of Ipswich, but was incorporated as its own town in 1819. The town was named after the English county of Essex, which was the home of many of the original settlers.
Essex was a major fishing and shipbuilding center in the 19th century. The town was home to several shipyards, including the famous A.D. Story Shipyard, which built many of the famous clipper ships of the era. The town was also home to several fish processing plants, which processed cod, haddock, and other fish caught in the nearby waters.
Geography
Essex is located in the northeastern part of Massachusetts, about 25 miles north of Boston. The town is bordered by the towns of Ipswich, Hamilton, Wenham, and Manchester-by-the-Sea. The town is located on the Essex River, which flows into the Atlantic Ocean. The town is mostly flat, with some hills in the northern part of town.
The town is home to several parks and conservation areas, including the Essex River Wildlife Sanctuary, the Essex County Greenbelt, and the Essex National Heritage Area. The town is also home to several beaches, including Crane Beach and Plum Island Beach.
Economy
Essex is a small, rural town with a largely agricultural economy. The town is home to several farms, which produce a variety of crops, including apples, cranberries, and blueberries. The town is also home to several nurseries, which produce a variety of plants and flowers.
The town is also home to several small businesses, including restaurants, retail stores, and art galleries. The town is also home to several marinas, which provide services to boaters and fishermen.
Demographics
As of the 2010 census, Essex had a population of 3,504 people. The racial makeup of the town was 94.3% White, 1.2% African American, 0.3% Native American, 1.2% Asian, 0.1% Pacific Islander, 1.2% from other races, and 1.7% from two or more races. Hispanic or Latino of any race were 3.2% of the population.
The median household income in Essex was $68,750, and the median family income was $77,917. The per capita income for the town was $32,917. About 4.3% of families and 5.7% of the population were below the poverty line, including 6.3% of those under age 18 and 4.2% of those age 65 or over.
Common Questions
What is Per Capita Income in Essex?
Per Capita income in Essex is $55,647.
What is the Median Family Income in Essex?
Median Family Income in Essex is $152,083.
What is the Median Household income in Essex?
Median Household Income in Essex is $143,615.
What is Income or Wage Gap in Essex?
Income or Wage Gap in Essex is 50.3%.
Women in Essex earn 49.7 cents for every dollar earned by a man.
What is Inequality or Gini Index in Essex?
Inequality or Gini Index in Essex is 0.41.
What is the Total Population of Essex?
Total Population of Essex is 1,880.
What is the Total Male Population of Essex?
Total Male Population of Essex is 930.
What is the Total Female Population of Essex?
Total Female Population of Essex is 950.
What is the Ratio of Males per 100 Females in Essex?
There are 97.89 Males per 100 Females in Essex.
What is the Ratio of Females per 100 Males in Essex?
There are 102.15 Females per 100 Males in Essex.
What is the Median Population Age in Essex?
Median Population Age in Essex is 39.4 Years.
What is the Average Family Size in Essex
Average Family Size in Essex is 3.3 People.
What is the Average Household Size in Essex
Average Household Size in Essex is 2.8 People.
How Large is the Labor Force in Essex?
There are 1,090 People in the Labor Forcein in Essex.
What is the Percentage of People in the Labor Force in Essex?
75.1% of People are in the Labor Force in Essex.
What is the Unemployment Rate in Essex?
Unemployment Rate in Essex is 1.1%.