Ipswich, MA Map & Demographics
Ipswich Map
Ipswich Overview
$59,867
PER CAPITA INCOME
$146,723
AVG FAMILY INCOME
$95,342
AVG HOUSEHOLD INCOME
36.9%
WAGE / INCOME GAP [ % ]
63.1¢/ $1
WAGE / INCOME GAP [ $ ]
$12,843
FAMILY INCOME DEFICIT
0.49
INEQUALITY / GINI INDEX
4,872
TOTAL POPULATION
2,295
MALE POPULATION
2,577
FEMALE POPULATION
89.06
MALES / 100 FEMALES
112.29
FEMALES / 100 MALES
42.7
MEDIAN AGE
3.1
AVG FAMILY SIZE
2.3
AVG HOUSEHOLD SIZE
2,913
LABOR FORCE [ PEOPLE ]
72.3%
PERCENT IN LABOR FORCE
2.8%
UNEMPLOYMENT RATE
Ipswich Zip Codes
Ipswich Area Codes
Income in Ipswich
Income Overview in Ipswich
Per Capita Income in Ipswich is $59,867, while median incomes of families and households are $146,723 and $95,342 respectively.
| Characteristic | Number | Measure |
| Per Capita Income | 4,872 | $59,867 |
| Median Family Income | 1,201 | $146,723 |
| Mean Family Income | 1,201 | $180,967 |
| Median Household Income | 2,105 | $95,342 |
| Mean Household Income | 2,105 | $139,472 |
| Income Deficit | 1,201 | $12,843 |
| Wage / Income Gap (%) | 4,872 | 36.91% |
| Wage / Income Gap ($) | 4,872 | 63.09¢ per $1 |
| Gini / Inequality Index | 4,872 | 0.49 |
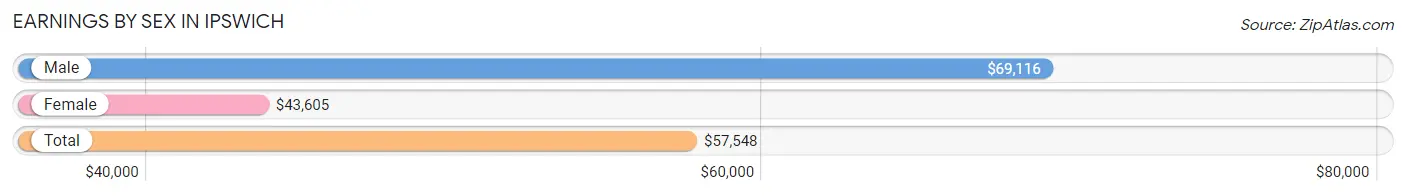
Earnings by Sex in Ipswich
Average Earnings in Ipswich are $57,548, $69,116 for men and $43,605 for women, a difference of 36.9%.
| Sex | Number | Average Earnings |
| Male | 1,703 (55.7%) | $69,116 |
| Female | 1,353 (44.3%) | $43,605 |
| Total | 3,056 (100.0%) | $57,548 |
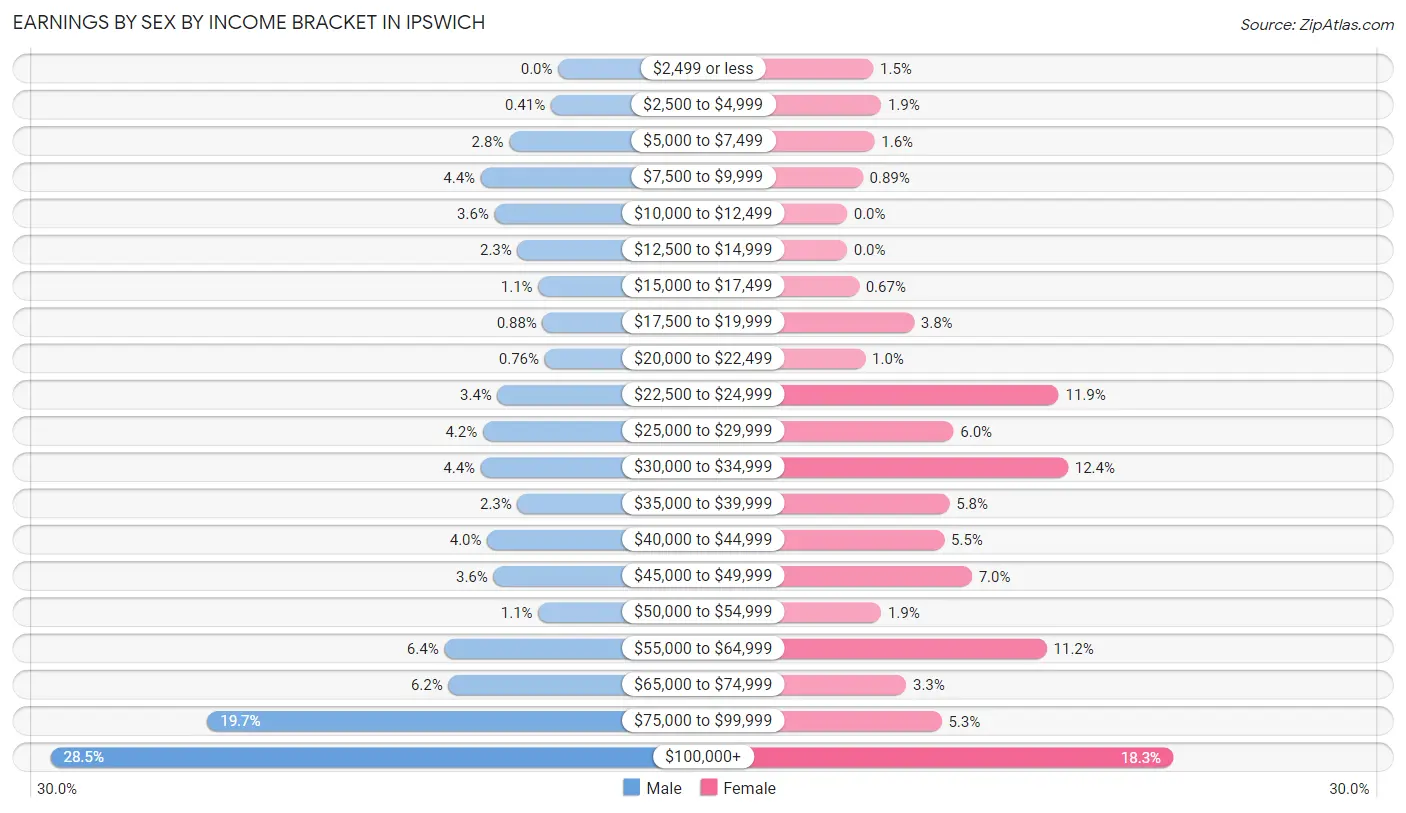
Earnings by Sex by Income Bracket in Ipswich
The most common earnings brackets in Ipswich are $100,000+ for men (486 | 28.5%) and $100,000+ for women (248 | 18.3%).
| Income | Male | Female |
| $2,499 or less | 0 (0.0%) | 20 (1.5%) |
| $2,500 to $4,999 | 7 (0.4%) | 26 (1.9%) |
| $5,000 to $7,499 | 47 (2.8%) | 21 (1.5%) |
| $7,500 to $9,999 | 74 (4.3%) | 12 (0.9%) |
| $10,000 to $12,499 | 61 (3.6%) | 0 (0.0%) |
| $12,500 to $14,999 | 39 (2.3%) | 0 (0.0%) |
| $15,000 to $17,499 | 19 (1.1%) | 9 (0.7%) |
| $17,500 to $19,999 | 15 (0.9%) | 51 (3.8%) |
| $20,000 to $22,499 | 13 (0.8%) | 14 (1.0%) |
| $22,500 to $24,999 | 58 (3.4%) | 161 (11.9%) |
| $25,000 to $29,999 | 72 (4.2%) | 81 (6.0%) |
| $30,000 to $34,999 | 74 (4.3%) | 168 (12.4%) |
| $35,000 to $39,999 | 39 (2.3%) | 78 (5.8%) |
| $40,000 to $44,999 | 68 (4.0%) | 74 (5.5%) |
| $45,000 to $49,999 | 62 (3.6%) | 95 (7.0%) |
| $50,000 to $54,999 | 19 (1.1%) | 26 (1.9%) |
| $55,000 to $64,999 | 109 (6.4%) | 152 (11.2%) |
| $65,000 to $74,999 | 105 (6.2%) | 45 (3.3%) |
| $75,000 to $99,999 | 336 (19.7%) | 72 (5.3%) |
| $100,000+ | 486 (28.5%) | 248 (18.3%) |
| Total | 1,703 (100.0%) | 1,353 (100.0%) |
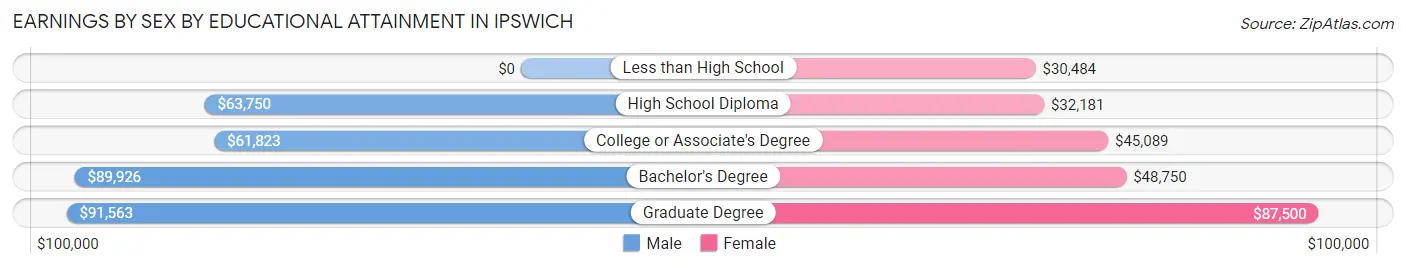
Earnings by Sex by Educational Attainment in Ipswich
Average earnings in Ipswich are $77,218 for men and $44,710 for women, a difference of 42.1%. Men with an educational attainment of graduate degree enjoy the highest average annual earnings of $91,563, while those with college or associate's degree education earn the least with $61,823. Women with an educational attainment of graduate degree earn the most with the average annual earnings of $87,500, while those with less than high school education have the smallest earnings of $30,484.
| Educational Attainment | Male Income | Female Income |
| Less than High School | - | - |
| High School Diploma | $63,750 | $32,181 |
| College or Associate's Degree | $61,823 | $45,089 |
| Bachelor's Degree | $89,926 | $48,750 |
| Graduate Degree | $91,563 | $87,500 |
| Total | $77,218 | $44,710 |
Family Income in Ipswich
Family Income Brackets in Ipswich
According to the Ipswich family income data, there are 386 families falling into the $200,000+ income range, which is the most common income bracket and makes up 32.1% of all families.
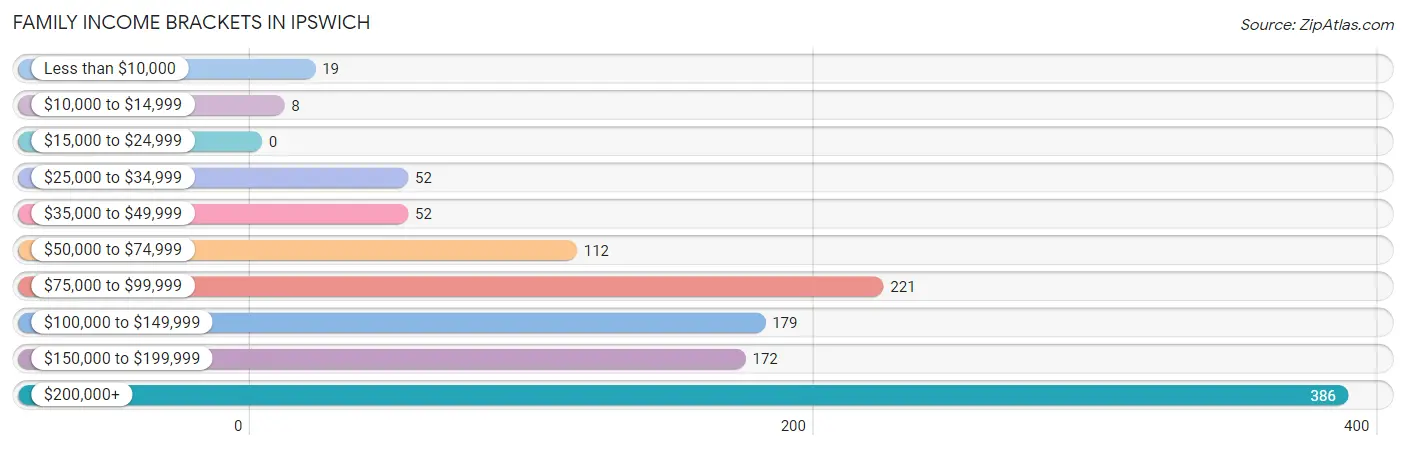
| Income Bracket | # Families | % Families |
| Less than $10,000 | 19 | 1.6% |
| $10,000 to $14,999 | 8 | 0.7% |
| $15,000 to $24,999 | 0 | 0.0% |
| $25,000 to $34,999 | 52 | 4.3% |
| $35,000 to $49,999 | 52 | 4.3% |
| $50,000 to $74,999 | 112 | 9.3% |
| $75,000 to $99,999 | 221 | 18.4% |
| $100,000 to $149,999 | 179 | 14.9% |
| $150,000 to $199,999 | 172 | 14.3% |
| $200,000+ | 386 | 32.1% |
Family Income by Famaliy Size in Ipswich
5-person families (178 | 14.8%) account for the highest median family income in Ipswich with $242,547 per family, while 2-person families (536 | 44.6%) have the highest median income of $53,636 per family member.
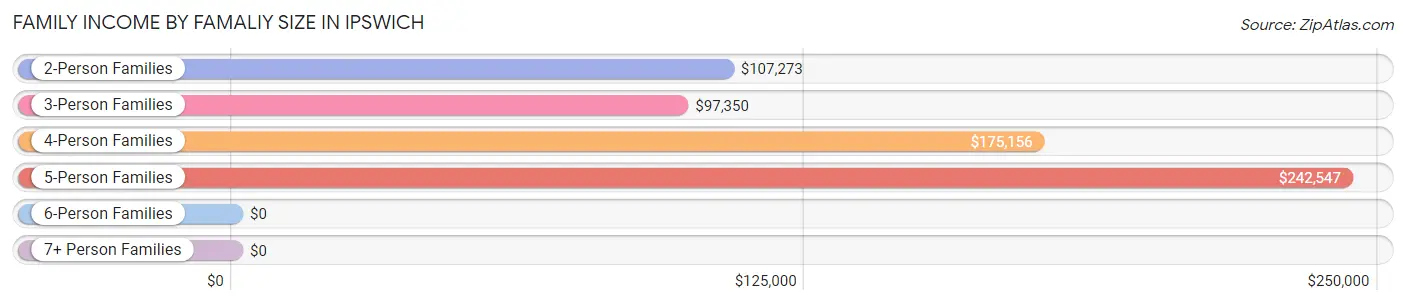
| Income Bracket | # Families | Median Income |
| 2-Person Families | 536 (44.6%) | $107,273 |
| 3-Person Families | 223 (18.6%) | $97,350 |
| 4-Person Families | 253 (21.1%) | $175,156 |
| 5-Person Families | 178 (14.8%) | $242,547 |
| 6-Person Families | 11 (0.9%) | $0 |
| 7+ Person Families | 0 (0.0%) | $0 |
| Total | 1,201 (100.0%) | $146,723 |
Family Income by Number of Earners in Ipswich
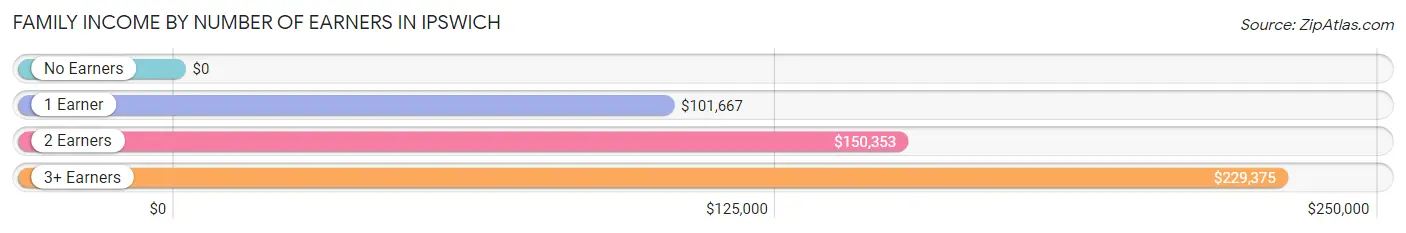
| Number of Earners | # Families | Median Income |
| No Earners | 72 (6.0%) | $0 |
| 1 Earner | 314 (26.1%) | $101,667 |
| 2 Earners | 619 (51.5%) | $150,353 |
| 3+ Earners | 196 (16.3%) | $229,375 |
| Total | 1,201 (100.0%) | $146,723 |
Household Income in Ipswich
Household Income Brackets in Ipswich
With 438 households falling in the category, the $200,000+ income range is the most frequent in Ipswich, accounting for 20.8% of all households. In contrast, only 61 households (2.9%) fall into the $15,000 to $24,999 income bracket, making it the least populous group.
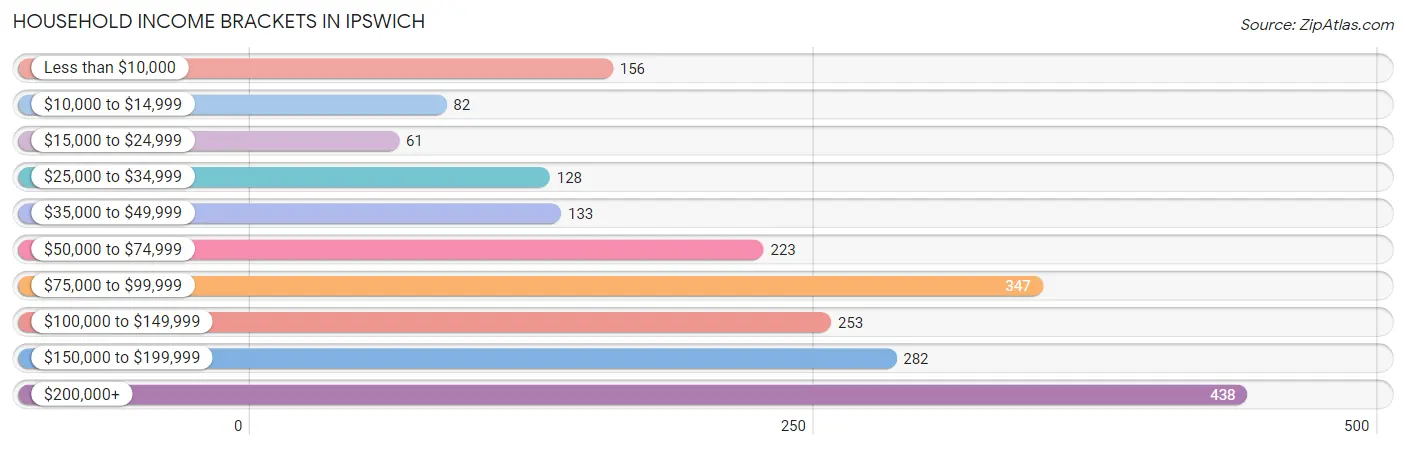
| Income Bracket | # Households | % Households |
| Less than $10,000 | 156 | 7.4% |
| $10,000 to $14,999 | 82 | 3.9% |
| $15,000 to $24,999 | 61 | 2.9% |
| $25,000 to $34,999 | 128 | 6.1% |
| $35,000 to $49,999 | 133 | 6.3% |
| $50,000 to $74,999 | 223 | 10.6% |
| $75,000 to $99,999 | 347 | 16.5% |
| $100,000 to $149,999 | 253 | 12.0% |
| $150,000 to $199,999 | 282 | 13.4% |
| $200,000+ | 438 | 20.8% |
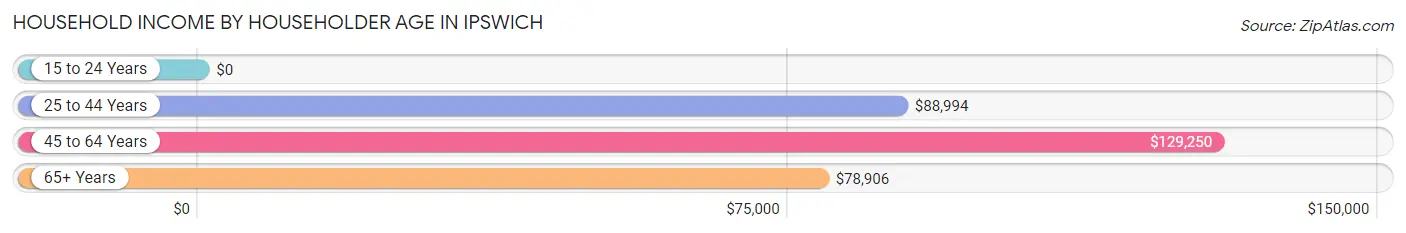
Household Income by Householder Age in Ipswich
The median household income in Ipswich is $95,342, with the highest median household income of $129,250 found in the 45 to 64 years age bracket for the primary householder. A total of 939 households (44.6%) fall into this category. Meanwhile, the 15 to 24 years age bracket for the primary householder has the lowest median household income of $0, with 24 households (1.1%) in this group.
| Income Bracket | # Households | Median Income |
| 15 to 24 Years | 24 (1.1%) | $0 |
| 25 to 44 Years | 689 (32.7%) | $88,994 |
| 45 to 64 Years | 939 (44.6%) | $129,250 |
| 65+ Years | 453 (21.5%) | $78,906 |
| Total | 2,105 (100.0%) | $95,342 |
Poverty in Ipswich
Income Below Poverty by Sex and Age in Ipswich
With 7.9% poverty level for males and 4.6% for females among the residents of Ipswich, 55 to 64 year old males and 55 to 64 year old females are the most vulnerable to poverty, with 67 males (22.9%) and 34 females (8.4%) in their respective age groups living below the poverty level.
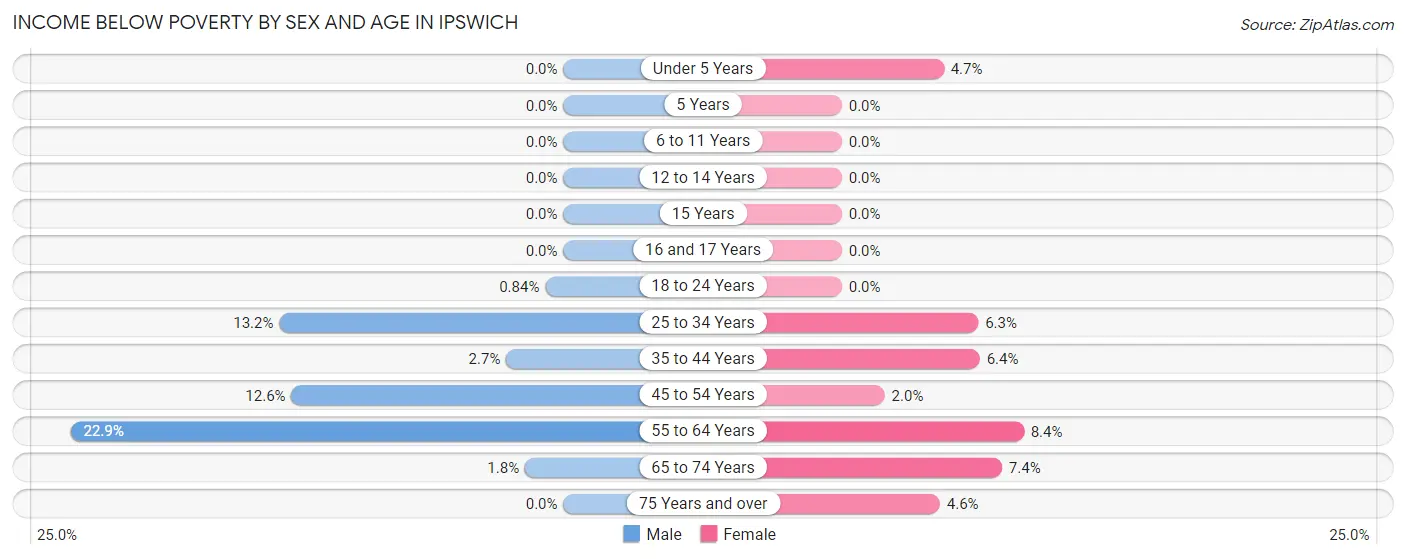
| Age Bracket | Male | Female |
| Under 5 Years | 0 (0.0%) | 7 (4.7%) |
| 5 Years | 0 (0.0%) | 0 (0.0%) |
| 6 to 11 Years | 0 (0.0%) | 0 (0.0%) |
| 12 to 14 Years | 0 (0.0%) | 0 (0.0%) |
| 15 Years | 0 (0.0%) | 0 (0.0%) |
| 16 and 17 Years | 0 (0.0%) | 0 (0.0%) |
| 18 to 24 Years | 2 (0.8%) | 0 (0.0%) |
| 25 to 34 Years | 34 (13.2%) | 19 (6.3%) |
| 35 to 44 Years | 10 (2.6%) | 29 (6.4%) |
| 45 to 54 Years | 66 (12.6%) | 6 (2.0%) |
| 55 to 64 Years | 67 (22.9%) | 34 (8.4%) |
| 65 to 74 Years | 3 (1.8%) | 15 (7.4%) |
| 75 Years and over | 0 (0.0%) | 8 (4.5%) |
| Total | 182 (7.9%) | 118 (4.6%) |
Income Above Poverty by Sex and Age in Ipswich
According to the poverty statistics in Ipswich, males aged under 5 years and females aged 5 years are the age groups that are most secure financially, with 100.0% of males and 100.0% of females in these age groups living above the poverty line.
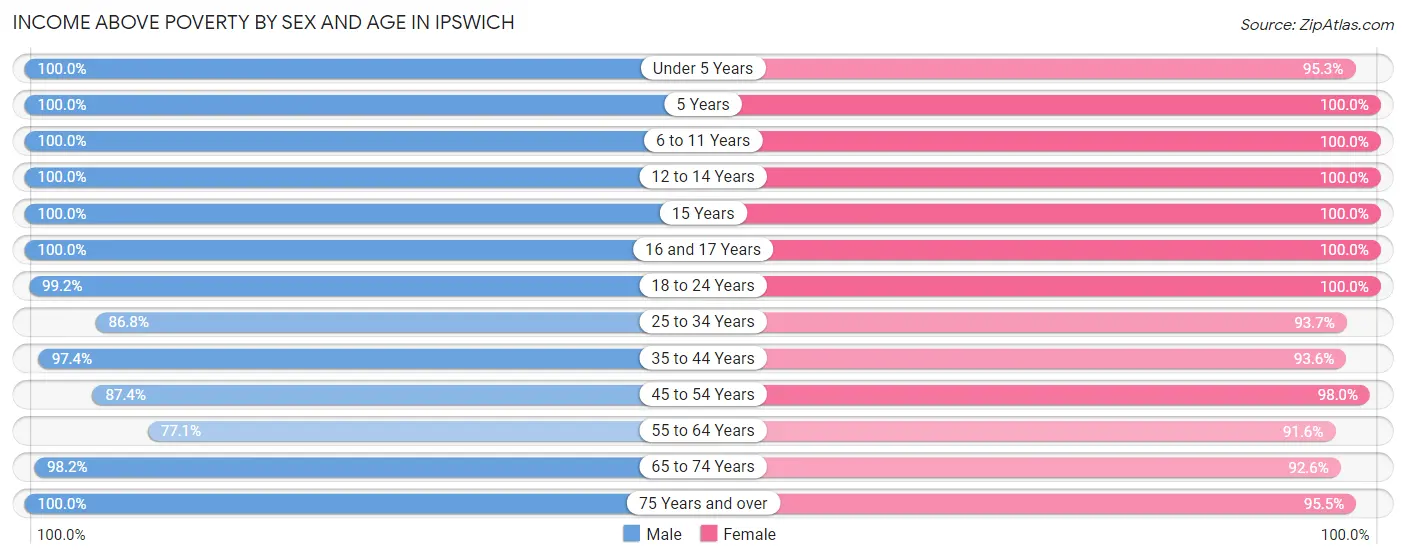
| Age Bracket | Male | Female |
| Under 5 Years | 50 (100.0%) | 141 (95.3%) |
| 5 Years | 16 (100.0%) | 12 (100.0%) |
| 6 to 11 Years | 75 (100.0%) | 276 (100.0%) |
| 12 to 14 Years | 68 (100.0%) | 136 (100.0%) |
| 15 Years | 48 (100.0%) | 14 (100.0%) |
| 16 and 17 Years | 45 (100.0%) | 66 (100.0%) |
| 18 to 24 Years | 237 (99.2%) | 90 (100.0%) |
| 25 to 34 Years | 224 (86.8%) | 281 (93.7%) |
| 35 to 44 Years | 367 (97.4%) | 424 (93.6%) |
| 45 to 54 Years | 457 (87.4%) | 295 (98.0%) |
| 55 to 64 Years | 226 (77.1%) | 369 (91.6%) |
| 65 to 74 Years | 166 (98.2%) | 187 (92.6%) |
| 75 Years and over | 134 (100.0%) | 168 (95.5%) |
| Total | 2,113 (92.1%) | 2,459 (95.4%) |
Income Below Poverty Among Married-Couple Families in Ipswich
The poverty statistics for married-couple families in Ipswich show that 2.9% or 28 of the total 976 families live below the poverty line. Families with no children have the highest poverty rate of 3.4%, comprising of 20 families. On the other hand, families with 3 or 4 children have the lowest poverty rate of 0.0%, which includes 0 families.
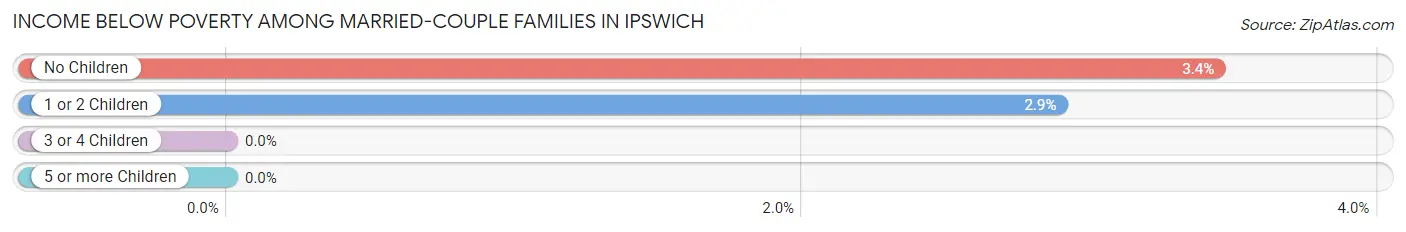
| Children | Above Poverty | Below Poverty |
| No Children | 561 (96.6%) | 20 (3.4%) |
| 1 or 2 Children | 269 (97.1%) | 8 (2.9%) |
| 3 or 4 Children | 118 (100.0%) | 0 (0.0%) |
| 5 or more Children | 0 (0.0%) | 0 (0.0%) |
| Total | 948 (97.1%) | 28 (2.9%) |
Income Below Poverty Among Single-Parent Households in Ipswich
| Children | Single Father | Single Mother |
| No Children | 0 (0.0%) | 0 (0.0%) |
| 1 or 2 Children | 0 (0.0%) | 0 (0.0%) |
| 3 or 4 Children | 0 (0.0%) | 0 (0.0%) |
| 5 or more Children | 0 (0.0%) | 0 (0.0%) |
| Total | 0 (0.0%) | 0 (0.0%) |
Income Below Poverty Among Married-Couple vs Single-Parent Households in Ipswich
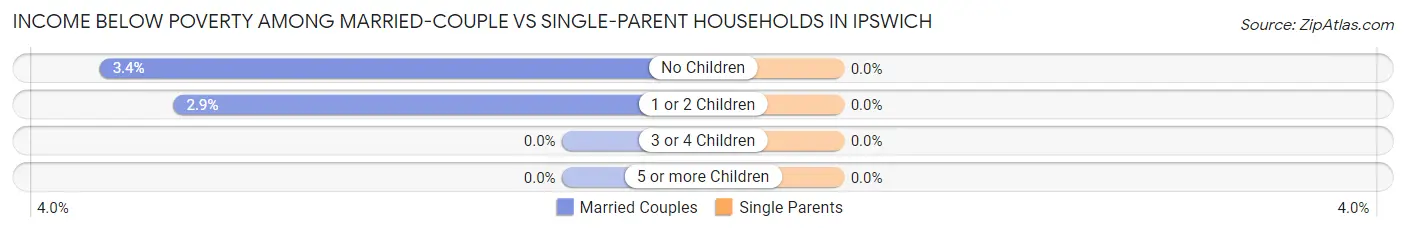
| Children | Married-Couple Families | Single-Parent Households |
| No Children | 20 (3.4%) | 0 (0.0%) |
| 1 or 2 Children | 8 (2.9%) | 0 (0.0%) |
| 3 or 4 Children | 0 (0.0%) | 0 (0.0%) |
| 5 or more Children | 0 (0.0%) | 0 (0.0%) |
| Total | 28 (2.9%) | 0 (0.0%) |
Race in Ipswich
The most populous races in Ipswich are White / Caucasian (4,434 | 91.0%), Asian (189 | 3.9%), and Hispanic or Latino (173 | 3.5%).
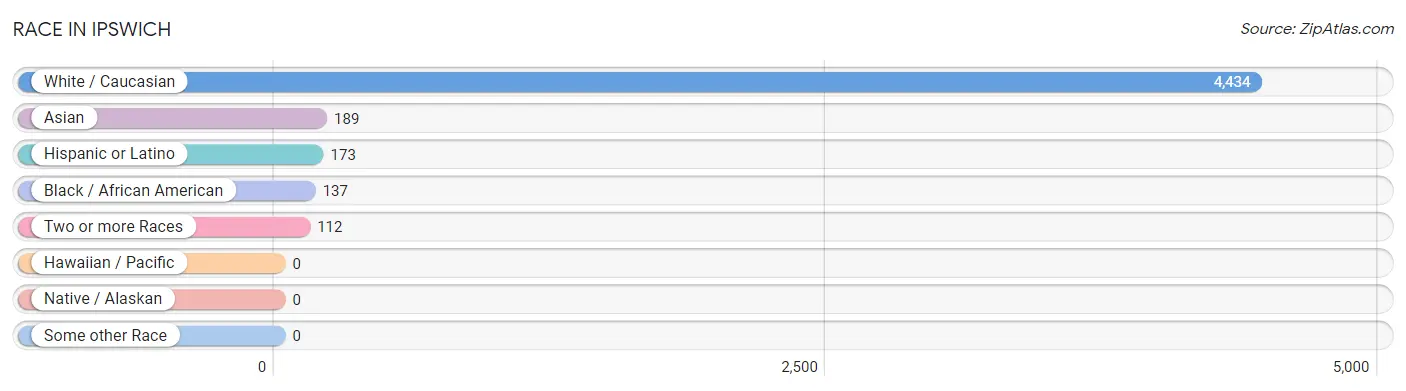
| Race | # Population | % Population |
| Asian | 189 | 3.9% |
| Black / African American | 137 | 2.8% |
| Hawaiian / Pacific | 0 | 0.0% |
| Hispanic or Latino | 173 | 3.5% |
| Native / Alaskan | 0 | 0.0% |
| White / Caucasian | 4,434 | 91.0% |
| Two or more Races | 112 | 2.3% |
| Some other Race | 0 | 0.0% |
| Total | 4,872 | 100.0% |
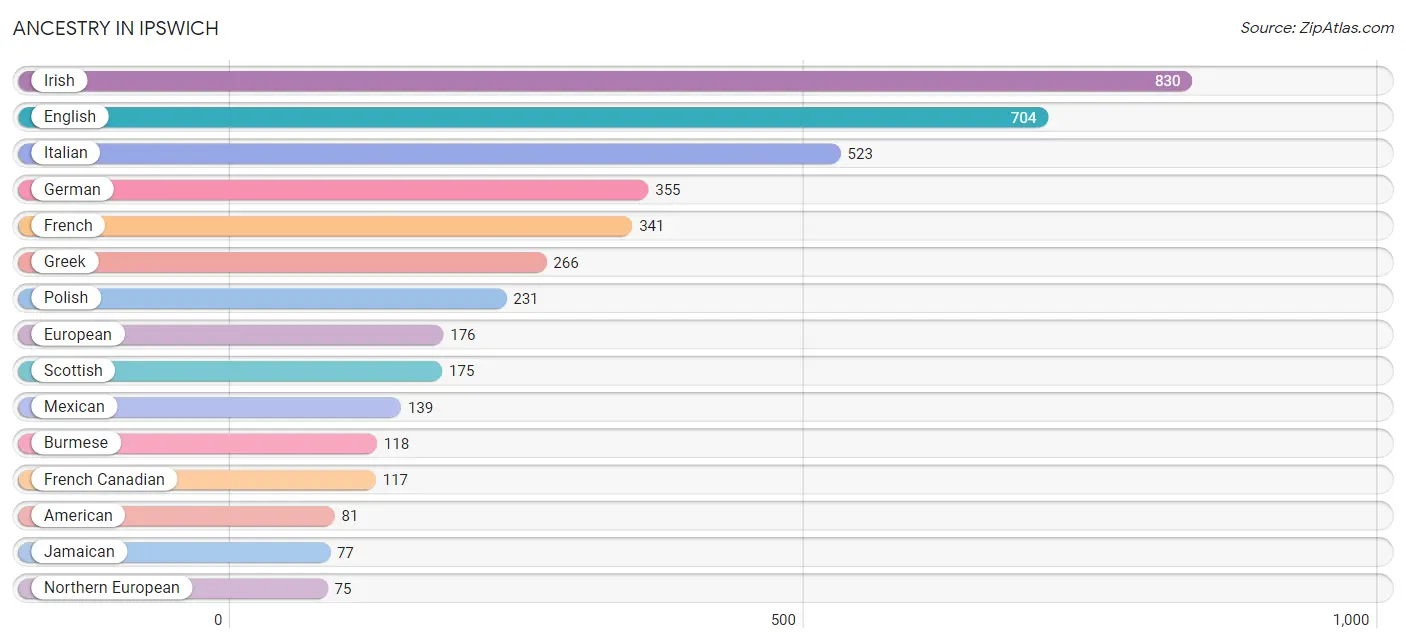
Ancestry in Ipswich
The most populous ancestries reported in Ipswich are Irish (830 | 17.0%), English (704 | 14.4%), Italian (523 | 10.7%), German (355 | 7.3%), and French (341 | 7.0%), together accounting for 56.5% of all Ipswich residents.
| Ancestry | # Population | % Population |
| Afghan | 17 | 0.4% |
| African | 7 | 0.1% |
| American | 81 | 1.7% |
| Arab | 13 | 0.3% |
| Austrian | 32 | 0.7% |
| Basque | 5 | 0.1% |
| Bhutanese | 9 | 0.2% |
| British | 50 | 1.0% |
| Burmese | 118 | 2.4% |
| Canadian | 27 | 0.5% |
| Cherokee | 29 | 0.6% |
| Dutch | 7 | 0.1% |
| English | 704 | 14.4% |
| European | 176 | 3.6% |
| French | 341 | 7.0% |
| French Canadian | 117 | 2.4% |
| German | 355 | 7.3% |
| Greek | 266 | 5.5% |
| Hungarian | 6 | 0.1% |
| Indian (Asian) | 43 | 0.9% |
| Iranian | 26 | 0.5% |
| Irish | 830 | 17.0% |
| Italian | 523 | 10.7% |
| Jamaican | 77 | 1.6% |
| Korean | 44 | 0.9% |
| Lebanese | 7 | 0.1% |
| Mexican | 139 | 2.9% |
| Northern European | 75 | 1.5% |
| Norwegian | 31 | 0.6% |
| Peruvian | 8 | 0.2% |
| Polish | 231 | 4.7% |
| Portuguese | 45 | 0.9% |
| Puerto Rican | 1 | 0.0% |
| Romanian | 28 | 0.6% |
| Scandinavian | 10 | 0.2% |
| Scotch-Irish | 18 | 0.4% |
| Scottish | 175 | 3.6% |
| Slovak | 6 | 0.1% |
| South American | 33 | 0.7% |
| Subsaharan African | 7 | 0.1% |
| Swedish | 59 | 1.2% |
| Syrian | 6 | 0.1% |
| Ukrainian | 72 | 1.5% |
| Uruguayan | 25 | 0.5% |
| Welsh | 21 | 0.4% | View All 45 Rows |
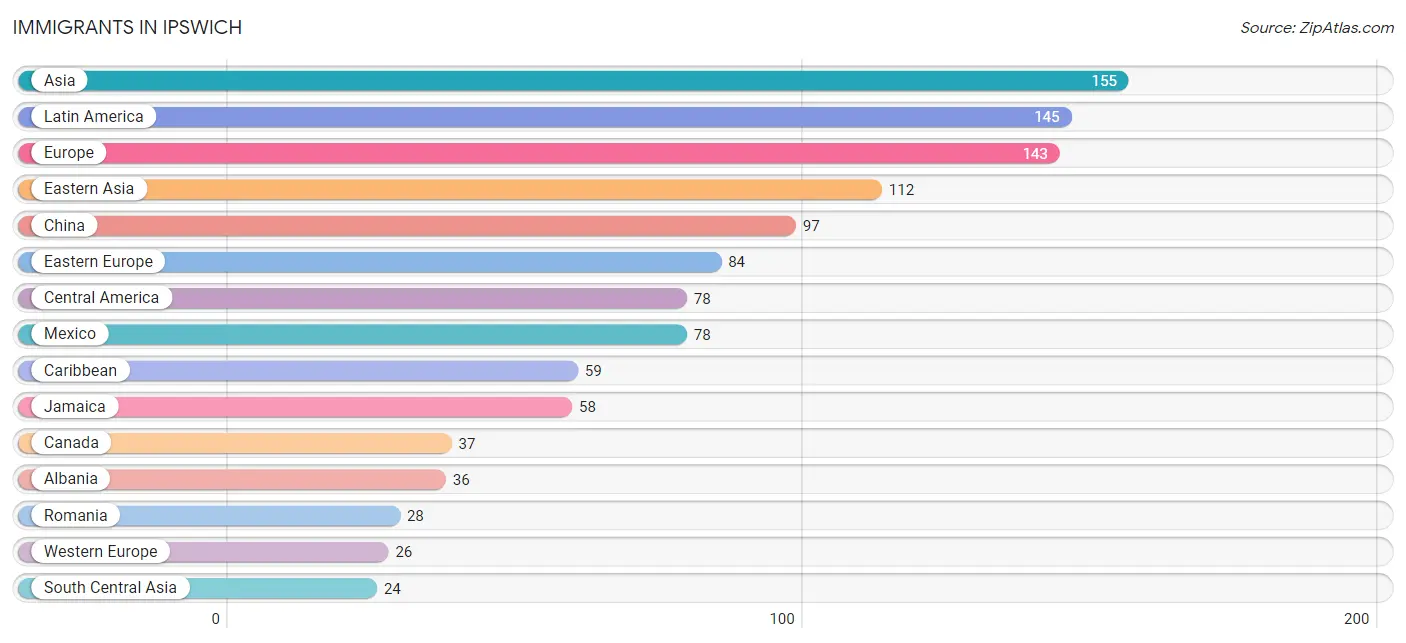
Immigrants in Ipswich
The most numerous immigrant groups reported in Ipswich came from Asia (155 | 3.2%), Latin America (145 | 3.0%), Europe (143 | 2.9%), Eastern Asia (112 | 2.3%), and China (97 | 2.0%), together accounting for 13.4% of all Ipswich residents.
| Immigration Origin | # Population | % Population |
| Afghanistan | 17 | 0.4% |
| Africa | 1 | 0.0% |
| Albania | 36 | 0.7% |
| Asia | 155 | 3.2% |
| Austria | 14 | 0.3% |
| Canada | 37 | 0.8% |
| Caribbean | 59 | 1.2% |
| Central America | 78 | 1.6% |
| China | 97 | 2.0% |
| Dominican Republic | 1 | 0.0% |
| Eastern Asia | 112 | 2.3% |
| Eastern Europe | 84 | 1.7% |
| Europe | 143 | 2.9% |
| Germany | 12 | 0.3% |
| Greece | 11 | 0.2% |
| Ireland | 16 | 0.3% |
| Jamaica | 58 | 1.2% |
| Japan | 15 | 0.3% |
| Jordan | 12 | 0.3% |
| Latin America | 145 | 3.0% |
| Mexico | 78 | 1.6% |
| Northern Europe | 22 | 0.4% |
| Pakistan | 7 | 0.1% |
| Peru | 8 | 0.2% |
| Philippines | 7 | 0.1% |
| Romania | 28 | 0.6% |
| South Africa | 1 | 0.0% |
| South America | 8 | 0.2% |
| South Central Asia | 24 | 0.5% |
| South Eastern Asia | 7 | 0.1% |
| Southern Europe | 11 | 0.2% |
| Ukraine | 20 | 0.4% |
| Western Asia | 12 | 0.3% |
| Western Europe | 26 | 0.5% | View All 34 Rows |
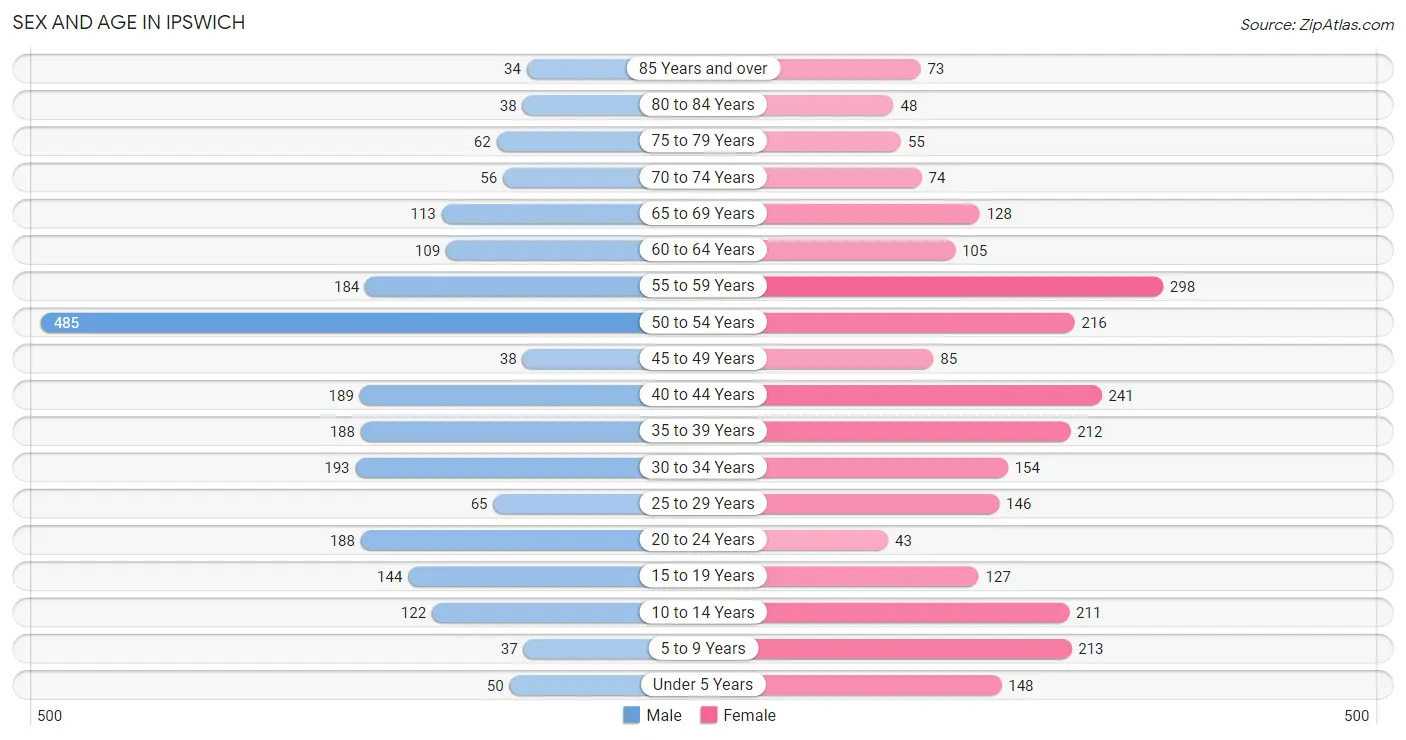
Sex and Age in Ipswich
Sex and Age in Ipswich
The most populous age groups in Ipswich are 50 to 54 Years (485 | 21.1%) for men and 55 to 59 Years (298 | 11.6%) for women.
| Age Bracket | Male | Female |
| Under 5 Years | 50 (2.2%) | 148 (5.7%) |
| 5 to 9 Years | 37 (1.6%) | 213 (8.3%) |
| 10 to 14 Years | 122 (5.3%) | 211 (8.2%) |
| 15 to 19 Years | 144 (6.3%) | 127 (4.9%) |
| 20 to 24 Years | 188 (8.2%) | 43 (1.7%) |
| 25 to 29 Years | 65 (2.8%) | 146 (5.7%) |
| 30 to 34 Years | 193 (8.4%) | 154 (6.0%) |
| 35 to 39 Years | 188 (8.2%) | 212 (8.2%) |
| 40 to 44 Years | 189 (8.2%) | 241 (9.3%) |
| 45 to 49 Years | 38 (1.7%) | 85 (3.3%) |
| 50 to 54 Years | 485 (21.1%) | 216 (8.4%) |
| 55 to 59 Years | 184 (8.0%) | 298 (11.6%) |
| 60 to 64 Years | 109 (4.8%) | 105 (4.1%) |
| 65 to 69 Years | 113 (4.9%) | 128 (5.0%) |
| 70 to 74 Years | 56 (2.4%) | 74 (2.9%) |
| 75 to 79 Years | 62 (2.7%) | 55 (2.1%) |
| 80 to 84 Years | 38 (1.7%) | 48 (1.9%) |
| 85 Years and over | 34 (1.5%) | 73 (2.8%) |
| Total | 2,295 (100.0%) | 2,577 (100.0%) |
Families and Households in Ipswich
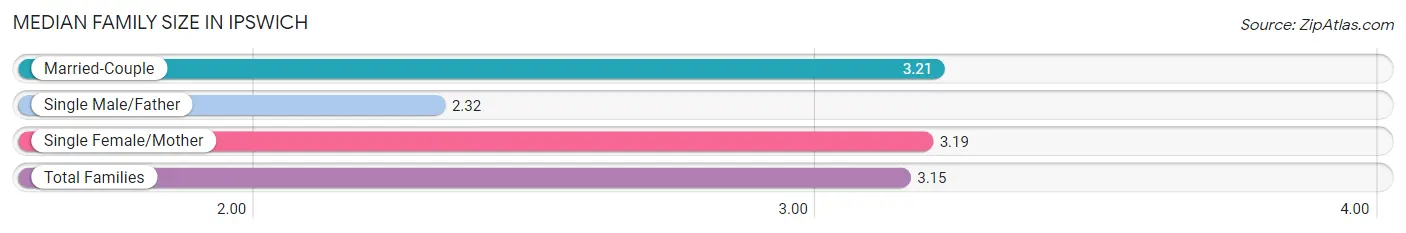
Median Family Size in Ipswich
The median family size in Ipswich is 3.15 persons per family, with married-couple families (976 | 81.3%) accounting for the largest median family size of 3.21 persons per family. On the other hand, single male/father families (76 | 6.3%) represent the smallest median family size with 2.32 persons per family.
| Family Type | # Families | Family Size |
| Married-Couple | 976 (81.3%) | 3.21 |
| Single Male/Father | 76 (6.3%) | 2.32 |
| Single Female/Mother | 149 (12.4%) | 3.19 |
| Total Families | 1,201 (100.0%) | 3.15 |
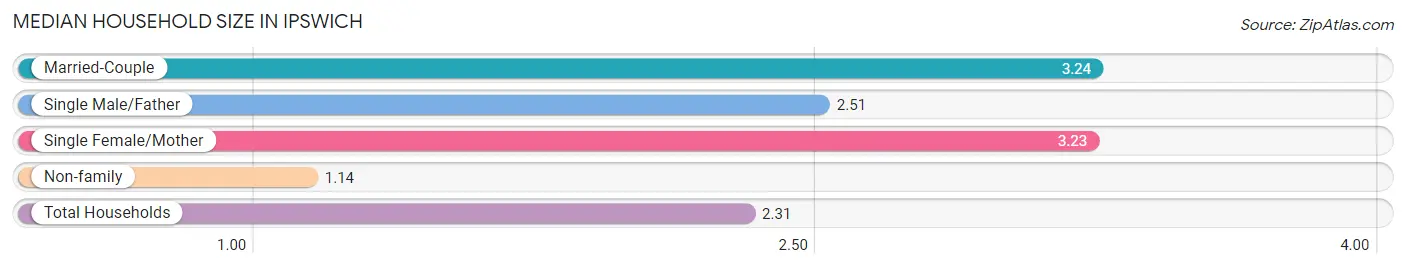
Median Household Size in Ipswich
The median household size in Ipswich is 2.31 persons per household, with married-couple households (976 | 46.4%) accounting for the largest median household size of 3.24 persons per household. non-family households (904 | 42.9%) represent the smallest median household size with 1.14 persons per household.
| Household Type | # Households | Household Size |
| Married-Couple | 976 (46.4%) | 3.24 |
| Single Male/Father | 76 (3.6%) | 2.51 |
| Single Female/Mother | 149 (7.1%) | 3.23 |
| Non-family | 904 (42.9%) | 1.14 |
| Total Households | 2,105 (100.0%) | 2.31 |
Household Size by Marriage Status in Ipswich
Out of a total of 2,105 households in Ipswich, 1,201 (57.1%) are family households, while 904 (42.9%) are nonfamily households. The most numerous type of family households are 2-person households, comprising 509, and the most common type of nonfamily households are 1-person households, comprising 833.
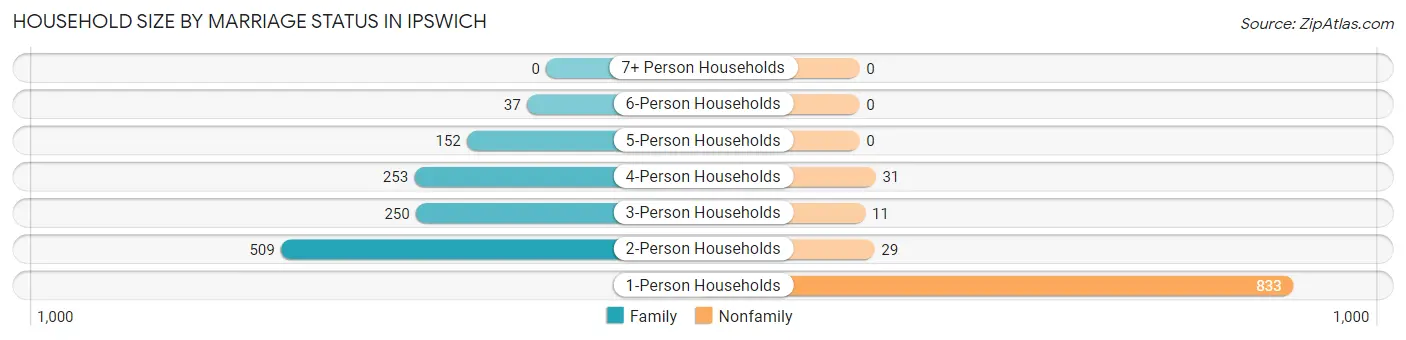
| Household Size | Family Households | Nonfamily Households |
| 1-Person Households | - | 833 (39.6%) |
| 2-Person Households | 509 (24.2%) | 29 (1.4%) |
| 3-Person Households | 250 (11.9%) | 11 (0.5%) |
| 4-Person Households | 253 (12.0%) | 31 (1.5%) |
| 5-Person Households | 152 (7.2%) | 0 (0.0%) |
| 6-Person Households | 37 (1.8%) | 0 (0.0%) |
| 7+ Person Households | 0 (0.0%) | 0 (0.0%) |
| Total | 1,201 (57.1%) | 904 (42.9%) |
Female Fertility in Ipswich
Fertility by Age in Ipswich
Average fertility rate in Ipswich is 34.0 births per 1,000 women. Women in the age bracket of 20 to 34 years have the highest fertility rate with 41.0 births per 1,000 women. Women in the age bracket of 35 to 50 years acount for 60.0% of all women with births.
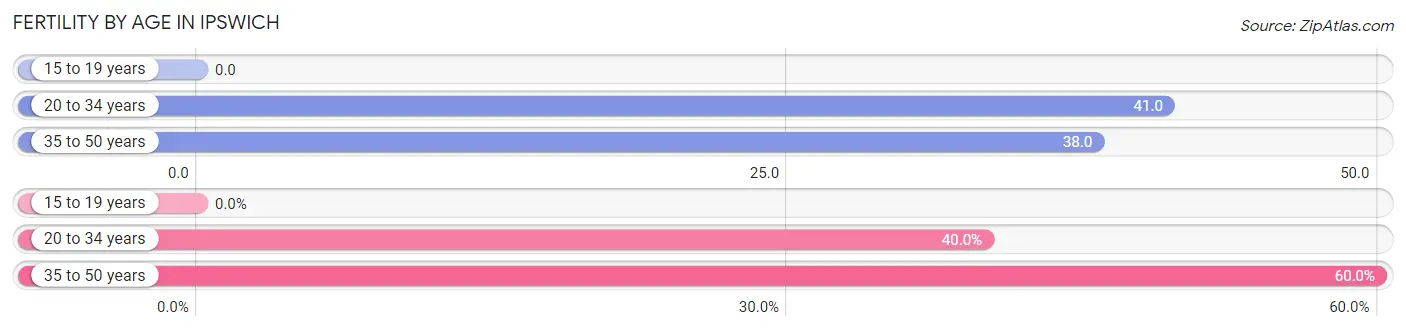
| Age Bracket | Women with Births | Births / 1,000 Women |
| 15 to 19 years | 0 (0.0%) | 0.0 |
| 20 to 34 years | 14 (40.0%) | 41.0 |
| 35 to 50 years | 21 (60.0%) | 38.0 |
| Total | 35 (100.0%) | 34.0 |
Fertility by Age by Marriage Status in Ipswich
77.1% of women with births (35) in Ipswich are married. The highest percentage of unmarried women with births falls into 35 to 50 years age bracket with 38.1% of them unmarried at the time of birth, while the lowest percentage of unmarried women with births belong to 20 to 34 years age bracket with 0.0% of them unmarried.
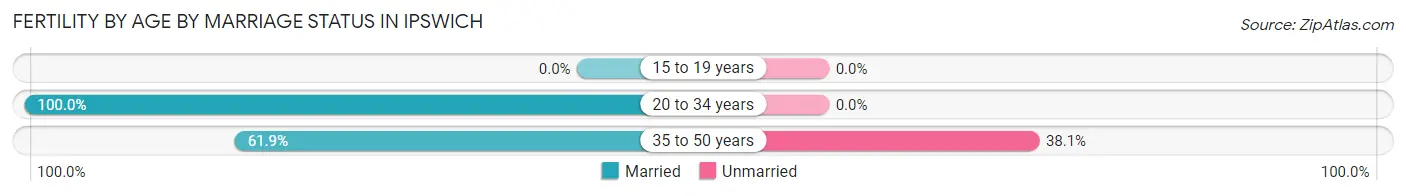
| Age Bracket | Married | Unmarried |
| 15 to 19 years | 0 (0.0%) | 0 (0.0%) |
| 20 to 34 years | 14 (100.0%) | 0 (0.0%) |
| 35 to 50 years | 13 (61.9%) | 8 (38.1%) |
| Total | 27 (77.1%) | 8 (22.9%) |
Fertility by Education in Ipswich
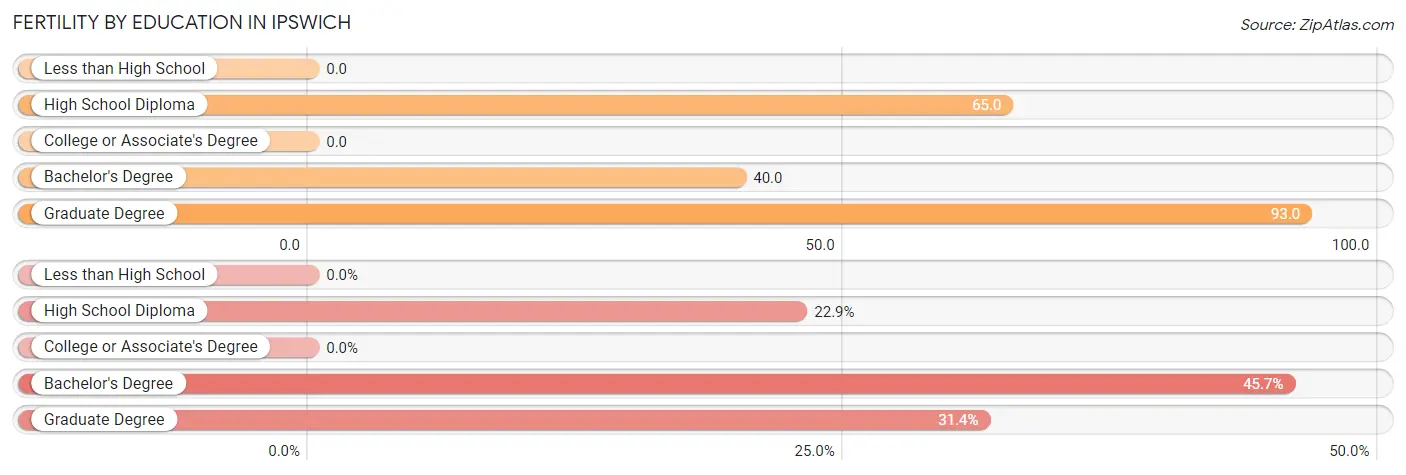
| Educational Attainment | Women with Births | Births / 1,000 Women |
| Less than High School | 0 (0.0%) | 0.0 |
| High School Diploma | 8 (22.9%) | 65.0 |
| College or Associate's Degree | 0 (0.0%) | 0.0 |
| Bachelor's Degree | 16 (45.7%) | 40.0 |
| Graduate Degree | 11 (31.4%) | 93.0 |
| Total | 35 (100.0%) | 34.0 |
Fertility by Education by Marriage Status in Ipswich
22.9% of women with births in Ipswich are unmarried. Women with the educational attainment of bachelor's degree are most likely to be married with 100.0% of them married at childbirth, while women with the educational attainment of high school diploma are least likely to be married with 100.0% of them unmarried at childbirth.
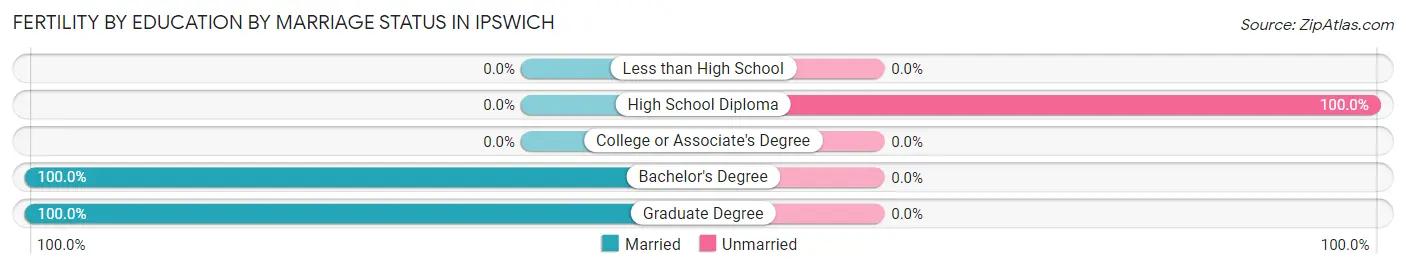
| Educational Attainment | Married | Unmarried |
| Less than High School | 0 (0.0%) | 0 (0.0%) |
| High School Diploma | 0 (0.0%) | 8 (100.0%) |
| College or Associate's Degree | 0 (0.0%) | 0 (0.0%) |
| Bachelor's Degree | 16 (100.0%) | 0 (0.0%) |
| Graduate Degree | 11 (100.0%) | 0 (0.0%) |
| Total | 27 (77.1%) | 8 (22.9%) |
Employment Characteristics in Ipswich
Employment by Class of Employer in Ipswich
Among the 2,708 employed individuals in Ipswich, private company employees (1,847 | 68.2%), not-for-profit organizations (375 | 13.9%), and self-employed (not incorporated) (130 | 4.8%) make up the most common classes of employment.
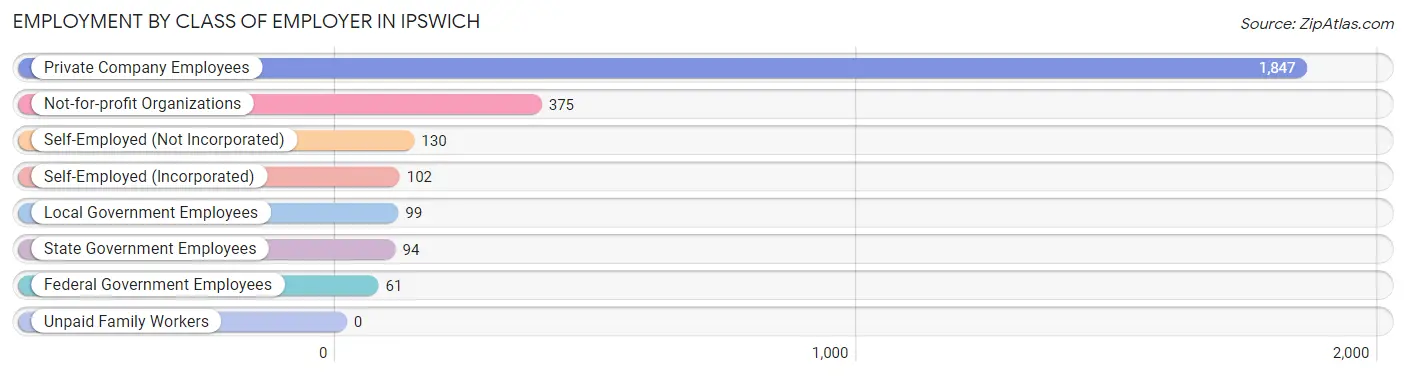
| Employer Class | # Employees | % Employees |
| Private Company Employees | 1,847 | 68.2% |
| Self-Employed (Incorporated) | 102 | 3.8% |
| Self-Employed (Not Incorporated) | 130 | 4.8% |
| Not-for-profit Organizations | 375 | 13.9% |
| Local Government Employees | 99 | 3.7% |
| State Government Employees | 94 | 3.5% |
| Federal Government Employees | 61 | 2.2% |
| Unpaid Family Workers | 0 | 0.0% |
| Total | 2,708 | 100.0% |
Employment Status by Age in Ipswich
According to the labor force statistics for Ipswich, out of the total population over 16 years of age (4,029), 72.3% or 2,913 individuals are in the labor force, with 2.8% or 82 of them unemployed. The age group with the highest labor force participation rate is 45 to 54 years, with 90.7% or 747 individuals in the labor force. Within the labor force, the 25 to 29 years age range has the highest percentage of unemployed individuals, with 11.1% or 21 of them being unemployed.
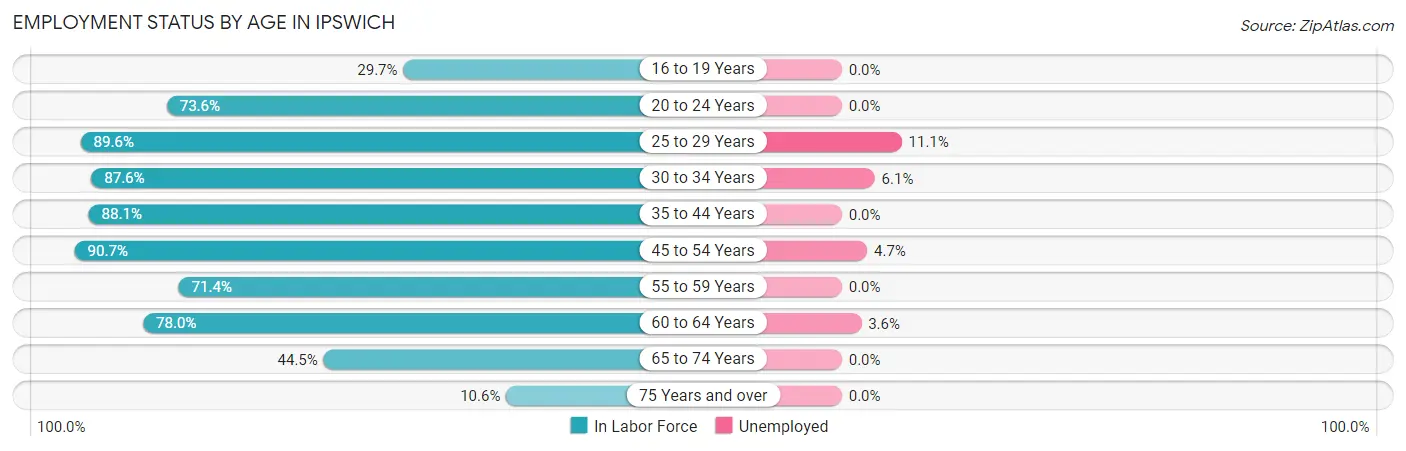
| Age Bracket | In Labor Force | Unemployed |
| 16 to 19 Years | 62 (29.7%) | 0 (0.0%) |
| 20 to 24 Years | 170 (73.6%) | 0 (0.0%) |
| 25 to 29 Years | 189 (89.6%) | 21 (11.1%) |
| 30 to 34 Years | 304 (87.6%) | 19 (6.1%) |
| 35 to 44 Years | 731 (88.1%) | 0 (0.0%) |
| 45 to 54 Years | 747 (90.7%) | 35 (4.7%) |
| 55 to 59 Years | 344 (71.4%) | 0 (0.0%) |
| 60 to 64 Years | 167 (78.0%) | 6 (3.6%) |
| 65 to 74 Years | 165 (44.5%) | 0 (0.0%) |
| 75 Years and over | 33 (10.6%) | 0 (0.0%) |
| Total | 2,913 (72.3%) | 82 (2.8%) |
Employment Status by Educational Attainment in Ipswich
According to labor force statistics for Ipswich, 85.4% of individuals (2,483) out of the total population between 25 and 64 years of age (2,908) are in the labor force, with 3.2% or 79 of them being unemployed. The group with the highest labor force participation rate are those with the educational attainment of less than high school, with 92.2% or 118 individuals in the labor force. Within the labor force, individuals with college / associate degree education have the highest percentage of unemployment, with 8.6% or 45 of them being unemployed.
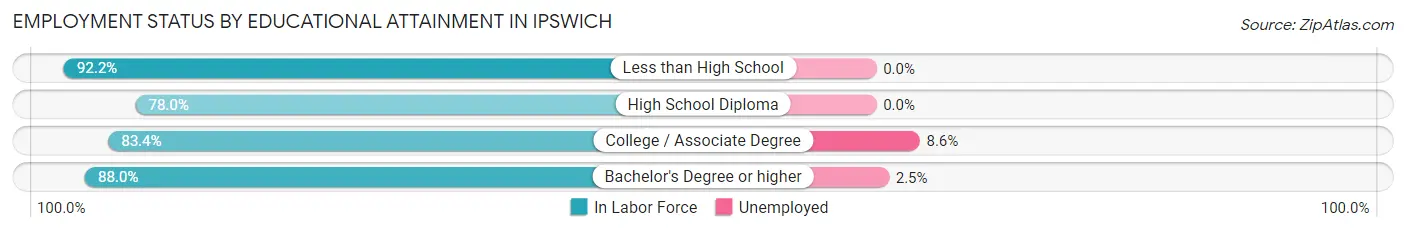
| Educational Attainment | In Labor Force | Unemployed |
| Less than High School | 118 (92.2%) | 0 (0.0%) |
| High School Diploma | 416 (78.0%) | 0 (0.0%) |
| College / Associate Degree | 526 (83.4%) | 54 (8.6%) |
| Bachelor's Degree or higher | 1,422 (88.0%) | 40 (2.5%) |
| Total | 2,483 (85.4%) | 93 (3.2%) |
Employment Occupations by Sex in Ipswich
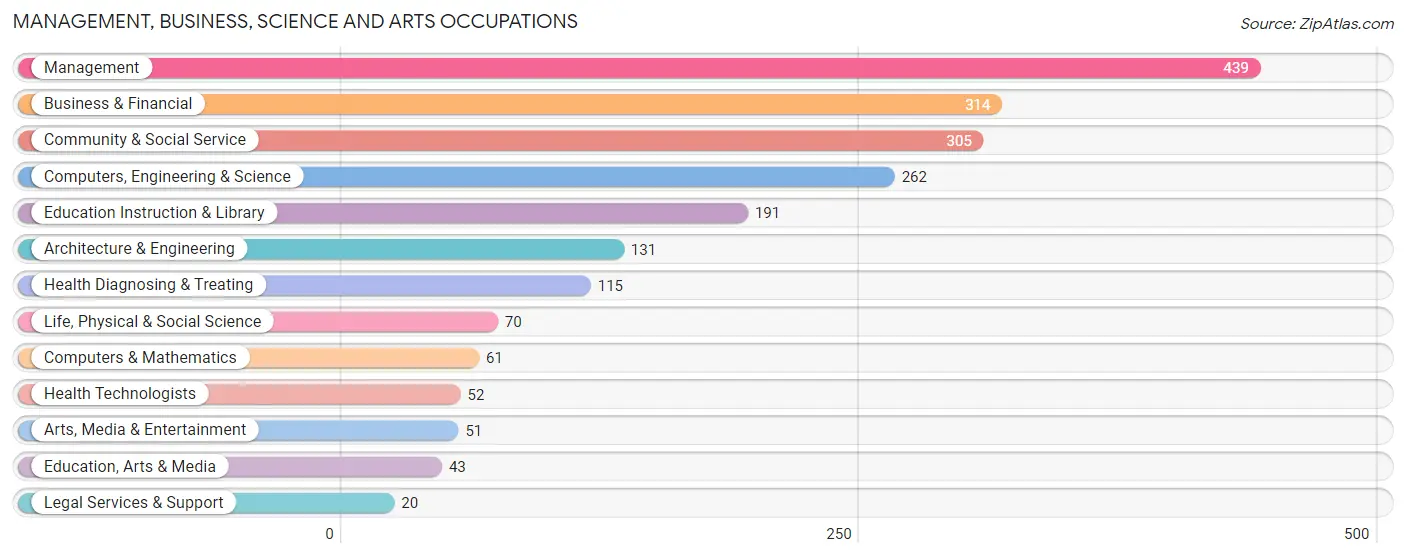
Management, Business, Science and Arts Occupations
The most common Management, Business, Science and Arts occupations in Ipswich are Management (439 | 15.6%), Business & Financial (314 | 11.1%), Community & Social Service (305 | 10.8%), Computers, Engineering & Science (262 | 9.3%), and Education Instruction & Library (191 | 6.8%).
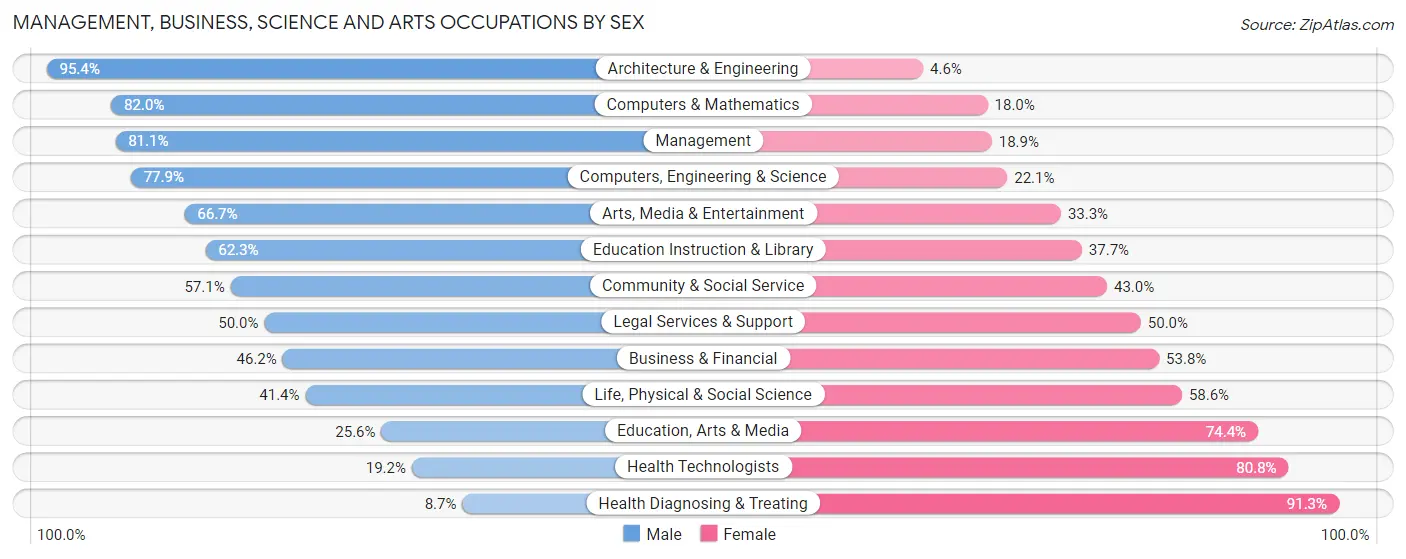
Management, Business, Science and Arts Occupations by Sex
Within the Management, Business, Science and Arts occupations in Ipswich, the most male-oriented occupations are Architecture & Engineering (95.4%), Computers & Mathematics (82.0%), and Management (81.1%), while the most female-oriented occupations are Health Diagnosing & Treating (91.3%), Health Technologists (80.8%), and Education, Arts & Media (74.4%).
| Occupation | Male | Female |
| Management | 356 (81.1%) | 83 (18.9%) |
| Business & Financial | 145 (46.2%) | 169 (53.8%) |
| Computers, Engineering & Science | 204 (77.9%) | 58 (22.1%) |
| Computers & Mathematics | 50 (82.0%) | 11 (18.0%) |
| Architecture & Engineering | 125 (95.4%) | 6 (4.6%) |
| Life, Physical & Social Science | 29 (41.4%) | 41 (58.6%) |
| Community & Social Service | 174 (57.1%) | 131 (42.9%) |
| Education, Arts & Media | 11 (25.6%) | 32 (74.4%) |
| Legal Services & Support | 10 (50.0%) | 10 (50.0%) |
| Education Instruction & Library | 119 (62.3%) | 72 (37.7%) |
| Arts, Media & Entertainment | 34 (66.7%) | 17 (33.3%) |
| Health Diagnosing & Treating | 10 (8.7%) | 105 (91.3%) |
| Health Technologists | 10 (19.2%) | 42 (80.8%) |
| Total (Category) | 889 (62.0%) | 546 (38.1%) |
| Total (Overall) | 1,616 (57.3%) | 1,205 (42.7%) |
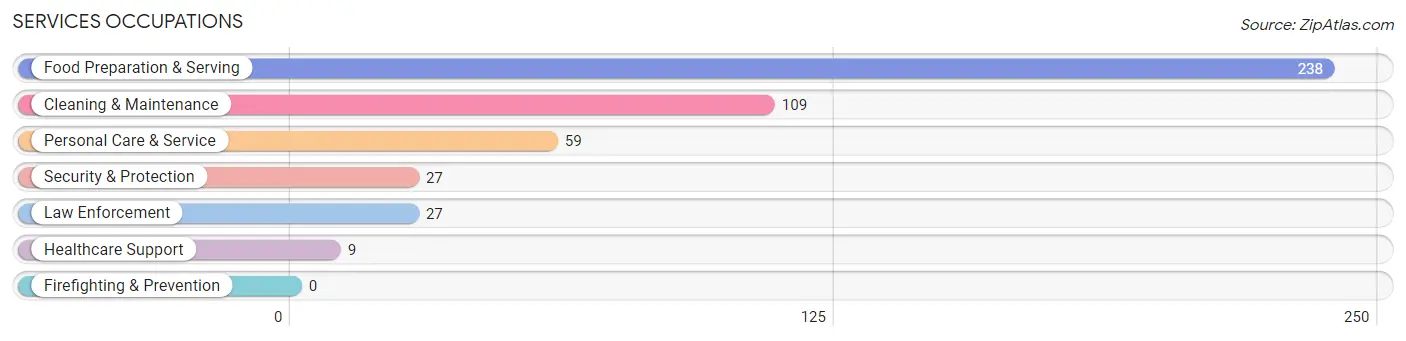
Services Occupations
The most common Services occupations in Ipswich are Food Preparation & Serving (238 | 8.4%), Cleaning & Maintenance (109 | 3.9%), Personal Care & Service (59 | 2.1%), Security & Protection (27 | 1.0%), and Law Enforcement (27 | 1.0%).
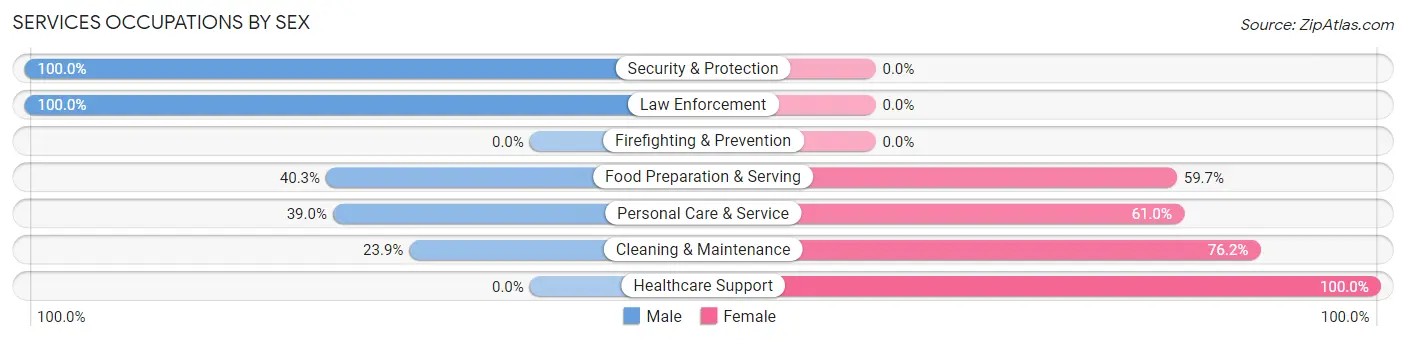
Services Occupations by Sex
Within the Services occupations in Ipswich, the most male-oriented occupations are Security & Protection (100.0%), Law Enforcement (100.0%), and Food Preparation & Serving (40.3%), while the most female-oriented occupations are Healthcare Support (100.0%), Cleaning & Maintenance (76.1%), and Personal Care & Service (61.0%).
| Occupation | Male | Female |
| Healthcare Support | 0 (0.0%) | 9 (100.0%) |
| Security & Protection | 27 (100.0%) | 0 (0.0%) |
| Firefighting & Prevention | 0 (0.0%) | 0 (0.0%) |
| Law Enforcement | 27 (100.0%) | 0 (0.0%) |
| Food Preparation & Serving | 96 (40.3%) | 142 (59.7%) |
| Cleaning & Maintenance | 26 (23.8%) | 83 (76.1%) |
| Personal Care & Service | 23 (39.0%) | 36 (61.0%) |
| Total (Category) | 172 (38.9%) | 270 (61.1%) |
| Total (Overall) | 1,616 (57.3%) | 1,205 (42.7%) |
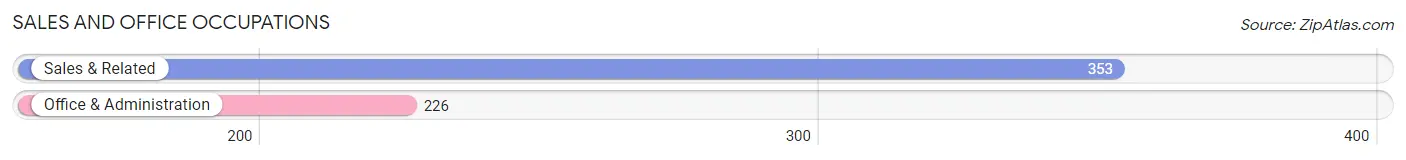
Sales and Office Occupations
The most common Sales and Office occupations in Ipswich are Sales & Related (353 | 12.5%), and Office & Administration (226 | 8.0%).
Sales and Office Occupations by Sex
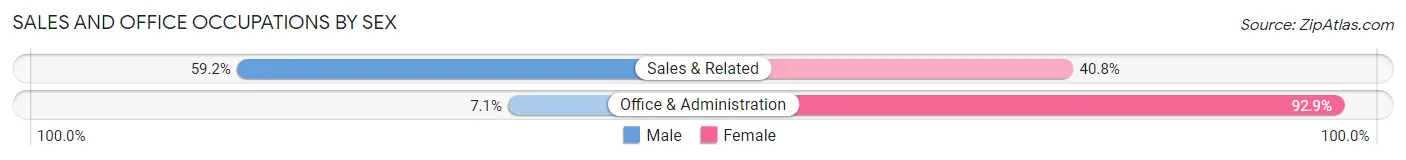
| Occupation | Male | Female |
| Sales & Related | 209 (59.2%) | 144 (40.8%) |
| Office & Administration | 16 (7.1%) | 210 (92.9%) |
| Total (Category) | 225 (38.9%) | 354 (61.1%) |
| Total (Overall) | 1,616 (57.3%) | 1,205 (42.7%) |
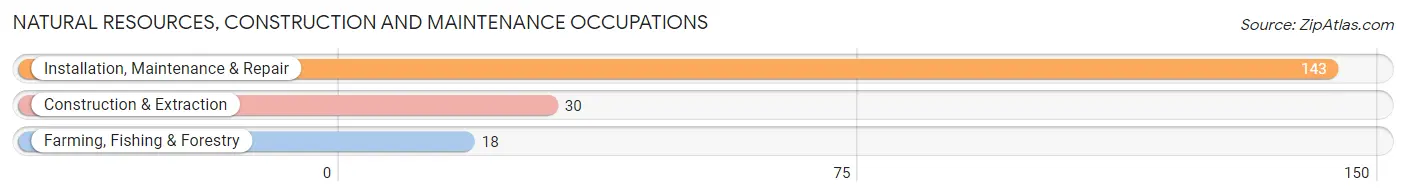
Natural Resources, Construction and Maintenance Occupations
The most common Natural Resources, Construction and Maintenance occupations in Ipswich are Installation, Maintenance & Repair (143 | 5.1%), Construction & Extraction (30 | 1.1%), and Farming, Fishing & Forestry (18 | 0.6%).
Natural Resources, Construction and Maintenance Occupations by Sex
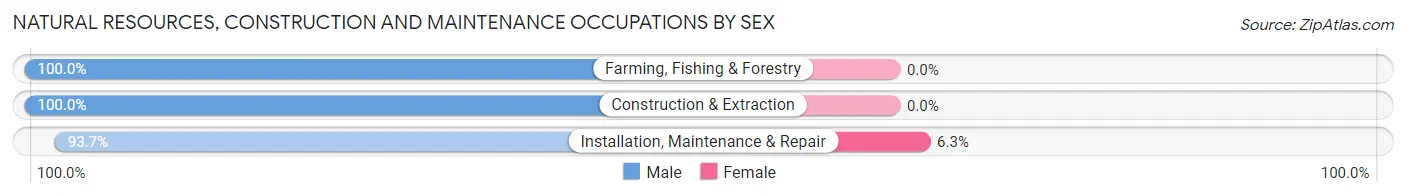
| Occupation | Male | Female |
| Farming, Fishing & Forestry | 18 (100.0%) | 0 (0.0%) |
| Construction & Extraction | 30 (100.0%) | 0 (0.0%) |
| Installation, Maintenance & Repair | 134 (93.7%) | 9 (6.3%) |
| Total (Category) | 182 (95.3%) | 9 (4.7%) |
| Total (Overall) | 1,616 (57.3%) | 1,205 (42.7%) |
Production, Transportation and Moving Occupations
The most common Production, Transportation and Moving occupations in Ipswich are Transportation (85 | 3.0%), Production (58 | 2.1%), and Material Moving (31 | 1.1%).
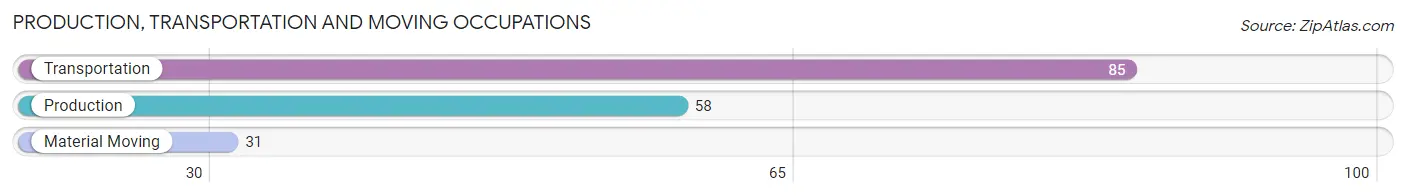
Production, Transportation and Moving Occupations by Sex
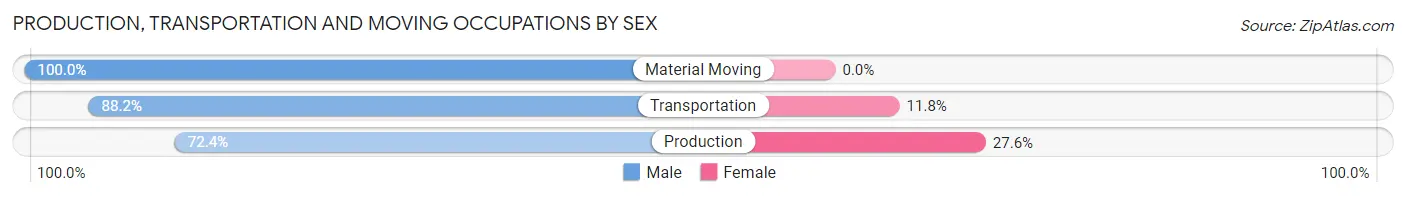
| Occupation | Male | Female |
| Production | 42 (72.4%) | 16 (27.6%) |
| Transportation | 75 (88.2%) | 10 (11.8%) |
| Material Moving | 31 (100.0%) | 0 (0.0%) |
| Total (Category) | 148 (85.1%) | 26 (14.9%) |
| Total (Overall) | 1,616 (57.3%) | 1,205 (42.7%) |
Employment Industries by Sex in Ipswich
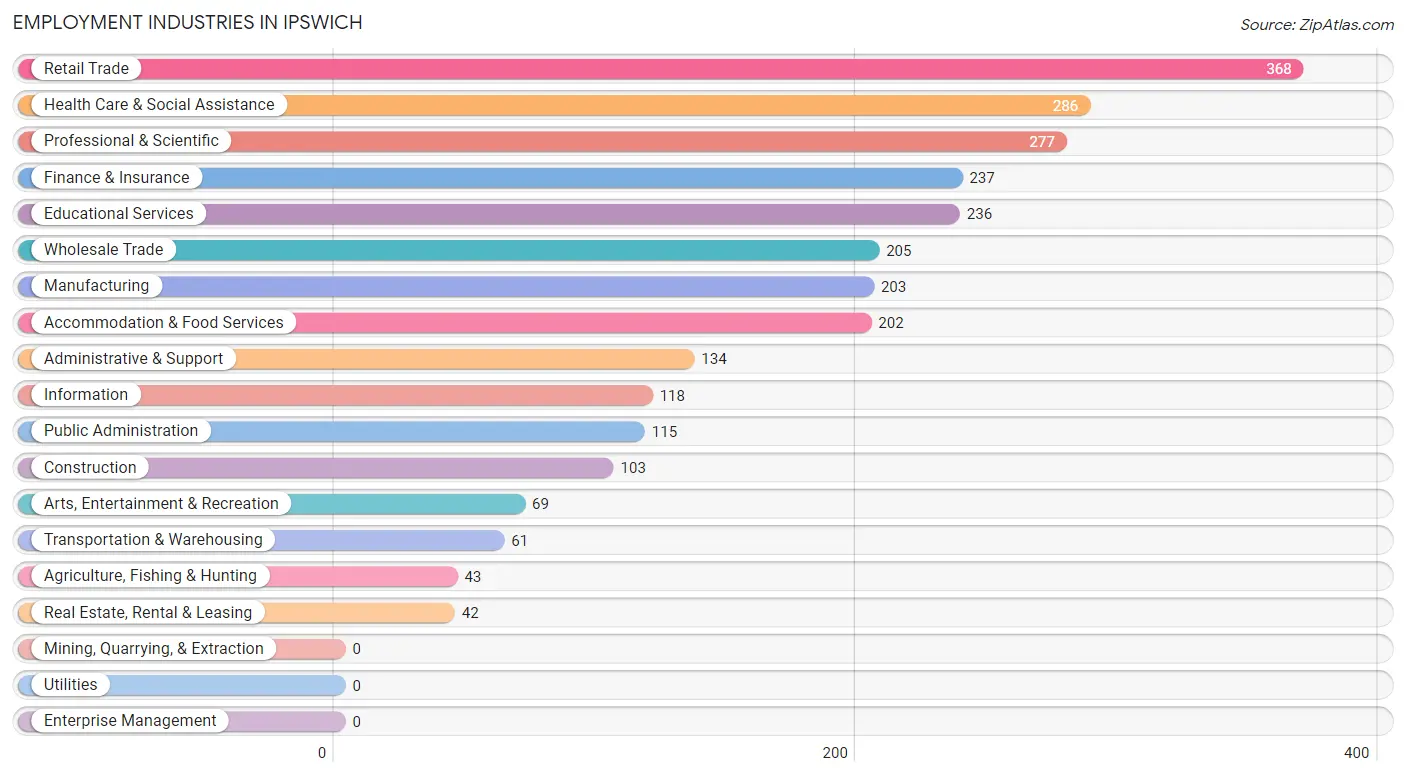
Employment Industries in Ipswich
The major employment industries in Ipswich include Retail Trade (368 | 13.1%), Health Care & Social Assistance (286 | 10.1%), Professional & Scientific (277 | 9.8%), Finance & Insurance (237 | 8.4%), and Educational Services (236 | 8.4%).
Employment Industries by Sex in Ipswich
The Ipswich industries that see more men than women are Agriculture, Fishing & Hunting (100.0%), Arts, Entertainment & Recreation (100.0%), and Information (92.4%), whereas the industries that tend to have a higher number of women are Accommodation & Food Services (74.3%), Finance & Insurance (62.5%), and Educational Services (60.2%).
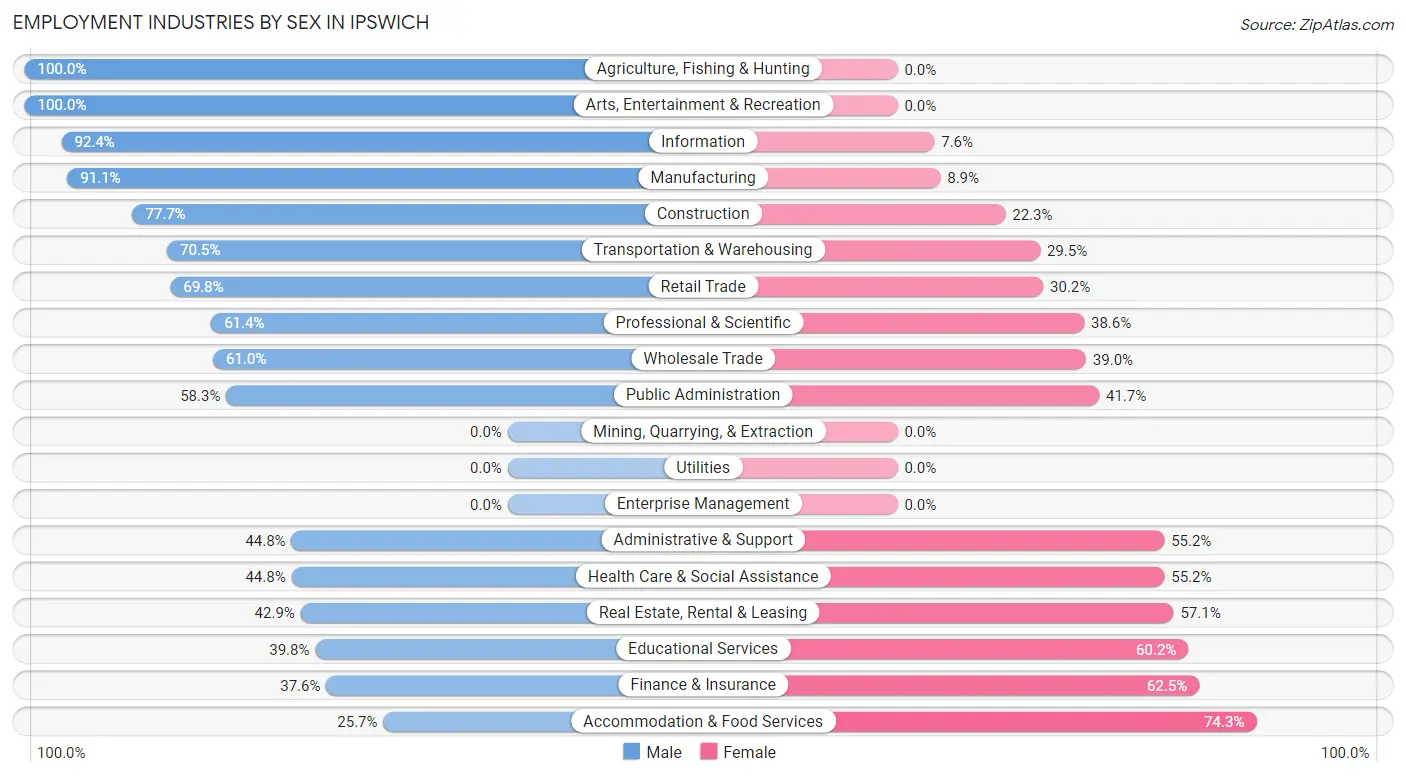
| Industry | Male | Female |
| Agriculture, Fishing & Hunting | 43 (100.0%) | 0 (0.0%) |
| Mining, Quarrying, & Extraction | 0 (0.0%) | 0 (0.0%) |
| Construction | 80 (77.7%) | 23 (22.3%) |
| Manufacturing | 185 (91.1%) | 18 (8.9%) |
| Wholesale Trade | 125 (61.0%) | 80 (39.0%) |
| Retail Trade | 257 (69.8%) | 111 (30.2%) |
| Transportation & Warehousing | 43 (70.5%) | 18 (29.5%) |
| Utilities | 0 (0.0%) | 0 (0.0%) |
| Information | 109 (92.4%) | 9 (7.6%) |
| Finance & Insurance | 89 (37.6%) | 148 (62.5%) |
| Real Estate, Rental & Leasing | 18 (42.9%) | 24 (57.1%) |
| Professional & Scientific | 170 (61.4%) | 107 (38.6%) |
| Enterprise Management | 0 (0.0%) | 0 (0.0%) |
| Administrative & Support | 60 (44.8%) | 74 (55.2%) |
| Educational Services | 94 (39.8%) | 142 (60.2%) |
| Health Care & Social Assistance | 128 (44.8%) | 158 (55.2%) |
| Arts, Entertainment & Recreation | 69 (100.0%) | 0 (0.0%) |
| Accommodation & Food Services | 52 (25.7%) | 150 (74.3%) |
| Public Administration | 67 (58.3%) | 48 (41.7%) |
| Total | 1,616 (57.3%) | 1,205 (42.7%) |
Education in Ipswich
School Enrollment in Ipswich
The most common levels of schooling among the 1,044 students in Ipswich are middle school (253 | 24.2%), elementary school (236 | 22.6%), and high school (203 | 19.4%).
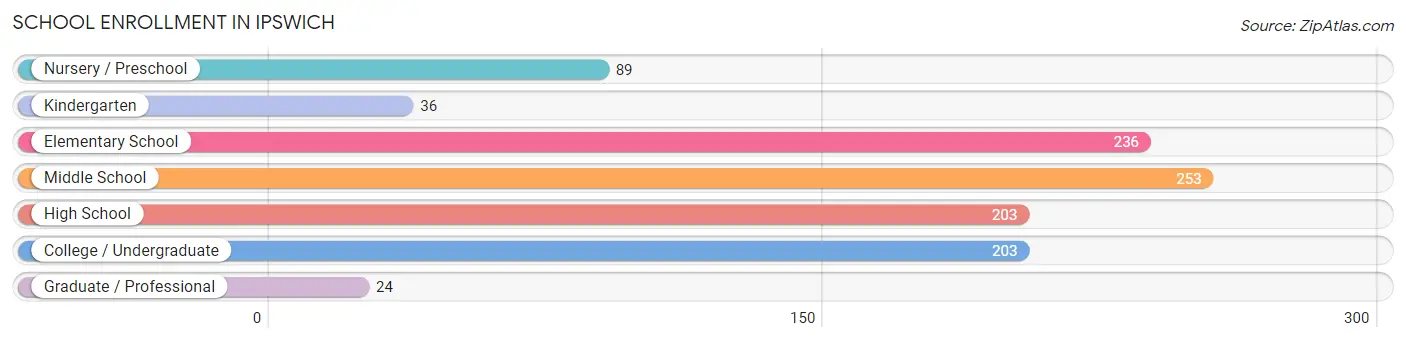
| School Level | # Students | % Students |
| Nursery / Preschool | 89 | 8.5% |
| Kindergarten | 36 | 3.5% |
| Elementary School | 236 | 22.6% |
| Middle School | 253 | 24.2% |
| High School | 203 | 19.4% |
| College / Undergraduate | 203 | 19.4% |
| Graduate / Professional | 24 | 2.3% |
| Total | 1,044 | 100.0% |
School Enrollment by Age by Funding Source in Ipswich
Out of a total of 1,044 students who are enrolled in schools in Ipswich, 255 (24.4%) attend a private institution, while the remaining 789 (75.6%) are enrolled in public schools. The age group of 35 years and over has the highest likelihood of being enrolled in private schools, with 24 (100.0% in the age bracket) enrolled. Conversely, the age group of 15 to 17 year olds has the lowest likelihood of being enrolled in a private school, with 173 (100.0% in the age bracket) attending a public institution.
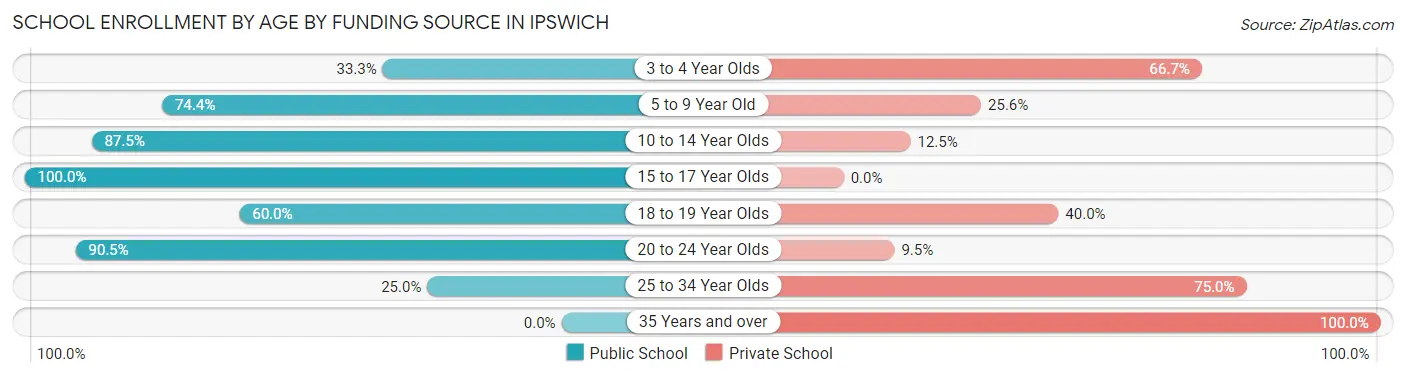
| Age Bracket | Public School | Private School |
| 3 to 4 Year Olds | 27 (33.3%) | 54 (66.7%) |
| 5 to 9 Year Old | 186 (74.4%) | 64 (25.6%) |
| 10 to 14 Year Olds | 274 (87.5%) | 39 (12.5%) |
| 15 to 17 Year Olds | 173 (100.0%) | 0 (0.0%) |
| 18 to 19 Year Olds | 51 (60.0%) | 34 (40.0%) |
| 20 to 24 Year Olds | 67 (90.5%) | 7 (9.5%) |
| 25 to 34 Year Olds | 11 (25.0%) | 33 (75.0%) |
| 35 Years and over | 0 (0.0%) | 24 (100.0%) |
| Total | 789 (75.6%) | 255 (24.4%) |
Educational Attainment by Field of Study in Ipswich
Business (406 | 20.8%), social sciences (203 | 10.4%), literature & languages (199 | 10.2%), psychology (177 | 9.1%), and liberal arts & history (170 | 8.7%) are the most common fields of study among 1,947 individuals in Ipswich who have obtained a bachelor's degree or higher.
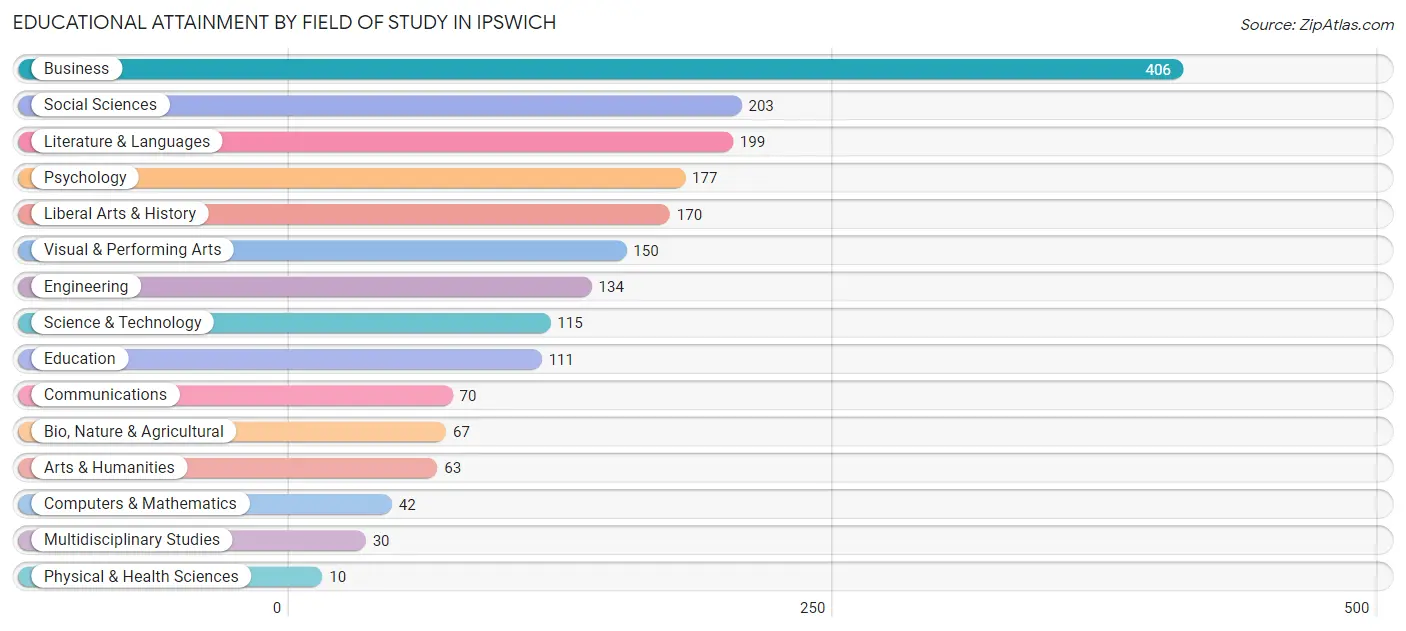
| Field of Study | # Graduates | % Graduates |
| Computers & Mathematics | 42 | 2.2% |
| Bio, Nature & Agricultural | 67 | 3.4% |
| Physical & Health Sciences | 10 | 0.5% |
| Psychology | 177 | 9.1% |
| Social Sciences | 203 | 10.4% |
| Engineering | 134 | 6.9% |
| Multidisciplinary Studies | 30 | 1.5% |
| Science & Technology | 115 | 5.9% |
| Business | 406 | 20.8% |
| Education | 111 | 5.7% |
| Literature & Languages | 199 | 10.2% |
| Liberal Arts & History | 170 | 8.7% |
| Visual & Performing Arts | 150 | 7.7% |
| Communications | 70 | 3.6% |
| Arts & Humanities | 63 | 3.2% |
| Total | 1,947 | 100.0% |
Transportation & Commute in Ipswich
Vehicle Availability by Sex in Ipswich
The most prevalent vehicle ownership categories in Ipswich are males with 2 vehicles (721, accounting for 46.3%) and females with 2 vehicles (568, making up 62.8%).
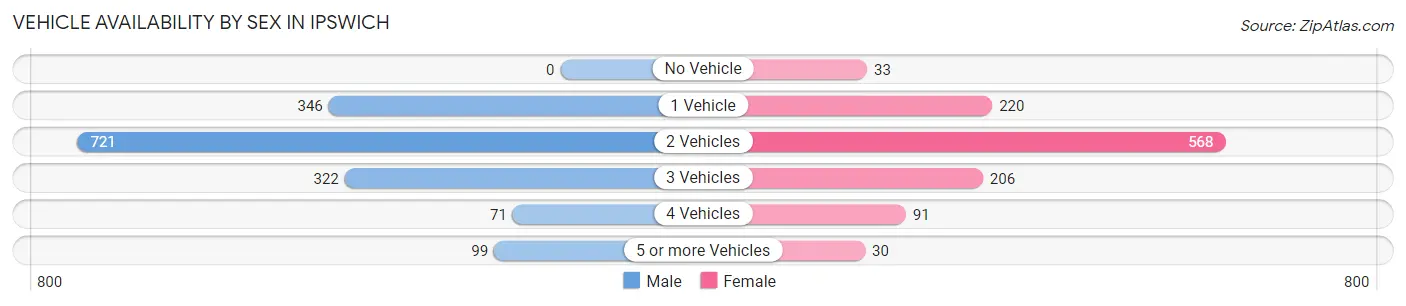
| Vehicles Available | Male | Female |
| No Vehicle | 0 (0.0%) | 33 (2.9%) |
| 1 Vehicle | 346 (22.2%) | 220 (19.2%) |
| 2 Vehicles | 721 (46.3%) | 568 (49.5%) |
| 3 Vehicles | 322 (20.6%) | 206 (17.9%) |
| 4 Vehicles | 71 (4.5%) | 91 (7.9%) |
| 5 or more Vehicles | 99 (6.4%) | 30 (2.6%) |
| Total | 1,559 (100.0%) | 1,148 (100.0%) |
Commute Time in Ipswich
The most frequently occuring commute durations in Ipswich are 5 to 9 minutes (470 commuters, 20.1%), 20 to 24 minutes (384 commuters, 16.4%), and 60 to 89 minutes (191 commuters, 8.2%).
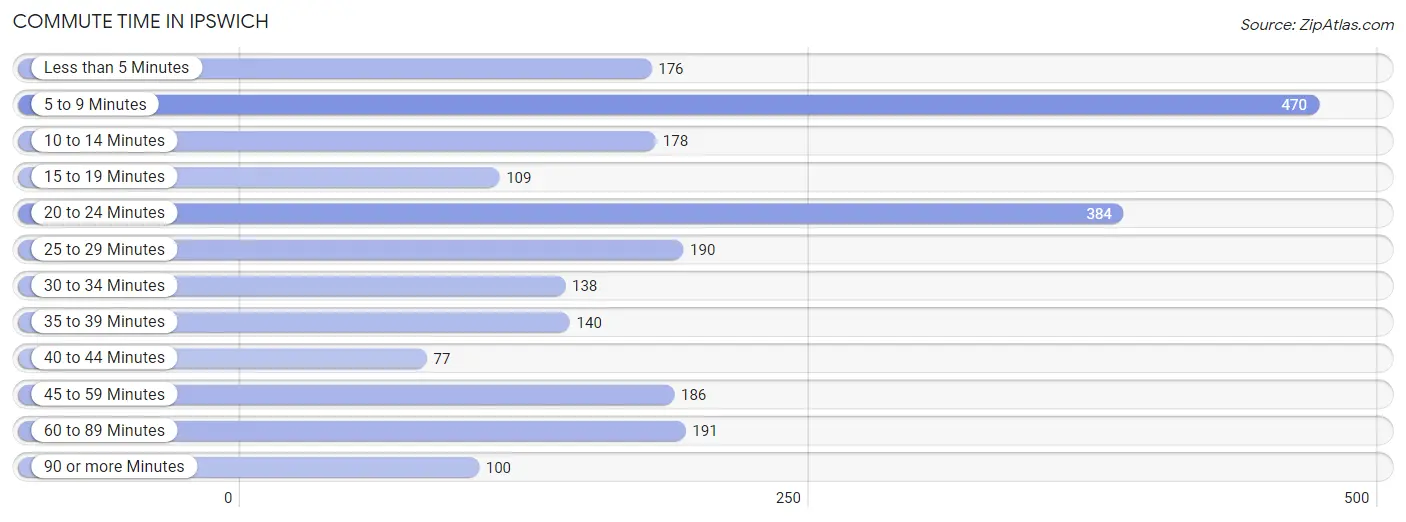
| Commute Time | # Commuters | % Commuters |
| Less than 5 Minutes | 176 | 7.5% |
| 5 to 9 Minutes | 470 | 20.1% |
| 10 to 14 Minutes | 178 | 7.6% |
| 15 to 19 Minutes | 109 | 4.7% |
| 20 to 24 Minutes | 384 | 16.4% |
| 25 to 29 Minutes | 190 | 8.1% |
| 30 to 34 Minutes | 138 | 5.9% |
| 35 to 39 Minutes | 140 | 6.0% |
| 40 to 44 Minutes | 77 | 3.3% |
| 45 to 59 Minutes | 186 | 8.0% |
| 60 to 89 Minutes | 191 | 8.2% |
| 90 or more Minutes | 100 | 4.3% |
Commute Time by Sex in Ipswich
The most common commute times in Ipswich are 5 to 9 minutes (233 commuters, 17.7%) for males and 5 to 9 minutes (237 commuters, 23.2%) for females.
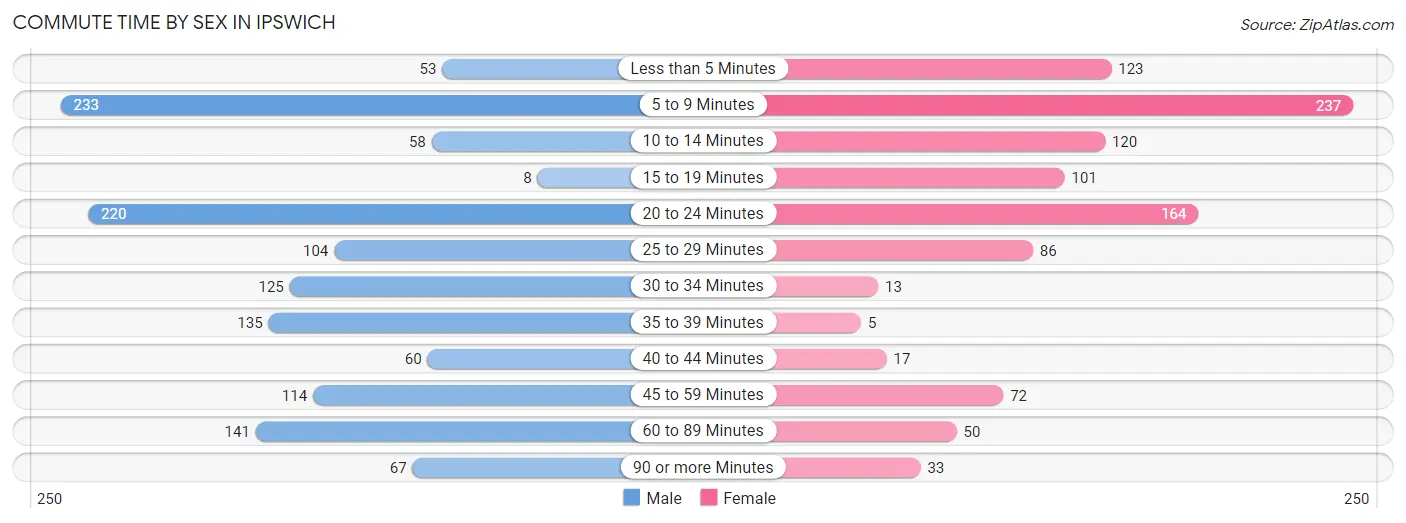
| Commute Time | Male | Female |
| Less than 5 Minutes | 53 (4.0%) | 123 (12.0%) |
| 5 to 9 Minutes | 233 (17.7%) | 237 (23.2%) |
| 10 to 14 Minutes | 58 (4.4%) | 120 (11.7%) |
| 15 to 19 Minutes | 8 (0.6%) | 101 (9.9%) |
| 20 to 24 Minutes | 220 (16.7%) | 164 (16.1%) |
| 25 to 29 Minutes | 104 (7.9%) | 86 (8.4%) |
| 30 to 34 Minutes | 125 (9.5%) | 13 (1.3%) |
| 35 to 39 Minutes | 135 (10.2%) | 5 (0.5%) |
| 40 to 44 Minutes | 60 (4.5%) | 17 (1.7%) |
| 45 to 59 Minutes | 114 (8.6%) | 72 (7.0%) |
| 60 to 89 Minutes | 141 (10.7%) | 50 (4.9%) |
| 90 or more Minutes | 67 (5.1%) | 33 (3.2%) |
Time of Departure to Work by Sex in Ipswich
The most frequent times of departure to work in Ipswich are 7:00 AM to 7:29 AM (311, 23.6%) for males and 7:30 AM to 7:59 AM (156, 15.3%) for females.
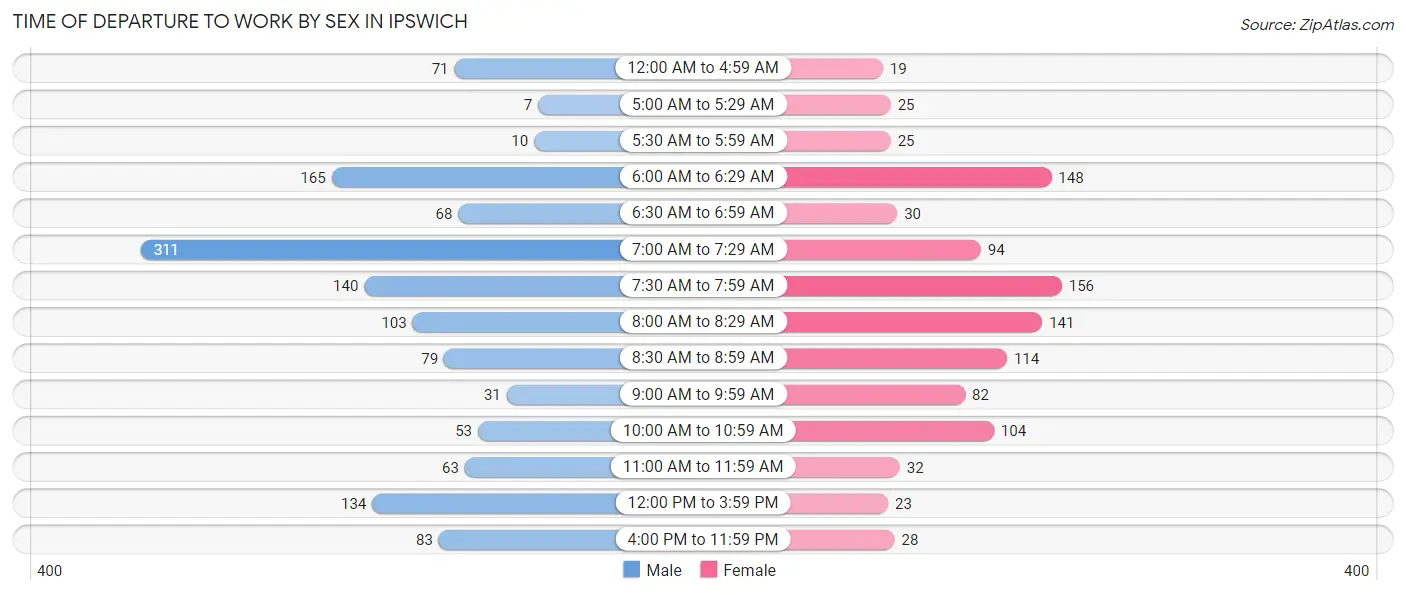
| Time of Departure | Male | Female |
| 12:00 AM to 4:59 AM | 71 (5.4%) | 19 (1.9%) |
| 5:00 AM to 5:29 AM | 7 (0.5%) | 25 (2.5%) |
| 5:30 AM to 5:59 AM | 10 (0.8%) | 25 (2.5%) |
| 6:00 AM to 6:29 AM | 165 (12.5%) | 148 (14.5%) |
| 6:30 AM to 6:59 AM | 68 (5.2%) | 30 (2.9%) |
| 7:00 AM to 7:29 AM | 311 (23.6%) | 94 (9.2%) |
| 7:30 AM to 7:59 AM | 140 (10.6%) | 156 (15.3%) |
| 8:00 AM to 8:29 AM | 103 (7.8%) | 141 (13.8%) |
| 8:30 AM to 8:59 AM | 79 (6.0%) | 114 (11.2%) |
| 9:00 AM to 9:59 AM | 31 (2.4%) | 82 (8.0%) |
| 10:00 AM to 10:59 AM | 53 (4.0%) | 104 (10.2%) |
| 11:00 AM to 11:59 AM | 63 (4.8%) | 32 (3.1%) |
| 12:00 PM to 3:59 PM | 134 (10.2%) | 23 (2.2%) |
| 4:00 PM to 11:59 PM | 83 (6.3%) | 28 (2.7%) |
| Total | 1,318 (100.0%) | 1,021 (100.0%) |
Housing Occupancy in Ipswich
Occupancy by Ownership in Ipswich
Of the total 2,105 dwellings in Ipswich, owner-occupied units account for 1,181 (56.1%), while renter-occupied units make up 924 (43.9%).
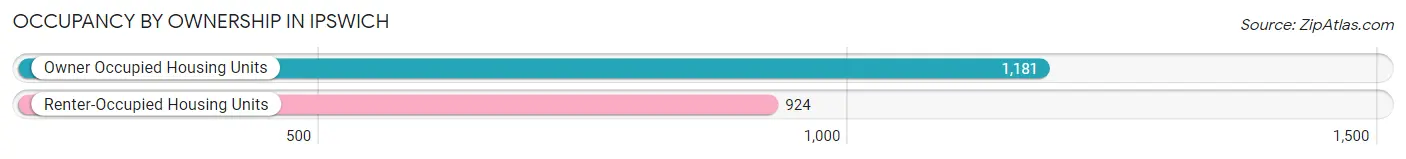
| Occupancy | # Housing Units | % Housing Units |
| Owner Occupied Housing Units | 1,181 | 56.1% |
| Renter-Occupied Housing Units | 924 | 43.9% |
| Total Occupied Housing Units | 2,105 | 100.0% |
Occupancy by Household Size in Ipswich
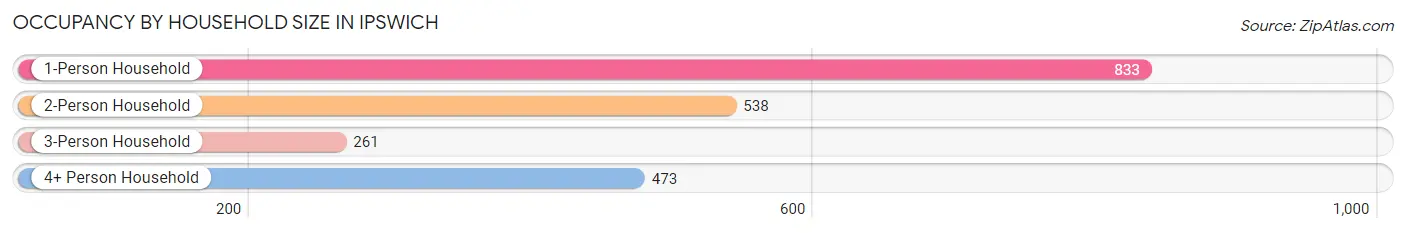
| Household Size | # Housing Units | % Housing Units |
| 1-Person Household | 833 | 39.6% |
| 2-Person Household | 538 | 25.6% |
| 3-Person Household | 261 | 12.4% |
| 4+ Person Household | 473 | 22.5% |
| Total Housing Units | 2,105 | 100.0% |
Occupancy by Ownership by Household Size in Ipswich
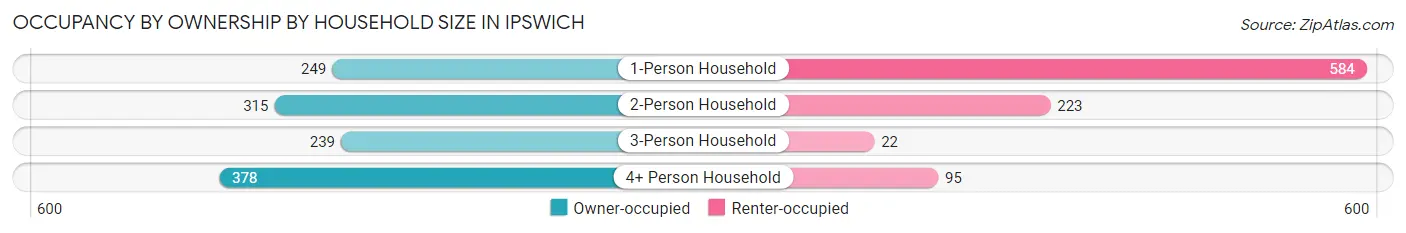
| Household Size | Owner-occupied | Renter-occupied |
| 1-Person Household | 249 (29.9%) | 584 (70.1%) |
| 2-Person Household | 315 (58.6%) | 223 (41.4%) |
| 3-Person Household | 239 (91.6%) | 22 (8.4%) |
| 4+ Person Household | 378 (79.9%) | 95 (20.1%) |
| Total Housing Units | 1,181 (56.1%) | 924 (43.9%) |
Occupancy by Educational Attainment in Ipswich
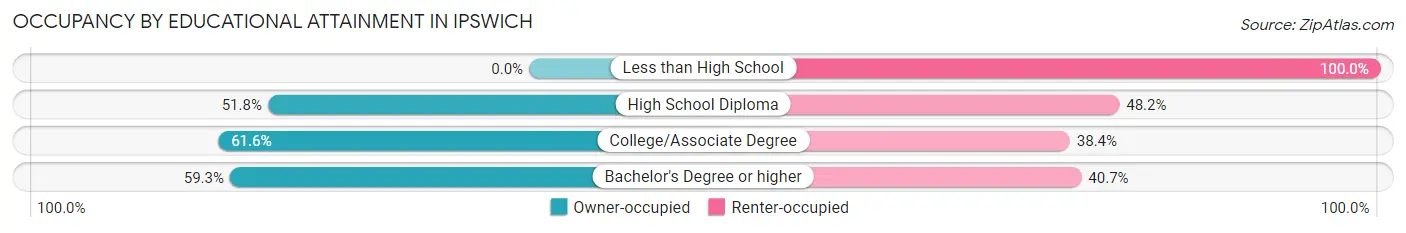
| Household Size | Owner-occupied | Renter-occupied |
| Less than High School | 0 (0.0%) | 83 (100.0%) |
| High School Diploma | 187 (51.8%) | 174 (48.2%) |
| College/Associate Degree | 239 (61.6%) | 149 (38.4%) |
| Bachelor's Degree or higher | 755 (59.3%) | 518 (40.7%) |
Occupancy by Age of Householder in Ipswich
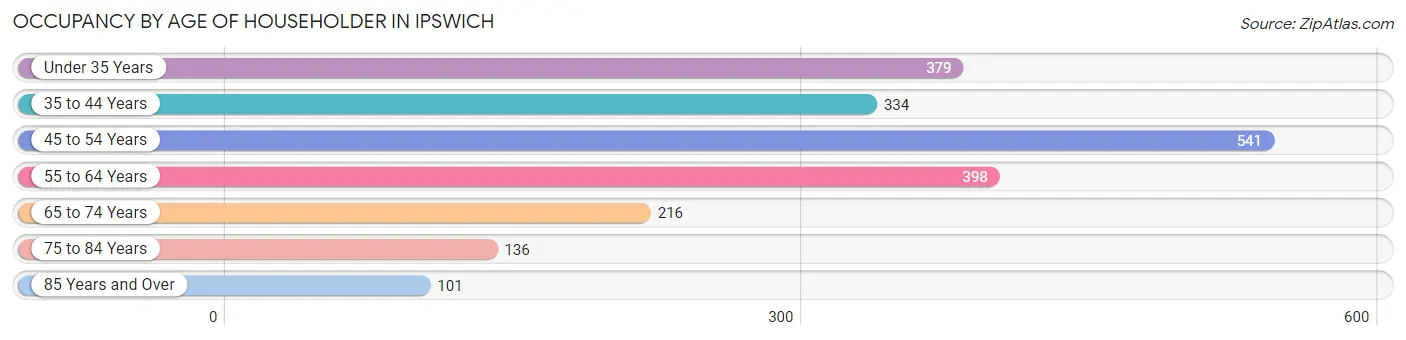
| Age Bracket | # Households | % Households |
| Under 35 Years | 379 | 18.0% |
| 35 to 44 Years | 334 | 15.9% |
| 45 to 54 Years | 541 | 25.7% |
| 55 to 64 Years | 398 | 18.9% |
| 65 to 74 Years | 216 | 10.3% |
| 75 to 84 Years | 136 | 6.5% |
| 85 Years and Over | 101 | 4.8% |
| Total | 2,105 | 100.0% |
Housing Finances in Ipswich
Median Income by Occupancy in Ipswich
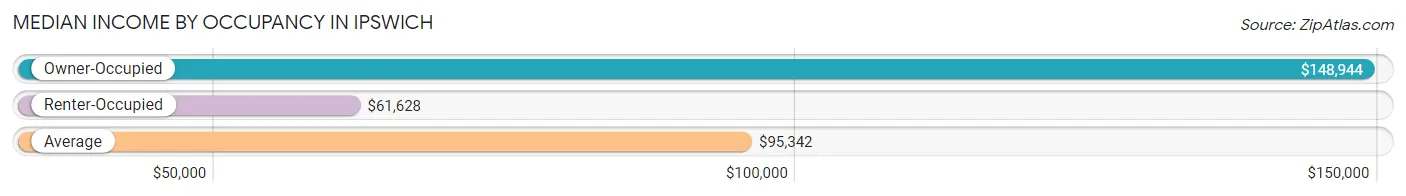
| Occupancy Type | # Households | Median Income |
| Owner-Occupied | 1,181 (56.1%) | $148,944 |
| Renter-Occupied | 924 (43.9%) | $61,628 |
| Average | 2,105 (100.0%) | $95,342 |
Occupancy by Householder Income Bracket in Ipswich
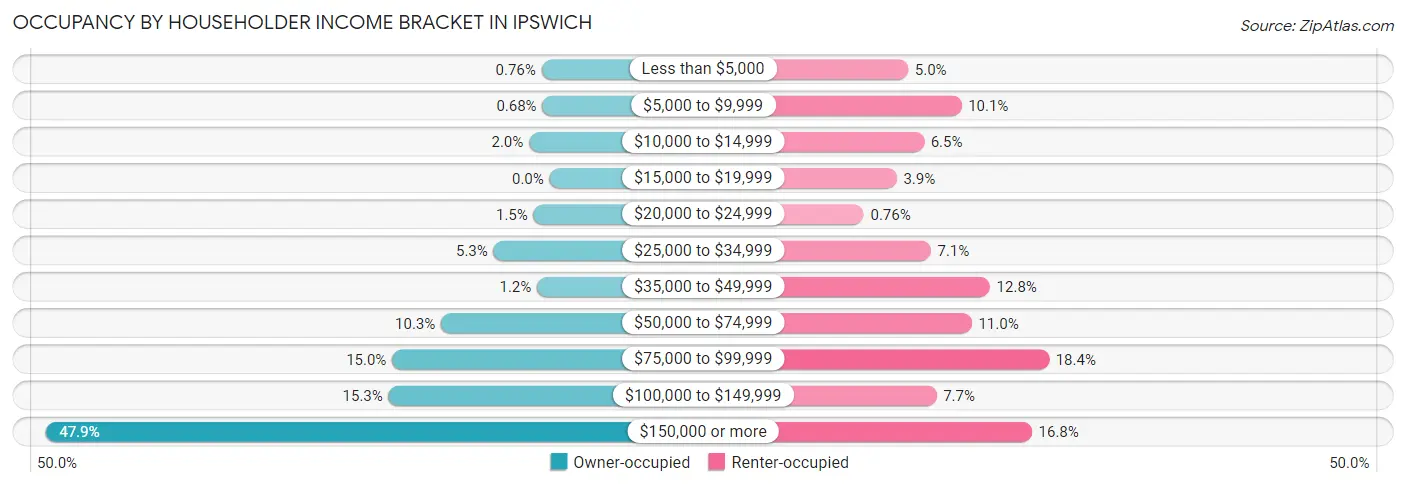
| Income Bracket | Owner-occupied | Renter-occupied |
| Less than $5,000 | 9 (0.8%) | 46 (5.0%) |
| $5,000 to $9,999 | 8 (0.7%) | 93 (10.1%) |
| $10,000 to $14,999 | 23 (1.9%) | 60 (6.5%) |
| $15,000 to $19,999 | 0 (0.0%) | 36 (3.9%) |
| $20,000 to $24,999 | 18 (1.5%) | 7 (0.8%) |
| $25,000 to $34,999 | 63 (5.3%) | 66 (7.1%) |
| $35,000 to $49,999 | 14 (1.2%) | 118 (12.8%) |
| $50,000 to $74,999 | 122 (10.3%) | 102 (11.0%) |
| $75,000 to $99,999 | 177 (15.0%) | 170 (18.4%) |
| $100,000 to $149,999 | 181 (15.3%) | 71 (7.7%) |
| $150,000 or more | 566 (47.9%) | 155 (16.8%) |
| Total | 1,181 (100.0%) | 924 (100.0%) |
Monthly Housing Cost Tiers in Ipswich
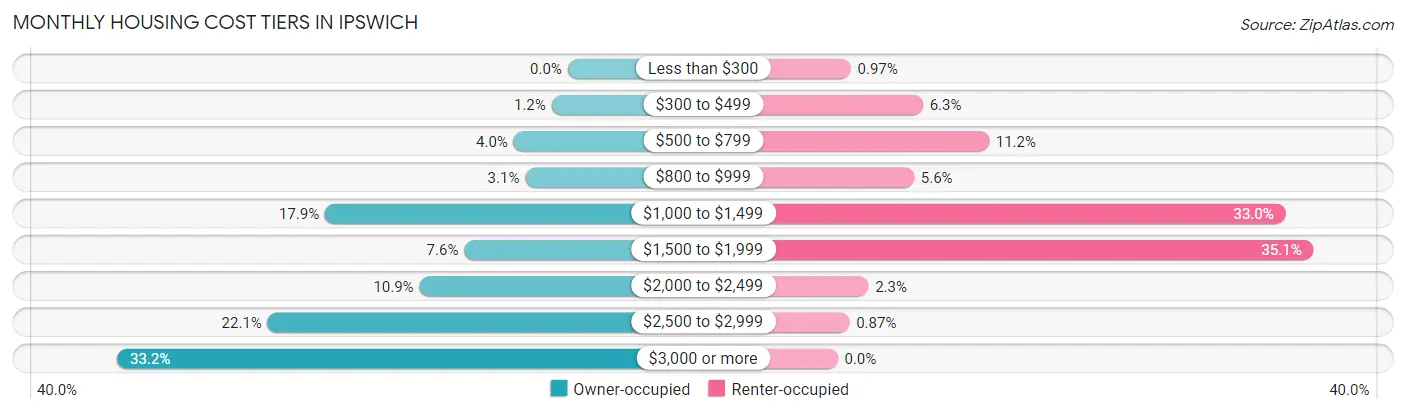
| Monthly Cost | Owner-occupied | Renter-occupied |
| Less than $300 | 0 (0.0%) | 9 (1.0%) |
| $300 to $499 | 14 (1.2%) | 58 (6.3%) |
| $500 to $799 | 47 (4.0%) | 103 (11.2%) |
| $800 to $999 | 37 (3.1%) | 52 (5.6%) |
| $1,000 to $1,499 | 211 (17.9%) | 305 (33.0%) |
| $1,500 to $1,999 | 90 (7.6%) | 324 (35.1%) |
| $2,000 to $2,499 | 129 (10.9%) | 21 (2.3%) |
| $2,500 to $2,999 | 261 (22.1%) | 8 (0.9%) |
| $3,000 or more | 392 (33.2%) | 0 (0.0%) |
| Total | 1,181 (100.0%) | 924 (100.0%) |
Physical Housing Characteristics in Ipswich
Housing Structures in Ipswich
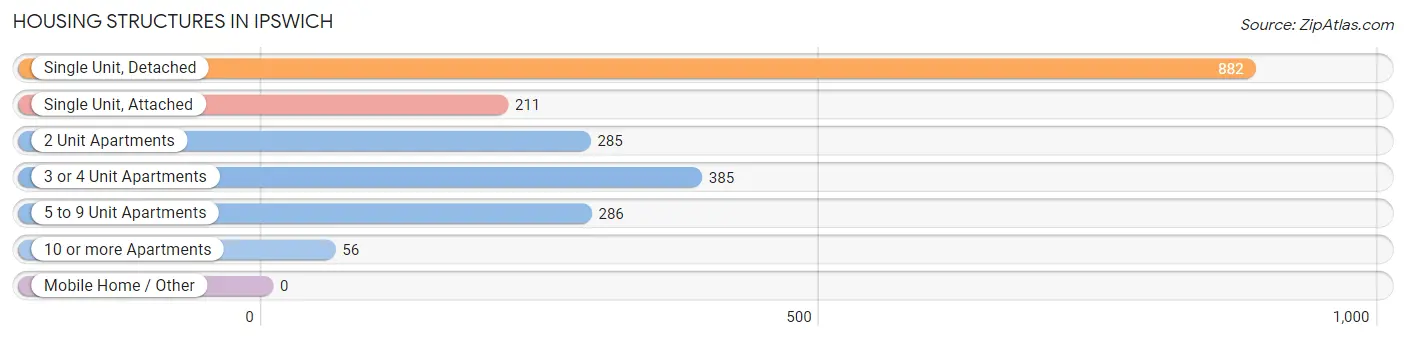
| Structure Type | # Housing Units | % Housing Units |
| Single Unit, Detached | 882 | 41.9% |
| Single Unit, Attached | 211 | 10.0% |
| 2 Unit Apartments | 285 | 13.5% |
| 3 or 4 Unit Apartments | 385 | 18.3% |
| 5 to 9 Unit Apartments | 286 | 13.6% |
| 10 or more Apartments | 56 | 2.7% |
| Mobile Home / Other | 0 | 0.0% |
| Total | 2,105 | 100.0% |
Housing Structures by Occupancy in Ipswich
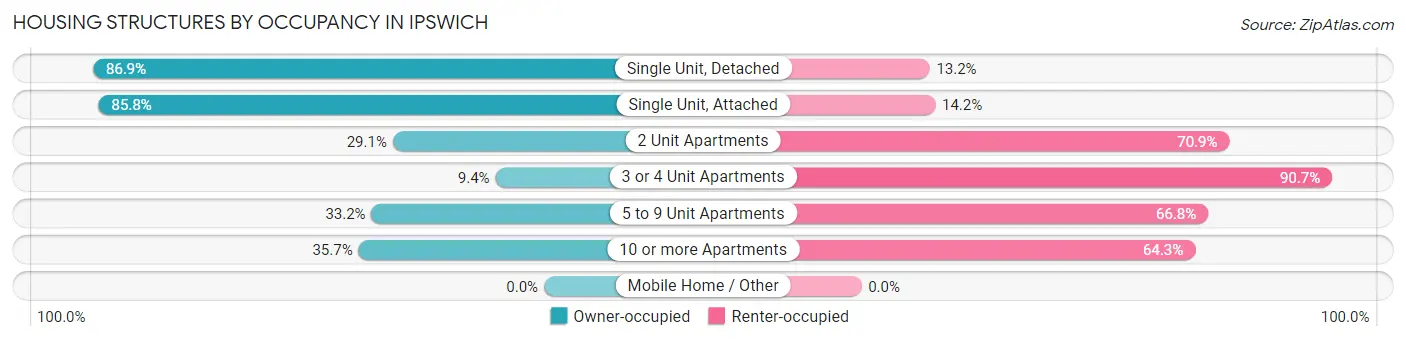
| Structure Type | Owner-occupied | Renter-occupied |
| Single Unit, Detached | 766 (86.9%) | 116 (13.2%) |
| Single Unit, Attached | 181 (85.8%) | 30 (14.2%) |
| 2 Unit Apartments | 83 (29.1%) | 202 (70.9%) |
| 3 or 4 Unit Apartments | 36 (9.3%) | 349 (90.6%) |
| 5 to 9 Unit Apartments | 95 (33.2%) | 191 (66.8%) |
| 10 or more Apartments | 20 (35.7%) | 36 (64.3%) |
| Mobile Home / Other | 0 (0.0%) | 0 (0.0%) |
| Total | 1,181 (56.1%) | 924 (43.9%) |
Housing Structures by Number of Rooms in Ipswich
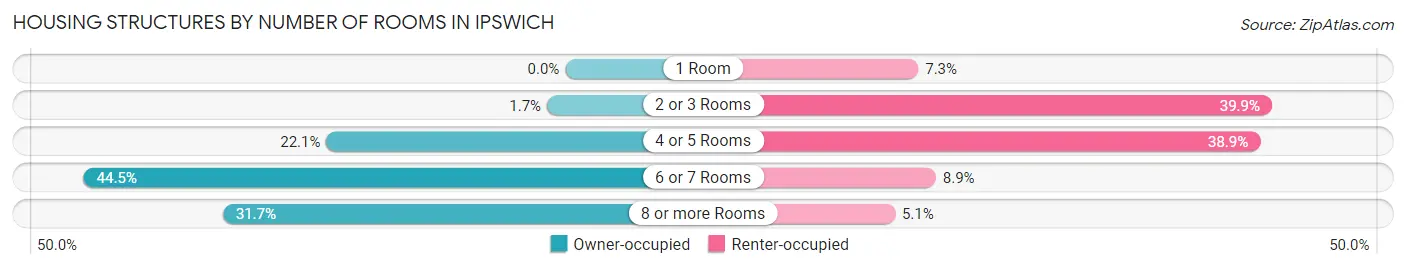
| Number of Rooms | Owner-occupied | Renter-occupied |
| 1 Room | 0 (0.0%) | 67 (7.2%) |
| 2 or 3 Rooms | 20 (1.7%) | 369 (39.9%) |
| 4 or 5 Rooms | 261 (22.1%) | 359 (38.9%) |
| 6 or 7 Rooms | 526 (44.5%) | 82 (8.9%) |
| 8 or more Rooms | 374 (31.7%) | 47 (5.1%) |
| Total | 1,181 (100.0%) | 924 (100.0%) |
Housing Structure by Heating Type in Ipswich
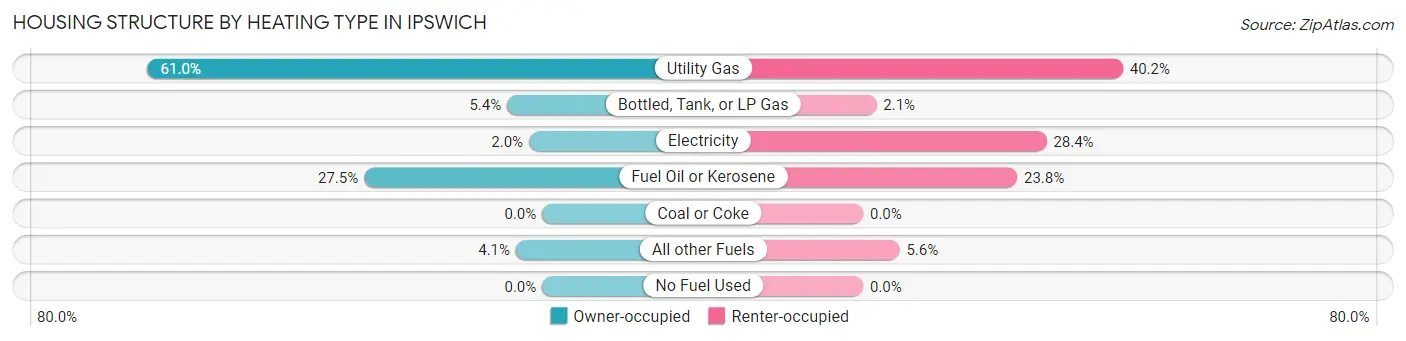
| Heating Type | Owner-occupied | Renter-occupied |
| Utility Gas | 720 (61.0%) | 371 (40.2%) |
| Bottled, Tank, or LP Gas | 64 (5.4%) | 19 (2.1%) |
| Electricity | 24 (2.0%) | 262 (28.3%) |
| Fuel Oil or Kerosene | 325 (27.5%) | 220 (23.8%) |
| Coal or Coke | 0 (0.0%) | 0 (0.0%) |
| All other Fuels | 48 (4.1%) | 52 (5.6%) |
| No Fuel Used | 0 (0.0%) | 0 (0.0%) |
| Total | 1,181 (100.0%) | 924 (100.0%) |
Household Vehicle Usage in Ipswich
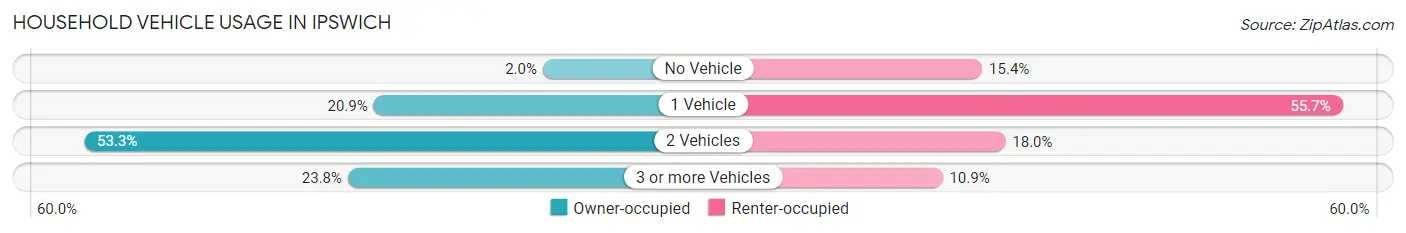
| Vehicles per Household | Owner-occupied | Renter-occupied |
| No Vehicle | 23 (1.9%) | 142 (15.4%) |
| 1 Vehicle | 247 (20.9%) | 515 (55.7%) |
| 2 Vehicles | 630 (53.3%) | 166 (18.0%) |
| 3 or more Vehicles | 281 (23.8%) | 101 (10.9%) |
| Total | 1,181 (100.0%) | 924 (100.0%) |
Real Estate & Mortgages in Ipswich
Real Estate and Mortgage Overview in Ipswich
| Characteristic | Without Mortgage | With Mortgage |
| Housing Units | 275 | 906 |
| Median Property Value | $489,600 | $575,100 |
| Median Household Income | $101,250 | $438 |
| Monthly Housing Costs | $1,160 | $392 |
| Real Estate Taxes | $6,616 | $32 |
Property Value by Mortgage Status in Ipswich
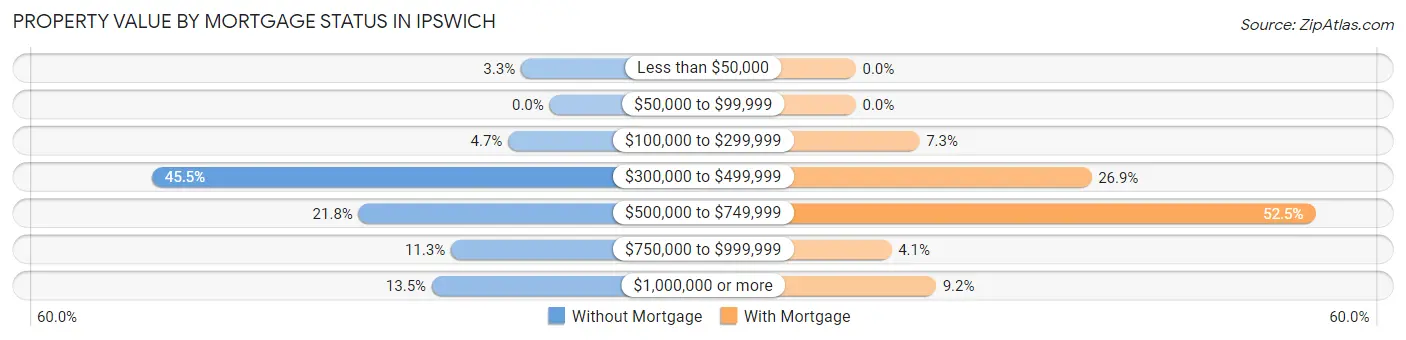
| Property Value | Without Mortgage | With Mortgage |
| Less than $50,000 | 9 (3.3%) | 0 (0.0%) |
| $50,000 to $99,999 | 0 (0.0%) | 0 (0.0%) |
| $100,000 to $299,999 | 13 (4.7%) | 66 (7.3%) |
| $300,000 to $499,999 | 125 (45.5%) | 244 (26.9%) |
| $500,000 to $749,999 | 60 (21.8%) | 476 (52.5%) |
| $750,000 to $999,999 | 31 (11.3%) | 37 (4.1%) |
| $1,000,000 or more | 37 (13.5%) | 83 (9.2%) |
| Total | 275 (100.0%) | 906 (100.0%) |
Household Income by Mortgage Status in Ipswich
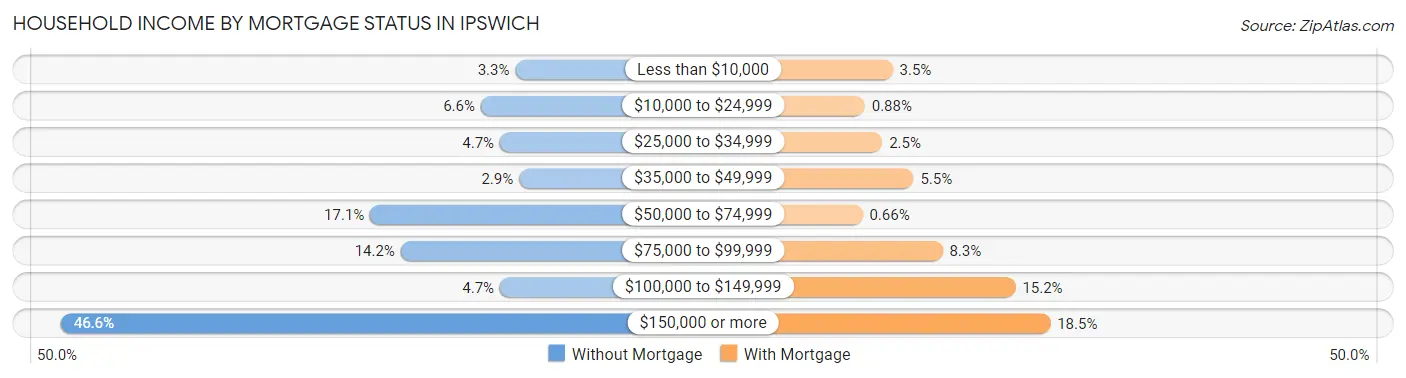
| Household Income | Without Mortgage | With Mortgage |
| Less than $10,000 | 9 (3.3%) | 32 (3.5%) |
| $10,000 to $24,999 | 18 (6.6%) | 8 (0.9%) |
| $25,000 to $34,999 | 13 (4.7%) | 23 (2.5%) |
| $35,000 to $49,999 | 8 (2.9%) | 50 (5.5%) |
| $50,000 to $74,999 | 47 (17.1%) | 6 (0.7%) |
| $75,000 to $99,999 | 39 (14.2%) | 75 (8.3%) |
| $100,000 to $149,999 | 13 (4.7%) | 138 (15.2%) |
| $150,000 or more | 128 (46.6%) | 168 (18.5%) |
| Total | 275 (100.0%) | 906 (100.0%) |
Property Value to Household Income Ratio in Ipswich
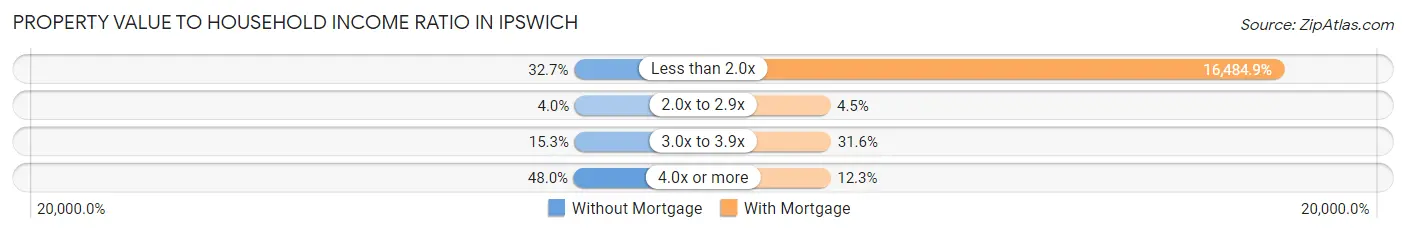
| Value-to-Income Ratio | Without Mortgage | With Mortgage |
| Less than 2.0x | 90 (32.7%) | 149,353 (16,484.9%) |
| 2.0x to 2.9x | 11 (4.0%) | 41 (4.5%) |
| 3.0x to 3.9x | 42 (15.3%) | 286 (31.6%) |
| 4.0x or more | 132 (48.0%) | 111 (12.2%) |
| Total | 275 (100.0%) | 906 (100.0%) |
Real Estate Taxes by Mortgage Status in Ipswich
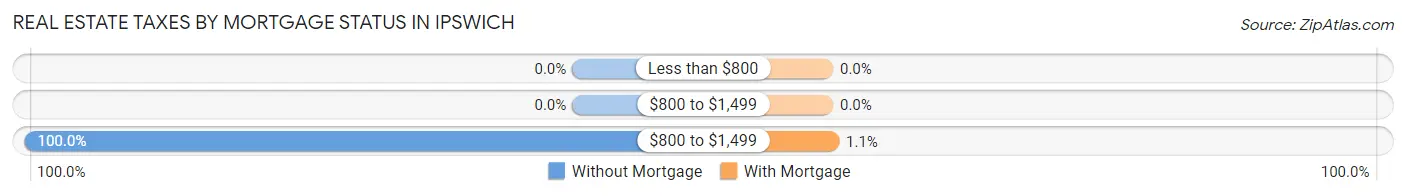
| Property Taxes | Without Mortgage | With Mortgage |
| Less than $800 | 0 (0.0%) | 0 (0.0%) |
| $800 to $1,499 | 0 (0.0%) | 0 (0.0%) |
| $800 to $1,499 | 275 (100.0%) | 10 (1.1%) |
| Total | 275 (100.0%) | 906 (100.0%) |
Health & Disability in Ipswich
Health Insurance Coverage by Age in Ipswich
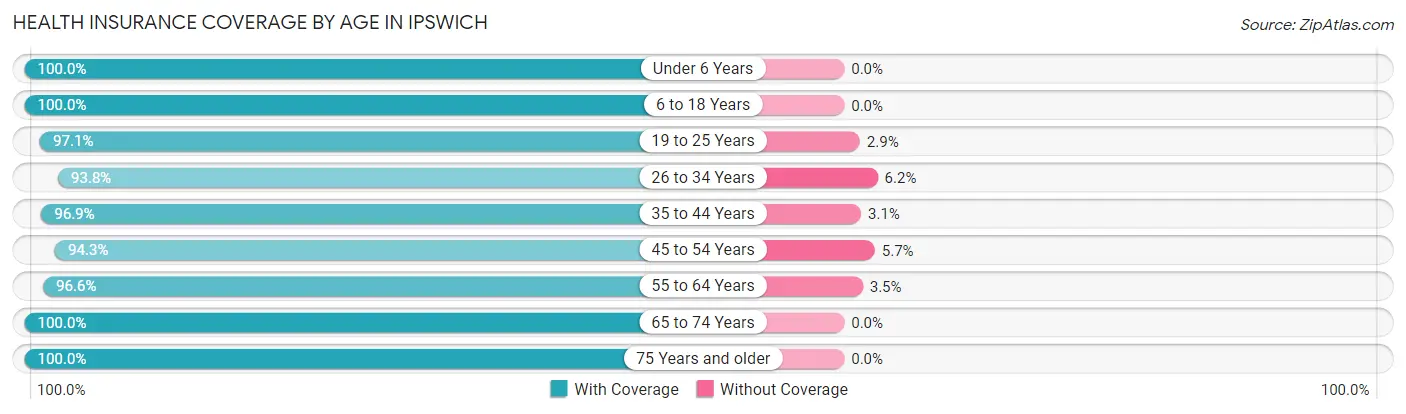
| Age Bracket | With Coverage | Without Coverage |
| Under 6 Years | 226 (100.0%) | 0 (0.0%) |
| 6 to 18 Years | 728 (100.0%) | 0 (0.0%) |
| 19 to 25 Years | 367 (97.1%) | 11 (2.9%) |
| 26 to 34 Years | 467 (93.8%) | 31 (6.2%) |
| 35 to 44 Years | 804 (96.9%) | 26 (3.1%) |
| 45 to 54 Years | 777 (94.3%) | 47 (5.7%) |
| 55 to 64 Years | 672 (96.6%) | 24 (3.5%) |
| 65 to 74 Years | 371 (100.0%) | 0 (0.0%) |
| 75 Years and older | 310 (100.0%) | 0 (0.0%) |
| Total | 4,722 (97.1%) | 139 (2.9%) |
Health Insurance Coverage by Citizenship Status in Ipswich
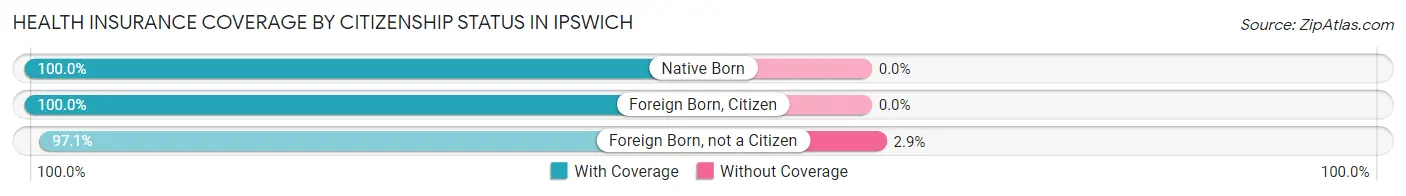
| Citizenship Status | With Coverage | Without Coverage |
| Native Born | 226 (100.0%) | 0 (0.0%) |
| Foreign Born, Citizen | 728 (100.0%) | 0 (0.0%) |
| Foreign Born, not a Citizen | 367 (97.1%) | 11 (2.9%) |
Health Insurance Coverage by Household Income in Ipswich
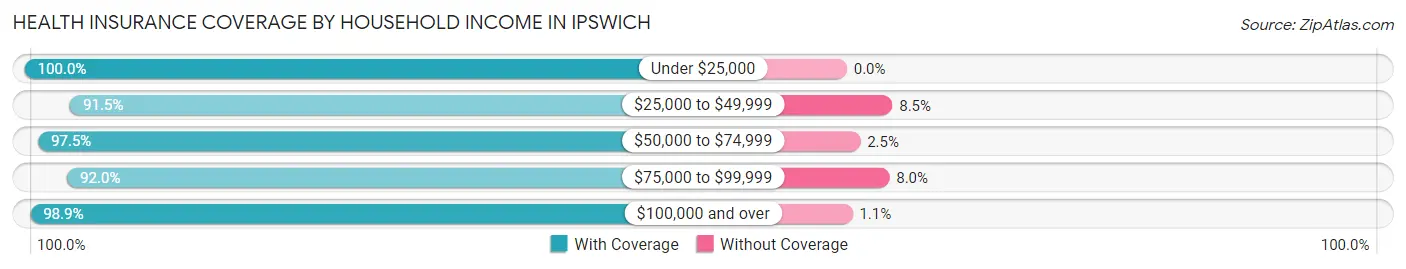
| Household Income | With Coverage | Without Coverage |
| Under $25,000 | 318 (100.0%) | 0 (0.0%) |
| $25,000 to $49,999 | 408 (91.5%) | 38 (8.5%) |
| $50,000 to $74,999 | 428 (97.5%) | 11 (2.5%) |
| $75,000 to $99,999 | 682 (92.0%) | 59 (8.0%) |
| $100,000 and over | 2,882 (98.9%) | 31 (1.1%) |
Public vs Private Health Insurance Coverage by Age in Ipswich
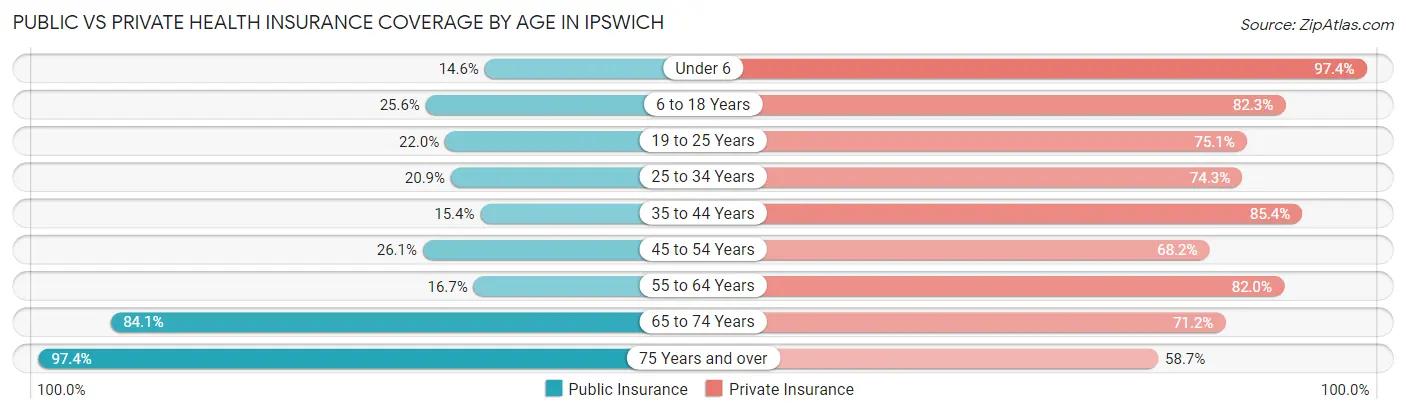
| Age Bracket | Public Insurance | Private Insurance |
| Under 6 | 33 (14.6%) | 220 (97.4%) |
| 6 to 18 Years | 186 (25.6%) | 599 (82.3%) |
| 19 to 25 Years | 83 (22.0%) | 284 (75.1%) |
| 25 to 34 Years | 104 (20.9%) | 370 (74.3%) |
| 35 to 44 Years | 128 (15.4%) | 709 (85.4%) |
| 45 to 54 Years | 215 (26.1%) | 562 (68.2%) |
| 55 to 64 Years | 116 (16.7%) | 571 (82.0%) |
| 65 to 74 Years | 312 (84.1%) | 264 (71.2%) |
| 75 Years and over | 302 (97.4%) | 182 (58.7%) |
| Total | 1,479 (30.4%) | 3,761 (77.4%) |
Disability Status by Sex by Age in Ipswich
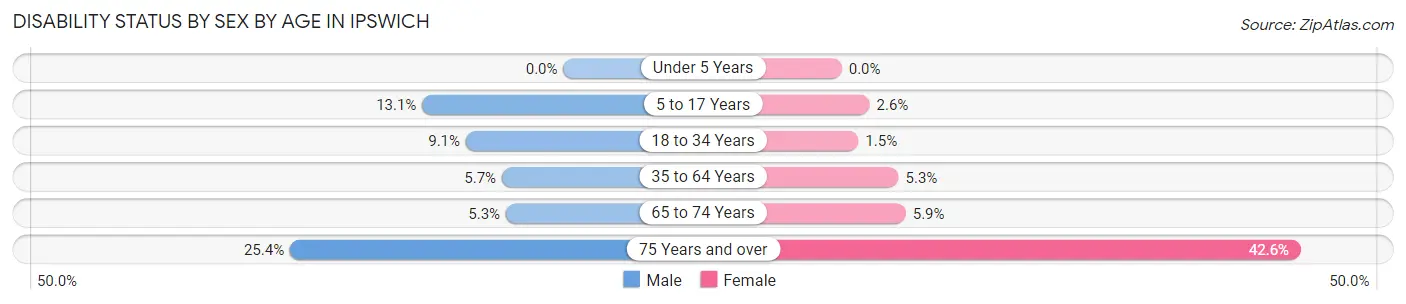
| Age Bracket | Male | Female |
| Under 5 Years | 0 (0.0%) | 0 (0.0%) |
| 5 to 17 Years | 33 (13.1%) | 13 (2.6%) |
| 18 to 34 Years | 44 (9.0%) | 6 (1.5%) |
| 35 to 64 Years | 68 (5.7%) | 61 (5.3%) |
| 65 to 74 Years | 9 (5.3%) | 12 (5.9%) |
| 75 Years and over | 34 (25.4%) | 75 (42.6%) |
Disability Class by Sex by Age in Ipswich
Disability Class: Hearing Difficulty
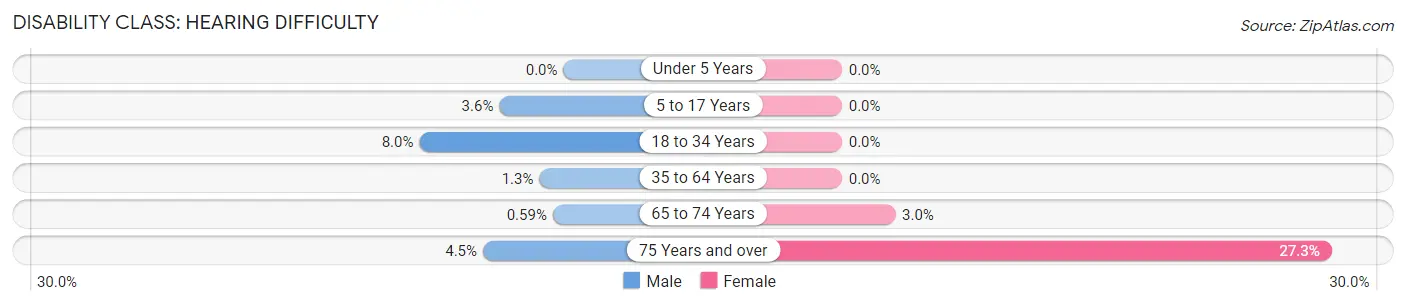
| Age Bracket | Male | Female |
| Under 5 Years | 0 (0.0%) | 0 (0.0%) |
| 5 to 17 Years | 9 (3.6%) | 0 (0.0%) |
| 18 to 34 Years | 39 (8.0%) | 0 (0.0%) |
| 35 to 64 Years | 16 (1.3%) | 0 (0.0%) |
| 65 to 74 Years | 1 (0.6%) | 6 (3.0%) |
| 75 Years and over | 6 (4.5%) | 48 (27.3%) |
Disability Class: Vision Difficulty
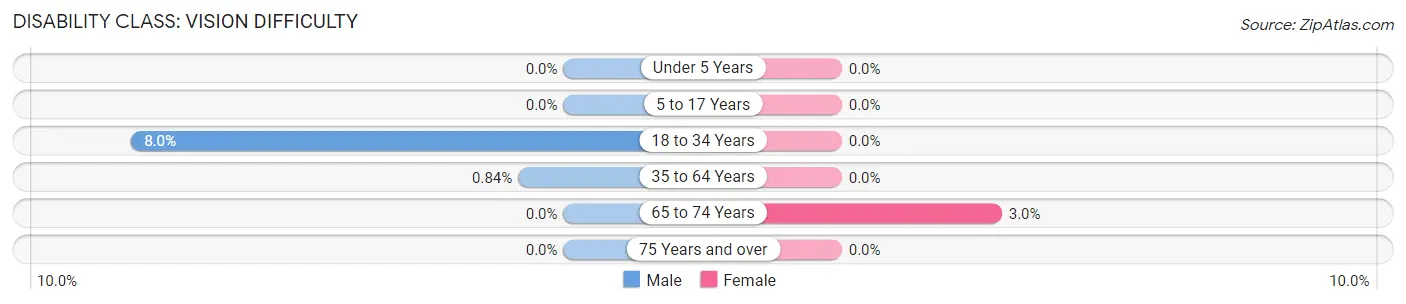
| Age Bracket | Male | Female |
| Under 5 Years | 0 (0.0%) | 0 (0.0%) |
| 5 to 17 Years | 0 (0.0%) | 0 (0.0%) |
| 18 to 34 Years | 39 (8.0%) | 0 (0.0%) |
| 35 to 64 Years | 10 (0.8%) | 0 (0.0%) |
| 65 to 74 Years | 0 (0.0%) | 6 (3.0%) |
| 75 Years and over | 0 (0.0%) | 0 (0.0%) |
Disability Class: Cognitive Difficulty
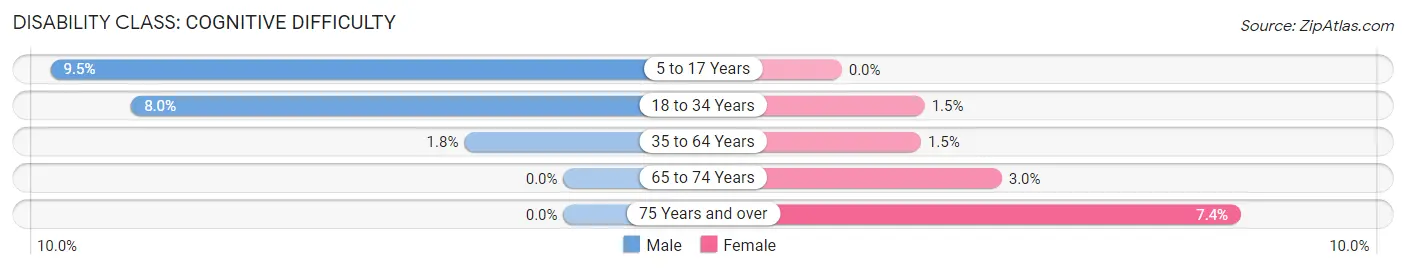
| Age Bracket | Male | Female |
| 5 to 17 Years | 24 (9.5%) | 0 (0.0%) |
| 18 to 34 Years | 39 (8.0%) | 6 (1.5%) |
| 35 to 64 Years | 22 (1.8%) | 17 (1.5%) |
| 65 to 74 Years | 0 (0.0%) | 6 (3.0%) |
| 75 Years and over | 0 (0.0%) | 13 (7.4%) |
Disability Class: Ambulatory Difficulty
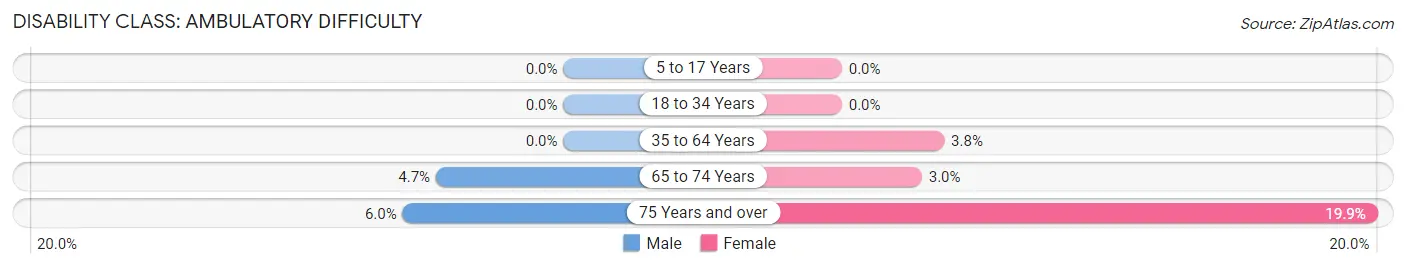
| Age Bracket | Male | Female |
| 5 to 17 Years | 0 (0.0%) | 0 (0.0%) |
| 18 to 34 Years | 0 (0.0%) | 0 (0.0%) |
| 35 to 64 Years | 0 (0.0%) | 44 (3.8%) |
| 65 to 74 Years | 8 (4.7%) | 6 (3.0%) |
| 75 Years and over | 8 (6.0%) | 35 (19.9%) |
Disability Class: Self-Care Difficulty
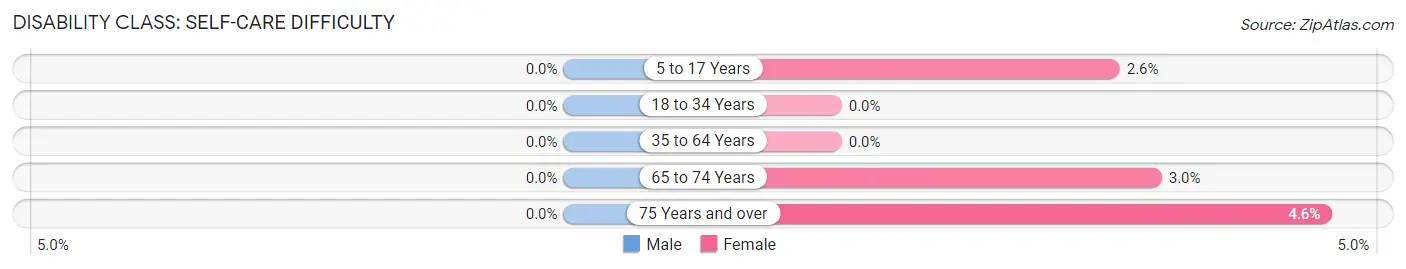
| Age Bracket | Male | Female |
| 5 to 17 Years | 0 (0.0%) | 13 (2.6%) |
| 18 to 34 Years | 0 (0.0%) | 0 (0.0%) |
| 35 to 64 Years | 0 (0.0%) | 0 (0.0%) |
| 65 to 74 Years | 0 (0.0%) | 6 (3.0%) |
| 75 Years and over | 0 (0.0%) | 8 (4.5%) |
Technology Access in Ipswich
Computing Device Access in Ipswich
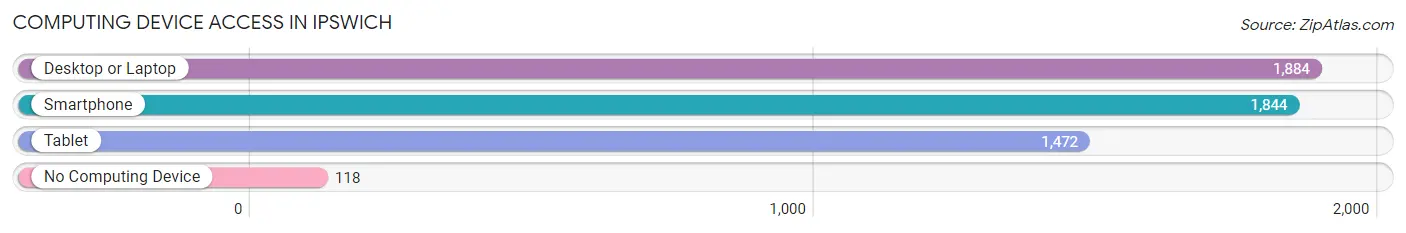
| Device Type | # Households | % Households |
| Desktop or Laptop | 1,884 | 89.5% |
| Smartphone | 1,844 | 87.6% |
| Tablet | 1,472 | 69.9% |
| No Computing Device | 118 | 5.6% |
| Total | 2,105 | 100.0% |
Internet Access in Ipswich
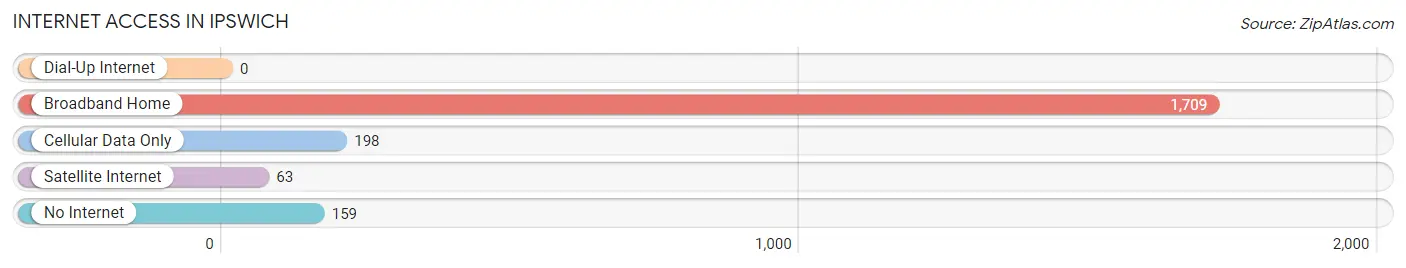
| Internet Type | # Households | % Households |
| Dial-Up Internet | 0 | 0.0% |
| Broadband Home | 1,709 | 81.2% |
| Cellular Data Only | 198 | 9.4% |
| Satellite Internet | 63 | 3.0% |
| No Internet | 159 | 7.5% |
| Total | 2,105 | 100.0% |
Ipswich Summary
Ipswich is a town located in Essex County, Massachusetts, United States. It is located on the north shore of Massachusetts Bay, about 30 miles north of Boston. The population was 13,175 at the 2010 census. Ipswich is part of the Greater Boston metropolitan area.
History
Ipswich was first settled in 1633 by a group of colonists from England, led by John Winthrop, the first governor of the Massachusetts Bay Colony. The town was named after the town of Ipswich in Suffolk, England. The colonists established a fishing and trading village, and the town quickly grew. By 1635, the town had a population of over 500 people.
In 1692, Ipswich was the site of the infamous Salem witch trials. Several of the accused witches were from Ipswich, and the town was the site of the first execution of a witch in the colonies.
In the 18th century, Ipswich was a major center of the maritime trade. The town was home to several shipyards, and the Ipswich River was a major shipping route. The town was also a center of the whaling industry, and several whaling ships were built in Ipswich.
Geography
Ipswich is located at 42°41'N 70°53'W (42.68, -70.88). According to the United States Census Bureau, the town has a total area of 28.2 square miles (73.1 km2), of which, 27.7 square miles (71.6 km2) of it is land and 0.5 square miles (1.3 km2) of it (1.77%) is water.
The town is bordered by Essex to the north, Hamilton to the east, Rowley to the southeast, and Newburyport to the south. Ipswich is located on the north shore of Massachusetts Bay, about 30 miles north of Boston.
Economy
Ipswich has a diverse economy, with a mix of manufacturing, retail, and service industries. The town is home to several large employers, including the Ipswich Mills, a textile mill; the Ipswich Brewing Company; and the Ipswich Bay Yacht Club.
The town is also home to several small businesses, including restaurants, shops, and galleries. The town is a popular tourist destination, and the Ipswich River is a popular spot for boating and fishing.
Demographics
As of the 2010 census, there were 13,175 people, 5,541 households, and 3,541 families residing in the town. The population density was 474.2 people per square mile (183.2/km2). There were 5,945 housing units at an average density of 214.3 per square mile (82.7/km2). The racial makeup of the town was 94.2% White, 1.3% African American, 0.3% Native American, 1.2% Asian, 0.1% Pacific Islander, 1.3% from other races, and 1.6% from two or more races. Hispanic or Latino of any race were 3.3% of the population.
There were 5,541 households, out of which 28.7% had children under the age of 18 living with them, 51.2% were married couples living together, 10.2% had a female householder with no husband present, and 34.3% were non-families. 28.2% of all households were made up of individuals, and 11.7% had someone living alone who was 65 years of age or older. The average household size was 2.37 and the average family size was 2.90.
In the town, the population was spread out, with 22.3% under the age of 18, 5.9% from 18 to 24, 28.2% from 25 to 44, 28.2% from 45 to 64, and 15.4% who were 65 years of age or older. The median age was 41 years. For every 100 females, there were 92.2 males. For every 100 females age 18 and over, there were 88.7 males.
The median income for a household in the town was $60,938, and the median income for a family was $72,917. Males had a median income of $50,917 versus $37,917 for females. The per capita income for the town was $30,917. About 4.2% of families and 6.2% of the population were below the poverty line, including 8.2% of those under age 18 and 5.2% of those age 65 or over.
Common Questions
What is Per Capita Income in Ipswich?
Per Capita income in Ipswich is $59,867.
What is the Median Family Income in Ipswich?
Median Family Income in Ipswich is $146,723.
What is the Median Household income in Ipswich?
Median Household Income in Ipswich is $95,342.
What is Income or Wage Gap in Ipswich?
Income or Wage Gap in Ipswich is 36.9%.
Women in Ipswich earn 63.1 cents for every dollar earned by a man.
What is Family Income Deficit in Ipswich?
Family Income Deficit in Ipswich is $12,843.
Families that are below poverty line in Ipswich earn $12,843 less on average than the poverty threshold level.
What is Inequality or Gini Index in Ipswich?
Inequality or Gini Index in Ipswich is 0.49.
What is the Total Population of Ipswich?
Total Population of Ipswich is 4,872.
What is the Total Male Population of Ipswich?
Total Male Population of Ipswich is 2,295.
What is the Total Female Population of Ipswich?
Total Female Population of Ipswich is 2,577.
What is the Ratio of Males per 100 Females in Ipswich?
There are 89.06 Males per 100 Females in Ipswich.
What is the Ratio of Females per 100 Males in Ipswich?
There are 112.29 Females per 100 Males in Ipswich.
What is the Median Population Age in Ipswich?
Median Population Age in Ipswich is 42.7 Years.
What is the Average Family Size in Ipswich
Average Family Size in Ipswich is 3.1 People.
What is the Average Household Size in Ipswich
Average Household Size in Ipswich is 2.3 People.
How Large is the Labor Force in Ipswich?
There are 2,913 People in the Labor Forcein in Ipswich.
What is the Percentage of People in the Labor Force in Ipswich?
72.3% of People are in the Labor Force in Ipswich.
What is the Unemployment Rate in Ipswich?
Unemployment Rate in Ipswich is 2.8%.