Dennis Port, MA Map & Demographics
Dennis Port Map
Dennis Port Overview
$42,238
PER CAPITA INCOME
$78,438
AVG FAMILY INCOME
$54,071
AVG HOUSEHOLD INCOME
28.3%
WAGE / INCOME GAP [ % ]
71.7¢/ $1
WAGE / INCOME GAP [ $ ]
0.47
INEQUALITY / GINI INDEX
3,300
TOTAL POPULATION
1,817
MALE POPULATION
1,483
FEMALE POPULATION
122.52
MALES / 100 FEMALES
81.62
FEMALES / 100 MALES
57.1
MEDIAN AGE
2.7
AVG FAMILY SIZE
1.9
AVG HOUSEHOLD SIZE
1,714
LABOR FORCE [ PEOPLE ]
57.7%
PERCENT IN LABOR FORCE
11.6%
UNEMPLOYMENT RATE
Dennis Port Zip Codes
Dennis Port Area Codes
Income in Dennis Port
Income Overview in Dennis Port
Per Capita Income in Dennis Port is $42,238, while median incomes of families and households are $78,438 and $54,071 respectively.
| Characteristic | Number | Measure |
| Per Capita Income | 3,300 | $42,238 |
| Median Family Income | 812 | $78,438 |
| Mean Family Income | 812 | $105,384 |
| Median Household Income | 1,699 | $54,071 |
| Mean Household Income | 1,699 | $79,484 |
| Income Deficit | 812 | $0 |
| Wage / Income Gap (%) | 3,300 | 28.28% |
| Wage / Income Gap ($) | 3,300 | 71.72¢ per $1 |
| Gini / Inequality Index | 3,300 | 0.47 |
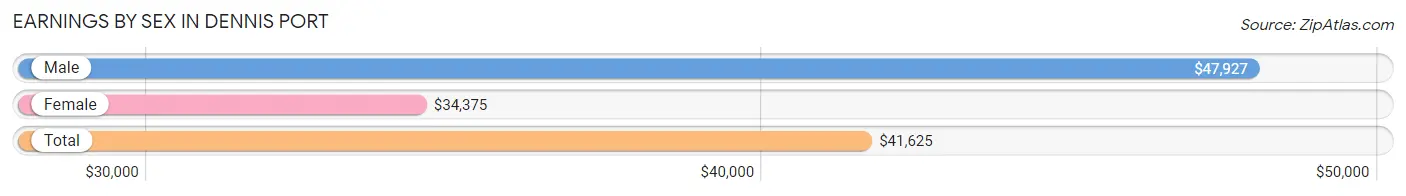
Earnings by Sex in Dennis Port
Average Earnings in Dennis Port are $41,625, $47,927 for men and $34,375 for women, a difference of 28.3%.
| Sex | Number | Average Earnings |
| Male | 948 (55.0%) | $47,927 |
| Female | 776 (45.0%) | $34,375 |
| Total | 1,724 (100.0%) | $41,625 |
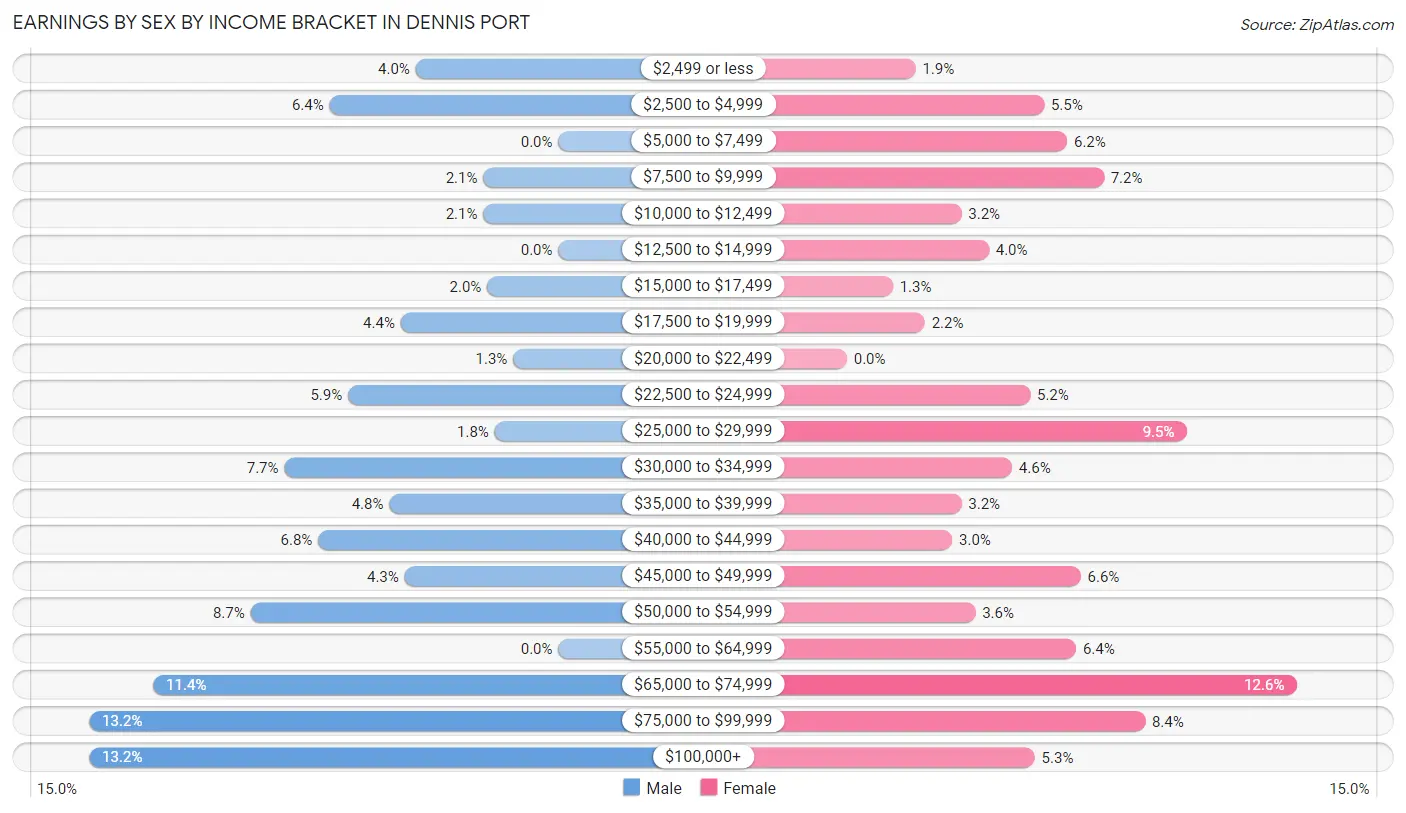
Earnings by Sex by Income Bracket in Dennis Port
The most common earnings brackets in Dennis Port are $75,000 to $99,999 for men (125 | 13.2%) and $65,000 to $74,999 for women (98 | 12.6%).
| Income | Male | Female |
| $2,499 or less | 38 (4.0%) | 15 (1.9%) |
| $2,500 to $4,999 | 61 (6.4%) | 43 (5.5%) |
| $5,000 to $7,499 | 0 (0.0%) | 48 (6.2%) |
| $7,500 to $9,999 | 20 (2.1%) | 56 (7.2%) |
| $10,000 to $12,499 | 20 (2.1%) | 25 (3.2%) |
| $12,500 to $14,999 | 0 (0.0%) | 31 (4.0%) |
| $15,000 to $17,499 | 19 (2.0%) | 10 (1.3%) |
| $17,500 to $19,999 | 42 (4.4%) | 17 (2.2%) |
| $20,000 to $22,499 | 12 (1.3%) | 0 (0.0%) |
| $22,500 to $24,999 | 56 (5.9%) | 40 (5.1%) |
| $25,000 to $29,999 | 17 (1.8%) | 74 (9.5%) |
| $30,000 to $34,999 | 73 (7.7%) | 36 (4.6%) |
| $35,000 to $39,999 | 45 (4.8%) | 25 (3.2%) |
| $40,000 to $44,999 | 64 (6.8%) | 23 (3.0%) |
| $45,000 to $49,999 | 41 (4.3%) | 51 (6.6%) |
| $50,000 to $54,999 | 82 (8.6%) | 28 (3.6%) |
| $55,000 to $64,999 | 0 (0.0%) | 50 (6.4%) |
| $65,000 to $74,999 | 108 (11.4%) | 98 (12.6%) |
| $75,000 to $99,999 | 125 (13.2%) | 65 (8.4%) |
| $100,000+ | 125 (13.2%) | 41 (5.3%) |
| Total | 948 (100.0%) | 776 (100.0%) |
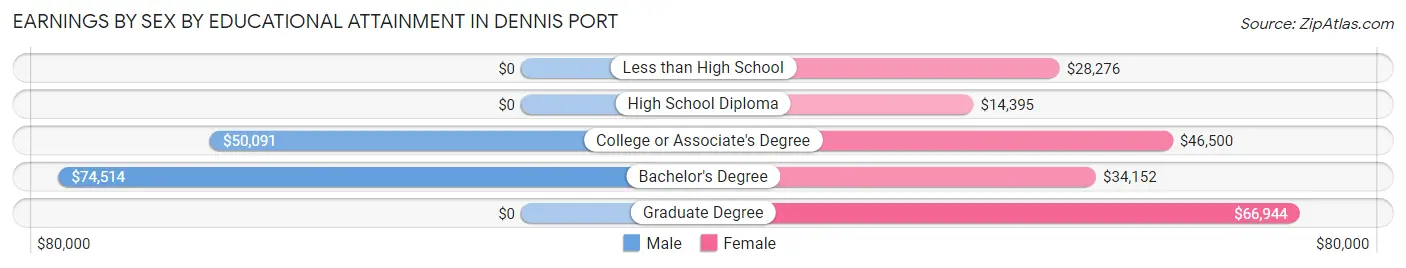
Earnings by Sex by Educational Attainment in Dennis Port
Average earnings in Dennis Port are $50,518 for men and $35,192 for women, a difference of 30.3%. Men with an educational attainment of bachelor's degree enjoy the highest average annual earnings of $74,514, while those with college or associate's degree education earn the least with $50,091. Women with an educational attainment of graduate degree earn the most with the average annual earnings of $66,944, while those with high school diploma education have the smallest earnings of $14,395.
| Educational Attainment | Male Income | Female Income |
| Less than High School | - | - |
| High School Diploma | - | - |
| College or Associate's Degree | $50,091 | $46,500 |
| Bachelor's Degree | $74,514 | $34,152 |
| Graduate Degree | - | - |
| Total | $50,518 | $35,192 |
Family Income in Dennis Port
Family Income Brackets in Dennis Port
According to the Dennis Port family income data, there are 168 families falling into the $50,000 to $74,999 income range, which is the most common income bracket and makes up 20.7% of all families.
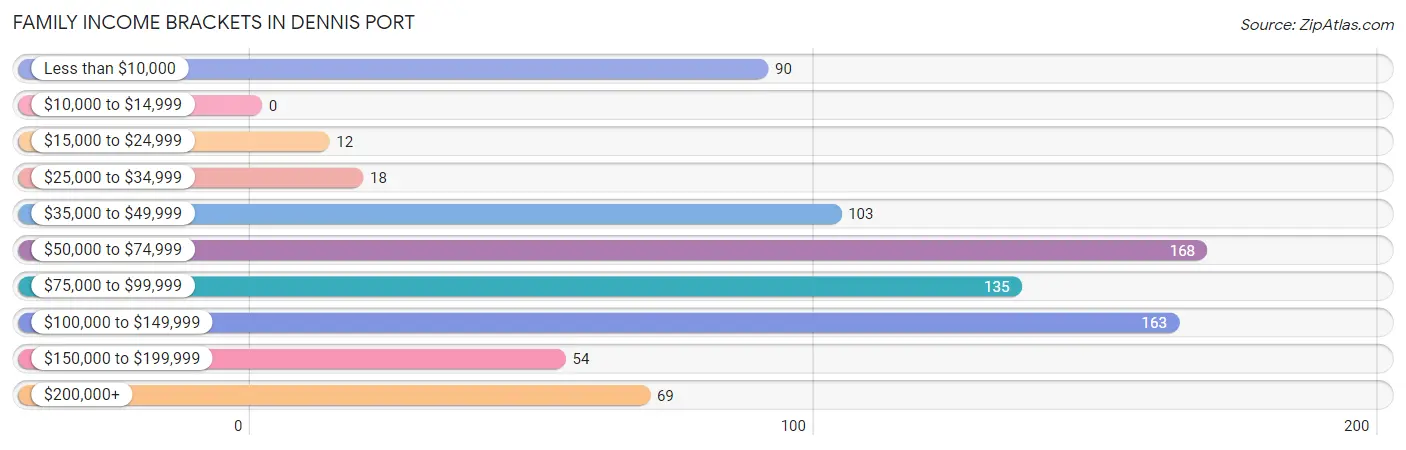
| Income Bracket | # Families | % Families |
| Less than $10,000 | 90 | 11.1% |
| $10,000 to $14,999 | 0 | 0.0% |
| $15,000 to $24,999 | 12 | 1.5% |
| $25,000 to $34,999 | 18 | 2.2% |
| $35,000 to $49,999 | 103 | 12.7% |
| $50,000 to $74,999 | 168 | 20.7% |
| $75,000 to $99,999 | 135 | 16.6% |
| $100,000 to $149,999 | 163 | 20.1% |
| $150,000 to $199,999 | 54 | 6.7% |
| $200,000+ | 69 | 8.5% |
Family Income by Famaliy Size in Dennis Port
3-person families (195 | 24.0%) account for the highest median family income in Dennis Port with $112,240 per family, while 2-person families (543 | 66.9%) have the highest median income of $37,479 per family member.
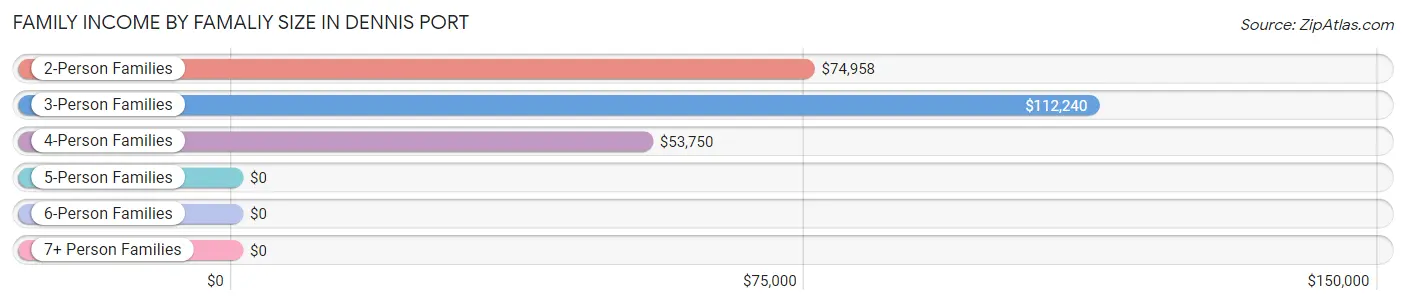
| Income Bracket | # Families | Median Income |
| 2-Person Families | 543 (66.9%) | $74,958 |
| 3-Person Families | 195 (24.0%) | $112,240 |
| 4-Person Families | 37 (4.6%) | $53,750 |
| 5-Person Families | 37 (4.6%) | $0 |
| 6-Person Families | 0 (0.0%) | $0 |
| 7+ Person Families | 0 (0.0%) | $0 |
| Total | 812 (100.0%) | $78,438 |
Family Income by Number of Earners in Dennis Port
The median family income in Dennis Port is $78,438, with families comprising 3+ earners (68) having the highest median family income of $170,667, while families with no earners (267) have the lowest median family income of $51,250, accounting for 8.4% and 32.9% of families, respectively.
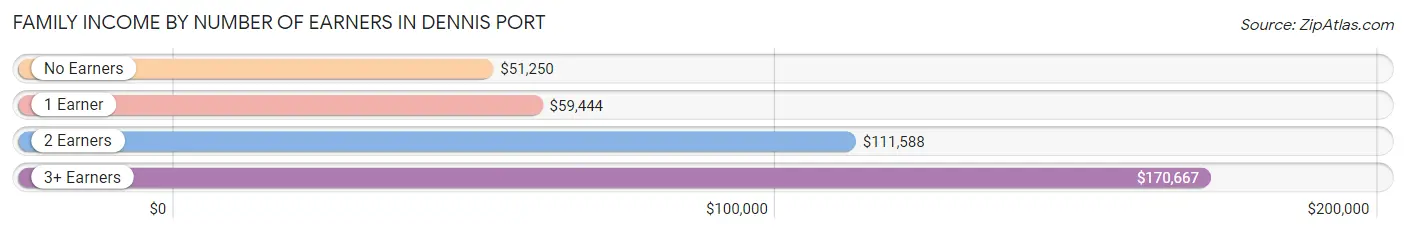
| Number of Earners | # Families | Median Income |
| No Earners | 267 (32.9%) | $51,250 |
| 1 Earner | 192 (23.6%) | $59,444 |
| 2 Earners | 285 (35.1%) | $111,588 |
| 3+ Earners | 68 (8.4%) | $170,667 |
| Total | 812 (100.0%) | $78,438 |
Household Income in Dennis Port
Household Income Brackets in Dennis Port
With 336 households falling in the category, the $50,000 to $74,999 income range is the most frequent in Dennis Port, accounting for 19.8% of all households. In contrast, only 71 households (4.2%) fall into the $10,000 to $14,999 income bracket, making it the least populous group.
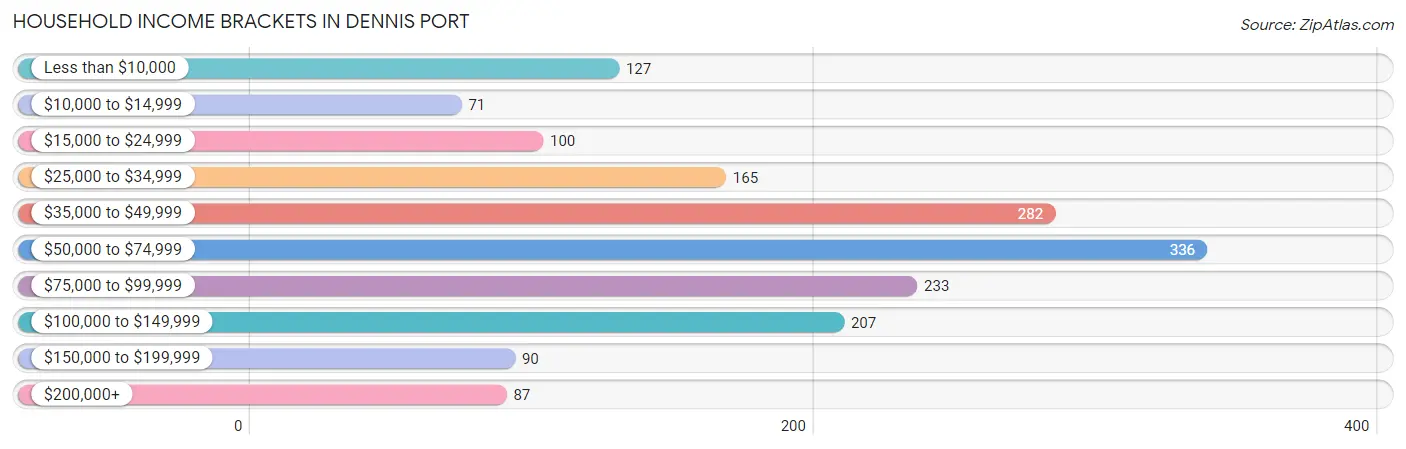
| Income Bracket | # Households | % Households |
| Less than $10,000 | 127 | 7.5% |
| $10,000 to $14,999 | 71 | 4.2% |
| $15,000 to $24,999 | 100 | 5.9% |
| $25,000 to $34,999 | 165 | 9.7% |
| $35,000 to $49,999 | 282 | 16.6% |
| $50,000 to $74,999 | 336 | 19.8% |
| $75,000 to $99,999 | 233 | 13.7% |
| $100,000 to $149,999 | 207 | 12.2% |
| $150,000 to $199,999 | 90 | 5.3% |
| $200,000+ | 87 | 5.1% |
Household Income by Householder Age in Dennis Port
The median household income in Dennis Port is $54,071, with the highest median household income of $56,429 found in the 45 to 64 years age bracket for the primary householder. A total of 698 households (41.1%) fall into this category. Meanwhile, the 15 to 24 years age bracket for the primary householder has the lowest median household income of $0, with 23 households (1.3%) in this group.
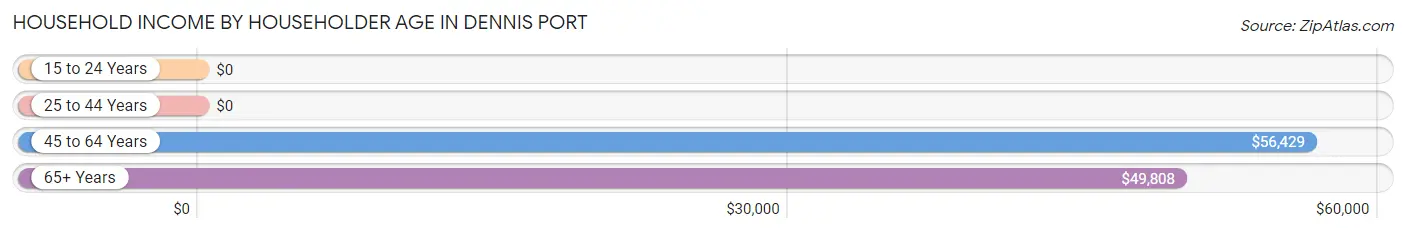
| Income Bracket | # Households | Median Income |
| 15 to 24 Years | 23 (1.3%) | $0 |
| 25 to 44 Years | 260 (15.3%) | $0 |
| 45 to 64 Years | 698 (41.1%) | $56,429 |
| 65+ Years | 718 (42.3%) | $49,808 |
| Total | 1,699 (100.0%) | $54,071 |
Poverty in Dennis Port
Income Below Poverty by Sex and Age in Dennis Port
With 20.0% poverty level for males and 16.3% for females among the residents of Dennis Port, 55 to 64 year old males and 12 to 14 year old females are the most vulnerable to poverty, with 213 males (42.7%) and 47 females (85.5%) in their respective age groups living below the poverty level.
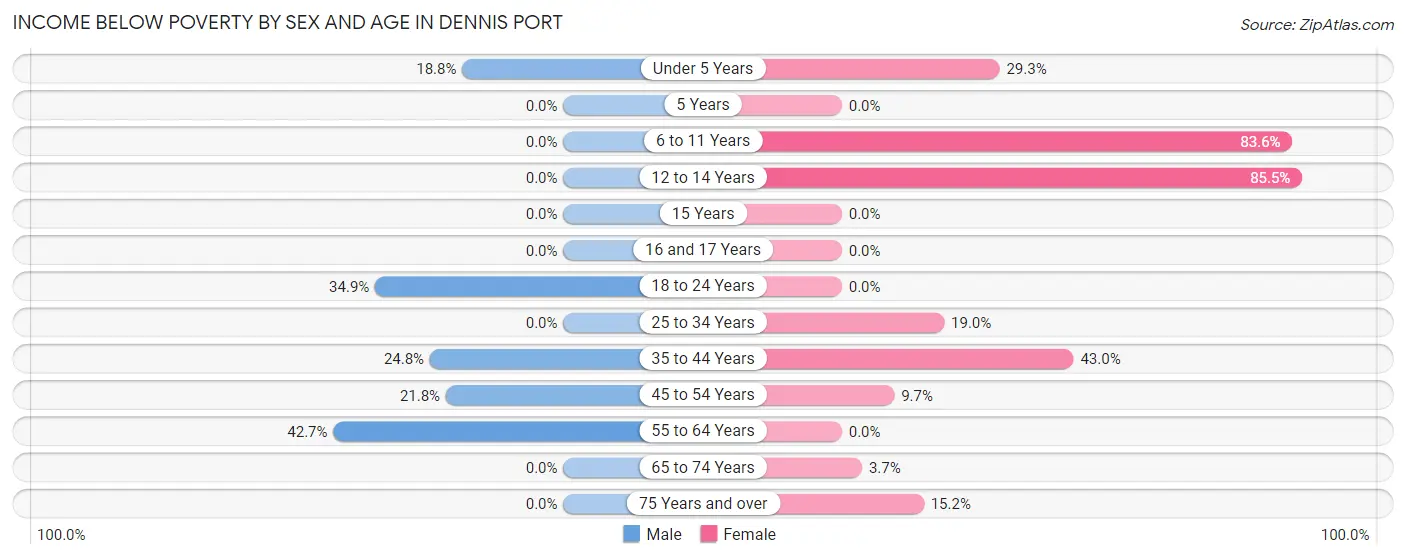
| Age Bracket | Male | Female |
| Under 5 Years | 12 (18.8%) | 12 (29.3%) |
| 5 Years | 0 (0.0%) | 0 (0.0%) |
| 6 to 11 Years | 0 (0.0%) | 46 (83.6%) |
| 12 to 14 Years | 0 (0.0%) | 47 (85.5%) |
| 15 Years | 0 (0.0%) | 0 (0.0%) |
| 16 and 17 Years | 0 (0.0%) | 0 (0.0%) |
| 18 to 24 Years | 51 (34.9%) | 0 (0.0%) |
| 25 to 34 Years | 0 (0.0%) | 30 (19.0%) |
| 35 to 44 Years | 26 (24.8%) | 43 (43.0%) |
| 45 to 54 Years | 61 (21.8%) | 18 (9.7%) |
| 55 to 64 Years | 213 (42.7%) | 0 (0.0%) |
| 65 to 74 Years | 0 (0.0%) | 12 (3.7%) |
| 75 Years and over | 0 (0.0%) | 33 (15.2%) |
| Total | 363 (20.0%) | 241 (16.3%) |
Income Above Poverty by Sex and Age in Dennis Port
According to the poverty statistics in Dennis Port, males aged 6 to 11 years and females aged 5 years are the age groups that are most secure financially, with 100.0% of males and 100.0% of females in these age groups living above the poverty line.
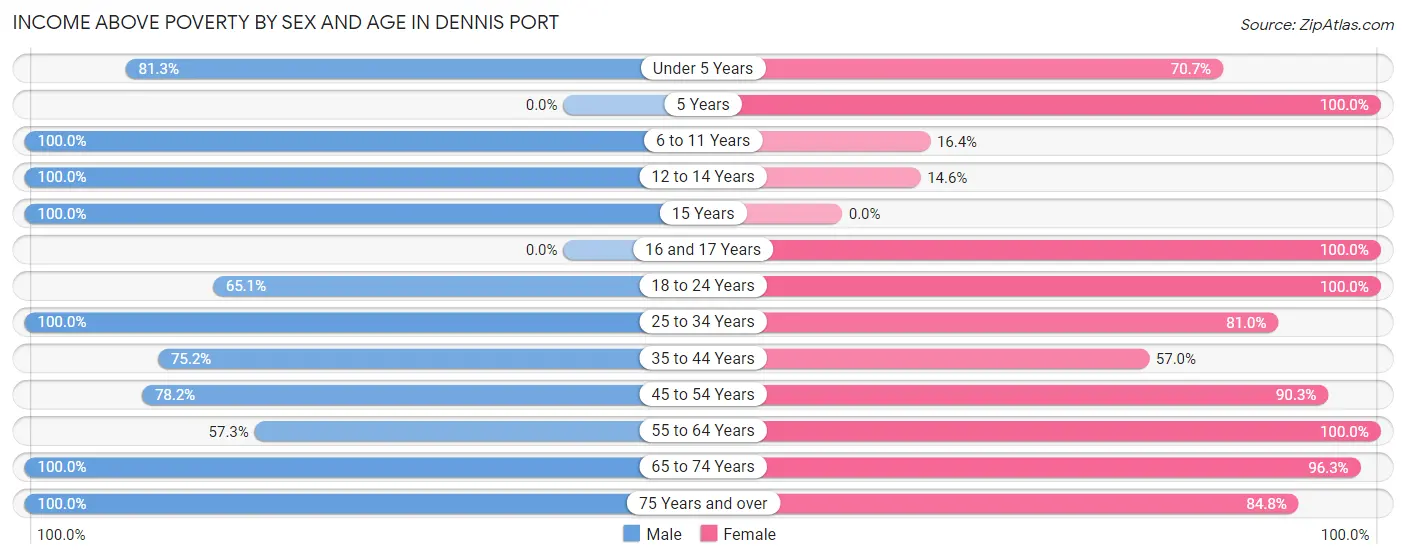
| Age Bracket | Male | Female |
| Under 5 Years | 52 (81.2%) | 29 (70.7%) |
| 5 Years | 0 (0.0%) | 19 (100.0%) |
| 6 to 11 Years | 32 (100.0%) | 9 (16.4%) |
| 12 to 14 Years | 45 (100.0%) | 8 (14.5%) |
| 15 Years | 19 (100.0%) | 0 (0.0%) |
| 16 and 17 Years | 0 (0.0%) | 14 (100.0%) |
| 18 to 24 Years | 95 (65.1%) | 62 (100.0%) |
| 25 to 34 Years | 200 (100.0%) | 128 (81.0%) |
| 35 to 44 Years | 79 (75.2%) | 57 (57.0%) |
| 45 to 54 Years | 219 (78.2%) | 167 (90.3%) |
| 55 to 64 Years | 286 (57.3%) | 256 (100.0%) |
| 65 to 74 Years | 289 (100.0%) | 309 (96.3%) |
| 75 Years and over | 138 (100.0%) | 184 (84.8%) |
| Total | 1,454 (80.0%) | 1,242 (83.8%) |
Income Below Poverty Among Married-Couple Families in Dennis Port
The poverty statistics for married-couple families in Dennis Port show that 3.0% or 18 of the total 594 families live below the poverty line. Families with no children have the highest poverty rate of 3.9%, comprising of 18 families. On the other hand, families with 1 or 2 children have the lowest poverty rate of 0.0%, which includes 0 families.
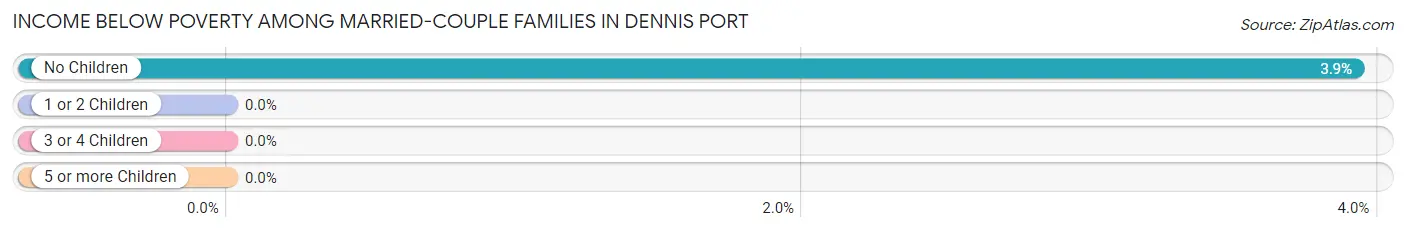
| Children | Above Poverty | Below Poverty |
| No Children | 441 (96.1%) | 18 (3.9%) |
| 1 or 2 Children | 123 (100.0%) | 0 (0.0%) |
| 3 or 4 Children | 12 (100.0%) | 0 (0.0%) |
| 5 or more Children | 0 (0.0%) | 0 (0.0%) |
| Total | 576 (97.0%) | 18 (3.0%) |
Income Below Poverty Among Single-Parent Households in Dennis Port
According to the poverty data in Dennis Port, 35.2% or 32 single-father households and 40.9% or 52 single-mother households are living below the poverty line. Among single-father households, those with no children have the highest poverty rate, with 32 households (44.4%) experiencing poverty. Likewise, among single-mother households, those with 3 or 4 children have the highest poverty rate, with 25 households (75.8%) falling below the poverty line.
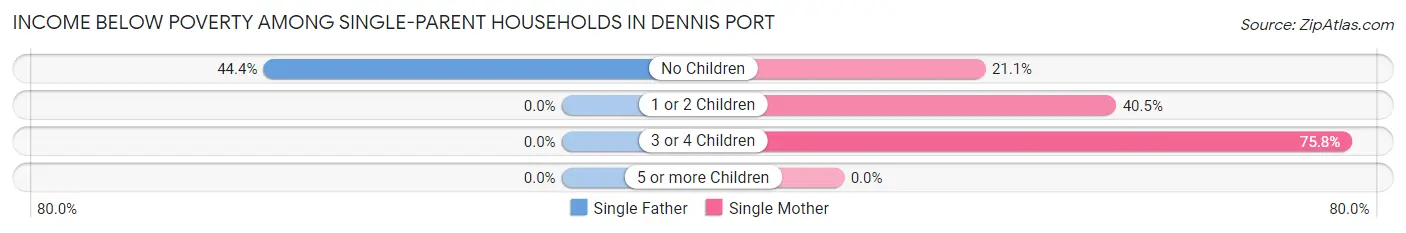
| Children | Single Father | Single Mother |
| No Children | 32 (44.4%) | 12 (21.0%) |
| 1 or 2 Children | 0 (0.0%) | 15 (40.5%) |
| 3 or 4 Children | 0 (0.0%) | 25 (75.8%) |
| 5 or more Children | 0 (0.0%) | 0 (0.0%) |
| Total | 32 (35.2%) | 52 (40.9%) |
Income Below Poverty Among Married-Couple vs Single-Parent Households in Dennis Port
The poverty data for Dennis Port shows that 18 of the married-couple family households (3.0%) and 84 of the single-parent households (38.5%) are living below the poverty level. Within the married-couple family households, those with no children have the highest poverty rate, with 18 households (3.9%) falling below the poverty line. Among the single-parent households, those with 3 or 4 children have the highest poverty rate, with 25 household (75.8%) living below poverty.
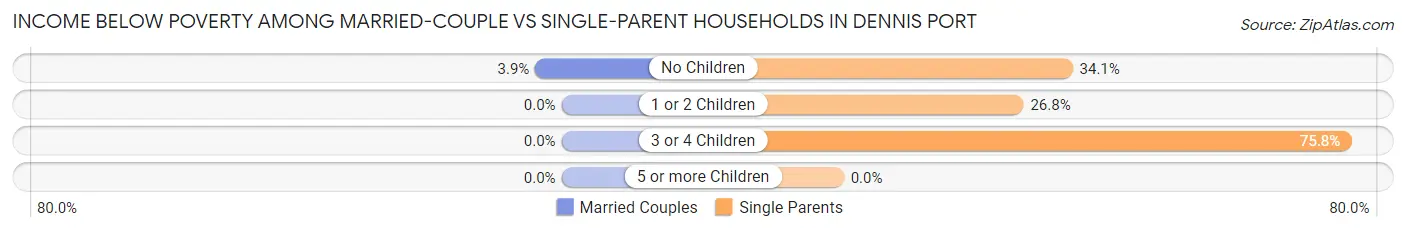
| Children | Married-Couple Families | Single-Parent Households |
| No Children | 18 (3.9%) | 44 (34.1%) |
| 1 or 2 Children | 0 (0.0%) | 15 (26.8%) |
| 3 or 4 Children | 0 (0.0%) | 25 (75.8%) |
| 5 or more Children | 0 (0.0%) | 0 (0.0%) |
| Total | 18 (3.0%) | 84 (38.5%) |
Race in Dennis Port
The most populous races in Dennis Port are White / Caucasian (2,875 | 87.1%), Two or more Races (177 | 5.4%), and Black / African American (146 | 4.4%).
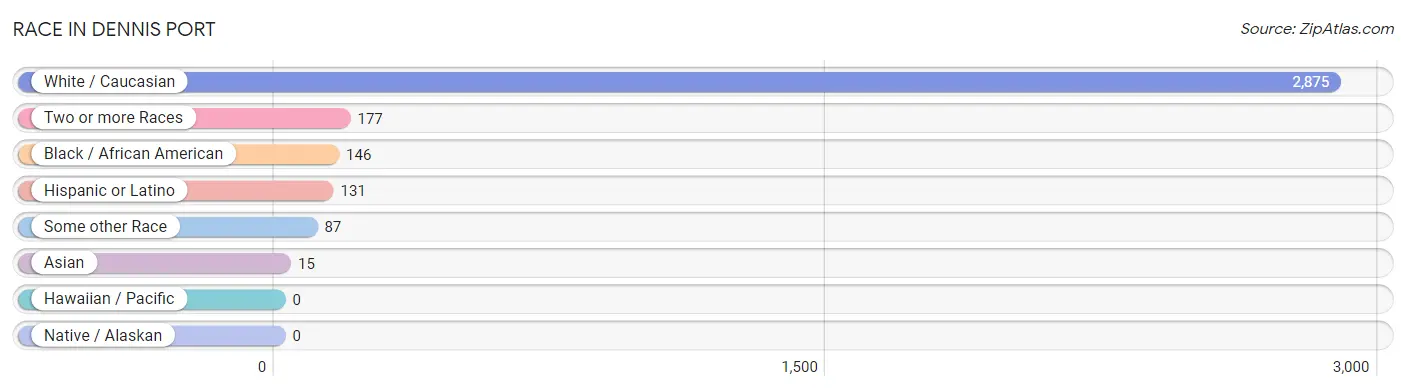
| Race | # Population | % Population |
| Asian | 15 | 0.4% |
| Black / African American | 146 | 4.4% |
| Hawaiian / Pacific | 0 | 0.0% |
| Hispanic or Latino | 131 | 4.0% |
| Native / Alaskan | 0 | 0.0% |
| White / Caucasian | 2,875 | 87.1% |
| Two or more Races | 177 | 5.4% |
| Some other Race | 87 | 2.6% |
| Total | 3,300 | 100.0% |
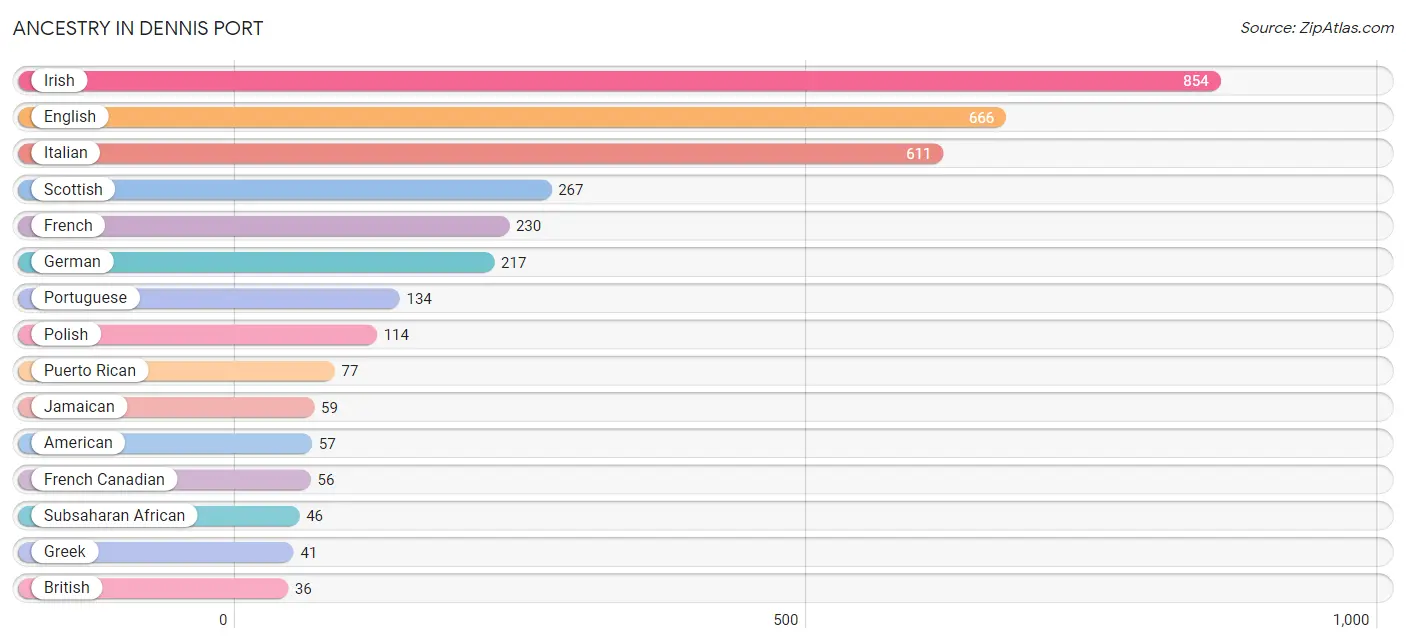
Ancestry in Dennis Port
The most populous ancestries reported in Dennis Port are Irish (854 | 25.9%), English (666 | 20.2%), Italian (611 | 18.5%), Scottish (267 | 8.1%), and French (230 | 7.0%), together accounting for 79.6% of all Dennis Port residents.
| Ancestry | # Population | % Population |
| American | 57 | 1.7% |
| Armenian | 19 | 0.6% |
| Austrian | 10 | 0.3% |
| Brazilian | 29 | 0.9% |
| British | 36 | 1.1% |
| Cape Verdean | 27 | 0.8% |
| Dutch | 13 | 0.4% |
| English | 666 | 20.2% |
| European | 14 | 0.4% |
| French | 230 | 7.0% |
| French Canadian | 56 | 1.7% |
| German | 217 | 6.6% |
| Greek | 41 | 1.2% |
| Hungarian | 10 | 0.3% |
| Indian (Asian) | 13 | 0.4% |
| Irish | 854 | 25.9% |
| Italian | 611 | 18.5% |
| Jamaican | 59 | 1.8% |
| Mexican | 22 | 0.7% |
| Nigerian | 19 | 0.6% |
| Norwegian | 11 | 0.3% |
| Polish | 114 | 3.5% |
| Portuguese | 134 | 4.1% |
| Puerto Rican | 77 | 2.3% |
| Romanian | 17 | 0.5% |
| Russian | 10 | 0.3% |
| Scotch-Irish | 10 | 0.3% |
| Scottish | 267 | 8.1% |
| Slovak | 7 | 0.2% |
| South American | 17 | 0.5% |
| Subsaharan African | 46 | 1.4% |
| Swedish | 31 | 0.9% |
| Swiss | 27 | 0.8% |
| Ukrainian | 10 | 0.3% |
| Venezuelan | 17 | 0.5% | View All 35 Rows |
Immigrants in Dennis Port
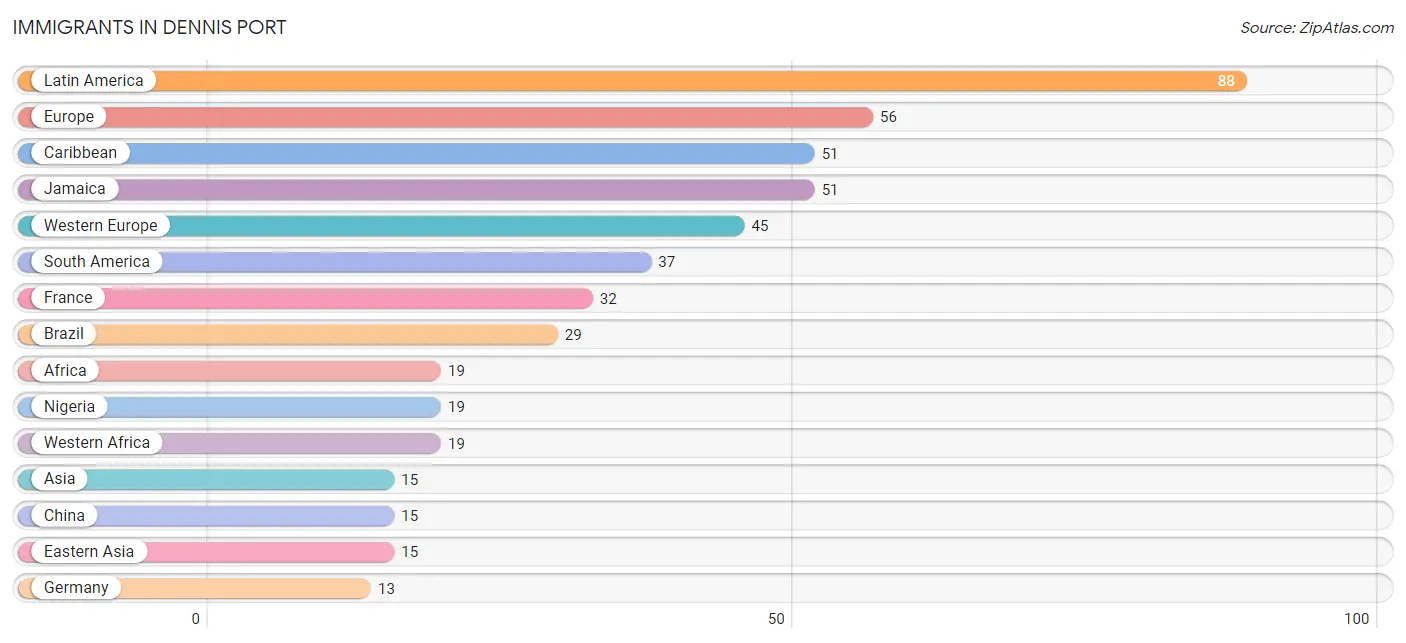
The most numerous immigrant groups reported in Dennis Port came from Latin America (88 | 2.7%), Europe (56 | 1.7%), Caribbean (51 | 1.5%), Jamaica (51 | 1.5%), and Western Europe (45 | 1.4%), together accounting for 8.8% of all Dennis Port residents.
| Immigration Origin | # Population | % Population |
| Africa | 19 | 0.6% |
| Asia | 15 | 0.4% |
| Brazil | 29 | 0.9% |
| Canada | 12 | 0.4% |
| Caribbean | 51 | 1.5% |
| China | 15 | 0.4% |
| Eastern Asia | 15 | 0.4% |
| Europe | 56 | 1.7% |
| France | 32 | 1.0% |
| Germany | 13 | 0.4% |
| Greece | 11 | 0.3% |
| Jamaica | 51 | 1.5% |
| Latin America | 88 | 2.7% |
| Nigeria | 19 | 0.6% |
| South America | 37 | 1.1% |
| Southern Europe | 11 | 0.3% |
| Venezuela | 8 | 0.2% |
| Western Africa | 19 | 0.6% |
| Western Europe | 45 | 1.4% | View All 19 Rows |
Sex and Age in Dennis Port
Sex and Age in Dennis Port
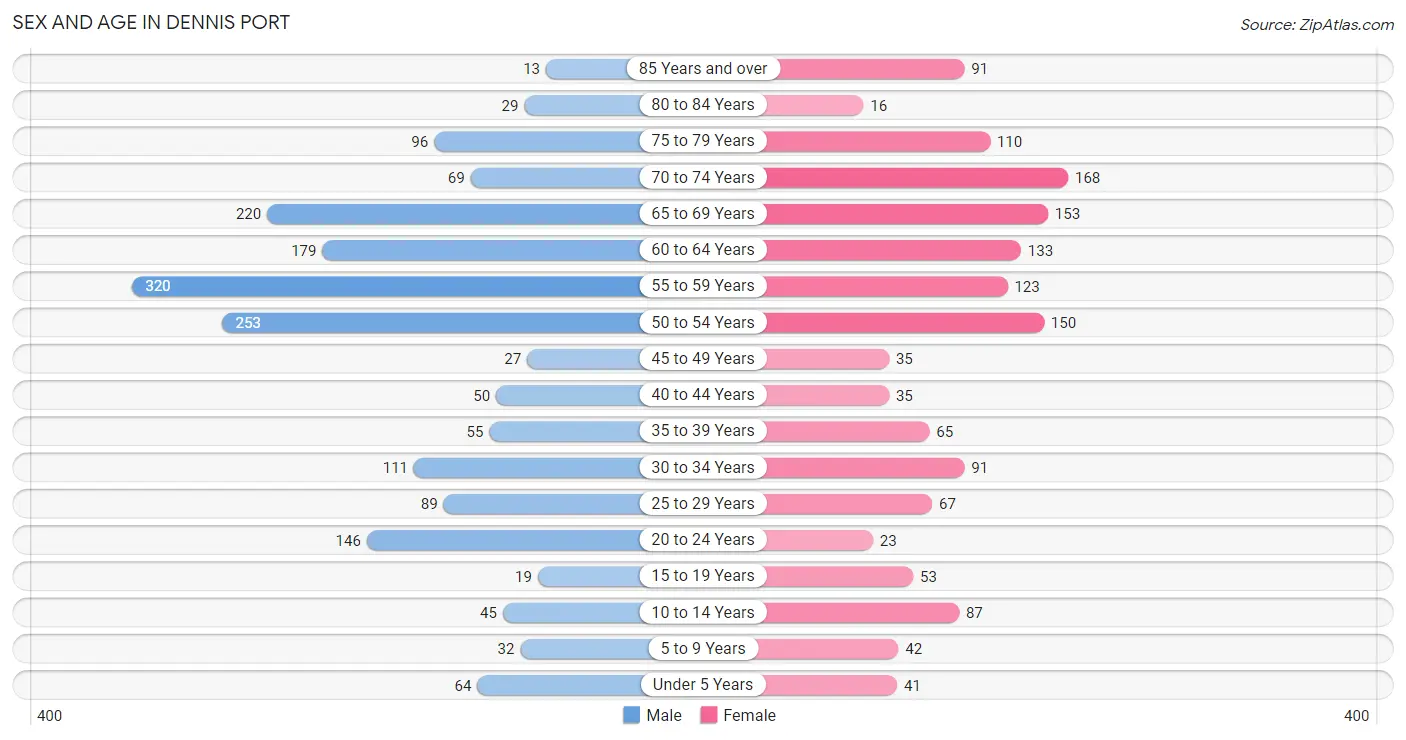
The most populous age groups in Dennis Port are 55 to 59 Years (320 | 17.6%) for men and 70 to 74 Years (168 | 11.3%) for women.
| Age Bracket | Male | Female |
| Under 5 Years | 64 (3.5%) | 41 (2.8%) |
| 5 to 9 Years | 32 (1.8%) | 42 (2.8%) |
| 10 to 14 Years | 45 (2.5%) | 87 (5.9%) |
| 15 to 19 Years | 19 (1.1%) | 53 (3.6%) |
| 20 to 24 Years | 146 (8.0%) | 23 (1.5%) |
| 25 to 29 Years | 89 (4.9%) | 67 (4.5%) |
| 30 to 34 Years | 111 (6.1%) | 91 (6.1%) |
| 35 to 39 Years | 55 (3.0%) | 65 (4.4%) |
| 40 to 44 Years | 50 (2.8%) | 35 (2.4%) |
| 45 to 49 Years | 27 (1.5%) | 35 (2.4%) |
| 50 to 54 Years | 253 (13.9%) | 150 (10.1%) |
| 55 to 59 Years | 320 (17.6%) | 123 (8.3%) |
| 60 to 64 Years | 179 (9.9%) | 133 (9.0%) |
| 65 to 69 Years | 220 (12.1%) | 153 (10.3%) |
| 70 to 74 Years | 69 (3.8%) | 168 (11.3%) |
| 75 to 79 Years | 96 (5.3%) | 110 (7.4%) |
| 80 to 84 Years | 29 (1.6%) | 16 (1.1%) |
| 85 Years and over | 13 (0.7%) | 91 (6.1%) |
| Total | 1,817 (100.0%) | 1,483 (100.0%) |
Families and Households in Dennis Port
Median Family Size in Dennis Port
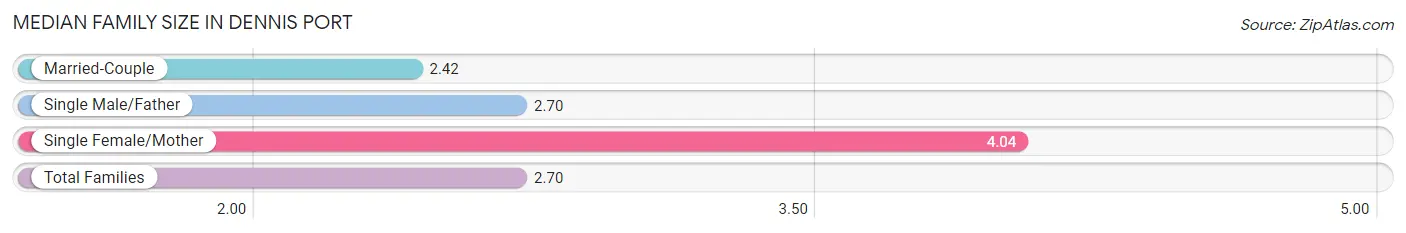
The median family size in Dennis Port is 2.70 persons per family, with single female/mother families (127 | 15.6%) accounting for the largest median family size of 4.04 persons per family. On the other hand, married-couple families (594 | 73.2%) represent the smallest median family size with 2.42 persons per family.
| Family Type | # Families | Family Size |
| Married-Couple | 594 (73.2%) | 2.42 |
| Single Male/Father | 91 (11.2%) | 2.70 |
| Single Female/Mother | 127 (15.6%) | 4.04 |
| Total Families | 812 (100.0%) | 2.70 |
Median Household Size in Dennis Port
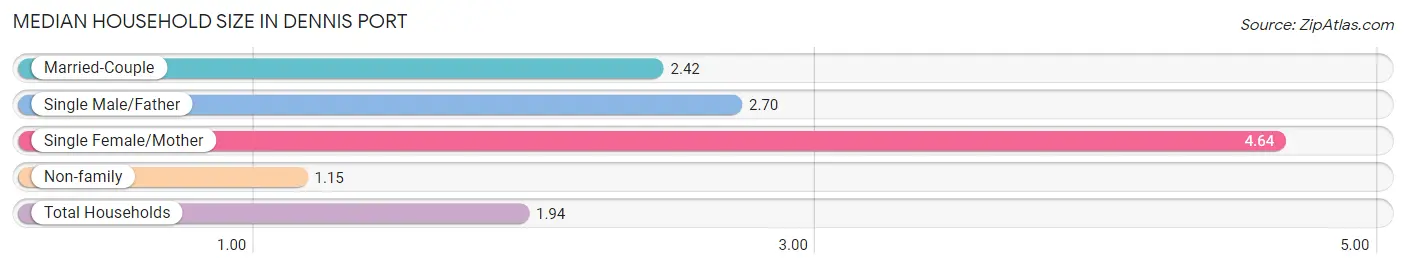
The median household size in Dennis Port is 1.94 persons per household, with single female/mother households (127 | 7.5%) accounting for the largest median household size of 4.64 persons per household. non-family households (887 | 52.2%) represent the smallest median household size with 1.15 persons per household.
| Household Type | # Households | Household Size |
| Married-Couple | 594 (35.0%) | 2.42 |
| Single Male/Father | 91 (5.4%) | 2.70 |
| Single Female/Mother | 127 (7.5%) | 4.64 |
| Non-family | 887 (52.2%) | 1.15 |
| Total Households | 1,699 (100.0%) | 1.94 |
Household Size by Marriage Status in Dennis Port
Out of a total of 1,699 households in Dennis Port, 812 (47.8%) are family households, while 887 (52.2%) are nonfamily households. The most numerous type of family households are 2-person households, comprising 529, and the most common type of nonfamily households are 1-person households, comprising 796.
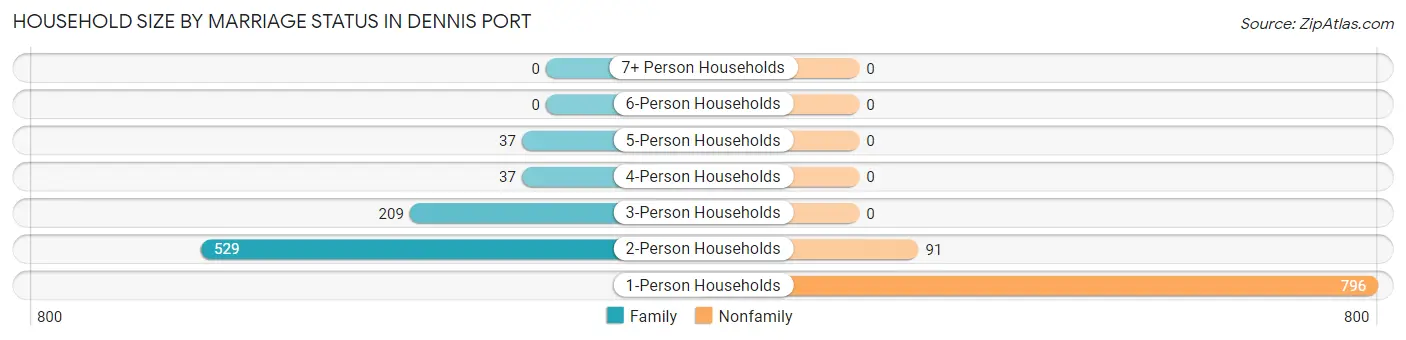
| Household Size | Family Households | Nonfamily Households |
| 1-Person Households | - | 796 (46.9%) |
| 2-Person Households | 529 (31.1%) | 91 (5.4%) |
| 3-Person Households | 209 (12.3%) | 0 (0.0%) |
| 4-Person Households | 37 (2.2%) | 0 (0.0%) |
| 5-Person Households | 37 (2.2%) | 0 (0.0%) |
| 6-Person Households | 0 (0.0%) | 0 (0.0%) |
| 7+ Person Households | 0 (0.0%) | 0 (0.0%) |
| Total | 812 (47.8%) | 887 (52.2%) |
Female Fertility in Dennis Port
Fertility by Age in Dennis Port
Average fertility rate in Dennis Port is 117.0 births per 1,000 women. Women in the age bracket of 35 to 50 years have the highest fertility rate with 141.0 births per 1,000 women. Women in the age bracket of 20 to 34 years acount for 55.8% of all women with births.
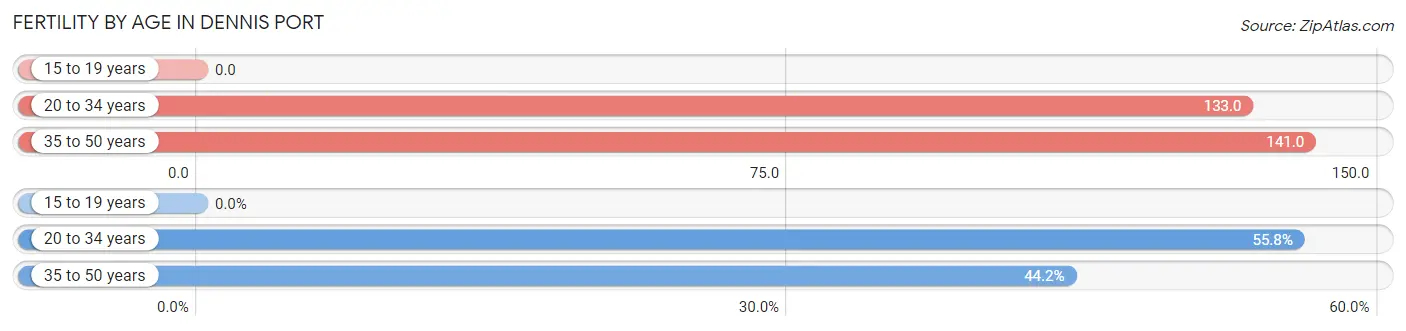
| Age Bracket | Women with Births | Births / 1,000 Women |
| 15 to 19 years | 0 (0.0%) | 0.0 |
| 20 to 34 years | 24 (55.8%) | 133.0 |
| 35 to 50 years | 19 (44.2%) | 141.0 |
| Total | 43 (100.0%) | 117.0 |
Fertility by Age by Marriage Status in Dennis Port
83.7% of women with births (43) in Dennis Port are married. The highest percentage of unmarried women with births falls into 35 to 50 years age bracket with 36.8% of them unmarried at the time of birth, while the lowest percentage of unmarried women with births belong to 20 to 34 years age bracket with 0.0% of them unmarried.
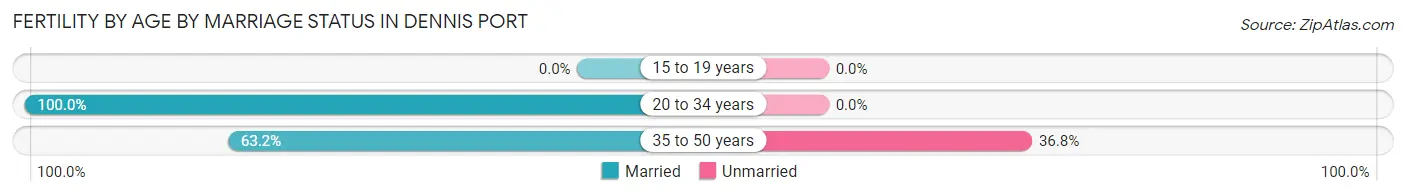
| Age Bracket | Married | Unmarried |
| 15 to 19 years | 0 (0.0%) | 0 (0.0%) |
| 20 to 34 years | 24 (100.0%) | 0 (0.0%) |
| 35 to 50 years | 12 (63.2%) | 7 (36.8%) |
| Total | 36 (83.7%) | 7 (16.3%) |
Fertility by Education in Dennis Port
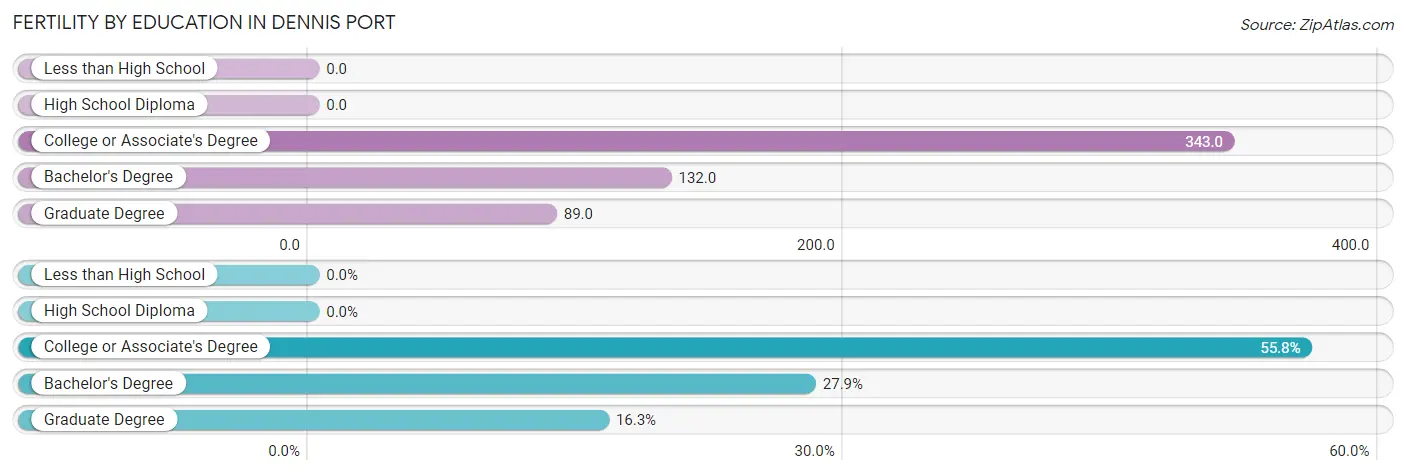
| Educational Attainment | Women with Births | Births / 1,000 Women |
| Less than High School | 0 (0.0%) | 0.0 |
| High School Diploma | 0 (0.0%) | 0.0 |
| College or Associate's Degree | 24 (55.8%) | 343.0 |
| Bachelor's Degree | 12 (27.9%) | 132.0 |
| Graduate Degree | 7 (16.3%) | 89.0 |
| Total | 43 (100.0%) | 117.0 |
Fertility by Education by Marriage Status in Dennis Port
16.3% of women with births in Dennis Port are unmarried. Women with the educational attainment of college or associate's degree are most likely to be married with 100.0% of them married at childbirth, while women with the educational attainment of graduate degree are least likely to be married with 100.0% of them unmarried at childbirth.
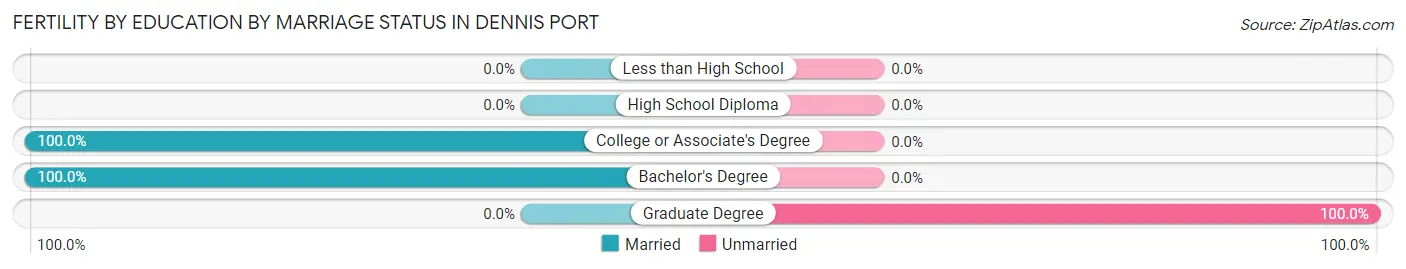
| Educational Attainment | Married | Unmarried |
| Less than High School | 0 (0.0%) | 0 (0.0%) |
| High School Diploma | 0 (0.0%) | 0 (0.0%) |
| College or Associate's Degree | 24 (100.0%) | 0 (0.0%) |
| Bachelor's Degree | 12 (100.0%) | 0 (0.0%) |
| Graduate Degree | 0 (0.0%) | 7 (100.0%) |
| Total | 36 (83.7%) | 7 (16.3%) |
Employment Characteristics in Dennis Port
Employment by Class of Employer in Dennis Port
Among the 1,484 employed individuals in Dennis Port, private company employees (876 | 59.0%), not-for-profit organizations (313 | 21.1%), and self-employed (incorporated) (115 | 7.7%) make up the most common classes of employment.
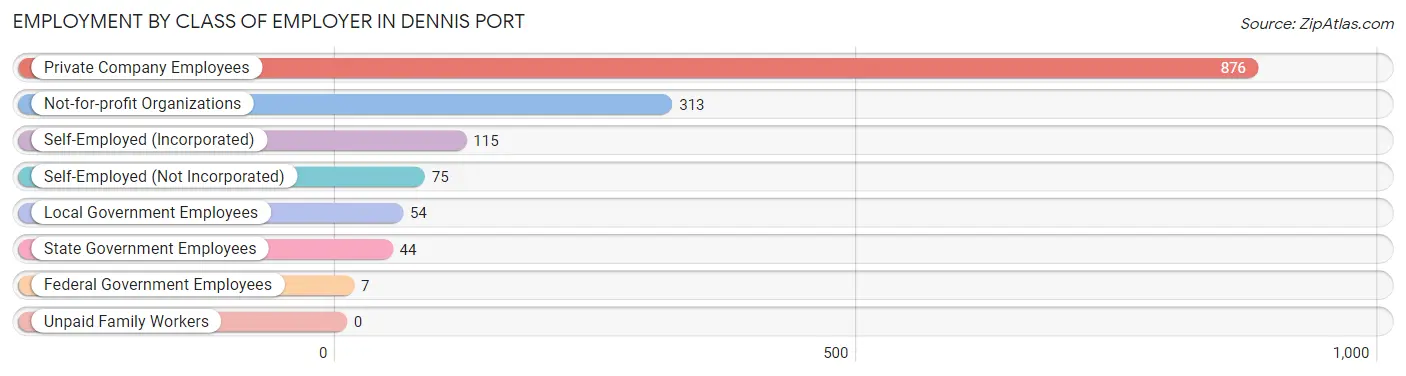
| Employer Class | # Employees | % Employees |
| Private Company Employees | 876 | 59.0% |
| Self-Employed (Incorporated) | 115 | 7.7% |
| Self-Employed (Not Incorporated) | 75 | 5.1% |
| Not-for-profit Organizations | 313 | 21.1% |
| Local Government Employees | 54 | 3.6% |
| State Government Employees | 44 | 3.0% |
| Federal Government Employees | 7 | 0.5% |
| Unpaid Family Workers | 0 | 0.0% |
| Total | 1,484 | 100.0% |
Employment Status by Age in Dennis Port
According to the labor force statistics for Dennis Port, out of the total population over 16 years of age (2,970), 57.7% or 1,714 individuals are in the labor force, with 11.6% or 199 of them unemployed. The age group with the highest labor force participation rate is 25 to 29 years, with 100.0% or 156 individuals in the labor force. Within the labor force, the 65 to 74 years age range has the highest percentage of unemployed individuals, with 27.6% or 48 of them being unemployed.
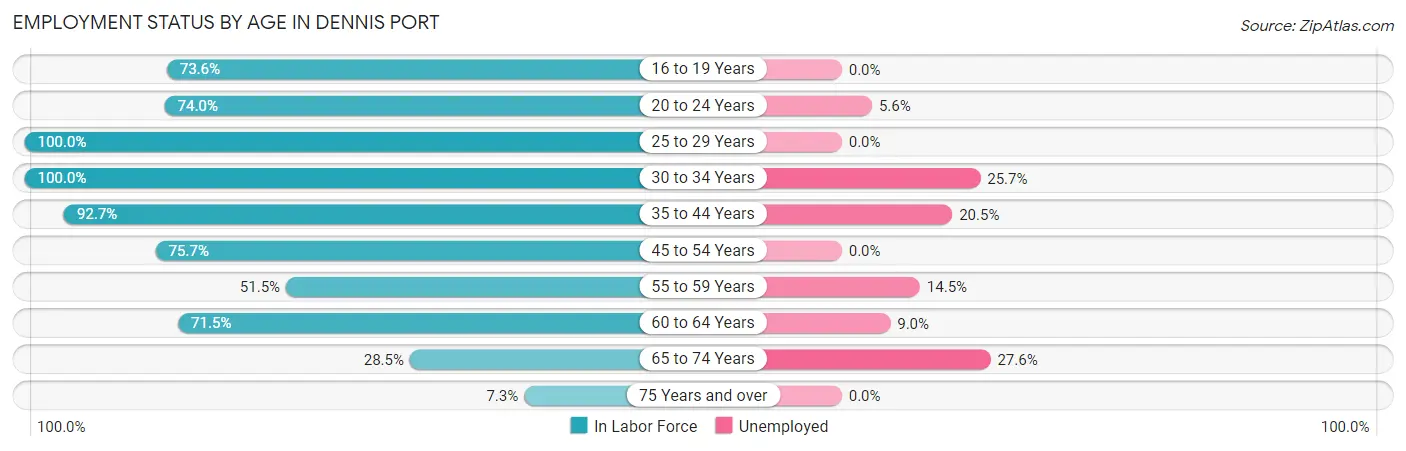
| Age Bracket | In Labor Force | Unemployed |
| 16 to 19 Years | 39 (73.6%) | 0 (0.0%) |
| 20 to 24 Years | 125 (74.0%) | 7 (5.6%) |
| 25 to 29 Years | 156 (100.0%) | 0 (0.0%) |
| 30 to 34 Years | 202 (100.0%) | 52 (25.7%) |
| 35 to 44 Years | 190 (92.7%) | 39 (20.5%) |
| 45 to 54 Years | 352 (75.7%) | 0 (0.0%) |
| 55 to 59 Years | 228 (51.5%) | 33 (14.5%) |
| 60 to 64 Years | 223 (71.5%) | 20 (9.0%) |
| 65 to 74 Years | 174 (28.5%) | 48 (27.6%) |
| 75 Years and over | 26 (7.3%) | 0 (0.0%) |
| Total | 1,714 (57.7%) | 199 (11.6%) |
Employment Status by Educational Attainment in Dennis Port
According to labor force statistics for Dennis Port, 75.8% of individuals (1,352) out of the total population between 25 and 64 years of age (1,783) are in the labor force, with 10.7% or 145 of them being unemployed. The group with the highest labor force participation rate are those with the educational attainment of college / associate degree, with 88.0% or 602 individuals in the labor force. Within the labor force, individuals with bachelor's degree or higher education have the highest percentage of unemployment, with 14.6% or 67 of them being unemployed.
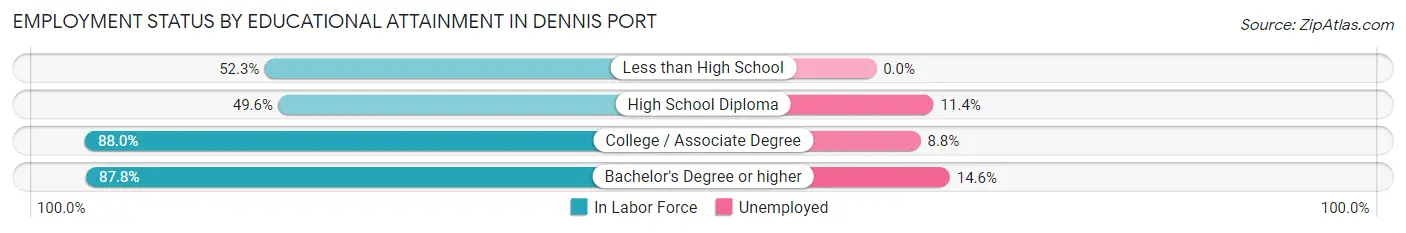
| Educational Attainment | In Labor Force | Unemployed |
| Less than High School | 79 (52.3%) | 0 (0.0%) |
| High School Diploma | 211 (49.6%) | 48 (11.4%) |
| College / Associate Degree | 602 (88.0%) | 60 (8.8%) |
| Bachelor's Degree or higher | 459 (87.8%) | 76 (14.6%) |
| Total | 1,352 (75.8%) | 191 (10.7%) |
Employment Occupations by Sex in Dennis Port
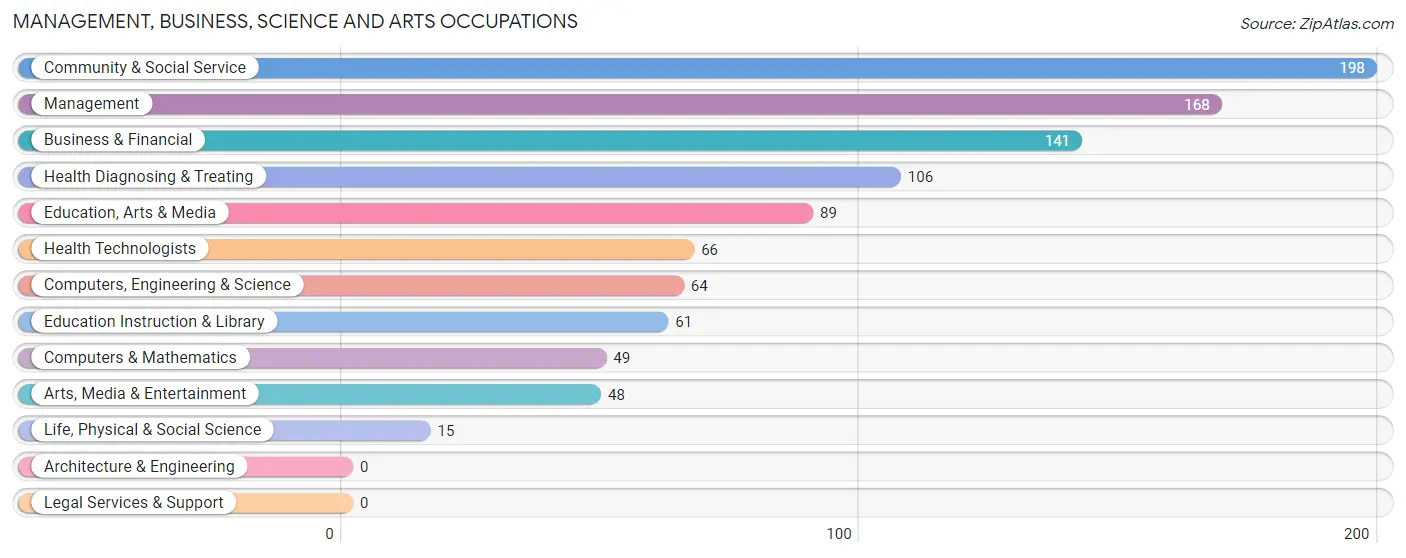
Management, Business, Science and Arts Occupations
The most common Management, Business, Science and Arts occupations in Dennis Port are Community & Social Service (198 | 13.1%), Management (168 | 11.1%), Business & Financial (141 | 9.3%), Health Diagnosing & Treating (106 | 7.0%), and Education, Arts & Media (89 | 5.9%).
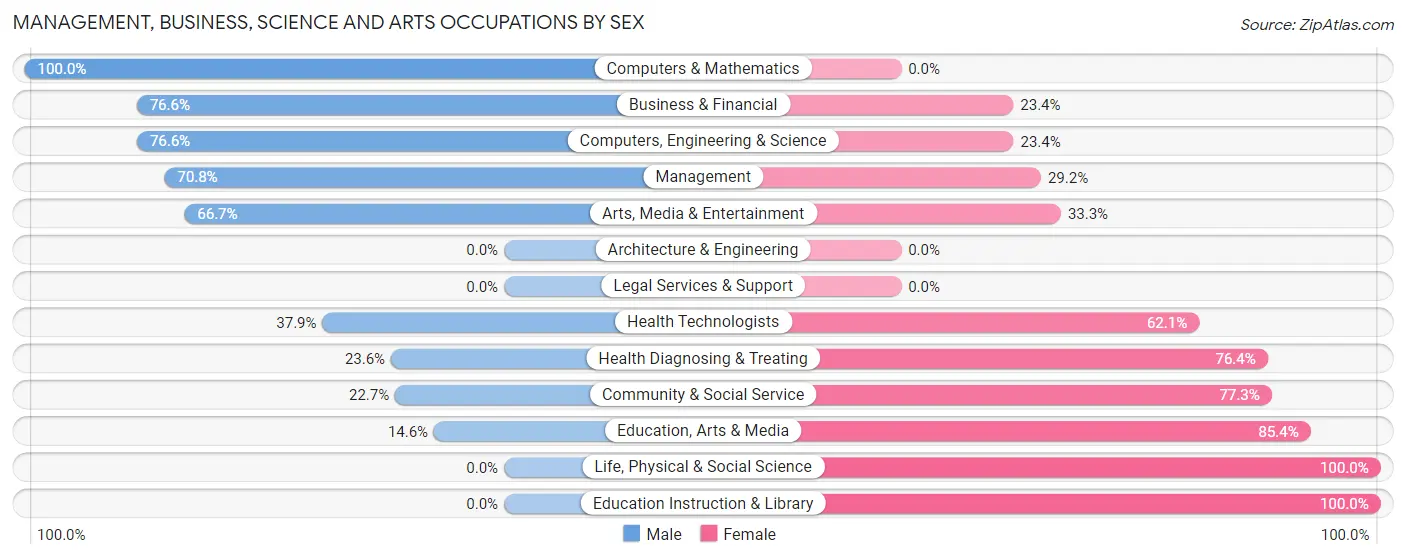
Management, Business, Science and Arts Occupations by Sex
Within the Management, Business, Science and Arts occupations in Dennis Port, the most male-oriented occupations are Computers & Mathematics (100.0%), Business & Financial (76.6%), and Computers, Engineering & Science (76.6%), while the most female-oriented occupations are Life, Physical & Social Science (100.0%), Education Instruction & Library (100.0%), and Education, Arts & Media (85.4%).
| Occupation | Male | Female |
| Management | 119 (70.8%) | 49 (29.2%) |
| Business & Financial | 108 (76.6%) | 33 (23.4%) |
| Computers, Engineering & Science | 49 (76.6%) | 15 (23.4%) |
| Computers & Mathematics | 49 (100.0%) | 0 (0.0%) |
| Architecture & Engineering | 0 (0.0%) | 0 (0.0%) |
| Life, Physical & Social Science | 0 (0.0%) | 15 (100.0%) |
| Community & Social Service | 45 (22.7%) | 153 (77.3%) |
| Education, Arts & Media | 13 (14.6%) | 76 (85.4%) |
| Legal Services & Support | 0 (0.0%) | 0 (0.0%) |
| Education Instruction & Library | 0 (0.0%) | 61 (100.0%) |
| Arts, Media & Entertainment | 32 (66.7%) | 16 (33.3%) |
| Health Diagnosing & Treating | 25 (23.6%) | 81 (76.4%) |
| Health Technologists | 25 (37.9%) | 41 (62.1%) |
| Total (Category) | 346 (51.1%) | 331 (48.9%) |
| Total (Overall) | 764 (50.4%) | 752 (49.6%) |
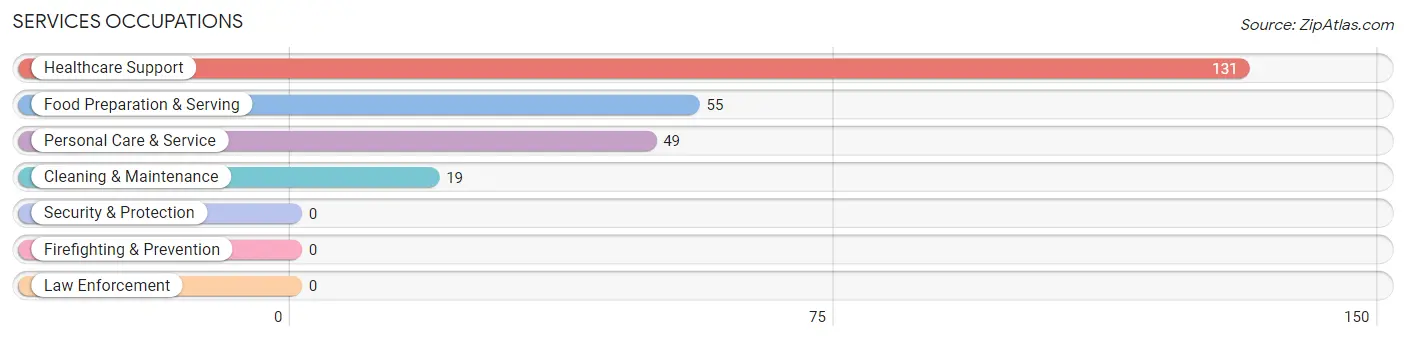
Services Occupations
The most common Services occupations in Dennis Port are Healthcare Support (131 | 8.6%), Food Preparation & Serving (55 | 3.6%), Personal Care & Service (49 | 3.2%), and Cleaning & Maintenance (19 | 1.3%).
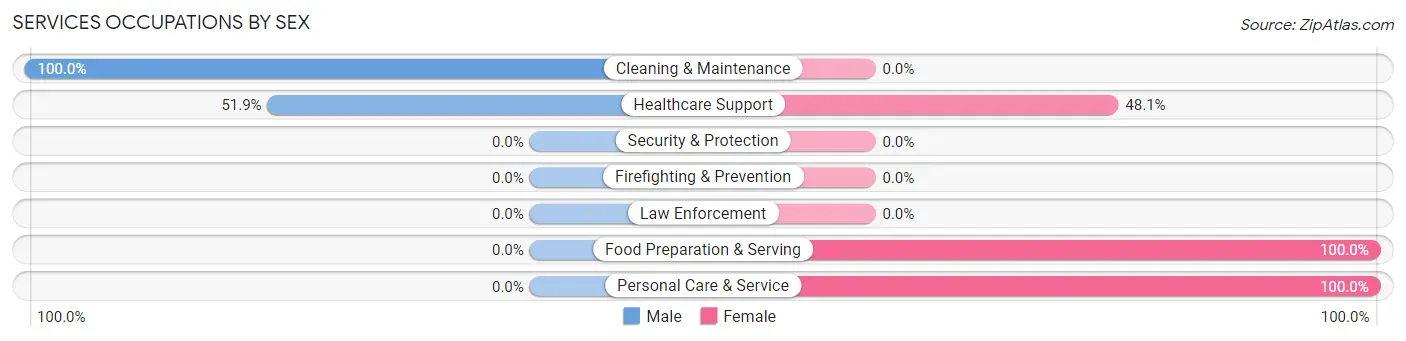
Services Occupations by Sex
Within the Services occupations in Dennis Port, the most male-oriented occupations are Cleaning & Maintenance (100.0%), and Healthcare Support (51.9%), while the most female-oriented occupations are Food Preparation & Serving (100.0%), Personal Care & Service (100.0%), and Healthcare Support (48.1%).
| Occupation | Male | Female |
| Healthcare Support | 68 (51.9%) | 63 (48.1%) |
| Security & Protection | 0 (0.0%) | 0 (0.0%) |
| Firefighting & Prevention | 0 (0.0%) | 0 (0.0%) |
| Law Enforcement | 0 (0.0%) | 0 (0.0%) |
| Food Preparation & Serving | 0 (0.0%) | 55 (100.0%) |
| Cleaning & Maintenance | 19 (100.0%) | 0 (0.0%) |
| Personal Care & Service | 0 (0.0%) | 49 (100.0%) |
| Total (Category) | 87 (34.3%) | 167 (65.7%) |
| Total (Overall) | 764 (50.4%) | 752 (49.6%) |
Sales and Office Occupations
The most common Sales and Office occupations in Dennis Port are Office & Administration (207 | 13.7%), and Sales & Related (56 | 3.7%).
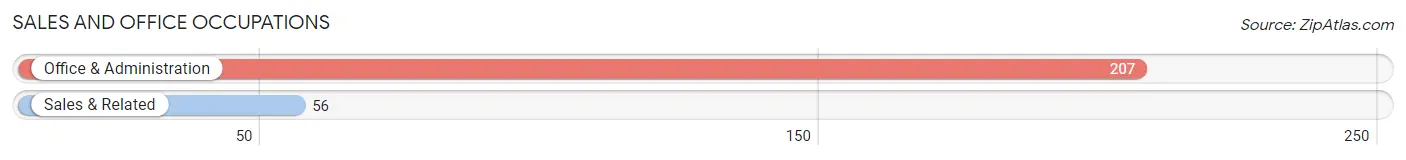
Sales and Office Occupations by Sex

| Occupation | Male | Female |
| Sales & Related | 10 (17.9%) | 46 (82.1%) |
| Office & Administration | 92 (44.4%) | 115 (55.6%) |
| Total (Category) | 102 (38.8%) | 161 (61.2%) |
| Total (Overall) | 764 (50.4%) | 752 (49.6%) |
Natural Resources, Construction and Maintenance Occupations
The most common Natural Resources, Construction and Maintenance occupations in Dennis Port are Installation, Maintenance & Repair (159 | 10.5%), and Construction & Extraction (41 | 2.7%).
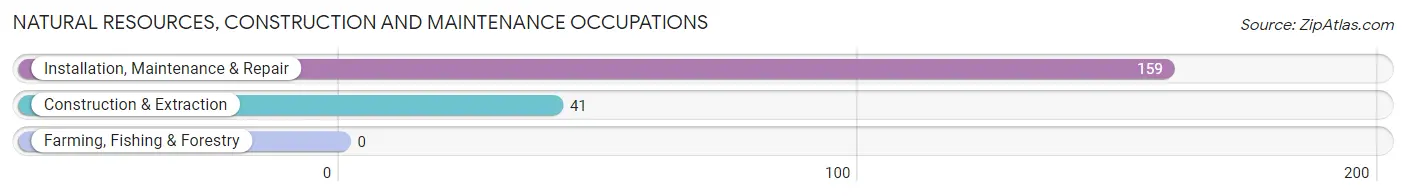
Natural Resources, Construction and Maintenance Occupations by Sex
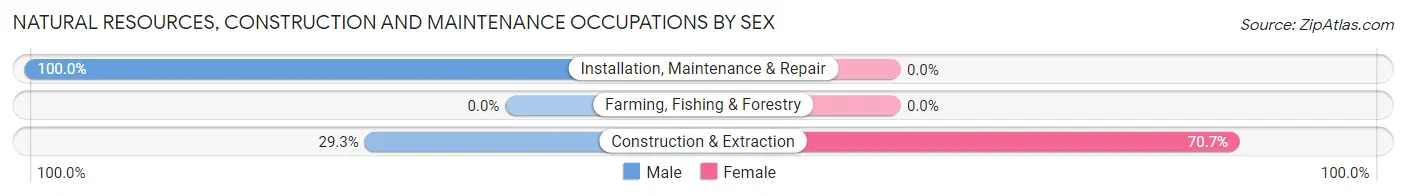
| Occupation | Male | Female |
| Farming, Fishing & Forestry | 0 (0.0%) | 0 (0.0%) |
| Construction & Extraction | 12 (29.3%) | 29 (70.7%) |
| Installation, Maintenance & Repair | 159 (100.0%) | 0 (0.0%) |
| Total (Category) | 171 (85.5%) | 29 (14.5%) |
| Total (Overall) | 764 (50.4%) | 752 (49.6%) |
Production, Transportation and Moving Occupations
The most common Production, Transportation and Moving occupations in Dennis Port are Material Moving (52 | 3.4%), Production (39 | 2.6%), and Transportation (31 | 2.0%).
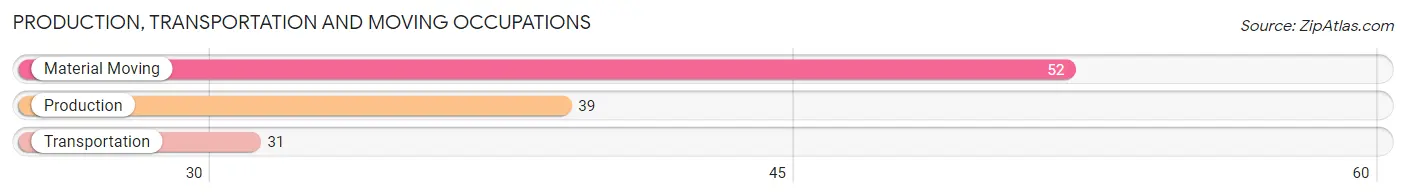
Production, Transportation and Moving Occupations by Sex
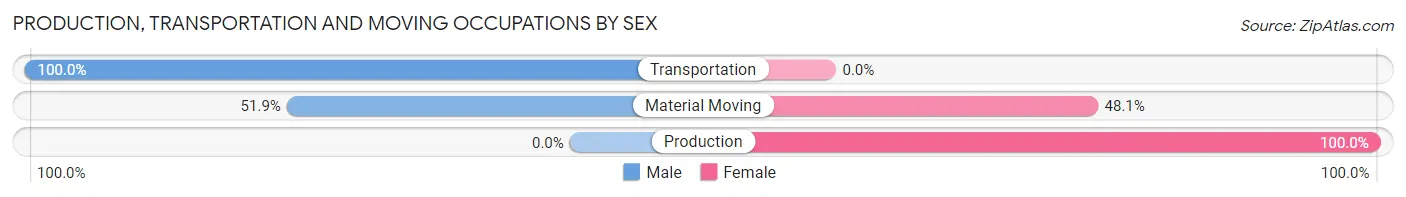
| Occupation | Male | Female |
| Production | 0 (0.0%) | 39 (100.0%) |
| Transportation | 31 (100.0%) | 0 (0.0%) |
| Material Moving | 27 (51.9%) | 25 (48.1%) |
| Total (Category) | 58 (47.5%) | 64 (52.5%) |
| Total (Overall) | 764 (50.4%) | 752 (49.6%) |
Employment Industries by Sex in Dennis Port
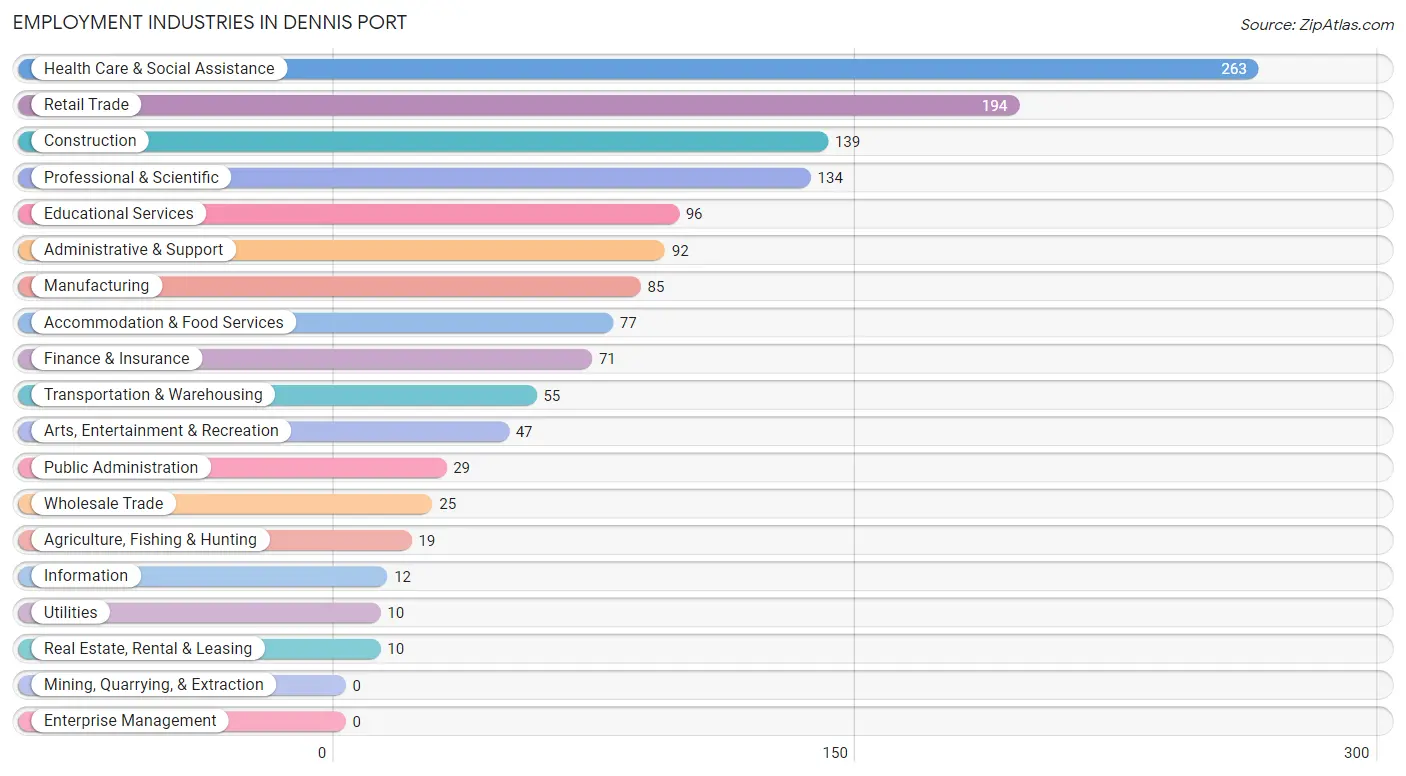
Employment Industries in Dennis Port
The major employment industries in Dennis Port include Health Care & Social Assistance (263 | 17.3%), Retail Trade (194 | 12.8%), Construction (139 | 9.2%), Professional & Scientific (134 | 8.8%), and Educational Services (96 | 6.3%).
Employment Industries by Sex in Dennis Port
The Dennis Port industries that see more men than women are Agriculture, Fishing & Hunting (100.0%), Information (100.0%), and Public Administration (100.0%), whereas the industries that tend to have a higher number of women are Wholesale Trade (100.0%), Utilities (100.0%), and Real Estate, Rental & Leasing (100.0%).
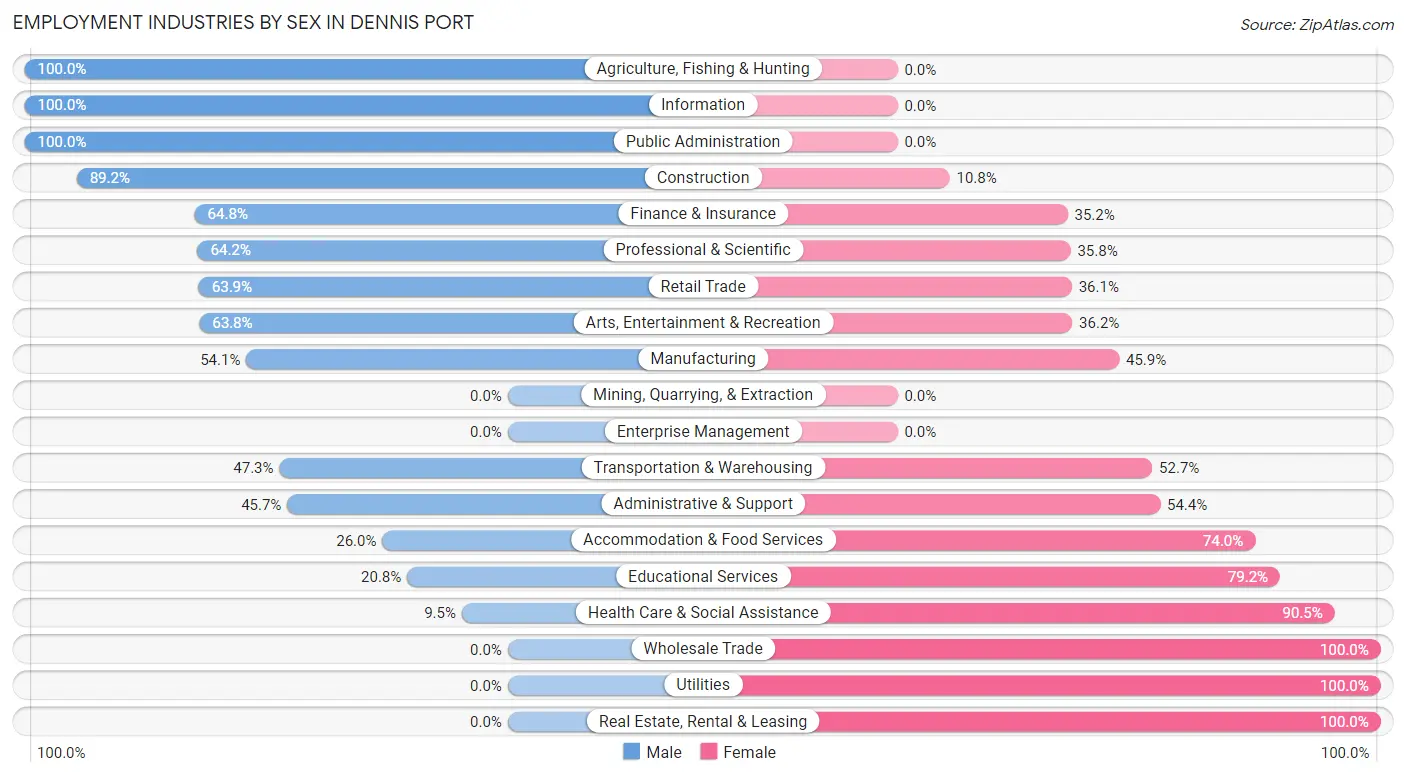
| Industry | Male | Female |
| Agriculture, Fishing & Hunting | 19 (100.0%) | 0 (0.0%) |
| Mining, Quarrying, & Extraction | 0 (0.0%) | 0 (0.0%) |
| Construction | 124 (89.2%) | 15 (10.8%) |
| Manufacturing | 46 (54.1%) | 39 (45.9%) |
| Wholesale Trade | 0 (0.0%) | 25 (100.0%) |
| Retail Trade | 124 (63.9%) | 70 (36.1%) |
| Transportation & Warehousing | 26 (47.3%) | 29 (52.7%) |
| Utilities | 0 (0.0%) | 10 (100.0%) |
| Information | 12 (100.0%) | 0 (0.0%) |
| Finance & Insurance | 46 (64.8%) | 25 (35.2%) |
| Real Estate, Rental & Leasing | 0 (0.0%) | 10 (100.0%) |
| Professional & Scientific | 86 (64.2%) | 48 (35.8%) |
| Enterprise Management | 0 (0.0%) | 0 (0.0%) |
| Administrative & Support | 42 (45.7%) | 50 (54.3%) |
| Educational Services | 20 (20.8%) | 76 (79.2%) |
| Health Care & Social Assistance | 25 (9.5%) | 238 (90.5%) |
| Arts, Entertainment & Recreation | 30 (63.8%) | 17 (36.2%) |
| Accommodation & Food Services | 20 (26.0%) | 57 (74.0%) |
| Public Administration | 29 (100.0%) | 0 (0.0%) |
| Total | 764 (50.4%) | 752 (49.6%) |
Education in Dennis Port
School Enrollment in Dennis Port
The most common levels of schooling among the 446 students in Dennis Port are college / undergraduate (146 | 32.7%), middle school (109 | 24.4%), and elementary school (55 | 12.3%).
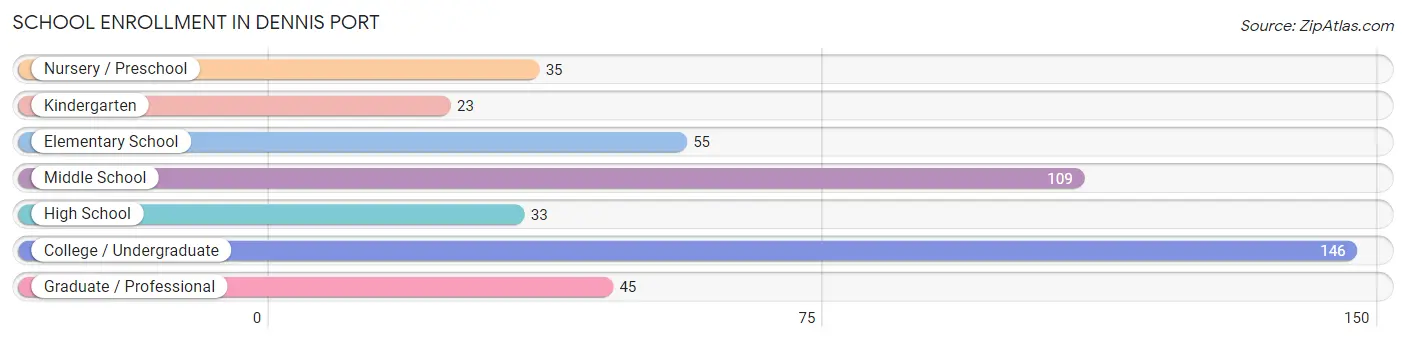
| School Level | # Students | % Students |
| Nursery / Preschool | 35 | 7.9% |
| Kindergarten | 23 | 5.2% |
| Elementary School | 55 | 12.3% |
| Middle School | 109 | 24.4% |
| High School | 33 | 7.4% |
| College / Undergraduate | 146 | 32.7% |
| Graduate / Professional | 45 | 10.1% |
| Total | 446 | 100.0% |
School Enrollment by Age by Funding Source in Dennis Port
Out of a total of 446 students who are enrolled in schools in Dennis Port, 213 (47.8%) attend a private institution, while the remaining 233 (52.2%) are enrolled in public schools. The age group of 35 years and over has the highest likelihood of being enrolled in private schools, with 67 (68.4% in the age bracket) enrolled. Conversely, the age group of 15 to 17 year olds has the lowest likelihood of being enrolled in a private school, with 33 (100.0% in the age bracket) attending a public institution.
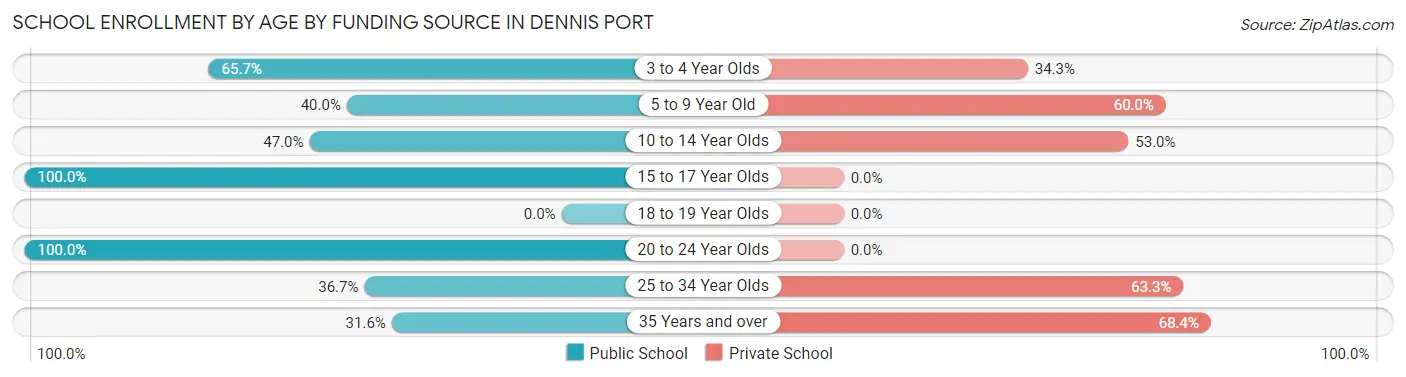
| Age Bracket | Public School | Private School |
| 3 to 4 Year Olds | 23 (65.7%) | 12 (34.3%) |
| 5 to 9 Year Old | 22 (40.0%) | 33 (60.0%) |
| 10 to 14 Year Olds | 62 (47.0%) | 70 (53.0%) |
| 15 to 17 Year Olds | 33 (100.0%) | 0 (0.0%) |
| 18 to 19 Year Olds | 0 (0.0%) | 0 (0.0%) |
| 20 to 24 Year Olds | 44 (100.0%) | 0 (0.0%) |
| 25 to 34 Year Olds | 18 (36.7%) | 31 (63.3%) |
| 35 Years and over | 31 (31.6%) | 67 (68.4%) |
| Total | 233 (52.2%) | 213 (47.8%) |
Educational Attainment by Field of Study in Dennis Port
Education (179 | 16.8%), social sciences (131 | 12.3%), computers & mathematics (113 | 10.6%), science & technology (101 | 9.5%), and visual & performing arts (85 | 8.0%) are the most common fields of study among 1,068 individuals in Dennis Port who have obtained a bachelor's degree or higher.
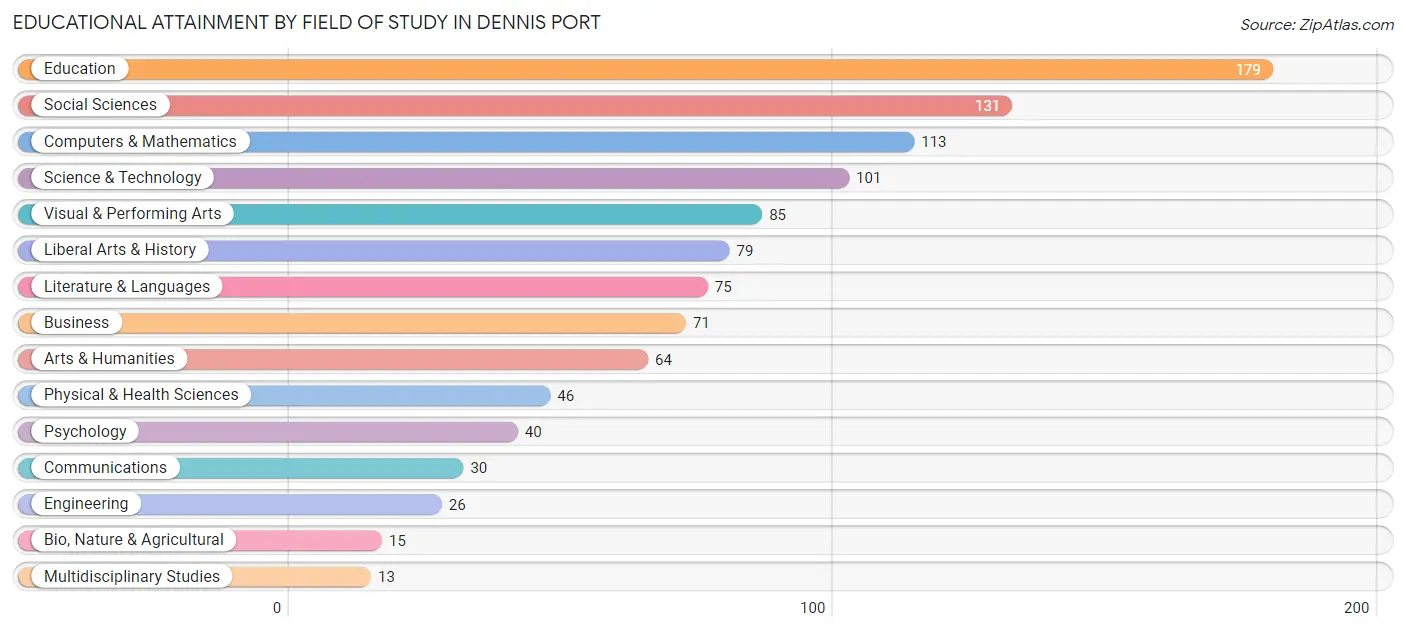
| Field of Study | # Graduates | % Graduates |
| Computers & Mathematics | 113 | 10.6% |
| Bio, Nature & Agricultural | 15 | 1.4% |
| Physical & Health Sciences | 46 | 4.3% |
| Psychology | 40 | 3.7% |
| Social Sciences | 131 | 12.3% |
| Engineering | 26 | 2.4% |
| Multidisciplinary Studies | 13 | 1.2% |
| Science & Technology | 101 | 9.5% |
| Business | 71 | 6.7% |
| Education | 179 | 16.8% |
| Literature & Languages | 75 | 7.0% |
| Liberal Arts & History | 79 | 7.4% |
| Visual & Performing Arts | 85 | 8.0% |
| Communications | 30 | 2.8% |
| Arts & Humanities | 64 | 6.0% |
| Total | 1,068 | 100.0% |
Transportation & Commute in Dennis Port
Vehicle Availability by Sex in Dennis Port
The most prevalent vehicle ownership categories in Dennis Port are males with 2 vehicles (389, accounting for 52.2%) and females with 2 vehicles (350, making up 52.6%).
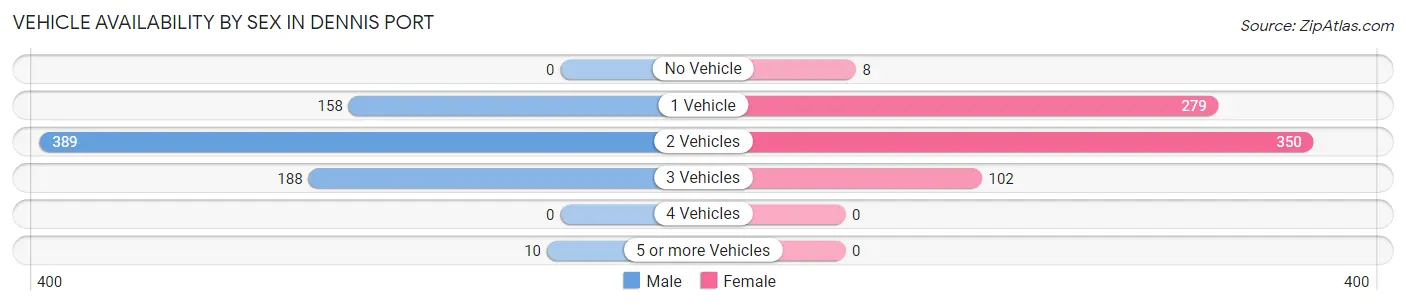
| Vehicles Available | Male | Female |
| No Vehicle | 0 (0.0%) | 8 (1.1%) |
| 1 Vehicle | 158 (21.2%) | 279 (37.8%) |
| 2 Vehicles | 389 (52.2%) | 350 (47.4%) |
| 3 Vehicles | 188 (25.2%) | 102 (13.8%) |
| 4 Vehicles | 0 (0.0%) | 0 (0.0%) |
| 5 or more Vehicles | 10 (1.3%) | 0 (0.0%) |
| Total | 745 (100.0%) | 739 (100.0%) |
Commute Time in Dennis Port
The most frequently occuring commute durations in Dennis Port are 15 to 19 minutes (265 commuters, 19.3%), 10 to 14 minutes (203 commuters, 14.8%), and 30 to 34 minutes (196 commuters, 14.3%).
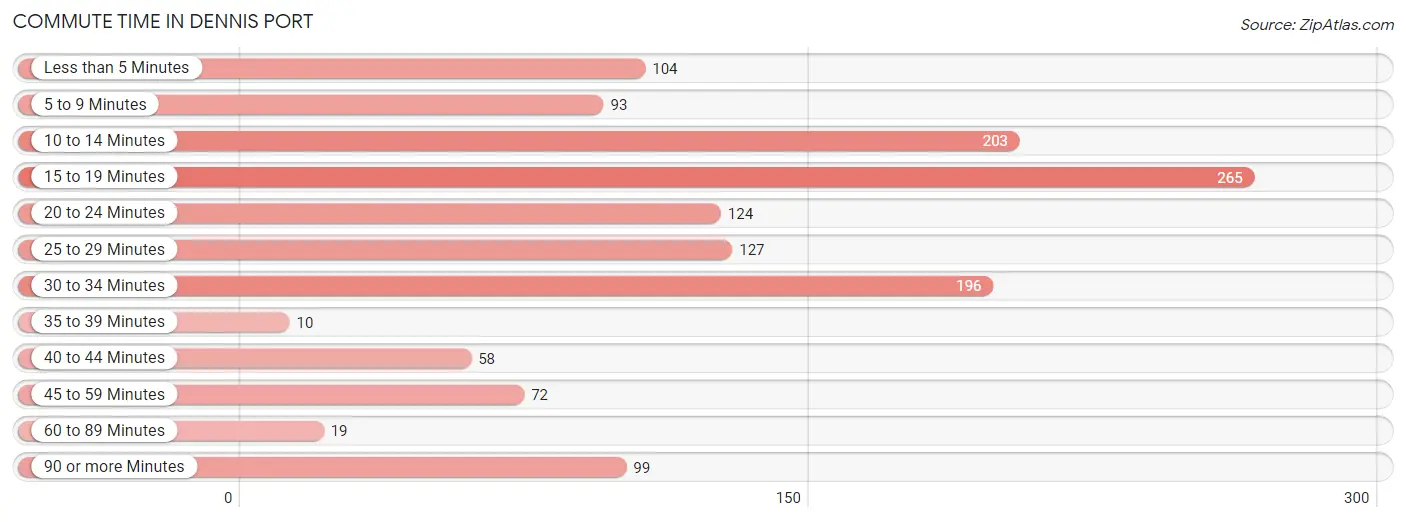
| Commute Time | # Commuters | % Commuters |
| Less than 5 Minutes | 104 | 7.6% |
| 5 to 9 Minutes | 93 | 6.8% |
| 10 to 14 Minutes | 203 | 14.8% |
| 15 to 19 Minutes | 265 | 19.3% |
| 20 to 24 Minutes | 124 | 9.0% |
| 25 to 29 Minutes | 127 | 9.3% |
| 30 to 34 Minutes | 196 | 14.3% |
| 35 to 39 Minutes | 10 | 0.7% |
| 40 to 44 Minutes | 58 | 4.2% |
| 45 to 59 Minutes | 72 | 5.3% |
| 60 to 89 Minutes | 19 | 1.4% |
| 90 or more Minutes | 99 | 7.2% |
Commute Time by Sex in Dennis Port
The most common commute times in Dennis Port are 15 to 19 minutes (131 commuters, 19.2%) for males and 15 to 19 minutes (134 commuters, 19.5%) for females.
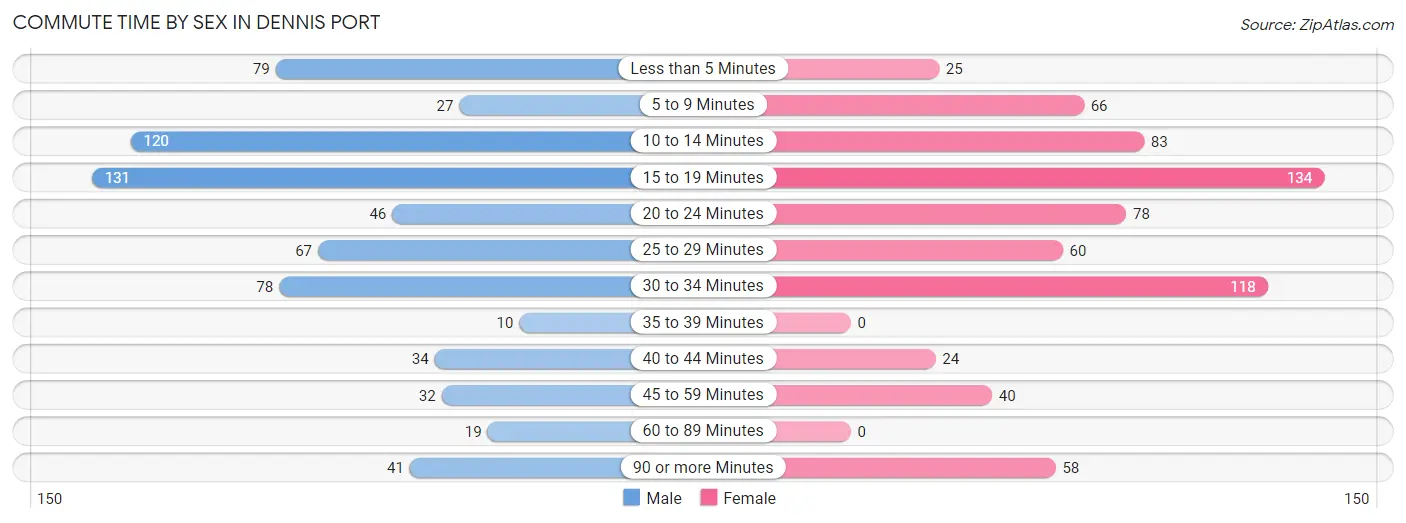
| Commute Time | Male | Female |
| Less than 5 Minutes | 79 (11.6%) | 25 (3.6%) |
| 5 to 9 Minutes | 27 (4.0%) | 66 (9.6%) |
| 10 to 14 Minutes | 120 (17.5%) | 83 (12.1%) |
| 15 to 19 Minutes | 131 (19.2%) | 134 (19.5%) |
| 20 to 24 Minutes | 46 (6.7%) | 78 (11.4%) |
| 25 to 29 Minutes | 67 (9.8%) | 60 (8.7%) |
| 30 to 34 Minutes | 78 (11.4%) | 118 (17.2%) |
| 35 to 39 Minutes | 10 (1.5%) | 0 (0.0%) |
| 40 to 44 Minutes | 34 (5.0%) | 24 (3.5%) |
| 45 to 59 Minutes | 32 (4.7%) | 40 (5.8%) |
| 60 to 89 Minutes | 19 (2.8%) | 0 (0.0%) |
| 90 or more Minutes | 41 (6.0%) | 58 (8.5%) |
Time of Departure to Work by Sex in Dennis Port
The most frequent times of departure to work in Dennis Port are 8:00 AM to 8:29 AM (127, 18.6%) for males and 8:00 AM to 8:29 AM (123, 17.9%) for females.
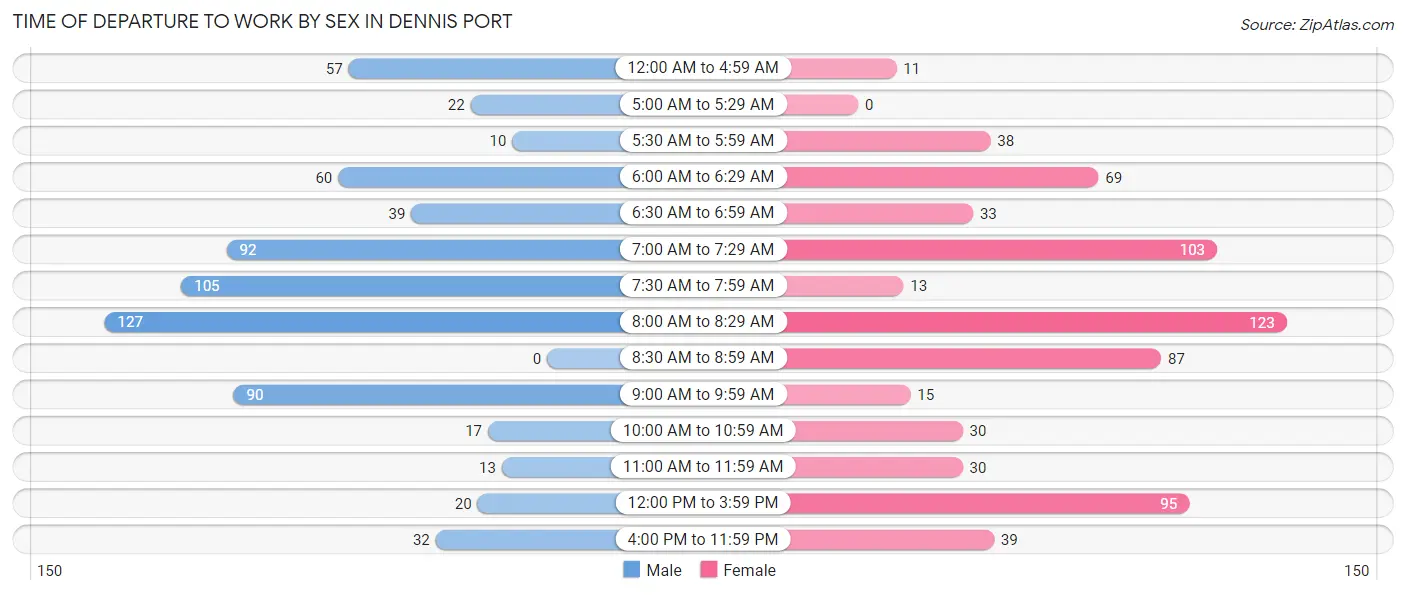
| Time of Departure | Male | Female |
| 12:00 AM to 4:59 AM | 57 (8.3%) | 11 (1.6%) |
| 5:00 AM to 5:29 AM | 22 (3.2%) | 0 (0.0%) |
| 5:30 AM to 5:59 AM | 10 (1.5%) | 38 (5.5%) |
| 6:00 AM to 6:29 AM | 60 (8.8%) | 69 (10.1%) |
| 6:30 AM to 6:59 AM | 39 (5.7%) | 33 (4.8%) |
| 7:00 AM to 7:29 AM | 92 (13.5%) | 103 (15.0%) |
| 7:30 AM to 7:59 AM | 105 (15.3%) | 13 (1.9%) |
| 8:00 AM to 8:29 AM | 127 (18.6%) | 123 (17.9%) |
| 8:30 AM to 8:59 AM | 0 (0.0%) | 87 (12.7%) |
| 9:00 AM to 9:59 AM | 90 (13.2%) | 15 (2.2%) |
| 10:00 AM to 10:59 AM | 17 (2.5%) | 30 (4.4%) |
| 11:00 AM to 11:59 AM | 13 (1.9%) | 30 (4.4%) |
| 12:00 PM to 3:59 PM | 20 (2.9%) | 95 (13.9%) |
| 4:00 PM to 11:59 PM | 32 (4.7%) | 39 (5.7%) |
| Total | 684 (100.0%) | 686 (100.0%) |
Housing Occupancy in Dennis Port
Occupancy by Ownership in Dennis Port
Of the total 1,699 dwellings in Dennis Port, owner-occupied units account for 1,172 (69.0%), while renter-occupied units make up 527 (31.0%).
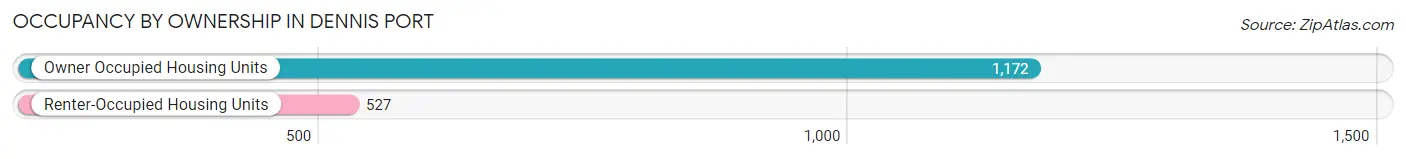
| Occupancy | # Housing Units | % Housing Units |
| Owner Occupied Housing Units | 1,172 | 69.0% |
| Renter-Occupied Housing Units | 527 | 31.0% |
| Total Occupied Housing Units | 1,699 | 100.0% |
Occupancy by Household Size in Dennis Port
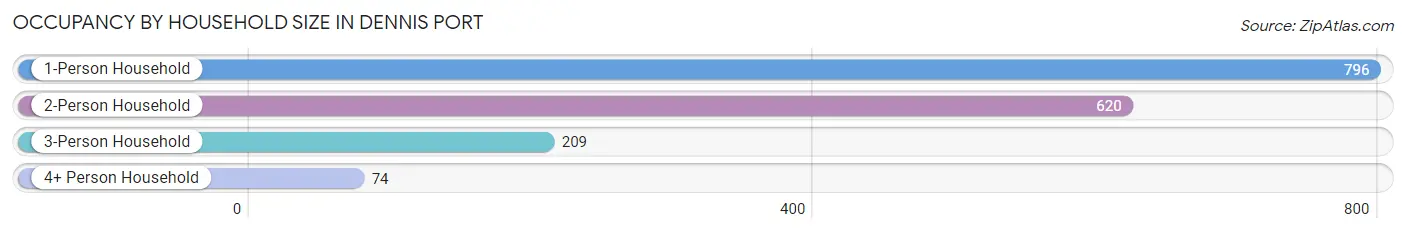
| Household Size | # Housing Units | % Housing Units |
| 1-Person Household | 796 | 46.9% |
| 2-Person Household | 620 | 36.5% |
| 3-Person Household | 209 | 12.3% |
| 4+ Person Household | 74 | 4.4% |
| Total Housing Units | 1,699 | 100.0% |
Occupancy by Ownership by Household Size in Dennis Port
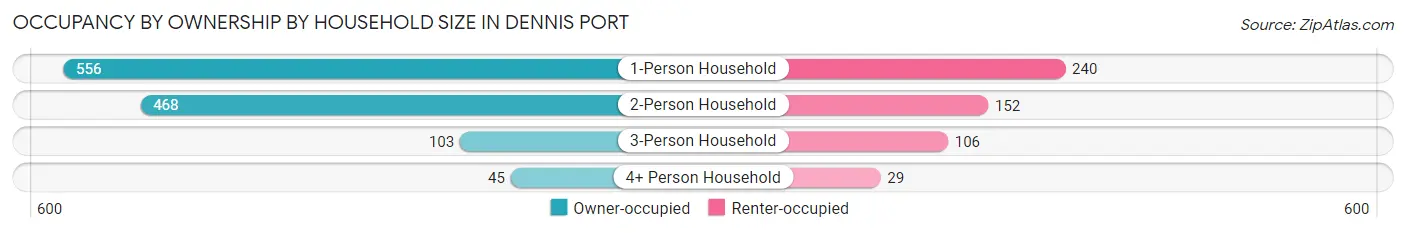
| Household Size | Owner-occupied | Renter-occupied |
| 1-Person Household | 556 (69.9%) | 240 (30.1%) |
| 2-Person Household | 468 (75.5%) | 152 (24.5%) |
| 3-Person Household | 103 (49.3%) | 106 (50.7%) |
| 4+ Person Household | 45 (60.8%) | 29 (39.2%) |
| Total Housing Units | 1,172 (69.0%) | 527 (31.0%) |
Occupancy by Educational Attainment in Dennis Port
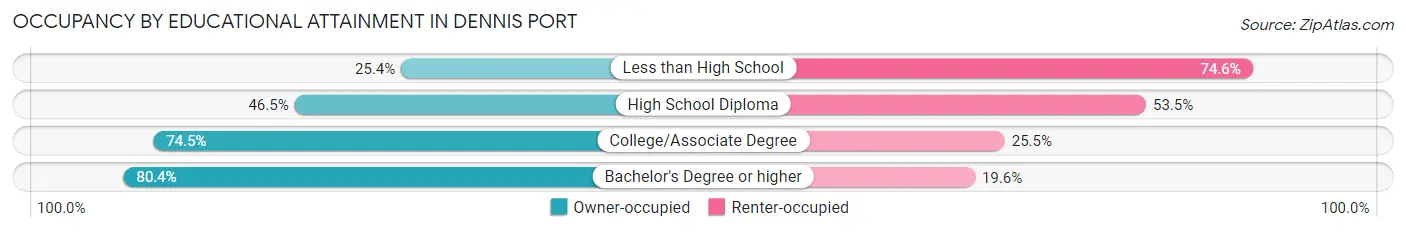
| Household Size | Owner-occupied | Renter-occupied |
| Less than High School | 17 (25.4%) | 50 (74.6%) |
| High School Diploma | 159 (46.5%) | 183 (53.5%) |
| College/Associate Degree | 520 (74.5%) | 178 (25.5%) |
| Bachelor's Degree or higher | 476 (80.4%) | 116 (19.6%) |
Occupancy by Age of Householder in Dennis Port
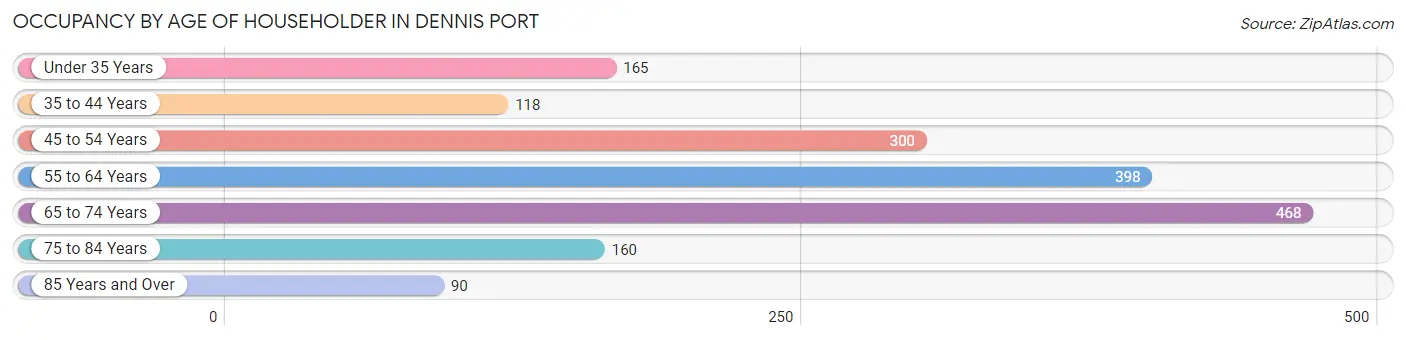
| Age Bracket | # Households | % Households |
| Under 35 Years | 165 | 9.7% |
| 35 to 44 Years | 118 | 7.0% |
| 45 to 54 Years | 300 | 17.7% |
| 55 to 64 Years | 398 | 23.4% |
| 65 to 74 Years | 468 | 27.6% |
| 75 to 84 Years | 160 | 9.4% |
| 85 Years and Over | 90 | 5.3% |
| Total | 1,699 | 100.0% |
Housing Finances in Dennis Port
Median Income by Occupancy in Dennis Port
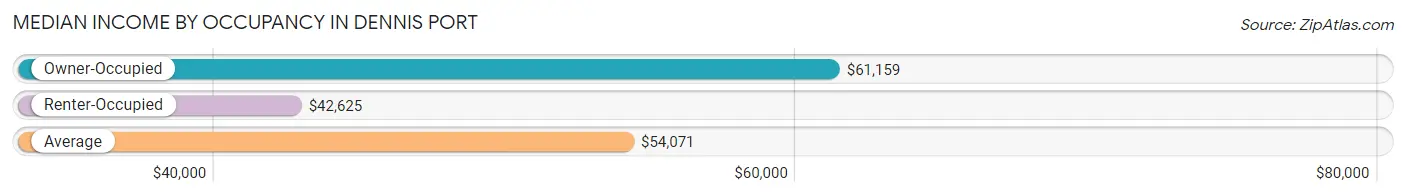
| Occupancy Type | # Households | Median Income |
| Owner-Occupied | 1,172 (69.0%) | $61,159 |
| Renter-Occupied | 527 (31.0%) | $42,625 |
| Average | 1,699 (100.0%) | $54,071 |
Occupancy by Householder Income Bracket in Dennis Port
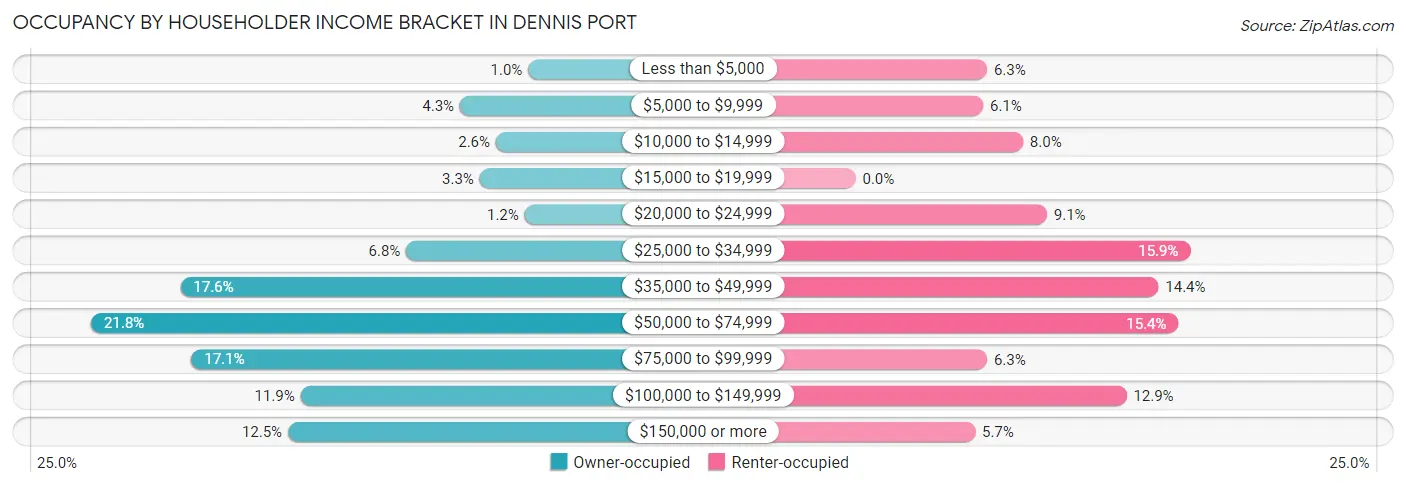
| Income Bracket | Owner-occupied | Renter-occupied |
| Less than $5,000 | 12 (1.0%) | 33 (6.3%) |
| $5,000 to $9,999 | 50 (4.3%) | 32 (6.1%) |
| $10,000 to $14,999 | 30 (2.6%) | 42 (8.0%) |
| $15,000 to $19,999 | 39 (3.3%) | 0 (0.0%) |
| $20,000 to $24,999 | 14 (1.2%) | 48 (9.1%) |
| $25,000 to $34,999 | 80 (6.8%) | 84 (15.9%) |
| $35,000 to $49,999 | 206 (17.6%) | 76 (14.4%) |
| $50,000 to $74,999 | 256 (21.8%) | 81 (15.4%) |
| $75,000 to $99,999 | 200 (17.1%) | 33 (6.3%) |
| $100,000 to $149,999 | 139 (11.9%) | 68 (12.9%) |
| $150,000 or more | 146 (12.5%) | 30 (5.7%) |
| Total | 1,172 (100.0%) | 527 (100.0%) |
Monthly Housing Cost Tiers in Dennis Port
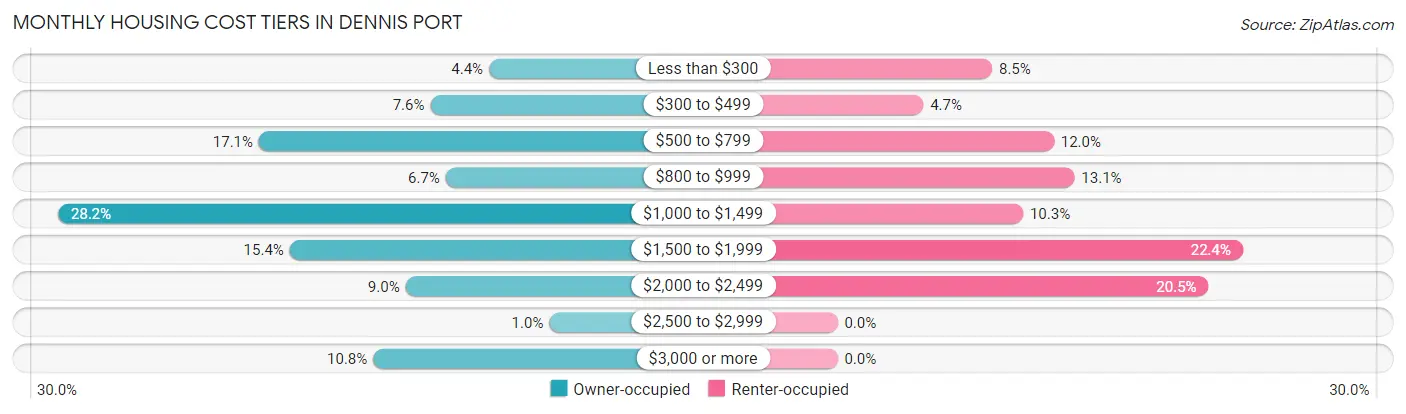
| Monthly Cost | Owner-occupied | Renter-occupied |
| Less than $300 | 51 (4.3%) | 45 (8.5%) |
| $300 to $499 | 89 (7.6%) | 25 (4.7%) |
| $500 to $799 | 200 (17.1%) | 63 (11.9%) |
| $800 to $999 | 79 (6.7%) | 69 (13.1%) |
| $1,000 to $1,499 | 330 (28.2%) | 54 (10.2%) |
| $1,500 to $1,999 | 180 (15.4%) | 118 (22.4%) |
| $2,000 to $2,499 | 105 (9.0%) | 108 (20.5%) |
| $2,500 to $2,999 | 12 (1.0%) | 0 (0.0%) |
| $3,000 or more | 126 (10.7%) | 0 (0.0%) |
| Total | 1,172 (100.0%) | 527 (100.0%) |
Physical Housing Characteristics in Dennis Port
Housing Structures in Dennis Port
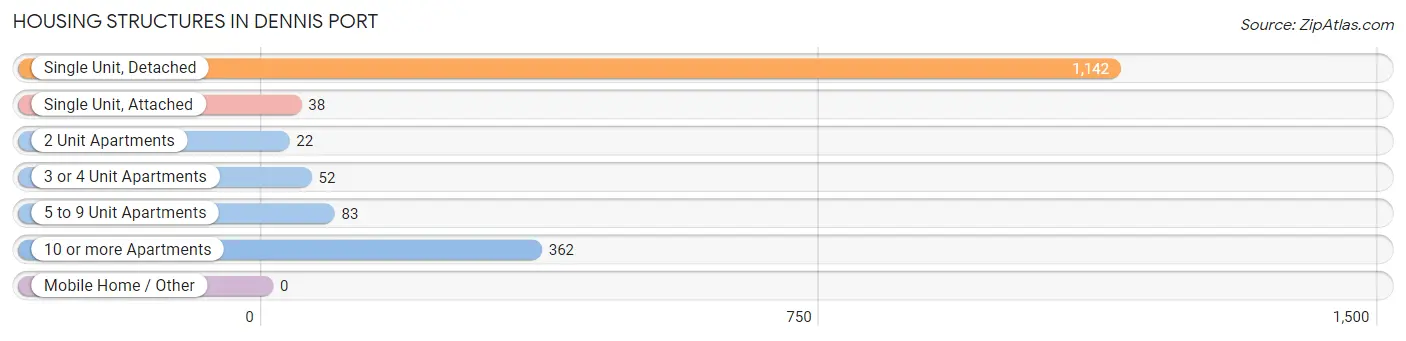
| Structure Type | # Housing Units | % Housing Units |
| Single Unit, Detached | 1,142 | 67.2% |
| Single Unit, Attached | 38 | 2.2% |
| 2 Unit Apartments | 22 | 1.3% |
| 3 or 4 Unit Apartments | 52 | 3.1% |
| 5 to 9 Unit Apartments | 83 | 4.9% |
| 10 or more Apartments | 362 | 21.3% |
| Mobile Home / Other | 0 | 0.0% |
| Total | 1,699 | 100.0% |
Housing Structures by Occupancy in Dennis Port
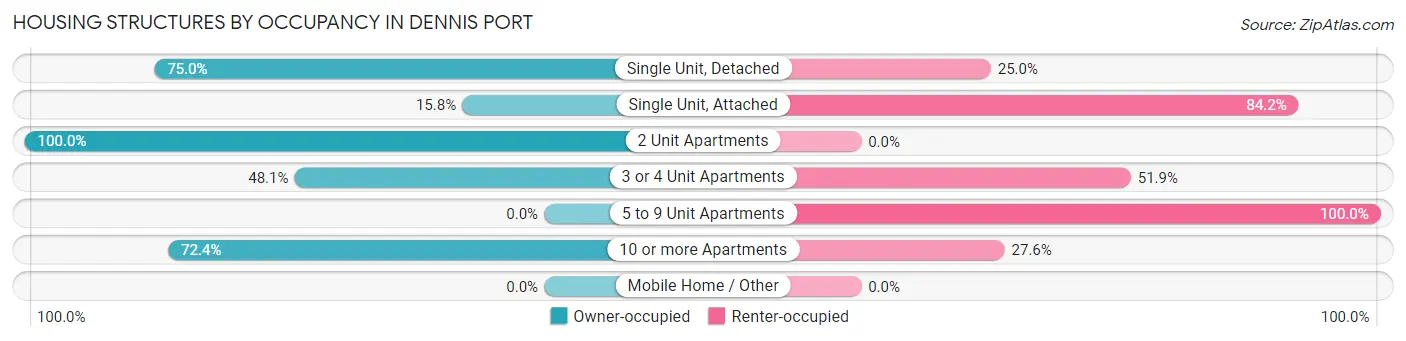
| Structure Type | Owner-occupied | Renter-occupied |
| Single Unit, Detached | 857 (75.0%) | 285 (25.0%) |
| Single Unit, Attached | 6 (15.8%) | 32 (84.2%) |
| 2 Unit Apartments | 22 (100.0%) | 0 (0.0%) |
| 3 or 4 Unit Apartments | 25 (48.1%) | 27 (51.9%) |
| 5 to 9 Unit Apartments | 0 (0.0%) | 83 (100.0%) |
| 10 or more Apartments | 262 (72.4%) | 100 (27.6%) |
| Mobile Home / Other | 0 (0.0%) | 0 (0.0%) |
| Total | 1,172 (69.0%) | 527 (31.0%) |
Housing Structures by Number of Rooms in Dennis Port
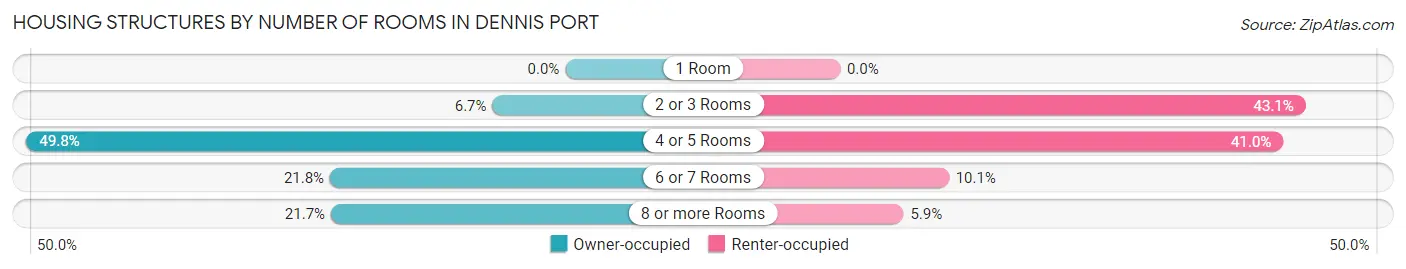
| Number of Rooms | Owner-occupied | Renter-occupied |
| 1 Room | 0 (0.0%) | 0 (0.0%) |
| 2 or 3 Rooms | 79 (6.7%) | 227 (43.1%) |
| 4 or 5 Rooms | 584 (49.8%) | 216 (41.0%) |
| 6 or 7 Rooms | 255 (21.8%) | 53 (10.1%) |
| 8 or more Rooms | 254 (21.7%) | 31 (5.9%) |
| Total | 1,172 (100.0%) | 527 (100.0%) |
Housing Structure by Heating Type in Dennis Port
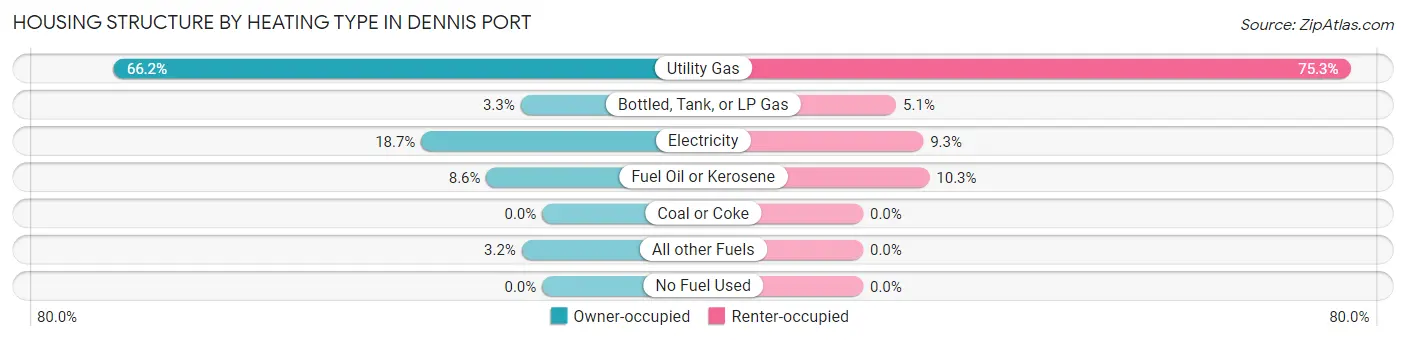
| Heating Type | Owner-occupied | Renter-occupied |
| Utility Gas | 776 (66.2%) | 397 (75.3%) |
| Bottled, Tank, or LP Gas | 39 (3.3%) | 27 (5.1%) |
| Electricity | 219 (18.7%) | 49 (9.3%) |
| Fuel Oil or Kerosene | 101 (8.6%) | 54 (10.2%) |
| Coal or Coke | 0 (0.0%) | 0 (0.0%) |
| All other Fuels | 37 (3.2%) | 0 (0.0%) |
| No Fuel Used | 0 (0.0%) | 0 (0.0%) |
| Total | 1,172 (100.0%) | 527 (100.0%) |
Household Vehicle Usage in Dennis Port
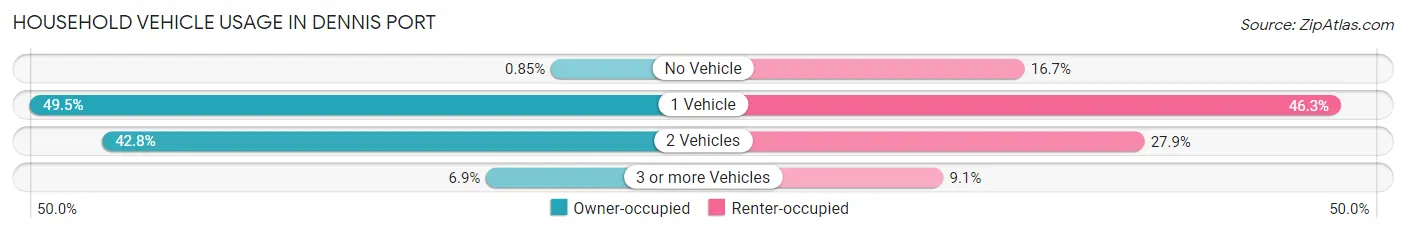
| Vehicles per Household | Owner-occupied | Renter-occupied |
| No Vehicle | 10 (0.9%) | 88 (16.7%) |
| 1 Vehicle | 580 (49.5%) | 244 (46.3%) |
| 2 Vehicles | 501 (42.7%) | 147 (27.9%) |
| 3 or more Vehicles | 81 (6.9%) | 48 (9.1%) |
| Total | 1,172 (100.0%) | 527 (100.0%) |
Real Estate & Mortgages in Dennis Port
Real Estate and Mortgage Overview in Dennis Port
| Characteristic | Without Mortgage | With Mortgage |
| Housing Units | 440 | 732 |
| Median Property Value | $494,300 | $350,400 |
| Median Household Income | $79,000 | $103 |
| Monthly Housing Costs | $609 | $126 |
| Real Estate Taxes | $2,256 | $13 |
Property Value by Mortgage Status in Dennis Port
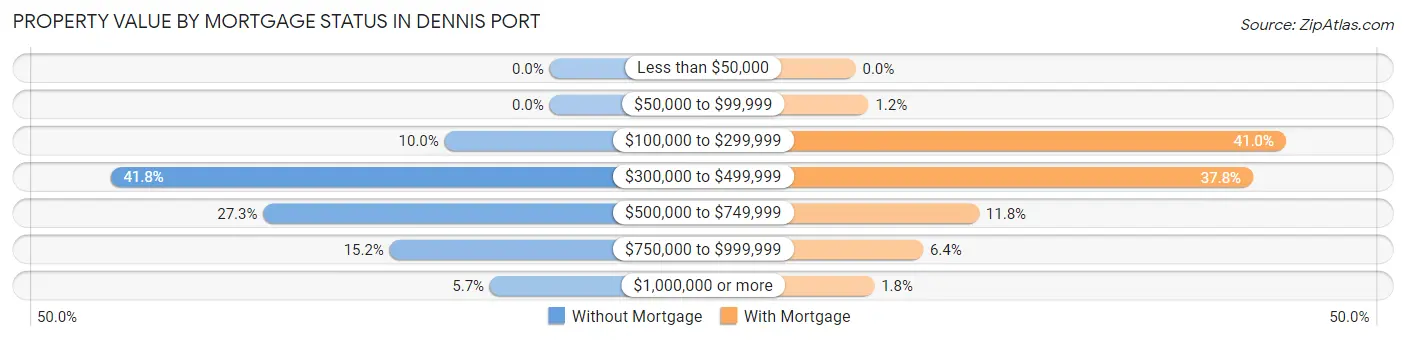
| Property Value | Without Mortgage | With Mortgage |
| Less than $50,000 | 0 (0.0%) | 0 (0.0%) |
| $50,000 to $99,999 | 0 (0.0%) | 9 (1.2%) |
| $100,000 to $299,999 | 44 (10.0%) | 300 (41.0%) |
| $300,000 to $499,999 | 184 (41.8%) | 277 (37.8%) |
| $500,000 to $749,999 | 120 (27.3%) | 86 (11.7%) |
| $750,000 to $999,999 | 67 (15.2%) | 47 (6.4%) |
| $1,000,000 or more | 25 (5.7%) | 13 (1.8%) |
| Total | 440 (100.0%) | 732 (100.0%) |
Household Income by Mortgage Status in Dennis Port
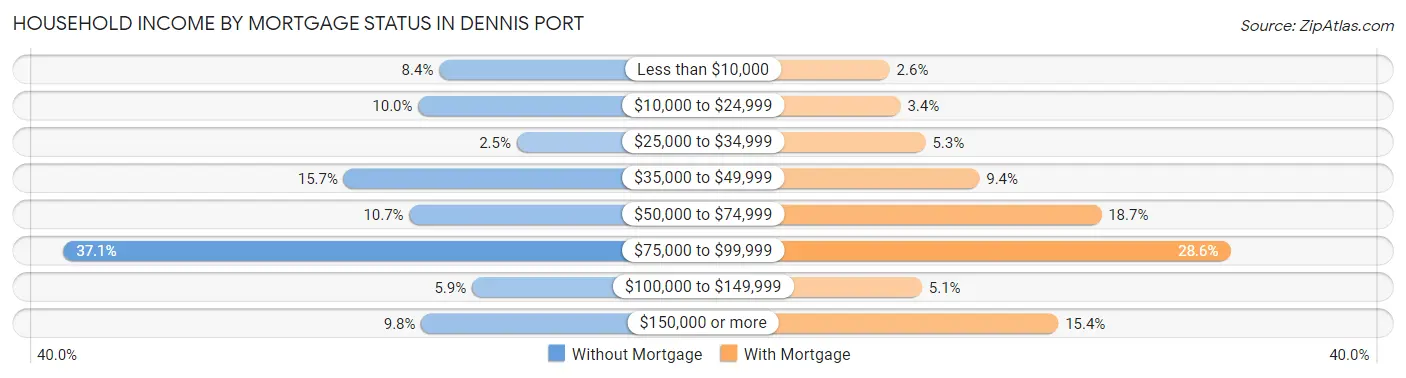
| Household Income | Without Mortgage | With Mortgage |
| Less than $10,000 | 37 (8.4%) | 19 (2.6%) |
| $10,000 to $24,999 | 44 (10.0%) | 25 (3.4%) |
| $25,000 to $34,999 | 11 (2.5%) | 39 (5.3%) |
| $35,000 to $49,999 | 69 (15.7%) | 69 (9.4%) |
| $50,000 to $74,999 | 47 (10.7%) | 137 (18.7%) |
| $75,000 to $99,999 | 163 (37.0%) | 209 (28.5%) |
| $100,000 to $149,999 | 26 (5.9%) | 37 (5.1%) |
| $150,000 or more | 43 (9.8%) | 113 (15.4%) |
| Total | 440 (100.0%) | 732 (100.0%) |
Property Value to Household Income Ratio in Dennis Port
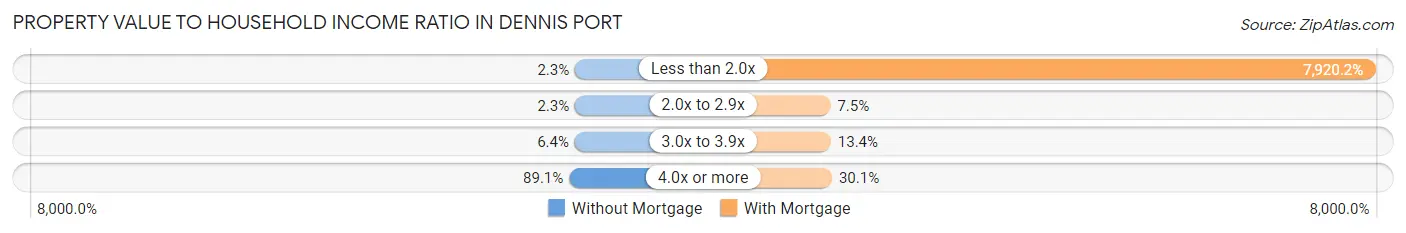
| Value-to-Income Ratio | Without Mortgage | With Mortgage |
| Less than 2.0x | 10 (2.3%) | 57,976 (7,920.2%) |
| 2.0x to 2.9x | 10 (2.3%) | 55 (7.5%) |
| 3.0x to 3.9x | 28 (6.4%) | 98 (13.4%) |
| 4.0x or more | 392 (89.1%) | 220 (30.0%) |
| Total | 440 (100.0%) | 732 (100.0%) |
Real Estate Taxes by Mortgage Status in Dennis Port
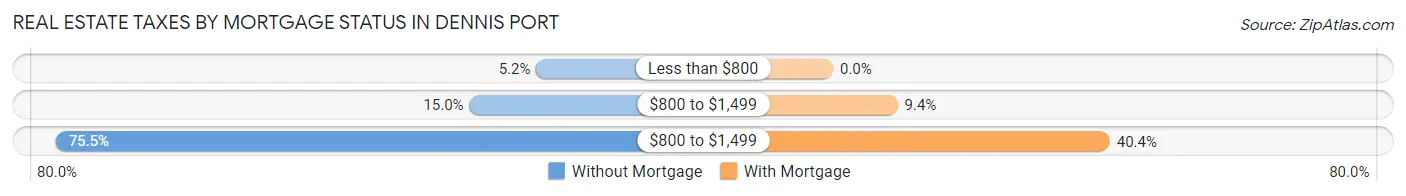
| Property Taxes | Without Mortgage | With Mortgage |
| Less than $800 | 23 (5.2%) | 0 (0.0%) |
| $800 to $1,499 | 66 (15.0%) | 69 (9.4%) |
| $800 to $1,499 | 332 (75.4%) | 296 (40.4%) |
| Total | 440 (100.0%) | 732 (100.0%) |
Health & Disability in Dennis Port
Health Insurance Coverage by Age in Dennis Port
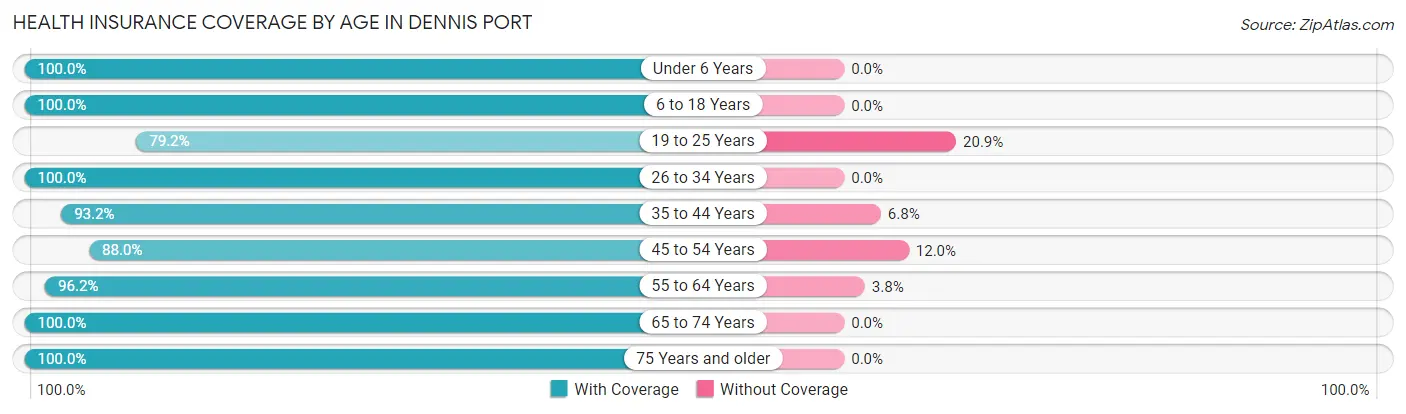
| Age Bracket | With Coverage | Without Coverage |
| Under 6 Years | 124 (100.0%) | 0 (0.0%) |
| 6 to 18 Years | 259 (100.0%) | 0 (0.0%) |
| 19 to 25 Years | 167 (79.1%) | 44 (20.8%) |
| 26 to 34 Years | 316 (100.0%) | 0 (0.0%) |
| 35 to 44 Years | 191 (93.2%) | 14 (6.8%) |
| 45 to 54 Years | 409 (88.0%) | 56 (12.0%) |
| 55 to 64 Years | 726 (96.2%) | 29 (3.8%) |
| 65 to 74 Years | 610 (100.0%) | 0 (0.0%) |
| 75 Years and older | 355 (100.0%) | 0 (0.0%) |
| Total | 3,157 (95.7%) | 143 (4.3%) |
Health Insurance Coverage by Citizenship Status in Dennis Port
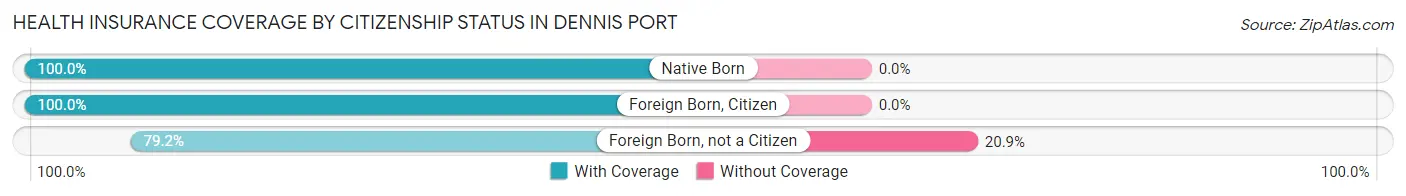
| Citizenship Status | With Coverage | Without Coverage |
| Native Born | 124 (100.0%) | 0 (0.0%) |
| Foreign Born, Citizen | 259 (100.0%) | 0 (0.0%) |
| Foreign Born, not a Citizen | 167 (79.1%) | 44 (20.8%) |
Health Insurance Coverage by Household Income in Dennis Port
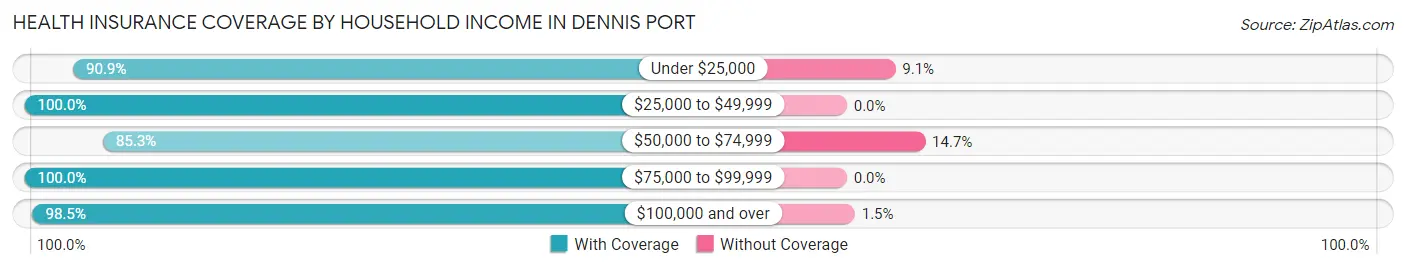
| Household Income | With Coverage | Without Coverage |
| Under $25,000 | 440 (90.9%) | 44 (9.1%) |
| $25,000 to $49,999 | 859 (100.0%) | 0 (0.0%) |
| $50,000 to $74,999 | 494 (85.3%) | 85 (14.7%) |
| $75,000 to $99,999 | 435 (100.0%) | 0 (0.0%) |
| $100,000 and over | 917 (98.5%) | 14 (1.5%) |
Public vs Private Health Insurance Coverage by Age in Dennis Port
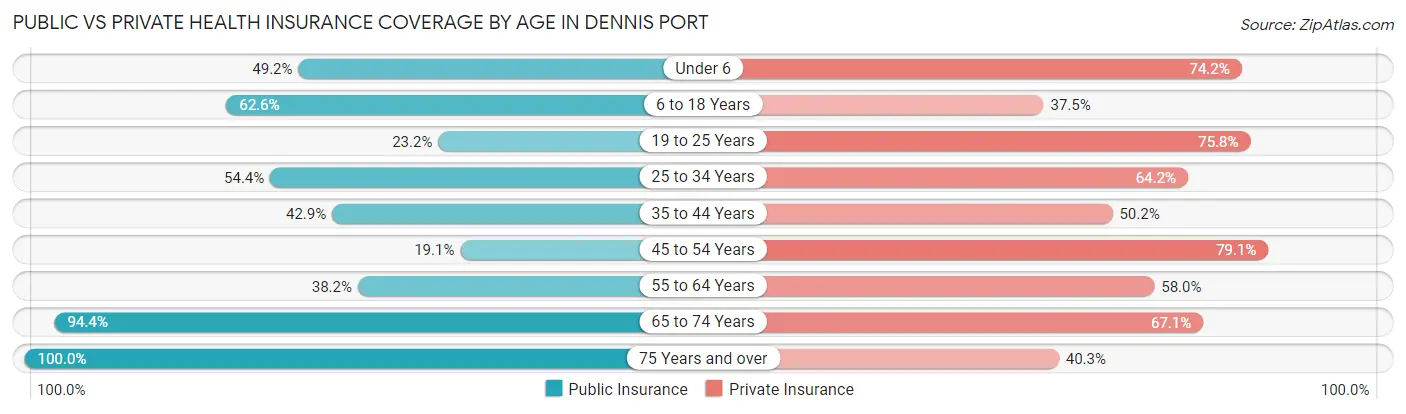
| Age Bracket | Public Insurance | Private Insurance |
| Under 6 | 61 (49.2%) | 92 (74.2%) |
| 6 to 18 Years | 162 (62.5%) | 97 (37.4%) |
| 19 to 25 Years | 49 (23.2%) | 160 (75.8%) |
| 25 to 34 Years | 172 (54.4%) | 203 (64.2%) |
| 35 to 44 Years | 88 (42.9%) | 103 (50.2%) |
| 45 to 54 Years | 89 (19.1%) | 368 (79.1%) |
| 55 to 64 Years | 288 (38.2%) | 438 (58.0%) |
| 65 to 74 Years | 576 (94.4%) | 409 (67.0%) |
| 75 Years and over | 355 (100.0%) | 143 (40.3%) |
| Total | 1,840 (55.8%) | 2,013 (61.0%) |
Disability Status by Sex by Age in Dennis Port
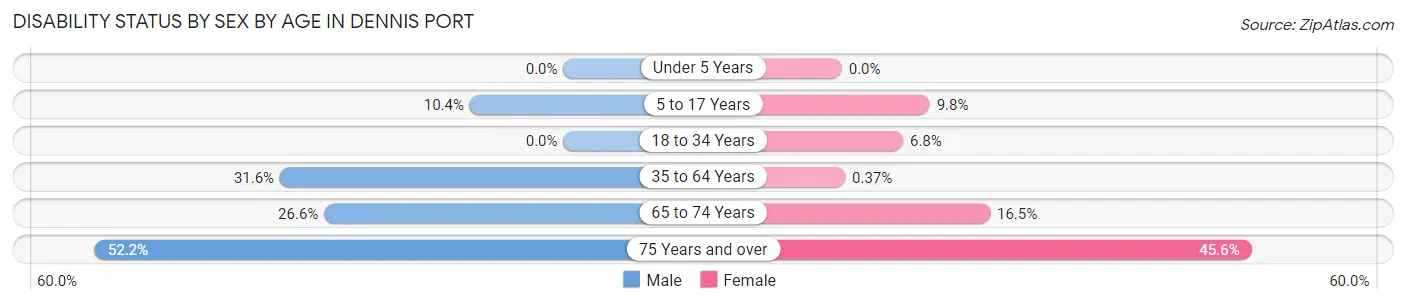
| Age Bracket | Male | Female |
| Under 5 Years | 0 (0.0%) | 0 (0.0%) |
| 5 to 17 Years | 10 (10.4%) | 14 (9.8%) |
| 18 to 34 Years | 0 (0.0%) | 15 (6.8%) |
| 35 to 64 Years | 279 (31.6%) | 2 (0.4%) |
| 65 to 74 Years | 77 (26.6%) | 53 (16.5%) |
| 75 Years and over | 72 (52.2%) | 99 (45.6%) |
Disability Class by Sex by Age in Dennis Port
Disability Class: Hearing Difficulty
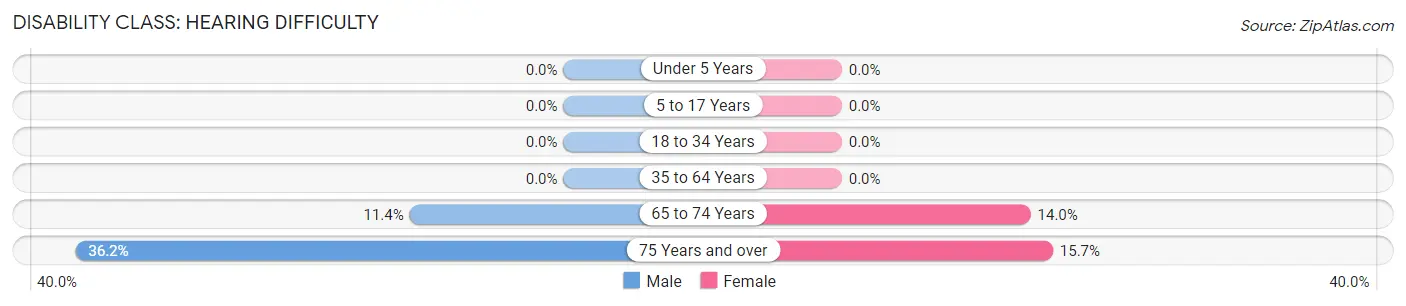
| Age Bracket | Male | Female |
| Under 5 Years | 0 (0.0%) | 0 (0.0%) |
| 5 to 17 Years | 0 (0.0%) | 0 (0.0%) |
| 18 to 34 Years | 0 (0.0%) | 0 (0.0%) |
| 35 to 64 Years | 0 (0.0%) | 0 (0.0%) |
| 65 to 74 Years | 33 (11.4%) | 45 (14.0%) |
| 75 Years and over | 50 (36.2%) | 34 (15.7%) |
Disability Class: Vision Difficulty
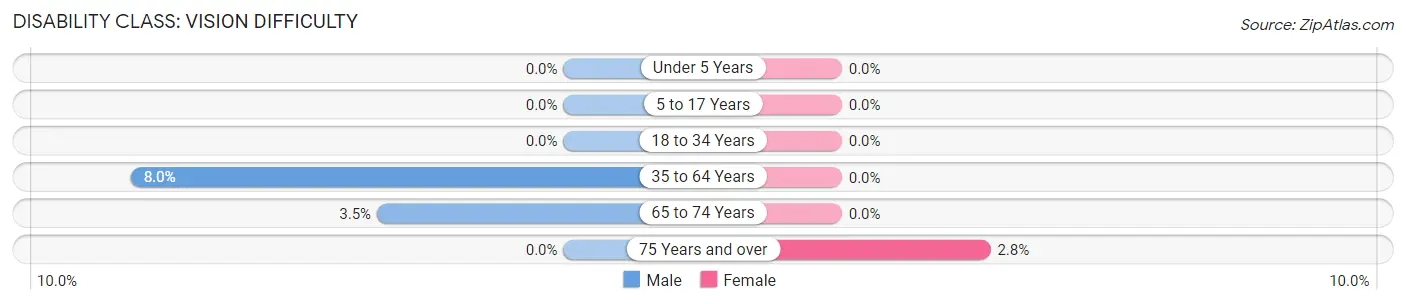
| Age Bracket | Male | Female |
| Under 5 Years | 0 (0.0%) | 0 (0.0%) |
| 5 to 17 Years | 0 (0.0%) | 0 (0.0%) |
| 18 to 34 Years | 0 (0.0%) | 0 (0.0%) |
| 35 to 64 Years | 71 (8.0%) | 0 (0.0%) |
| 65 to 74 Years | 10 (3.5%) | 0 (0.0%) |
| 75 Years and over | 0 (0.0%) | 6 (2.8%) |
Disability Class: Cognitive Difficulty
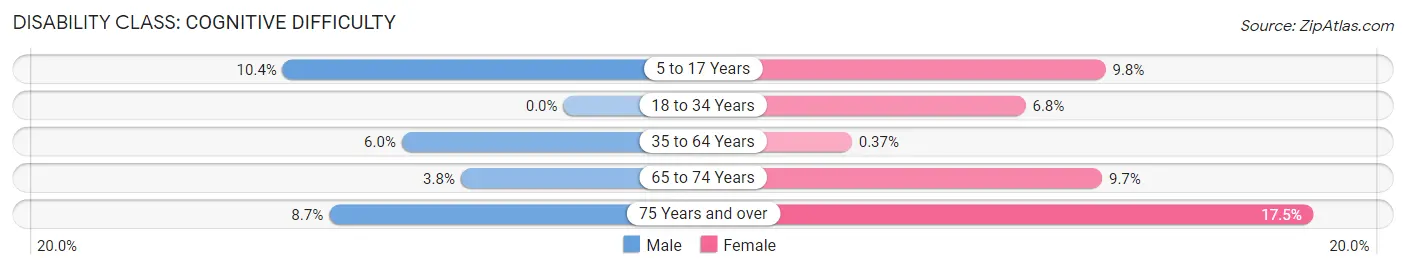
| Age Bracket | Male | Female |
| 5 to 17 Years | 10 (10.4%) | 14 (9.8%) |
| 18 to 34 Years | 0 (0.0%) | 15 (6.8%) |
| 35 to 64 Years | 53 (6.0%) | 2 (0.4%) |
| 65 to 74 Years | 11 (3.8%) | 31 (9.7%) |
| 75 Years and over | 12 (8.7%) | 38 (17.5%) |
Disability Class: Ambulatory Difficulty
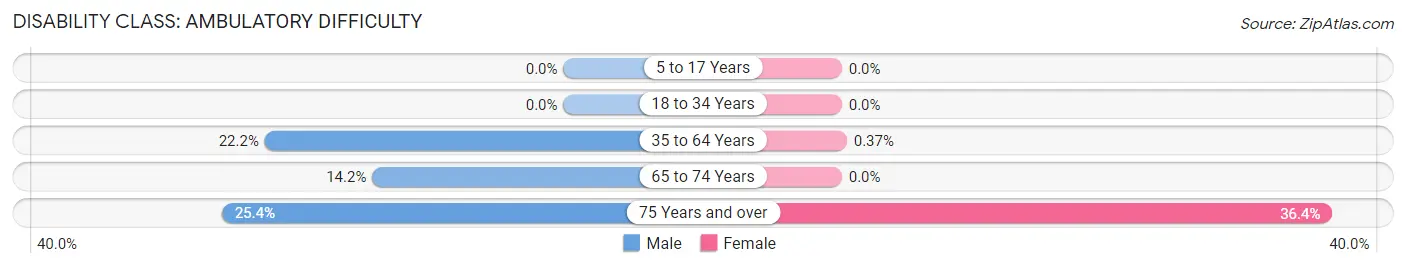
| Age Bracket | Male | Female |
| 5 to 17 Years | 0 (0.0%) | 0 (0.0%) |
| 18 to 34 Years | 0 (0.0%) | 0 (0.0%) |
| 35 to 64 Years | 196 (22.2%) | 2 (0.4%) |
| 65 to 74 Years | 41 (14.2%) | 0 (0.0%) |
| 75 Years and over | 35 (25.4%) | 79 (36.4%) |
Disability Class: Self-Care Difficulty
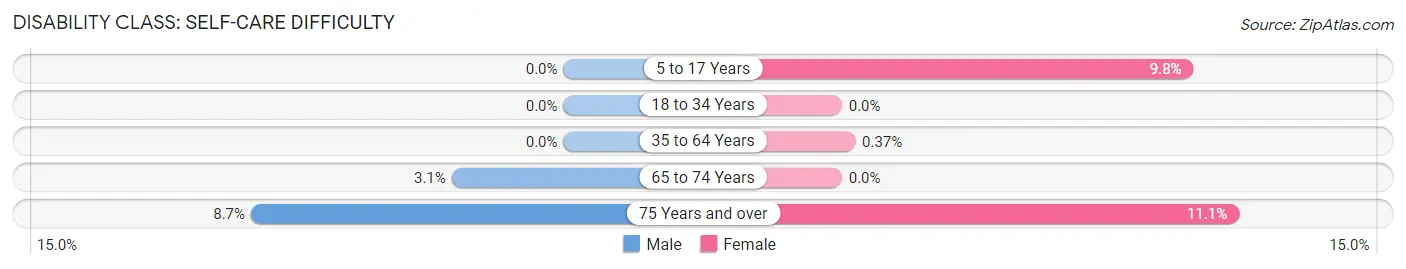
| Age Bracket | Male | Female |
| 5 to 17 Years | 0 (0.0%) | 14 (9.8%) |
| 18 to 34 Years | 0 (0.0%) | 0 (0.0%) |
| 35 to 64 Years | 0 (0.0%) | 2 (0.4%) |
| 65 to 74 Years | 9 (3.1%) | 0 (0.0%) |
| 75 Years and over | 12 (8.7%) | 24 (11.1%) |
Technology Access in Dennis Port
Computing Device Access in Dennis Port
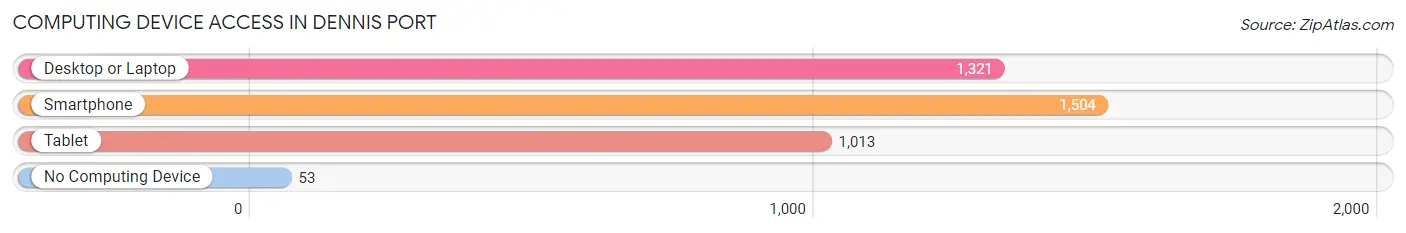
| Device Type | # Households | % Households |
| Desktop or Laptop | 1,321 | 77.7% |
| Smartphone | 1,504 | 88.5% |
| Tablet | 1,013 | 59.6% |
| No Computing Device | 53 | 3.1% |
| Total | 1,699 | 100.0% |
Internet Access in Dennis Port
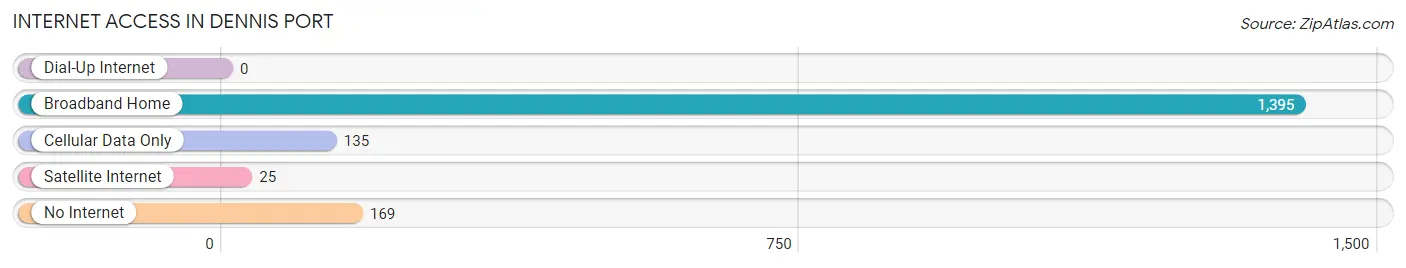
| Internet Type | # Households | % Households |
| Dial-Up Internet | 0 | 0.0% |
| Broadband Home | 1,395 | 82.1% |
| Cellular Data Only | 135 | 8.0% |
| Satellite Internet | 25 | 1.5% |
| No Internet | 169 | 10.0% |
| Total | 1,699 | 100.0% |
Dennis Port Summary
Dennis Port is a small village located in the town of Dennis, Massachusetts, on the south side of Cape Cod. It is a popular summer destination for tourists and locals alike, and is known for its beautiful beaches, quaint shops, and seafood restaurants.
Geography
Dennis Port is located in the southeastern corner of the town of Dennis, Massachusetts, on the south side of Cape Cod. It is bordered by the towns of Harwich to the north, Yarmouth to the east, and Brewster to the south. The village is situated on a peninsula that juts out into Nantucket Sound, and is surrounded by several small islands, including Great Island, Little Island, and the Bass River Islands. The village is approximately 4.5 miles from the town of Dennis, and is accessible by car via Route 28.
Economy
Dennis Port is a popular summer destination for tourists and locals alike, and the local economy is largely dependent on the tourism industry. The village is home to several small businesses, including restaurants, shops, and lodging establishments. The village also has a marina, which provides access to the waters of Nantucket Sound. Fishing is also a major industry in the area, and the village is home to several commercial fishing boats.
Demographics
As of the 2010 census, the population of Dennis Port was 1,845. The racial makeup of the village was 97.2% White, 0.7% African American, 0.3% Native American, 0.4% Asian, 0.1% Pacific Islander, 0.3% from other races, and 1.0% from two or more races. Hispanic or Latino of any race were 1.2% of the population.
The median household income in Dennis Port was $50,938, and the median family income was $60,938. The per capita income for the village was $27,938. About 5.2% of families and 8.2% of the population were below the poverty line, including 10.2% of those under age 18 and 4.2% of those age 65 or over.
Conclusion
Dennis Port is a small village located in the town of Dennis, Massachusetts, on the south side of Cape Cod. It is a popular summer destination for tourists and locals alike, and is known for its beautiful beaches, quaint shops, and seafood restaurants. The local economy is largely dependent on the tourism industry, and the village is home to several small businesses, including restaurants, shops, and lodging establishments. The population of Dennis Port was 1,845 as of the 2010 census, and the median household income was $50,938.
Common Questions
What is Per Capita Income in Dennis Port?
Per Capita income in Dennis Port is $42,238.
What is the Median Family Income in Dennis Port?
Median Family Income in Dennis Port is $78,438.
What is the Median Household income in Dennis Port?
Median Household Income in Dennis Port is $54,071.
What is Income or Wage Gap in Dennis Port?
Income or Wage Gap in Dennis Port is 28.3%.
Women in Dennis Port earn 71.7 cents for every dollar earned by a man.
What is Inequality or Gini Index in Dennis Port?
Inequality or Gini Index in Dennis Port is 0.47.
What is the Total Population of Dennis Port?
Total Population of Dennis Port is 3,300.
What is the Total Male Population of Dennis Port?
Total Male Population of Dennis Port is 1,817.
What is the Total Female Population of Dennis Port?
Total Female Population of Dennis Port is 1,483.
What is the Ratio of Males per 100 Females in Dennis Port?
There are 122.52 Males per 100 Females in Dennis Port.
What is the Ratio of Females per 100 Males in Dennis Port?
There are 81.62 Females per 100 Males in Dennis Port.
What is the Median Population Age in Dennis Port?
Median Population Age in Dennis Port is 57.1 Years.
What is the Average Family Size in Dennis Port
Average Family Size in Dennis Port is 2.7 People.
What is the Average Household Size in Dennis Port
Average Household Size in Dennis Port is 1.9 People.
How Large is the Labor Force in Dennis Port?
There are 1,714 People in the Labor Forcein in Dennis Port.
What is the Percentage of People in the Labor Force in Dennis Port?
57.7% of People are in the Labor Force in Dennis Port.
What is the Unemployment Rate in Dennis Port?
Unemployment Rate in Dennis Port is 11.6%.