North Brookfield, MA Map & Demographics
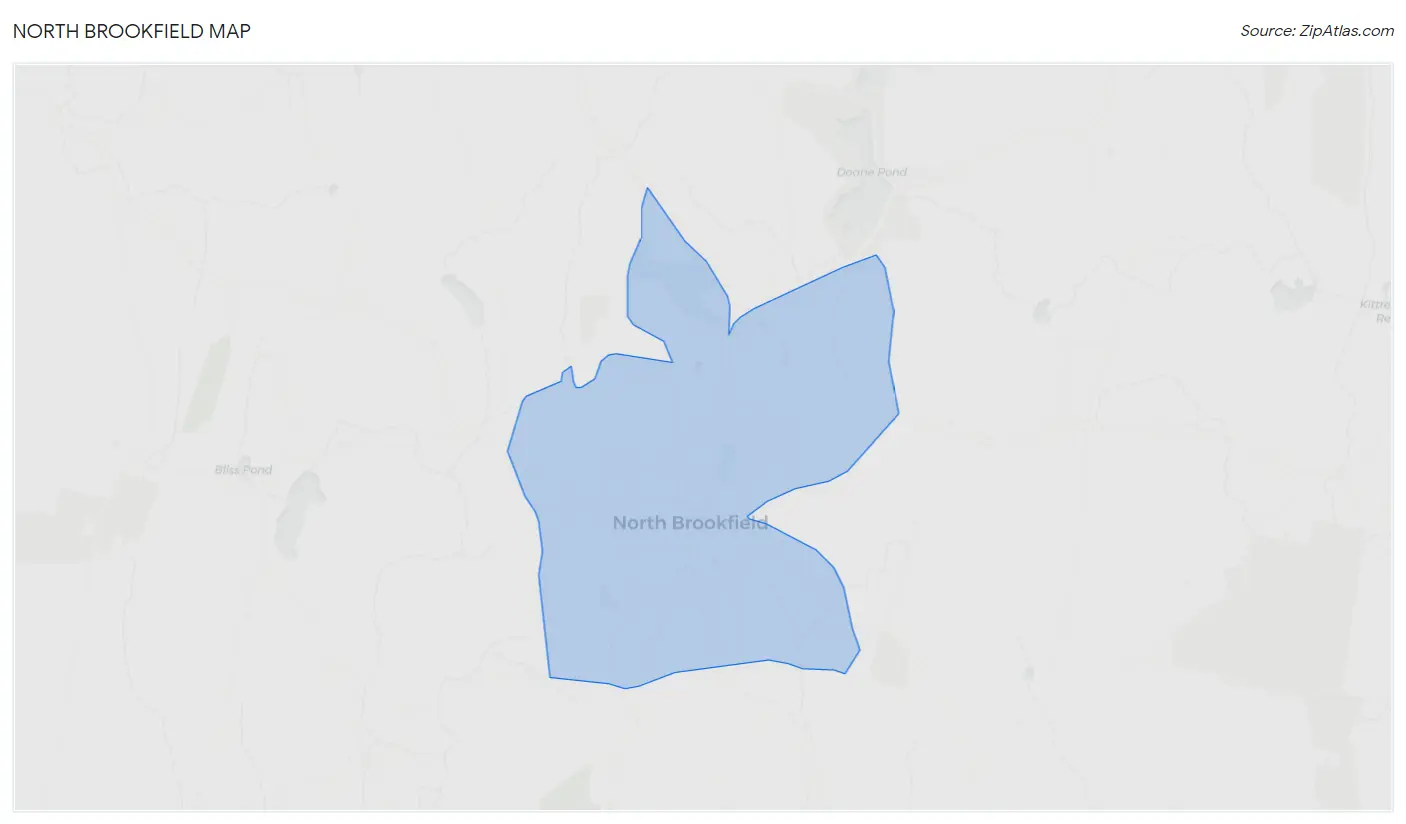
North Brookfield Map
North Brookfield Overview
$35,392
PER CAPITA INCOME
$80,758
AVG FAMILY INCOME
$73,904
AVG HOUSEHOLD INCOME
46.9%
WAGE / INCOME GAP [ % ]
53.1¢/ $1
WAGE / INCOME GAP [ $ ]
0.34
INEQUALITY / GINI INDEX
2,437
TOTAL POPULATION
1,186
MALE POPULATION
1,251
FEMALE POPULATION
94.80
MALES / 100 FEMALES
105.48
FEMALES / 100 MALES
44.0
MEDIAN AGE
3.1
AVG FAMILY SIZE
2.5
AVG HOUSEHOLD SIZE
1,405
LABOR FORCE [ PEOPLE ]
68.7%
PERCENT IN LABOR FORCE
2.0%
UNEMPLOYMENT RATE
North Brookfield Zip Codes
Income in North Brookfield
Income Overview in North Brookfield
Per Capita Income in North Brookfield is $35,392, while median incomes of families and households are $80,758 and $73,904 respectively.
| Characteristic | Number | Measure |
| Per Capita Income | 2,437 | $35,392 |
| Median Family Income | 592 | $80,758 |
| Mean Family Income | 592 | $96,775 |
| Median Household Income | 993 | $73,904 |
| Mean Household Income | 993 | $82,660 |
| Income Deficit | 592 | $0 |
| Wage / Income Gap (%) | 2,437 | 46.91% |
| Wage / Income Gap ($) | 2,437 | 53.09¢ per $1 |
| Gini / Inequality Index | 2,437 | 0.34 |
Earnings by Sex in North Brookfield
Average Earnings in North Brookfield are $44,936, $53,425 for men and $28,361 for women, a difference of 46.9%.
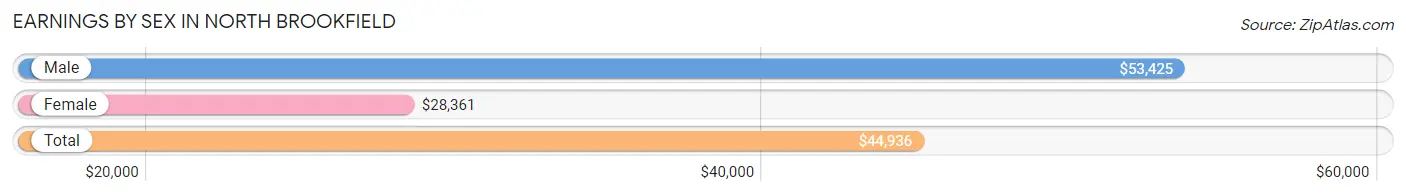
| Sex | Number | Average Earnings |
| Male | 789 (53.5%) | $53,425 |
| Female | 685 (46.5%) | $28,361 |
| Total | 1,474 (100.0%) | $44,936 |
Earnings by Sex by Income Bracket in North Brookfield
The most common earnings brackets in North Brookfield are $50,000 to $54,999 for men (197 | 25.0%) and $22,500 to $24,999 for women (77 | 11.2%).
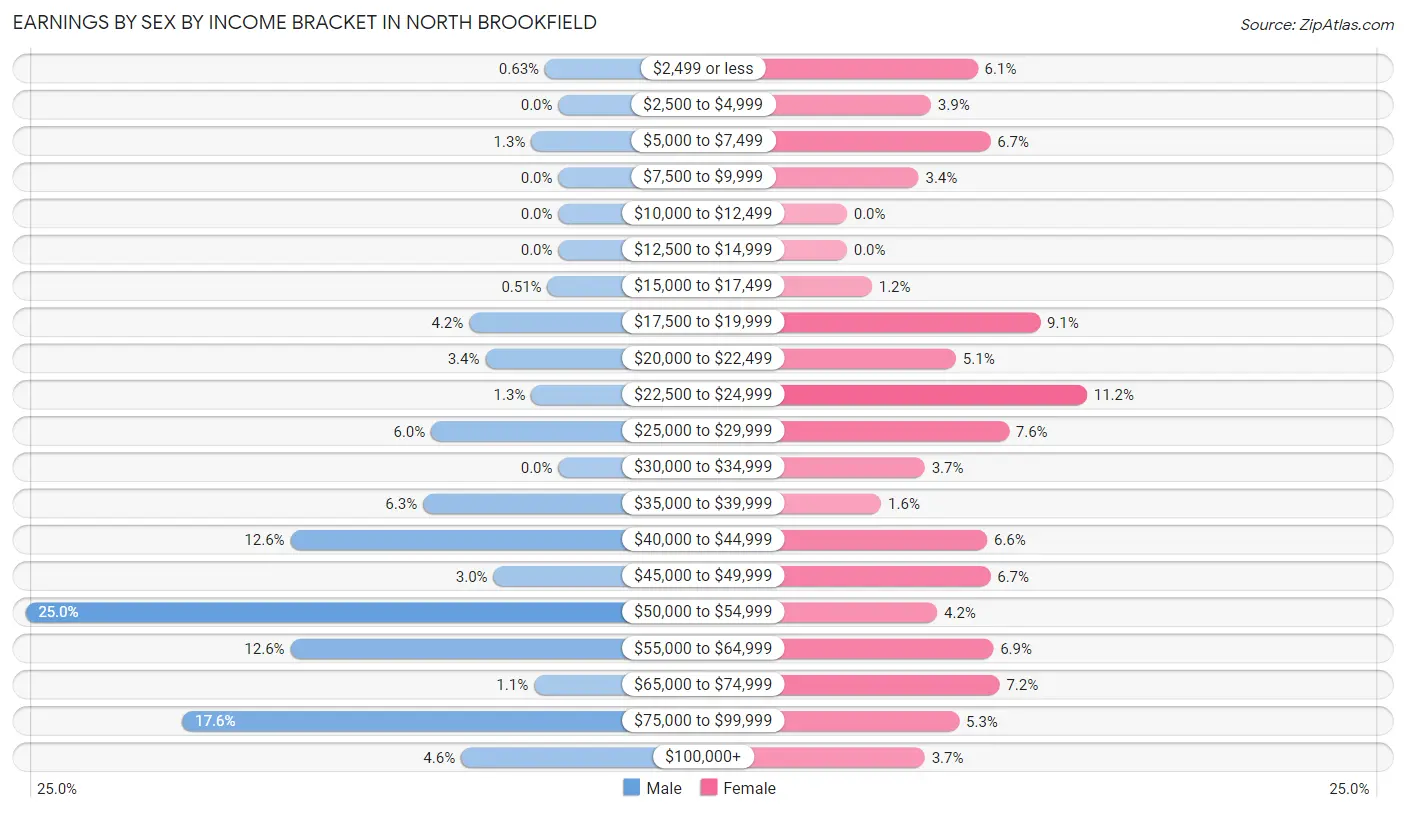
| Income | Male | Female |
| $2,499 or less | 5 (0.6%) | 42 (6.1%) |
| $2,500 to $4,999 | 0 (0.0%) | 27 (3.9%) |
| $5,000 to $7,499 | 10 (1.3%) | 46 (6.7%) |
| $7,500 to $9,999 | 0 (0.0%) | 23 (3.4%) |
| $10,000 to $12,499 | 0 (0.0%) | 0 (0.0%) |
| $12,500 to $14,999 | 0 (0.0%) | 0 (0.0%) |
| $15,000 to $17,499 | 4 (0.5%) | 8 (1.2%) |
| $17,500 to $19,999 | 33 (4.2%) | 62 (9.0%) |
| $20,000 to $22,499 | 27 (3.4%) | 35 (5.1%) |
| $22,500 to $24,999 | 10 (1.3%) | 77 (11.2%) |
| $25,000 to $29,999 | 47 (6.0%) | 52 (7.6%) |
| $30,000 to $34,999 | 0 (0.0%) | 25 (3.6%) |
| $35,000 to $39,999 | 50 (6.3%) | 11 (1.6%) |
| $40,000 to $44,999 | 99 (12.6%) | 45 (6.6%) |
| $45,000 to $49,999 | 24 (3.0%) | 46 (6.7%) |
| $50,000 to $54,999 | 197 (25.0%) | 29 (4.2%) |
| $55,000 to $64,999 | 99 (12.6%) | 47 (6.9%) |
| $65,000 to $74,999 | 9 (1.1%) | 49 (7.1%) |
| $75,000 to $99,999 | 139 (17.6%) | 36 (5.3%) |
| $100,000+ | 36 (4.6%) | 25 (3.6%) |
| Total | 789 (100.0%) | 685 (100.0%) |
Earnings by Sex by Educational Attainment in North Brookfield
Average earnings in North Brookfield are $53,877 for men and $28,750 for women, a difference of 46.6%. Men with an educational attainment of graduate degree enjoy the highest average annual earnings of $85,882, while those with high school diploma education earn the least with $53,708. Women with an educational attainment of college or associate's degree earn the most with the average annual earnings of $58,182, while those with high school diploma education have the smallest earnings of $19,792.
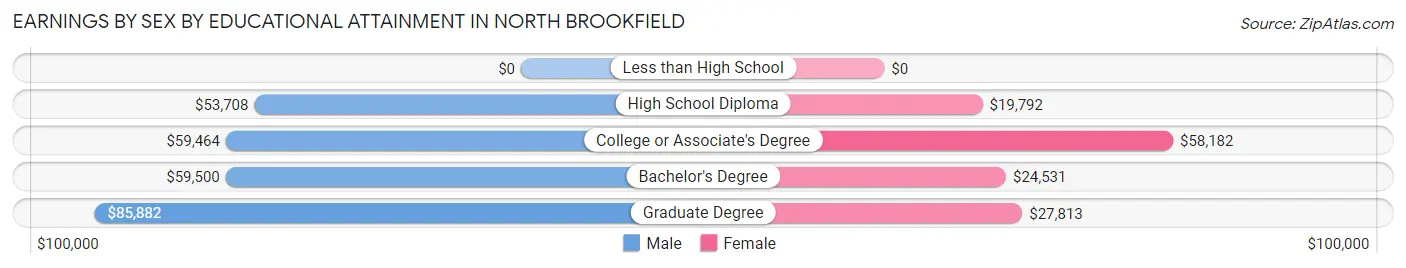
| Educational Attainment | Male Income | Female Income |
| Less than High School | - | - |
| High School Diploma | $53,708 | $19,792 |
| College or Associate's Degree | $59,464 | $58,182 |
| Bachelor's Degree | $59,500 | $24,531 |
| Graduate Degree | $85,882 | $27,813 |
| Total | $53,877 | $28,750 |
Family Income in North Brookfield
Family Income Brackets in North Brookfield
According to the North Brookfield family income data, there are 196 families falling into the $50,000 to $74,999 income range, which is the most common income bracket and makes up 33.1% of all families.
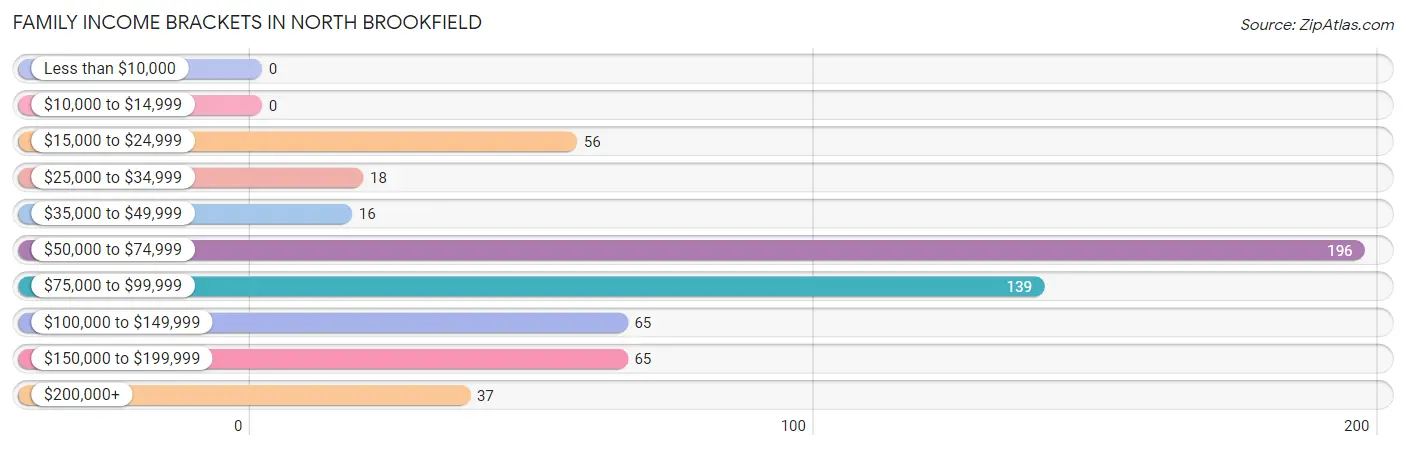
| Income Bracket | # Families | % Families |
| Less than $10,000 | 0 | 0.0% |
| $10,000 to $14,999 | 0 | 0.0% |
| $15,000 to $24,999 | 56 | 9.5% |
| $25,000 to $34,999 | 18 | 3.0% |
| $35,000 to $49,999 | 16 | 2.7% |
| $50,000 to $74,999 | 196 | 33.1% |
| $75,000 to $99,999 | 139 | 23.5% |
| $100,000 to $149,999 | 65 | 11.0% |
| $150,000 to $199,999 | 65 | 11.0% |
| $200,000+ | 37 | 6.3% |
Family Income by Famaliy Size in North Brookfield
3-person families (133 | 22.5%) account for the highest median family income in North Brookfield with $102,782 per family, while 2-person families (279 | 47.1%) have the highest median income of $37,123 per family member.
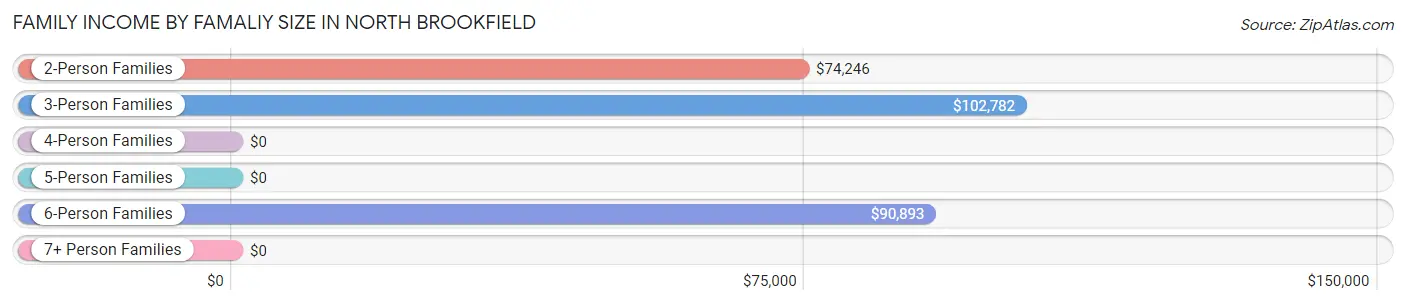
| Income Bracket | # Families | Median Income |
| 2-Person Families | 279 (47.1%) | $74,246 |
| 3-Person Families | 133 (22.5%) | $102,782 |
| 4-Person Families | 126 (21.3%) | $0 |
| 5-Person Families | 35 (5.9%) | $0 |
| 6-Person Families | 19 (3.2%) | $90,893 |
| 7+ Person Families | 0 (0.0%) | $0 |
| Total | 592 (100.0%) | $80,758 |
Family Income by Number of Earners in North Brookfield
The median family income in North Brookfield is $80,758, with families comprising 3+ earners (91) having the highest median family income of $159,896, while families with no earners (45) have the lowest median family income of $54,922, accounting for 15.4% and 7.6% of families, respectively.
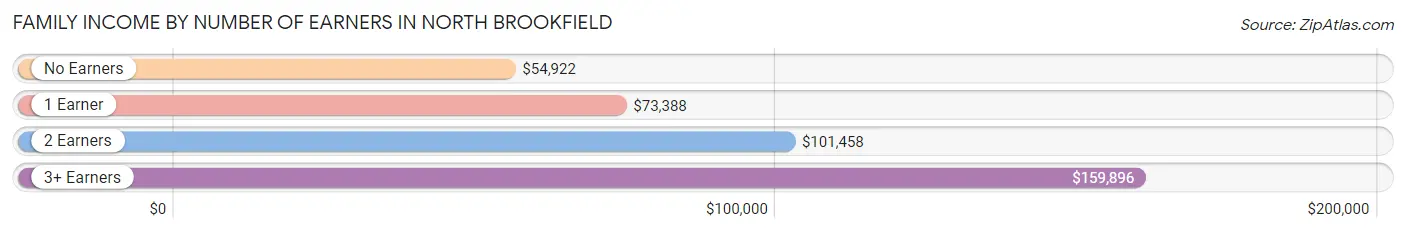
| Number of Earners | # Families | Median Income |
| No Earners | 45 (7.6%) | $54,922 |
| 1 Earner | 288 (48.6%) | $73,388 |
| 2 Earners | 168 (28.4%) | $101,458 |
| 3+ Earners | 91 (15.4%) | $159,896 |
| Total | 592 (100.0%) | $80,758 |
Household Income in North Brookfield
Household Income Brackets in North Brookfield
With 355 households falling in the category, the $50,000 to $74,999 income range is the most frequent in North Brookfield, accounting for 35.7% of all households.
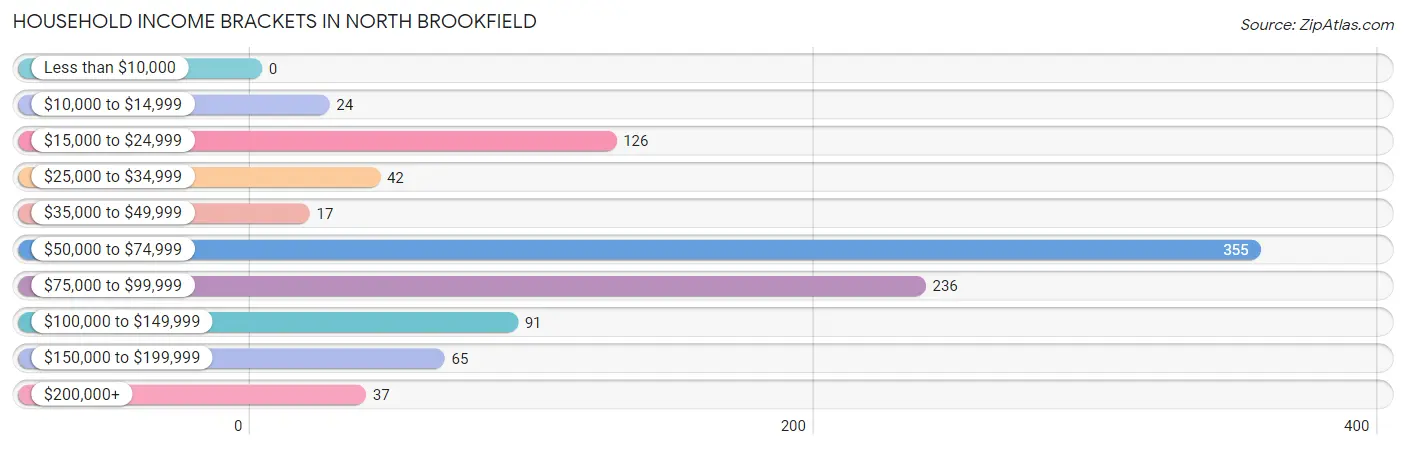
| Income Bracket | # Households | % Households |
| Less than $10,000 | 0 | 0.0% |
| $10,000 to $14,999 | 24 | 2.4% |
| $15,000 to $24,999 | 126 | 12.7% |
| $25,000 to $34,999 | 42 | 4.2% |
| $35,000 to $49,999 | 17 | 1.7% |
| $50,000 to $74,999 | 355 | 35.8% |
| $75,000 to $99,999 | 236 | 23.8% |
| $100,000 to $149,999 | 91 | 9.2% |
| $150,000 to $199,999 | 65 | 6.5% |
| $200,000+ | 37 | 3.7% |
Household Income by Householder Age in North Brookfield
The median household income in North Brookfield is $73,904, with the highest median household income of $81,484 found in the 25 to 44 years age bracket for the primary householder. A total of 236 households (23.8%) fall into this category. Meanwhile, the 65+ years age bracket for the primary householder has the lowest median household income of $73,223, with 322 households (32.4%) in this group.
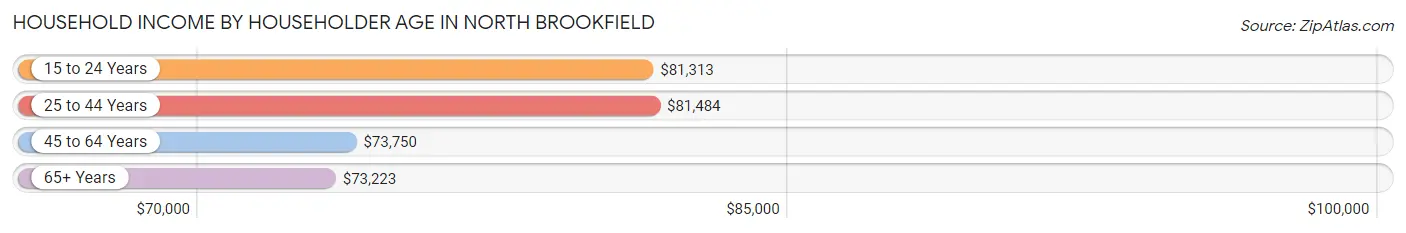
| Income Bracket | # Households | Median Income |
| 15 to 24 Years | 43 (4.3%) | $81,313 |
| 25 to 44 Years | 236 (23.8%) | $81,484 |
| 45 to 64 Years | 392 (39.5%) | $73,750 |
| 65+ Years | 322 (32.4%) | $73,223 |
| Total | 993 (100.0%) | $73,904 |
Poverty in North Brookfield
Income Below Poverty by Sex and Age in North Brookfield
With 10.0% poverty level for males and 12.6% for females among the residents of North Brookfield, 15 year old males and 6 to 11 year old females are the most vulnerable to poverty, with 57 males (90.5%) and 58 females (61.1%) in their respective age groups living below the poverty level.
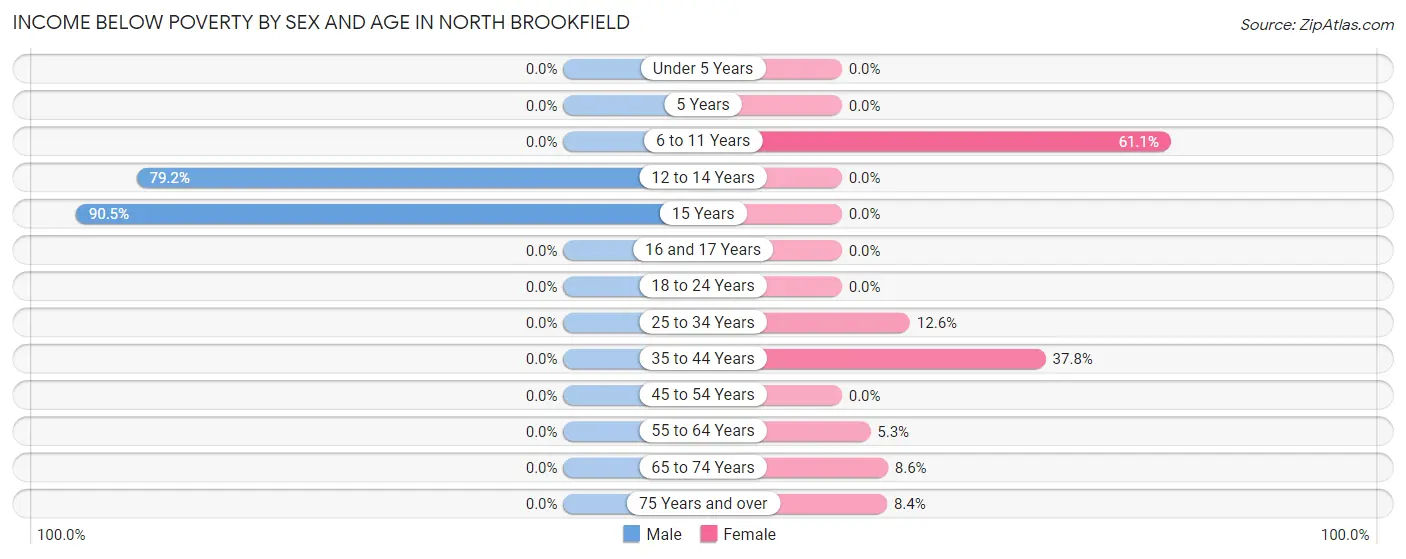
| Age Bracket | Male | Female |
| Under 5 Years | 0 (0.0%) | 0 (0.0%) |
| 5 Years | 0 (0.0%) | 0 (0.0%) |
| 6 to 11 Years | 0 (0.0%) | 58 (61.1%) |
| 12 to 14 Years | 61 (79.2%) | 0 (0.0%) |
| 15 Years | 57 (90.5%) | 0 (0.0%) |
| 16 and 17 Years | 0 (0.0%) | 0 (0.0%) |
| 18 to 24 Years | 0 (0.0%) | 0 (0.0%) |
| 25 to 34 Years | 0 (0.0%) | 11 (12.6%) |
| 35 to 44 Years | 0 (0.0%) | 56 (37.8%) |
| 45 to 54 Years | 0 (0.0%) | 0 (0.0%) |
| 55 to 64 Years | 0 (0.0%) | 8 (5.3%) |
| 65 to 74 Years | 0 (0.0%) | 10 (8.6%) |
| 75 Years and over | 0 (0.0%) | 14 (8.4%) |
| Total | 118 (10.0%) | 157 (12.6%) |
Income Above Poverty by Sex and Age in North Brookfield
According to the poverty statistics in North Brookfield, males aged under 5 years and females aged under 5 years are the age groups that are most secure financially, with 100.0% of males and 100.0% of females in these age groups living above the poverty line.
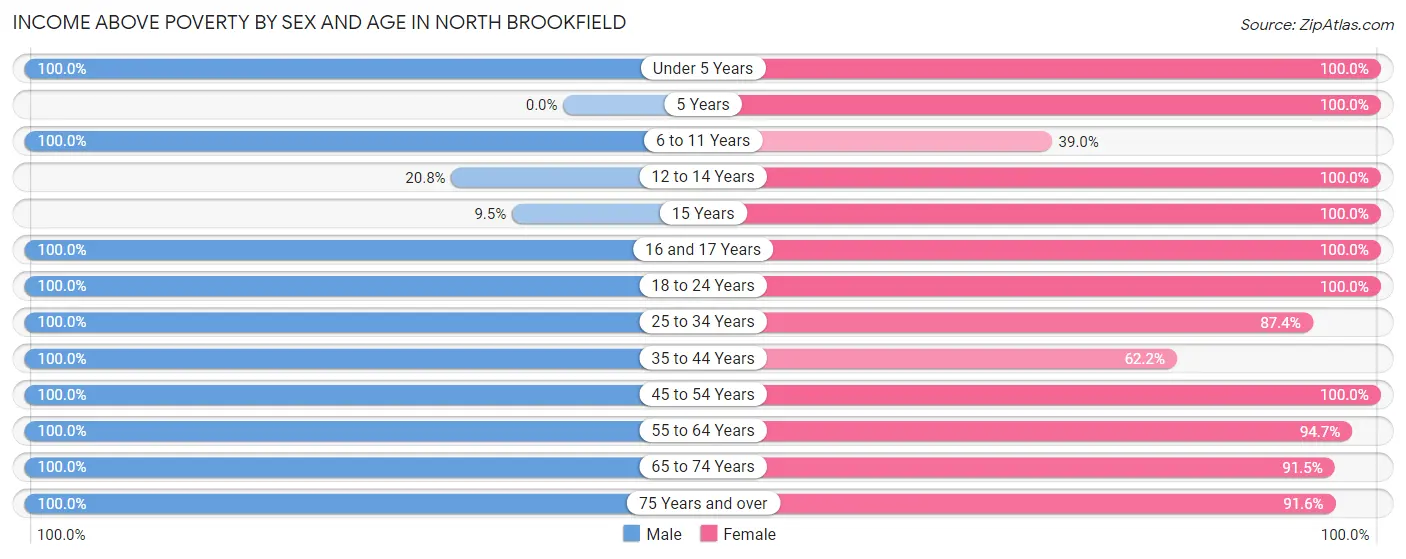
| Age Bracket | Male | Female |
| Under 5 Years | 23 (100.0%) | 54 (100.0%) |
| 5 Years | 0 (0.0%) | 5 (100.0%) |
| 6 to 11 Years | 28 (100.0%) | 37 (39.0%) |
| 12 to 14 Years | 16 (20.8%) | 40 (100.0%) |
| 15 Years | 6 (9.5%) | 7 (100.0%) |
| 16 and 17 Years | 53 (100.0%) | 39 (100.0%) |
| 18 to 24 Years | 67 (100.0%) | 155 (100.0%) |
| 25 to 34 Years | 133 (100.0%) | 76 (87.4%) |
| 35 to 44 Years | 155 (100.0%) | 92 (62.2%) |
| 45 to 54 Years | 167 (100.0%) | 186 (100.0%) |
| 55 to 64 Years | 274 (100.0%) | 143 (94.7%) |
| 65 to 74 Years | 96 (100.0%) | 107 (91.4%) |
| 75 Years and over | 50 (100.0%) | 153 (91.6%) |
| Total | 1,068 (90.0%) | 1,094 (87.5%) |
Income Below Poverty Among Married-Couple Families in North Brookfield
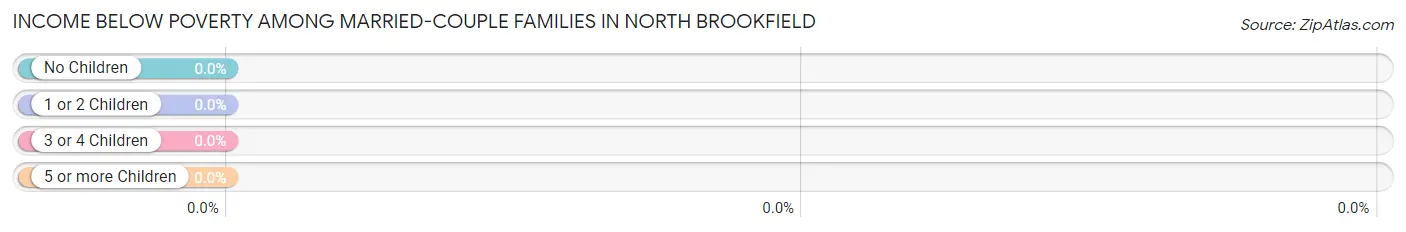
| Children | Above Poverty | Below Poverty |
| No Children | 184 (100.0%) | 0 (0.0%) |
| 1 or 2 Children | 117 (100.0%) | 0 (0.0%) |
| 3 or 4 Children | 35 (100.0%) | 0 (0.0%) |
| 5 or more Children | 0 (0.0%) | 0 (0.0%) |
| Total | 336 (100.0%) | 0 (0.0%) |
Income Below Poverty Among Single-Parent Households in North Brookfield
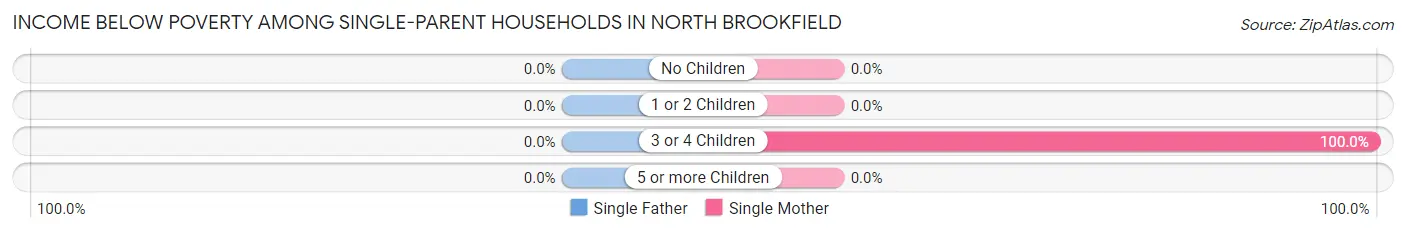
| Children | Single Father | Single Mother |
| No Children | 0 (0.0%) | 0 (0.0%) |
| 1 or 2 Children | 0 (0.0%) | 0 (0.0%) |
| 3 or 4 Children | 0 (0.0%) | 56 (100.0%) |
| 5 or more Children | 0 (0.0%) | 0 (0.0%) |
| Total | 0 (0.0%) | 56 (26.7%) |
Income Below Poverty Among Married-Couple vs Single-Parent Households in North Brookfield
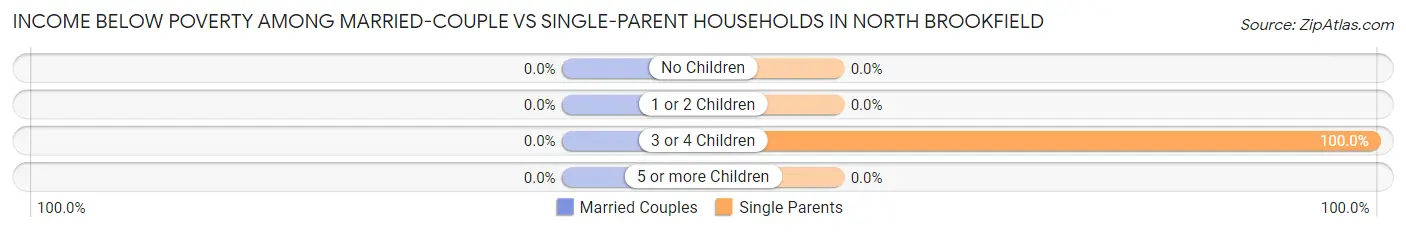
| Children | Married-Couple Families | Single-Parent Households |
| No Children | 0 (0.0%) | 0 (0.0%) |
| 1 or 2 Children | 0 (0.0%) | 0 (0.0%) |
| 3 or 4 Children | 0 (0.0%) | 56 (100.0%) |
| 5 or more Children | 0 (0.0%) | 0 (0.0%) |
| Total | 0 (0.0%) | 56 (21.9%) |
Race in North Brookfield
The most populous races in North Brookfield are White / Caucasian (2,333 | 95.7%), Two or more Races (49 | 2.0%), and Black / African American (43 | 1.8%).
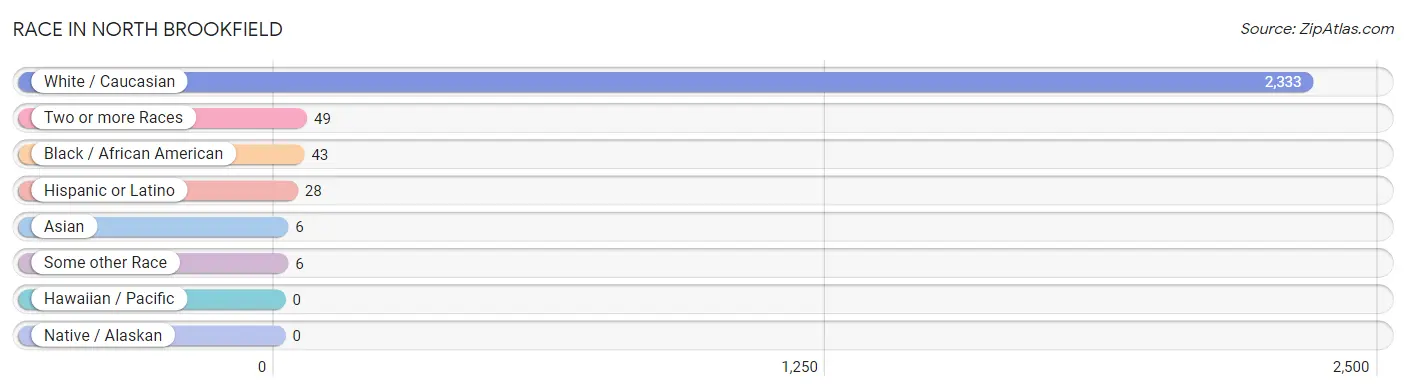
| Race | # Population | % Population |
| Asian | 6 | 0.3% |
| Black / African American | 43 | 1.8% |
| Hawaiian / Pacific | 0 | 0.0% |
| Hispanic or Latino | 28 | 1.1% |
| Native / Alaskan | 0 | 0.0% |
| White / Caucasian | 2,333 | 95.7% |
| Two or more Races | 49 | 2.0% |
| Some other Race | 6 | 0.3% |
| Total | 2,437 | 100.0% |
Ancestry in North Brookfield
The most populous ancestries reported in North Brookfield are American (467 | 19.2%), Italian (313 | 12.8%), Irish (264 | 10.8%), French (257 | 10.5%), and English (194 | 8.0%), together accounting for 61.3% of all North Brookfield residents.
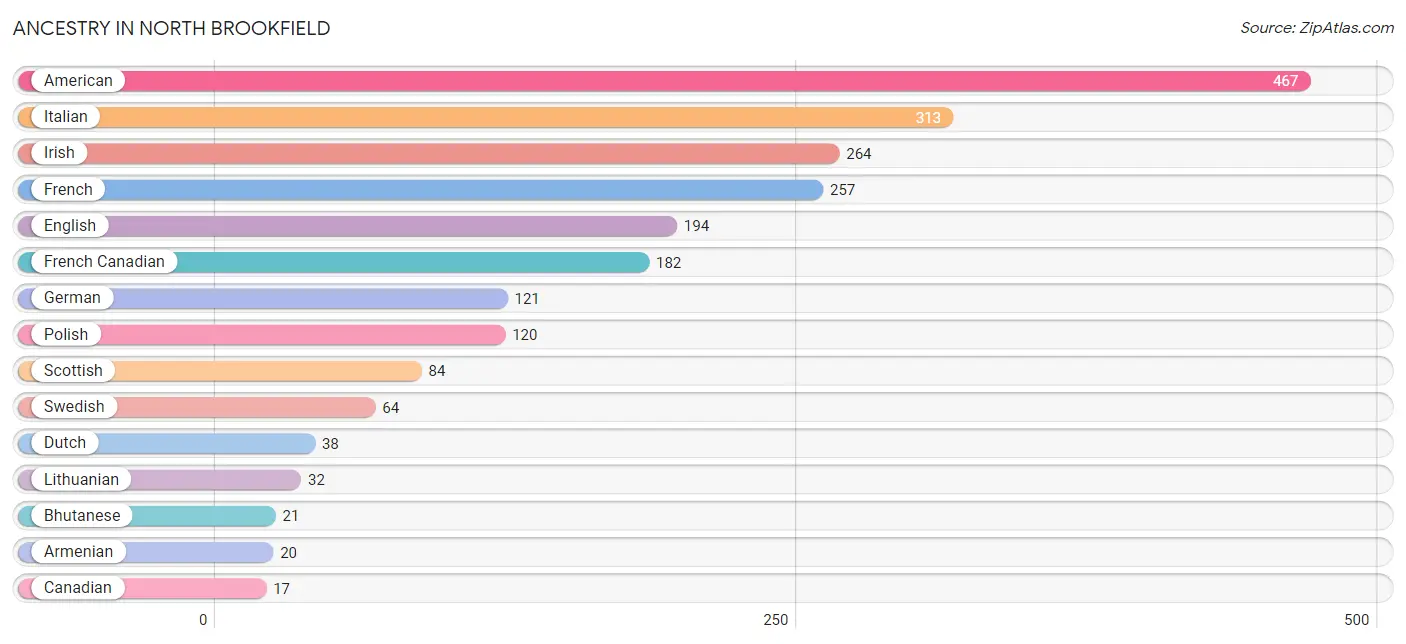
| Ancestry | # Population | % Population |
| American | 467 | 19.2% |
| Armenian | 20 | 0.8% |
| Bhutanese | 21 | 0.9% |
| Canadian | 17 | 0.7% |
| Colombian | 8 | 0.3% |
| Cuban | 1 | 0.0% |
| Dutch | 38 | 1.6% |
| Eastern European | 12 | 0.5% |
| English | 194 | 8.0% |
| Finnish | 3 | 0.1% |
| French | 257 | 10.5% |
| French Canadian | 182 | 7.5% |
| German | 121 | 5.0% |
| Haitian | 6 | 0.3% |
| Hungarian | 7 | 0.3% |
| Irish | 264 | 10.8% |
| Italian | 313 | 12.8% |
| Lithuanian | 32 | 1.3% |
| Mexican | 6 | 0.3% |
| Pennsylvania German | 8 | 0.3% |
| Polish | 120 | 4.9% |
| Portuguese | 9 | 0.4% |
| Puerto Rican | 13 | 0.5% |
| Scotch-Irish | 9 | 0.4% |
| Scottish | 84 | 3.5% |
| South American | 8 | 0.3% |
| Swedish | 64 | 2.6% | View All 27 Rows |
Immigrants in North Brookfield
The most numerous immigrant groups reported in North Brookfield came from Africa (23 | 0.9%), Ghana (23 | 0.9%), Western Africa (23 | 0.9%), Europe (21 | 0.9%), and Netherlands (21 | 0.9%), together accounting for 4.5% of all North Brookfield residents.
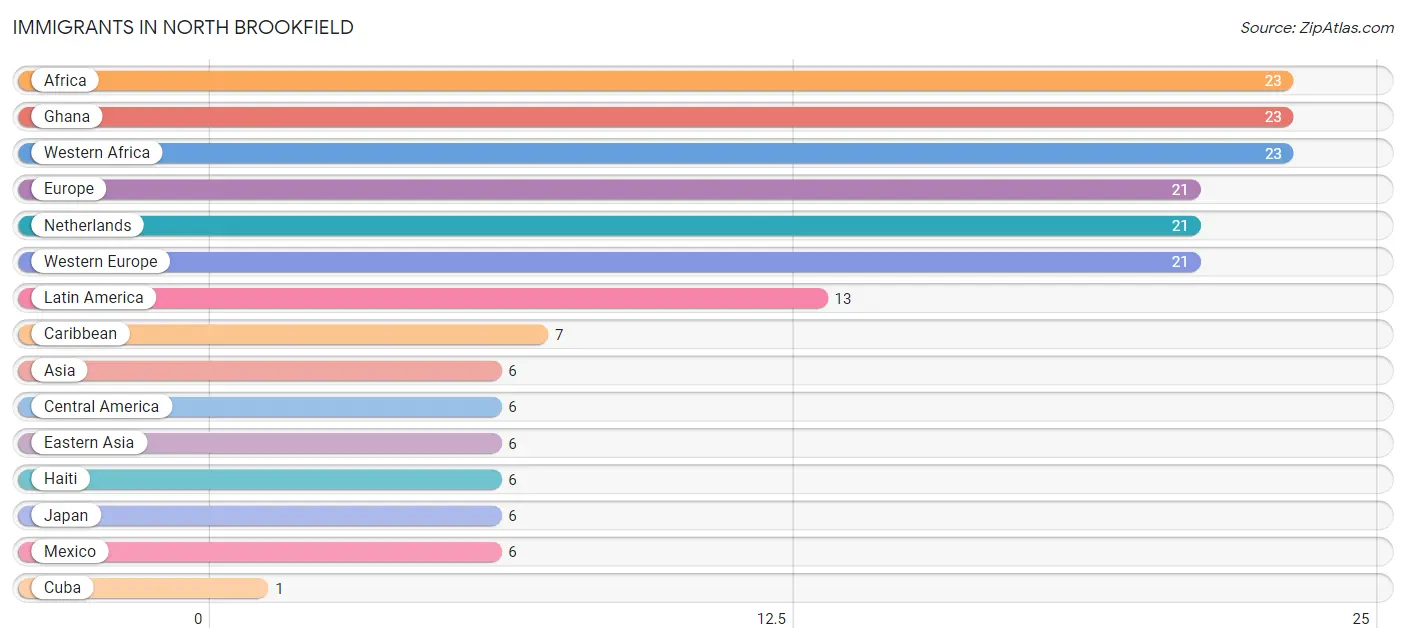
| Immigration Origin | # Population | % Population |
| Africa | 23 | 0.9% |
| Asia | 6 | 0.3% |
| Caribbean | 7 | 0.3% |
| Central America | 6 | 0.3% |
| Cuba | 1 | 0.0% |
| Eastern Asia | 6 | 0.3% |
| Europe | 21 | 0.9% |
| Ghana | 23 | 0.9% |
| Haiti | 6 | 0.3% |
| Japan | 6 | 0.3% |
| Latin America | 13 | 0.5% |
| Mexico | 6 | 0.3% |
| Netherlands | 21 | 0.9% |
| Western Africa | 23 | 0.9% |
| Western Europe | 21 | 0.9% | View All 15 Rows |
Sex and Age in North Brookfield
Sex and Age in North Brookfield
The most populous age groups in North Brookfield are 60 to 64 Years (204 | 17.2%) for men and 80 to 84 Years (157 | 12.6%) for women.
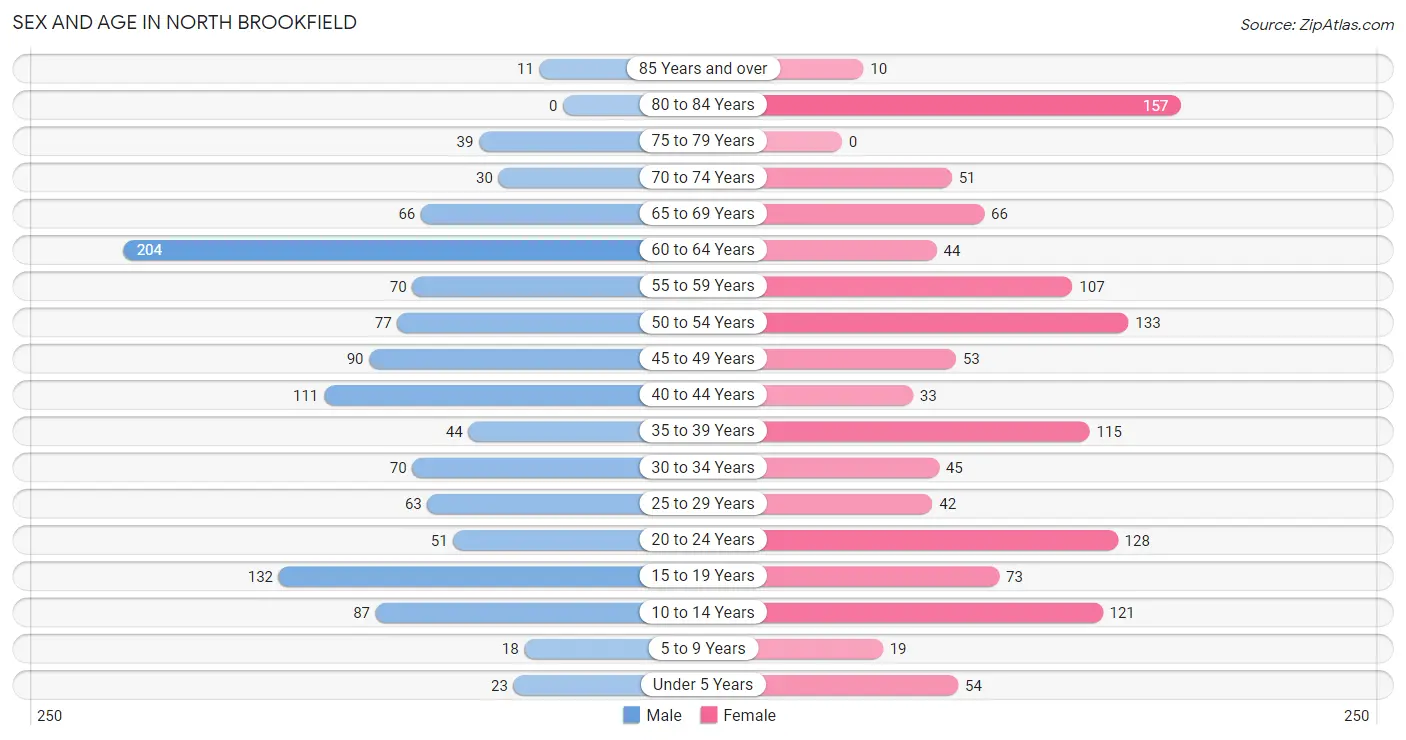
| Age Bracket | Male | Female |
| Under 5 Years | 23 (1.9%) | 54 (4.3%) |
| 5 to 9 Years | 18 (1.5%) | 19 (1.5%) |
| 10 to 14 Years | 87 (7.3%) | 121 (9.7%) |
| 15 to 19 Years | 132 (11.1%) | 73 (5.8%) |
| 20 to 24 Years | 51 (4.3%) | 128 (10.2%) |
| 25 to 29 Years | 63 (5.3%) | 42 (3.4%) |
| 30 to 34 Years | 70 (5.9%) | 45 (3.6%) |
| 35 to 39 Years | 44 (3.7%) | 115 (9.2%) |
| 40 to 44 Years | 111 (9.4%) | 33 (2.6%) |
| 45 to 49 Years | 90 (7.6%) | 53 (4.2%) |
| 50 to 54 Years | 77 (6.5%) | 133 (10.6%) |
| 55 to 59 Years | 70 (5.9%) | 107 (8.6%) |
| 60 to 64 Years | 204 (17.2%) | 44 (3.5%) |
| 65 to 69 Years | 66 (5.6%) | 66 (5.3%) |
| 70 to 74 Years | 30 (2.5%) | 51 (4.1%) |
| 75 to 79 Years | 39 (3.3%) | 0 (0.0%) |
| 80 to 84 Years | 0 (0.0%) | 157 (12.6%) |
| 85 Years and over | 11 (0.9%) | 10 (0.8%) |
| Total | 1,186 (100.0%) | 1,251 (100.0%) |
Families and Households in North Brookfield
Median Family Size in North Brookfield
The median family size in North Brookfield is 3.11 persons per family, with married-couple families (336 | 56.8%) accounting for the largest median family size of 3.34 persons per family. On the other hand, single male/father families (46 | 7.8%) represent the smallest median family size with 2.02 persons per family.
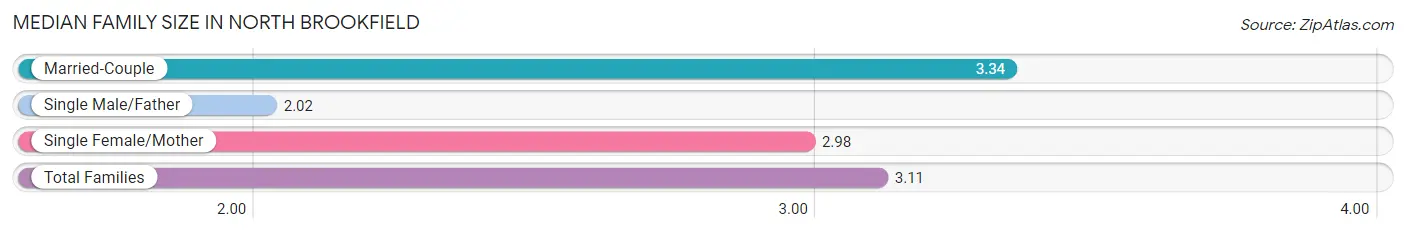
| Family Type | # Families | Family Size |
| Married-Couple | 336 (56.8%) | 3.34 |
| Single Male/Father | 46 (7.8%) | 2.02 |
| Single Female/Mother | 210 (35.5%) | 2.98 |
| Total Families | 592 (100.0%) | 3.11 |
Median Household Size in North Brookfield
The median household size in North Brookfield is 2.45 persons per household, with married-couple households (336 | 33.8%) accounting for the largest median household size of 3.4 persons per household. non-family households (401 | 40.4%) represent the smallest median household size with 1.26 persons per household.
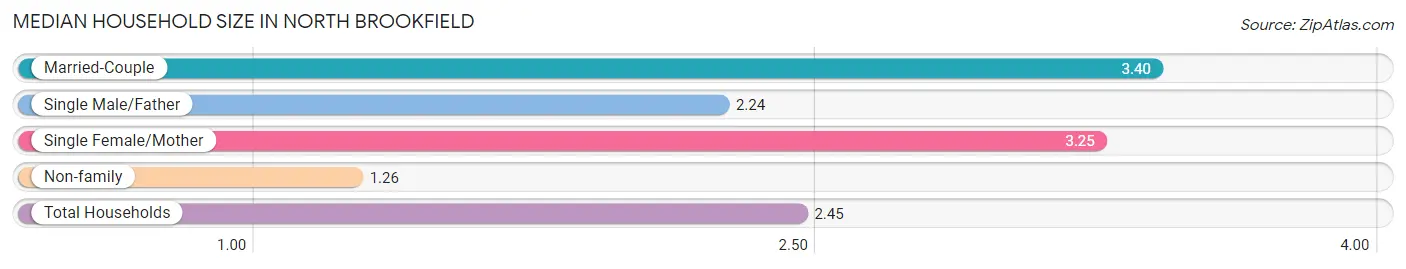
| Household Type | # Households | Household Size |
| Married-Couple | 336 (33.8%) | 3.40 |
| Single Male/Father | 46 (4.6%) | 2.24 |
| Single Female/Mother | 210 (21.1%) | 3.25 |
| Non-family | 401 (40.4%) | 1.26 |
| Total Households | 993 (100.0%) | 2.45 |
Household Size by Marriage Status in North Brookfield
Out of a total of 993 households in North Brookfield, 592 (59.6%) are family households, while 401 (40.4%) are nonfamily households. The most numerous type of family households are 2-person households, comprising 270, and the most common type of nonfamily households are 1-person households, comprising 298.
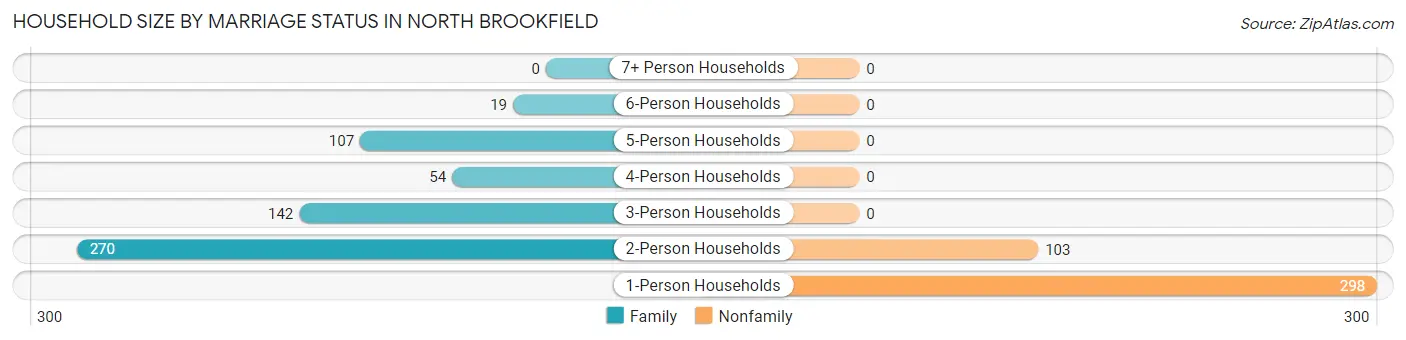
| Household Size | Family Households | Nonfamily Households |
| 1-Person Households | - | 298 (30.0%) |
| 2-Person Households | 270 (27.2%) | 103 (10.4%) |
| 3-Person Households | 142 (14.3%) | 0 (0.0%) |
| 4-Person Households | 54 (5.4%) | 0 (0.0%) |
| 5-Person Households | 107 (10.8%) | 0 (0.0%) |
| 6-Person Households | 19 (1.9%) | 0 (0.0%) |
| 7+ Person Households | 0 (0.0%) | 0 (0.0%) |
| Total | 592 (59.6%) | 401 (40.4%) |
Female Fertility in North Brookfield
Fertility by Age in North Brookfield
Average fertility rate in North Brookfield is 33.0 births per 1,000 women. Women in the age bracket of 20 to 34 years have the highest fertility rate with 47.0 births per 1,000 women. Women in the age bracket of 20 to 34 years acount for 62.5% of all women with births.
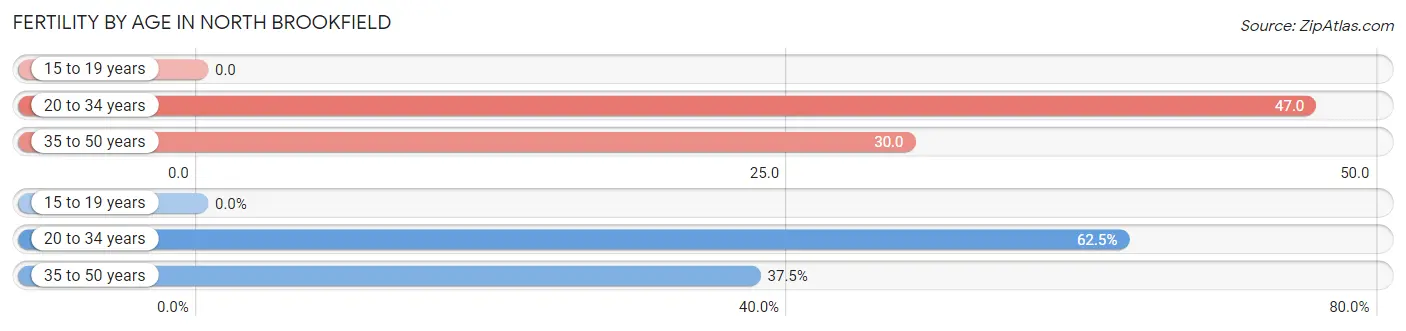
| Age Bracket | Women with Births | Births / 1,000 Women |
| 15 to 19 years | 0 (0.0%) | 0.0 |
| 20 to 34 years | 10 (62.5%) | 47.0 |
| 35 to 50 years | 6 (37.5%) | 30.0 |
| Total | 16 (100.0%) | 33.0 |
Fertility by Age by Marriage Status in North Brookfield
37.5% of women with births (16) in North Brookfield are married. The highest percentage of unmarried women with births falls into 20 to 34 years age bracket with 100.0% of them unmarried at the time of birth, while the lowest percentage of unmarried women with births belong to 35 to 50 years age bracket with 0.0% of them unmarried.
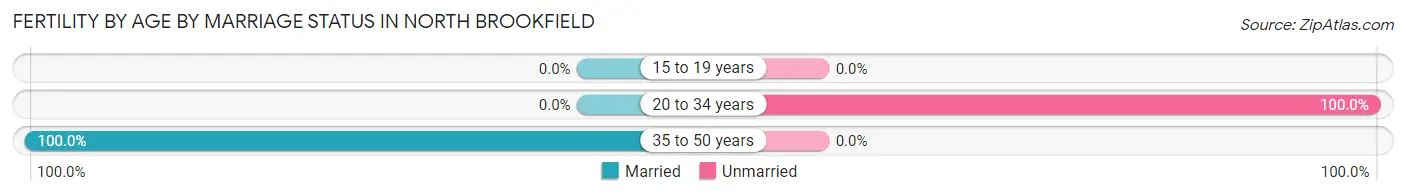
| Age Bracket | Married | Unmarried |
| 15 to 19 years | 0 (0.0%) | 0 (0.0%) |
| 20 to 34 years | 0 (0.0%) | 10 (100.0%) |
| 35 to 50 years | 6 (100.0%) | 0 (0.0%) |
| Total | 6 (37.5%) | 10 (62.5%) |
Fertility by Education in North Brookfield
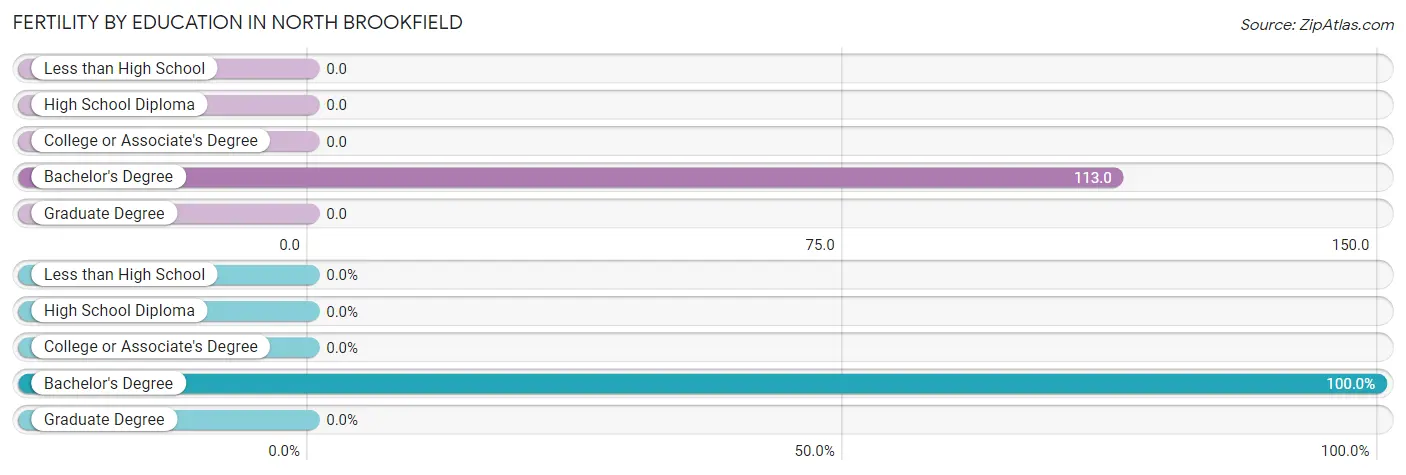
| Educational Attainment | Women with Births | Births / 1,000 Women |
| Less than High School | 0 (0.0%) | 0.0 |
| High School Diploma | 0 (0.0%) | 0.0 |
| College or Associate's Degree | 0 (0.0%) | 0.0 |
| Bachelor's Degree | 16 (100.0%) | 113.0 |
| Graduate Degree | 0 (0.0%) | 0.0 |
| Total | 16 (100.0%) | 33.0 |
Fertility by Education by Marriage Status in North Brookfield
62.5% of women with births in North Brookfield are unmarried. Women with the educational attainment of bachelor's degree are most likely to be married with 37.5% of them married at childbirth, while women with the educational attainment of bachelor's degree are least likely to be married with 62.5% of them unmarried at childbirth.
| Educational Attainment | Married | Unmarried |
| Less than High School | 0 (0.0%) | 0 (0.0%) |
| High School Diploma | 0 (0.0%) | 0 (0.0%) |
| College or Associate's Degree | 0 (0.0%) | 0 (0.0%) |
| Bachelor's Degree | 6 (37.5%) | 10 (62.5%) |
| Graduate Degree | 0 (0.0%) | 0 (0.0%) |
| Total | 6 (37.5%) | 10 (62.5%) |
Employment Characteristics in North Brookfield
Employment by Class of Employer in North Brookfield
Among the 1,377 employed individuals in North Brookfield, private company employees (955 | 69.4%), not-for-profit organizations (159 | 11.6%), and local government employees (98 | 7.1%) make up the most common classes of employment.
| Employer Class | # Employees | % Employees |
| Private Company Employees | 955 | 69.4% |
| Self-Employed (Incorporated) | 15 | 1.1% |
| Self-Employed (Not Incorporated) | 69 | 5.0% |
| Not-for-profit Organizations | 159 | 11.6% |
| Local Government Employees | 98 | 7.1% |
| State Government Employees | 49 | 3.6% |
| Federal Government Employees | 32 | 2.3% |
| Unpaid Family Workers | 0 | 0.0% |
| Total | 1,377 | 100.0% |
Employment Status by Age in North Brookfield
According to the labor force statistics for North Brookfield, out of the total population over 16 years of age (2,045), 68.7% or 1,405 individuals are in the labor force, with 2.0% or 28 of them unemployed. The age group with the highest labor force participation rate is 20 to 24 years, with 100.0% or 179 individuals in the labor force. Within the labor force, the 16 to 19 years age range has the highest percentage of unemployed individuals, with 22.9% or 8 of them being unemployed.
| Age Bracket | In Labor Force | Unemployed |
| 16 to 19 Years | 35 (25.9%) | 8 (22.9%) |
| 20 to 24 Years | 179 (100.0%) | 20 (11.2%) |
| 25 to 29 Years | 81 (77.1%) | 0 (0.0%) |
| 30 to 34 Years | 106 (92.2%) | 0 (0.0%) |
| 35 to 44 Years | 257 (84.8%) | 0 (0.0%) |
| 45 to 54 Years | 308 (87.3%) | 0 (0.0%) |
| 55 to 59 Years | 163 (92.1%) | 0 (0.0%) |
| 60 to 64 Years | 228 (91.9%) | 0 (0.0%) |
| 65 to 74 Years | 40 (18.8%) | 0 (0.0%) |
| 75 Years and over | 8 (3.7%) | 0 (0.0%) |
| Total | 1,405 (68.7%) | 28 (2.0%) |
Employment Status by Educational Attainment in North Brookfield
| Educational Attainment | In Labor Force | Unemployed |
| Less than High School | 80 (81.6%) | 0 (0.0%) |
| High School Diploma | 525 (89.3%) | 0 (0.0%) |
| College / Associate Degree | 260 (88.1%) | 0 (0.0%) |
| Bachelor's Degree or higher | 278 (86.9%) | 0 (0.0%) |
| Total | 1,144 (87.9%) | 0 (0.0%) |
Employment Occupations by Sex in North Brookfield
Management, Business, Science and Arts Occupations
The most common Management, Business, Science and Arts occupations in North Brookfield are Community & Social Service (218 | 15.8%), Education Instruction & Library (154 | 11.2%), Management (68 | 4.9%), Health Diagnosing & Treating (51 | 3.7%), and Arts, Media & Entertainment (40 | 2.9%).
Management, Business, Science and Arts Occupations by Sex
Within the Management, Business, Science and Arts occupations in North Brookfield, the most male-oriented occupations are Computers & Mathematics (100.0%), Architecture & Engineering (100.0%), and Arts, Media & Entertainment (70.0%), while the most female-oriented occupations are Life, Physical & Social Science (100.0%), Education, Arts & Media (100.0%), and Legal Services & Support (100.0%).
| Occupation | Male | Female |
| Management | 31 (45.6%) | 37 (54.4%) |
| Business & Financial | 6 (35.3%) | 11 (64.7%) |
| Computers, Engineering & Science | 15 (50.0%) | 15 (50.0%) |
| Computers & Mathematics | 12 (100.0%) | 0 (0.0%) |
| Architecture & Engineering | 3 (100.0%) | 0 (0.0%) |
| Life, Physical & Social Science | 0 (0.0%) | 15 (100.0%) |
| Community & Social Service | 60 (27.5%) | 158 (72.5%) |
| Education, Arts & Media | 0 (0.0%) | 16 (100.0%) |
| Legal Services & Support | 0 (0.0%) | 8 (100.0%) |
| Education Instruction & Library | 32 (20.8%) | 122 (79.2%) |
| Arts, Media & Entertainment | 28 (70.0%) | 12 (30.0%) |
| Health Diagnosing & Treating | 7 (13.7%) | 44 (86.3%) |
| Health Technologists | 0 (0.0%) | 20 (100.0%) |
| Total (Category) | 119 (31.0%) | 265 (69.0%) |
| Total (Overall) | 738 (53.6%) | 639 (46.4%) |
Services Occupations
The most common Services occupations in North Brookfield are Healthcare Support (109 | 7.9%), Personal Care & Service (85 | 6.2%), Cleaning & Maintenance (82 | 5.9%), and Food Preparation & Serving (17 | 1.2%).
Services Occupations by Sex
Within the Services occupations in North Brookfield, the most male-oriented occupations are Cleaning & Maintenance (80.5%), Personal Care & Service (68.2%), and Food Preparation & Serving (29.4%), while the most female-oriented occupations are Healthcare Support (100.0%), Food Preparation & Serving (70.6%), and Personal Care & Service (31.8%).
| Occupation | Male | Female |
| Healthcare Support | 0 (0.0%) | 109 (100.0%) |
| Security & Protection | 0 (0.0%) | 0 (0.0%) |
| Firefighting & Prevention | 0 (0.0%) | 0 (0.0%) |
| Law Enforcement | 0 (0.0%) | 0 (0.0%) |
| Food Preparation & Serving | 5 (29.4%) | 12 (70.6%) |
| Cleaning & Maintenance | 66 (80.5%) | 16 (19.5%) |
| Personal Care & Service | 58 (68.2%) | 27 (31.8%) |
| Total (Category) | 129 (44.0%) | 164 (56.0%) |
| Total (Overall) | 738 (53.6%) | 639 (46.4%) |
Sales and Office Occupations
The most common Sales and Office occupations in North Brookfield are Office & Administration (120 | 8.7%), and Sales & Related (76 | 5.5%).
Sales and Office Occupations by Sex
| Occupation | Male | Female |
| Sales & Related | 34 (44.7%) | 42 (55.3%) |
| Office & Administration | 13 (10.8%) | 107 (89.2%) |
| Total (Category) | 47 (24.0%) | 149 (76.0%) |
| Total (Overall) | 738 (53.6%) | 639 (46.4%) |
Natural Resources, Construction and Maintenance Occupations
The most common Natural Resources, Construction and Maintenance occupations in North Brookfield are Installation, Maintenance & Repair (83 | 6.0%), and Construction & Extraction (29 | 2.1%).
Natural Resources, Construction and Maintenance Occupations by Sex
| Occupation | Male | Female |
| Farming, Fishing & Forestry | 0 (0.0%) | 0 (0.0%) |
| Construction & Extraction | 19 (65.5%) | 10 (34.5%) |
| Installation, Maintenance & Repair | 83 (100.0%) | 0 (0.0%) |
| Total (Category) | 102 (91.1%) | 10 (8.9%) |
| Total (Overall) | 738 (53.6%) | 639 (46.4%) |
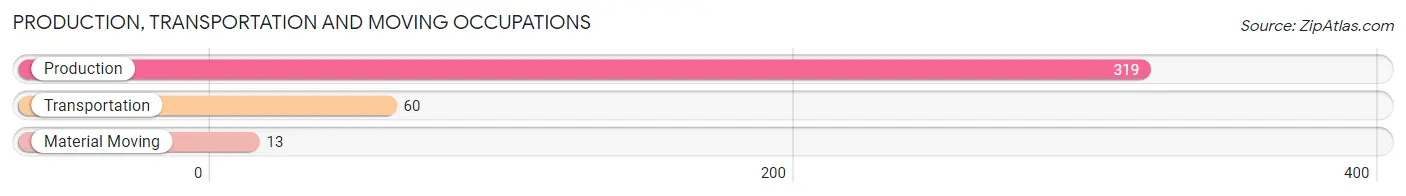
Production, Transportation and Moving Occupations
The most common Production, Transportation and Moving occupations in North Brookfield are Production (319 | 23.2%), Transportation (60 | 4.4%), and Material Moving (13 | 0.9%).
Production, Transportation and Moving Occupations by Sex
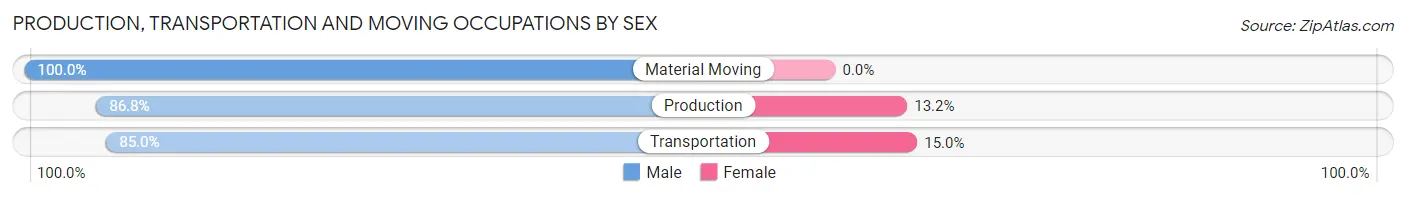
| Occupation | Male | Female |
| Production | 277 (86.8%) | 42 (13.2%) |
| Transportation | 51 (85.0%) | 9 (15.0%) |
| Material Moving | 13 (100.0%) | 0 (0.0%) |
| Total (Category) | 341 (87.0%) | 51 (13.0%) |
| Total (Overall) | 738 (53.6%) | 639 (46.4%) |
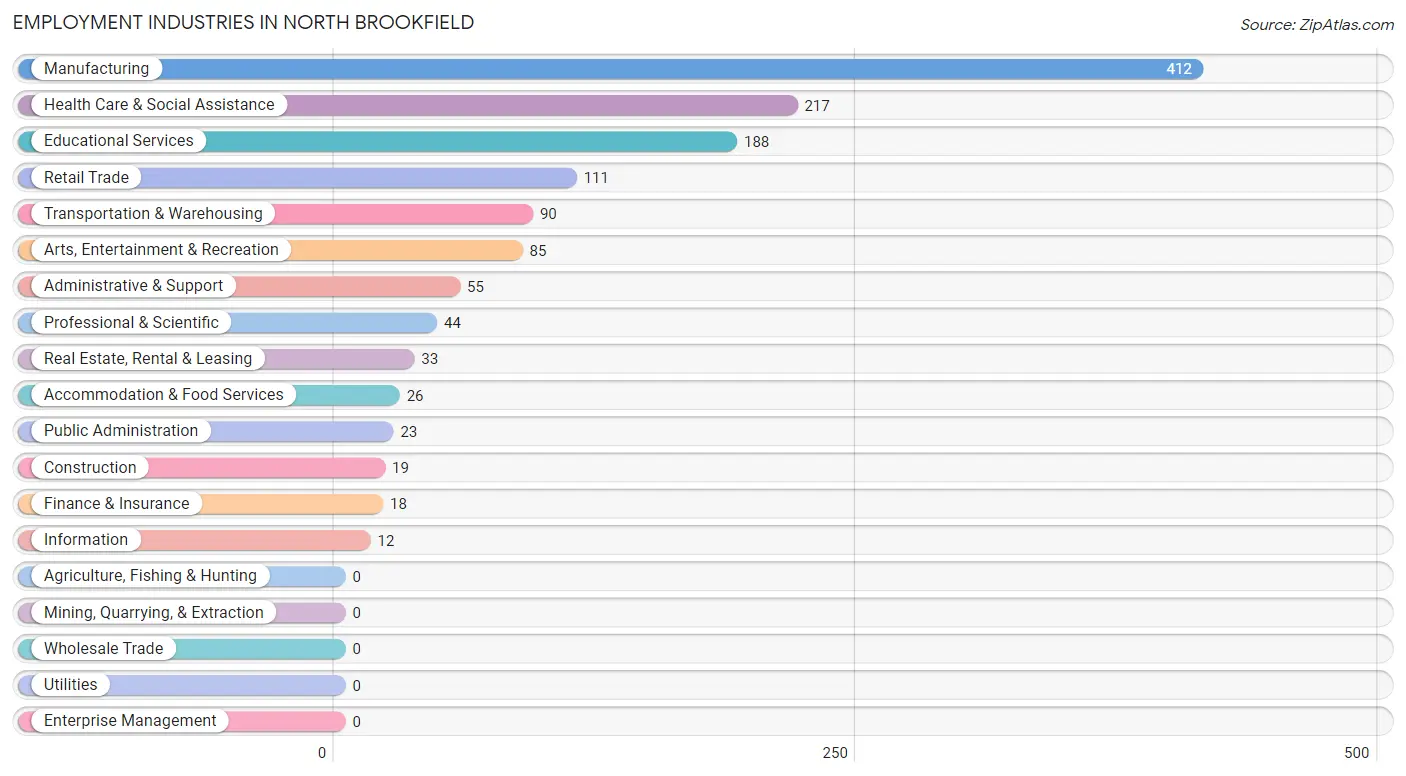
Employment Industries by Sex in North Brookfield
Employment Industries in North Brookfield
The major employment industries in North Brookfield include Manufacturing (412 | 29.9%), Health Care & Social Assistance (217 | 15.8%), Educational Services (188 | 13.7%), Retail Trade (111 | 8.1%), and Transportation & Warehousing (90 | 6.5%).
Employment Industries by Sex in North Brookfield
The North Brookfield industries that see more men than women are Construction (100.0%), Real Estate, Rental & Leasing (100.0%), and Administrative & Support (100.0%), whereas the industries that tend to have a higher number of women are Information (100.0%), Finance & Insurance (100.0%), and Professional & Scientific (100.0%).
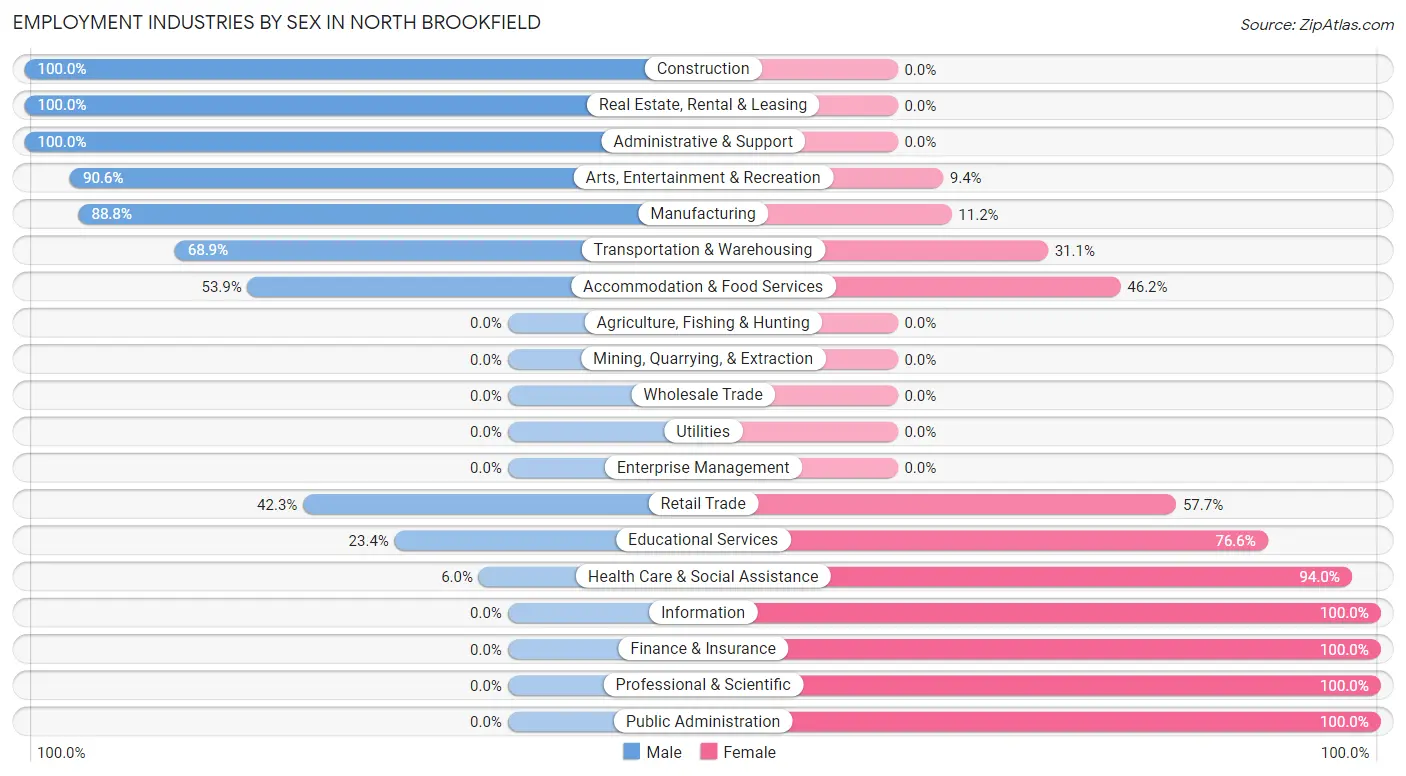
| Industry | Male | Female |
| Agriculture, Fishing & Hunting | 0 (0.0%) | 0 (0.0%) |
| Mining, Quarrying, & Extraction | 0 (0.0%) | 0 (0.0%) |
| Construction | 19 (100.0%) | 0 (0.0%) |
| Manufacturing | 366 (88.8%) | 46 (11.2%) |
| Wholesale Trade | 0 (0.0%) | 0 (0.0%) |
| Retail Trade | 47 (42.3%) | 64 (57.7%) |
| Transportation & Warehousing | 62 (68.9%) | 28 (31.1%) |
| Utilities | 0 (0.0%) | 0 (0.0%) |
| Information | 0 (0.0%) | 12 (100.0%) |
| Finance & Insurance | 0 (0.0%) | 18 (100.0%) |
| Real Estate, Rental & Leasing | 33 (100.0%) | 0 (0.0%) |
| Professional & Scientific | 0 (0.0%) | 44 (100.0%) |
| Enterprise Management | 0 (0.0%) | 0 (0.0%) |
| Administrative & Support | 55 (100.0%) | 0 (0.0%) |
| Educational Services | 44 (23.4%) | 144 (76.6%) |
| Health Care & Social Assistance | 13 (6.0%) | 204 (94.0%) |
| Arts, Entertainment & Recreation | 77 (90.6%) | 8 (9.4%) |
| Accommodation & Food Services | 14 (53.8%) | 12 (46.2%) |
| Public Administration | 0 (0.0%) | 23 (100.0%) |
| Total | 738 (53.6%) | 639 (46.4%) |
Education in North Brookfield
School Enrollment in North Brookfield
The most common levels of schooling among the 567 students in North Brookfield are middle school (203 | 35.8%), high school (170 | 30.0%), and college / undergraduate (95 | 16.8%).
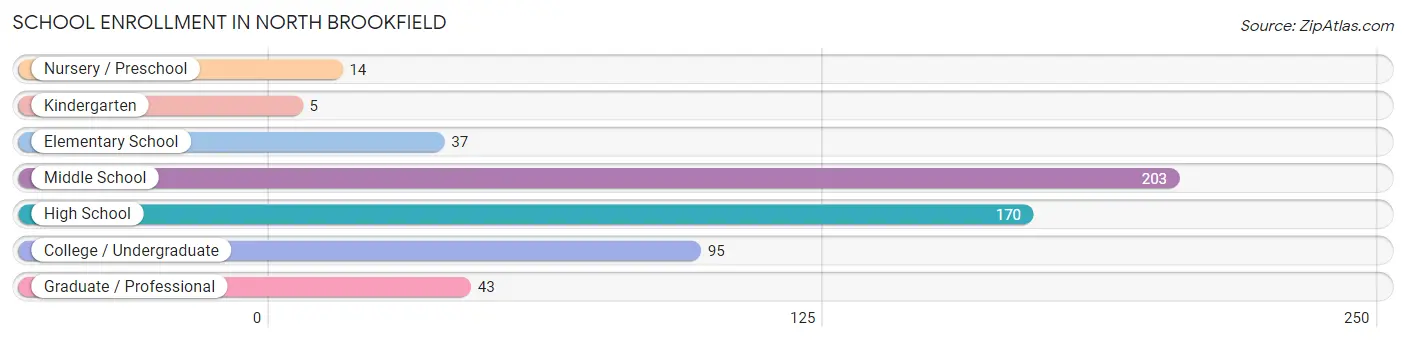
| School Level | # Students | % Students |
| Nursery / Preschool | 14 | 2.5% |
| Kindergarten | 5 | 0.9% |
| Elementary School | 37 | 6.5% |
| Middle School | 203 | 35.8% |
| High School | 170 | 30.0% |
| College / Undergraduate | 95 | 16.8% |
| Graduate / Professional | 43 | 7.6% |
| Total | 567 | 100.0% |
School Enrollment by Age by Funding Source in North Brookfield
Out of a total of 567 students who are enrolled in schools in North Brookfield, 123 (21.7%) attend a private institution, while the remaining 444 (78.3%) are enrolled in public schools. The age group of 3 to 4 year olds has the highest likelihood of being enrolled in private schools, with 14 (100.0% in the age bracket) enrolled. Conversely, the age group of 10 to 14 year olds has the lowest likelihood of being enrolled in a private school, with 208 (100.0% in the age bracket) attending a public institution.
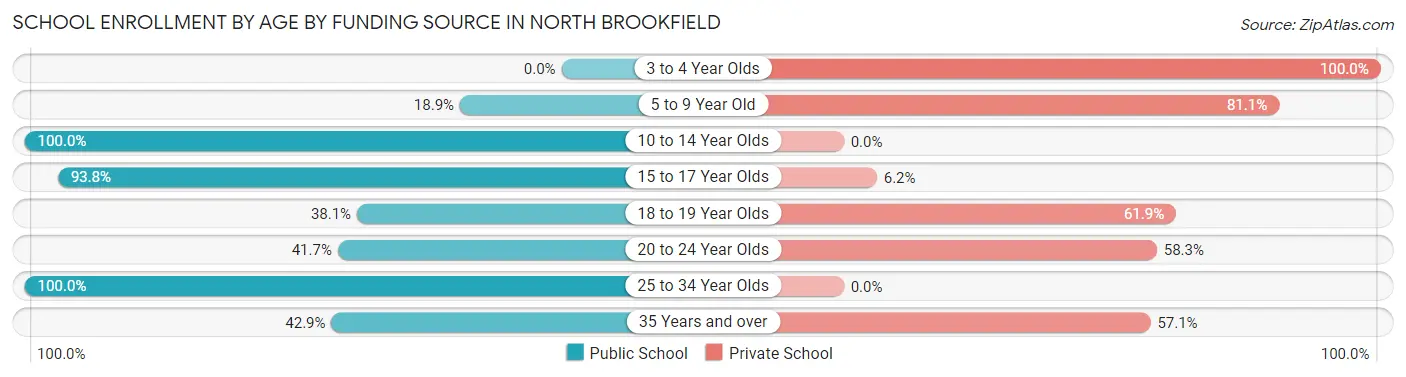
| Age Bracket | Public School | Private School |
| 3 to 4 Year Olds | 0 (0.0%) | 14 (100.0%) |
| 5 to 9 Year Old | 7 (18.9%) | 30 (81.1%) |
| 10 to 14 Year Olds | 208 (100.0%) | 0 (0.0%) |
| 15 to 17 Year Olds | 152 (93.8%) | 10 (6.2%) |
| 18 to 19 Year Olds | 8 (38.1%) | 13 (61.9%) |
| 20 to 24 Year Olds | 20 (41.7%) | 28 (58.3%) |
| 25 to 34 Year Olds | 28 (100.0%) | 0 (0.0%) |
| 35 Years and over | 21 (42.9%) | 28 (57.1%) |
| Total | 444 (78.3%) | 123 (21.7%) |
Educational Attainment by Field of Study in North Brookfield
Education (92 | 20.7%), business (75 | 16.9%), literature & languages (67 | 15.1%), computers & mathematics (51 | 11.5%), and social sciences (41 | 9.2%) are the most common fields of study among 445 individuals in North Brookfield who have obtained a bachelor's degree or higher.
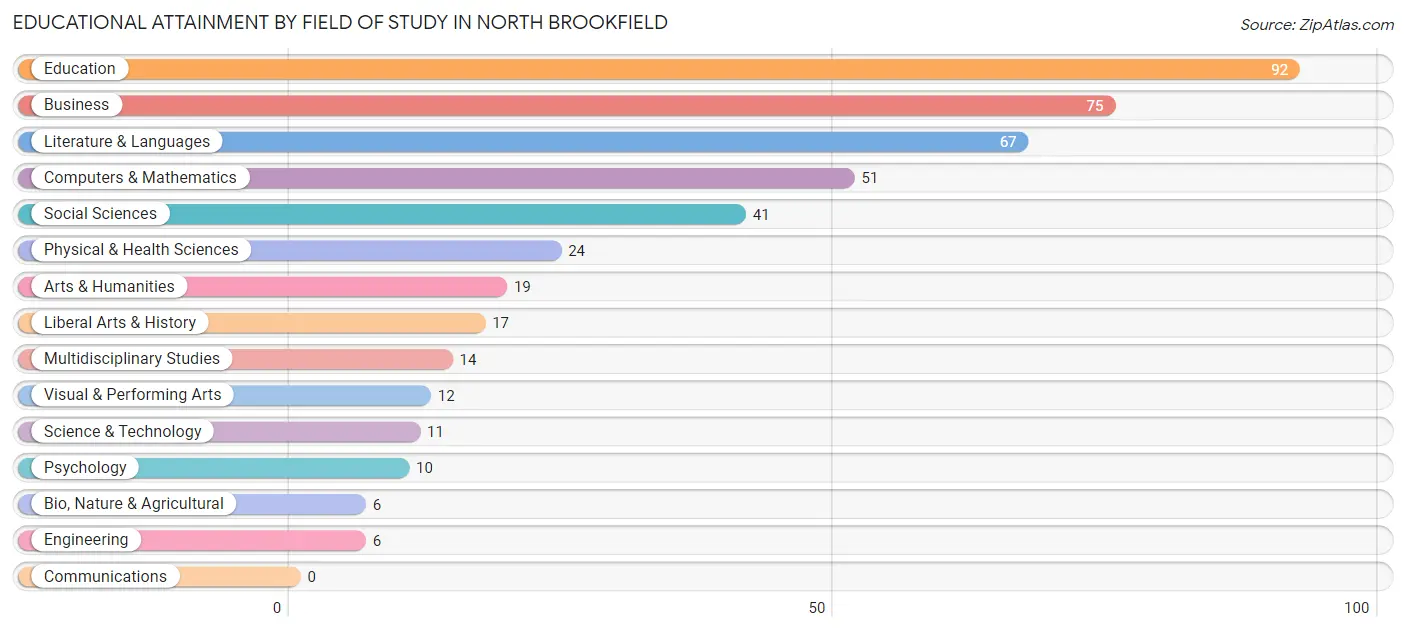
| Field of Study | # Graduates | % Graduates |
| Computers & Mathematics | 51 | 11.5% |
| Bio, Nature & Agricultural | 6 | 1.3% |
| Physical & Health Sciences | 24 | 5.4% |
| Psychology | 10 | 2.2% |
| Social Sciences | 41 | 9.2% |
| Engineering | 6 | 1.3% |
| Multidisciplinary Studies | 14 | 3.2% |
| Science & Technology | 11 | 2.5% |
| Business | 75 | 16.9% |
| Education | 92 | 20.7% |
| Literature & Languages | 67 | 15.1% |
| Liberal Arts & History | 17 | 3.8% |
| Visual & Performing Arts | 12 | 2.7% |
| Communications | 0 | 0.0% |
| Arts & Humanities | 19 | 4.3% |
| Total | 445 | 100.0% |
Transportation & Commute in North Brookfield
Vehicle Availability by Sex in North Brookfield
The most prevalent vehicle ownership categories in North Brookfield are males with 1 vehicle (367, accounting for 49.9%) and females with 1 vehicle (236, making up 57.4%).
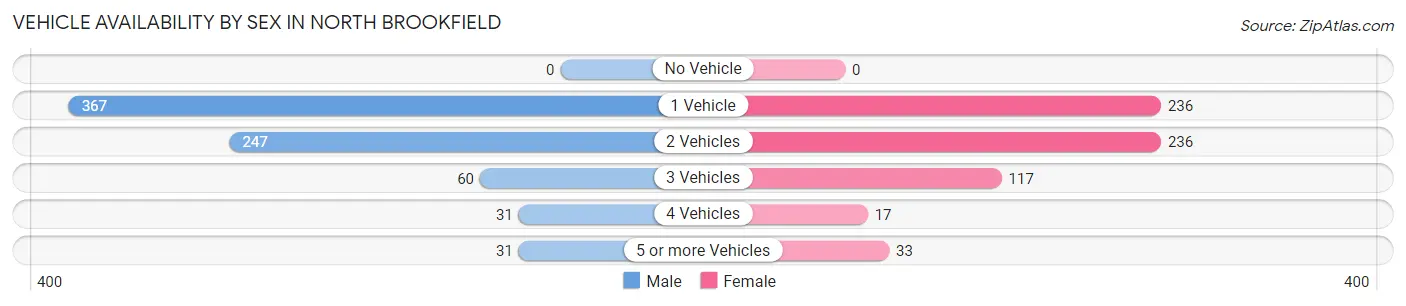
| Vehicles Available | Male | Female |
| No Vehicle | 0 (0.0%) | 0 (0.0%) |
| 1 Vehicle | 367 (49.9%) | 236 (36.9%) |
| 2 Vehicles | 247 (33.6%) | 236 (36.9%) |
| 3 Vehicles | 60 (8.2%) | 117 (18.3%) |
| 4 Vehicles | 31 (4.2%) | 17 (2.7%) |
| 5 or more Vehicles | 31 (4.2%) | 33 (5.2%) |
| Total | 736 (100.0%) | 639 (100.0%) |
Commute Time in North Brookfield
The most frequently occuring commute durations in North Brookfield are 45 to 59 minutes (267 commuters, 20.3%), 60 to 89 minutes (225 commuters, 17.1%), and 10 to 14 minutes (170 commuters, 12.9%).
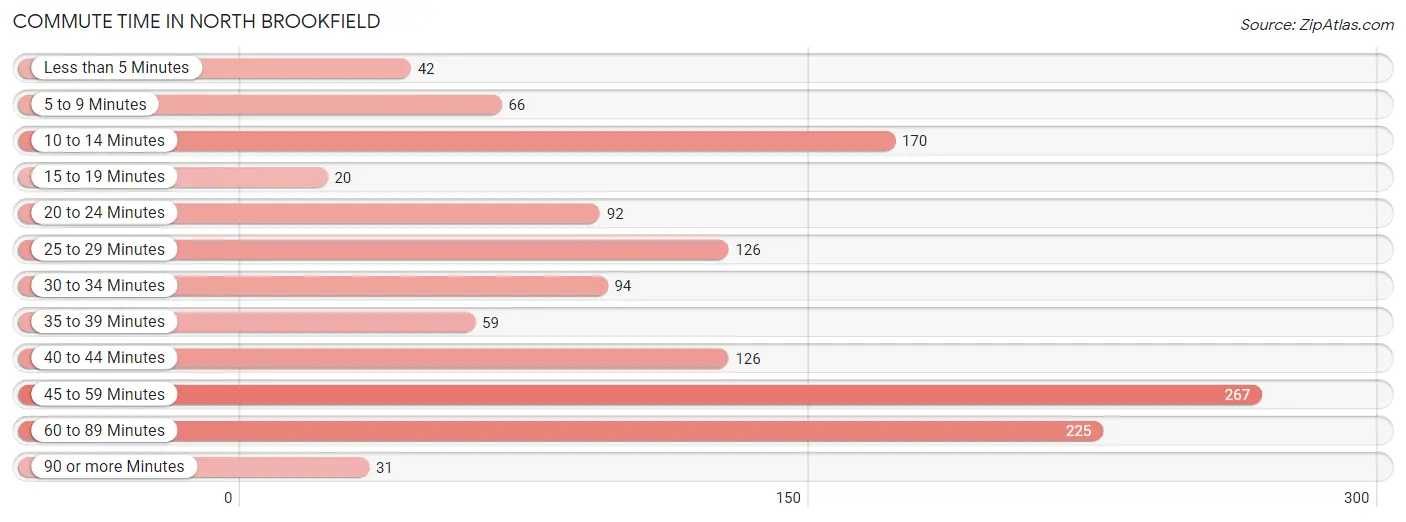
| Commute Time | # Commuters | % Commuters |
| Less than 5 Minutes | 42 | 3.2% |
| 5 to 9 Minutes | 66 | 5.0% |
| 10 to 14 Minutes | 170 | 12.9% |
| 15 to 19 Minutes | 20 | 1.5% |
| 20 to 24 Minutes | 92 | 7.0% |
| 25 to 29 Minutes | 126 | 9.6% |
| 30 to 34 Minutes | 94 | 7.1% |
| 35 to 39 Minutes | 59 | 4.5% |
| 40 to 44 Minutes | 126 | 9.6% |
| 45 to 59 Minutes | 267 | 20.3% |
| 60 to 89 Minutes | 225 | 17.1% |
| 90 or more Minutes | 31 | 2.4% |
Commute Time by Sex in North Brookfield
The most common commute times in North Brookfield are 60 to 89 minutes (201 commuters, 28.6%) for males and 45 to 59 minutes (186 commuters, 30.2%) for females.
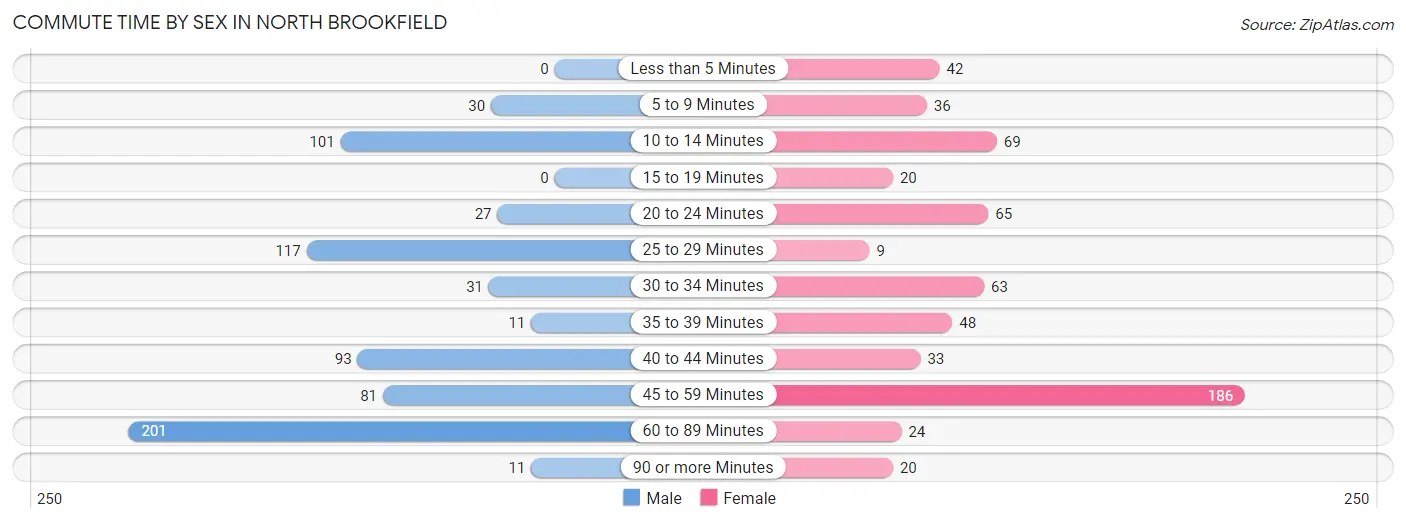
| Commute Time | Male | Female |
| Less than 5 Minutes | 0 (0.0%) | 42 (6.8%) |
| 5 to 9 Minutes | 30 (4.3%) | 36 (5.9%) |
| 10 to 14 Minutes | 101 (14.4%) | 69 (11.2%) |
| 15 to 19 Minutes | 0 (0.0%) | 20 (3.3%) |
| 20 to 24 Minutes | 27 (3.8%) | 65 (10.6%) |
| 25 to 29 Minutes | 117 (16.6%) | 9 (1.5%) |
| 30 to 34 Minutes | 31 (4.4%) | 63 (10.2%) |
| 35 to 39 Minutes | 11 (1.6%) | 48 (7.8%) |
| 40 to 44 Minutes | 93 (13.2%) | 33 (5.4%) |
| 45 to 59 Minutes | 81 (11.5%) | 186 (30.2%) |
| 60 to 89 Minutes | 201 (28.6%) | 24 (3.9%) |
| 90 or more Minutes | 11 (1.6%) | 20 (3.3%) |
Time of Departure to Work by Sex in North Brookfield
The most frequent times of departure to work in North Brookfield are 6:00 AM to 6:29 AM (213, 30.3%) for males and 7:30 AM to 7:59 AM (160, 26.0%) for females.
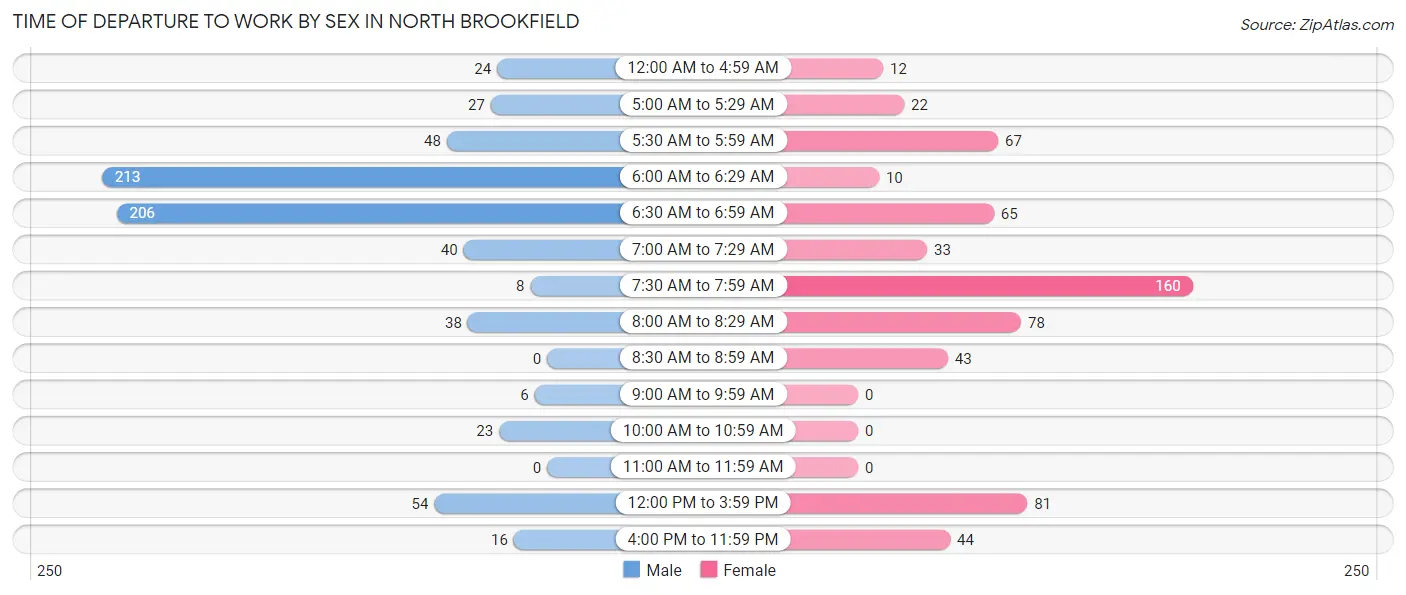
| Time of Departure | Male | Female |
| 12:00 AM to 4:59 AM | 24 (3.4%) | 12 (1.9%) |
| 5:00 AM to 5:29 AM | 27 (3.8%) | 22 (3.6%) |
| 5:30 AM to 5:59 AM | 48 (6.8%) | 67 (10.9%) |
| 6:00 AM to 6:29 AM | 213 (30.3%) | 10 (1.6%) |
| 6:30 AM to 6:59 AM | 206 (29.3%) | 65 (10.6%) |
| 7:00 AM to 7:29 AM | 40 (5.7%) | 33 (5.4%) |
| 7:30 AM to 7:59 AM | 8 (1.1%) | 160 (26.0%) |
| 8:00 AM to 8:29 AM | 38 (5.4%) | 78 (12.7%) |
| 8:30 AM to 8:59 AM | 0 (0.0%) | 43 (7.0%) |
| 9:00 AM to 9:59 AM | 6 (0.9%) | 0 (0.0%) |
| 10:00 AM to 10:59 AM | 23 (3.3%) | 0 (0.0%) |
| 11:00 AM to 11:59 AM | 0 (0.0%) | 0 (0.0%) |
| 12:00 PM to 3:59 PM | 54 (7.7%) | 81 (13.2%) |
| 4:00 PM to 11:59 PM | 16 (2.3%) | 44 (7.1%) |
| Total | 703 (100.0%) | 615 (100.0%) |
Housing Occupancy in North Brookfield
Occupancy by Ownership in North Brookfield
Of the total 993 dwellings in North Brookfield, owner-occupied units account for 502 (50.5%), while renter-occupied units make up 491 (49.4%).
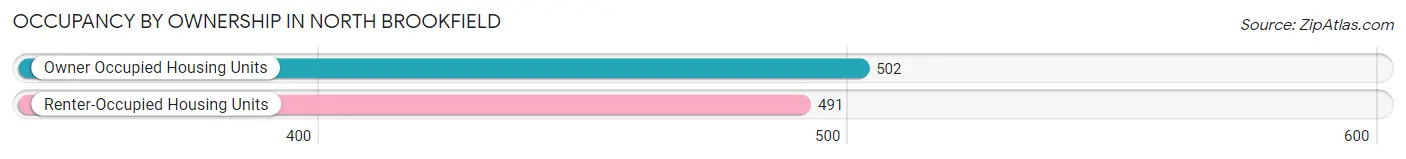
| Occupancy | # Housing Units | % Housing Units |
| Owner Occupied Housing Units | 502 | 50.5% |
| Renter-Occupied Housing Units | 491 | 49.4% |
| Total Occupied Housing Units | 993 | 100.0% |
Occupancy by Household Size in North Brookfield
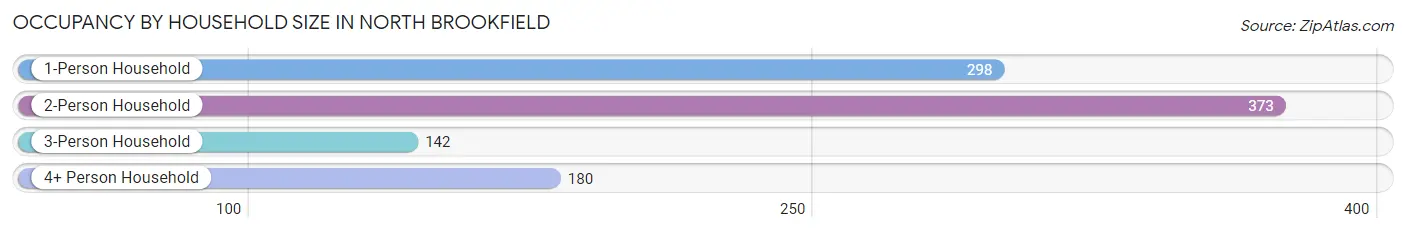
| Household Size | # Housing Units | % Housing Units |
| 1-Person Household | 298 | 30.0% |
| 2-Person Household | 373 | 37.6% |
| 3-Person Household | 142 | 14.3% |
| 4+ Person Household | 180 | 18.1% |
| Total Housing Units | 993 | 100.0% |
Occupancy by Ownership by Household Size in North Brookfield
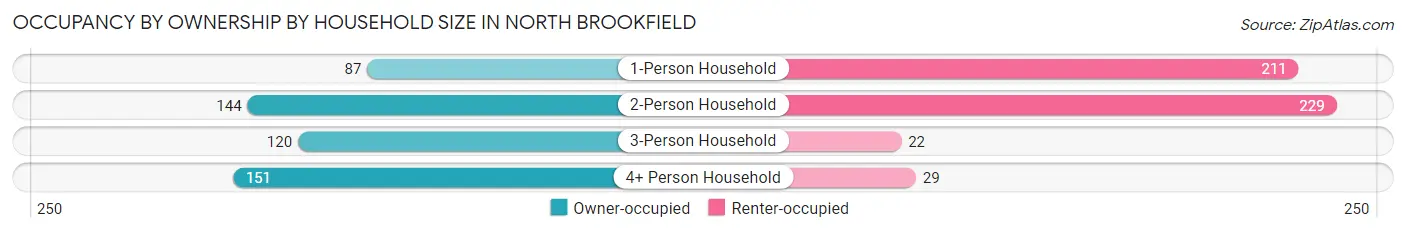
| Household Size | Owner-occupied | Renter-occupied |
| 1-Person Household | 87 (29.2%) | 211 (70.8%) |
| 2-Person Household | 144 (38.6%) | 229 (61.4%) |
| 3-Person Household | 120 (84.5%) | 22 (15.5%) |
| 4+ Person Household | 151 (83.9%) | 29 (16.1%) |
| Total Housing Units | 502 (50.5%) | 491 (49.4%) |
Occupancy by Educational Attainment in North Brookfield
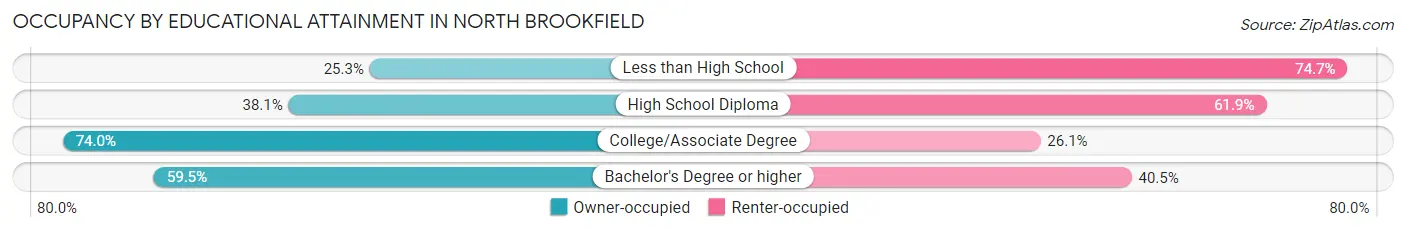
| Household Size | Owner-occupied | Renter-occupied |
| Less than High School | 24 (25.3%) | 71 (74.7%) |
| High School Diploma | 156 (38.1%) | 253 (61.9%) |
| College/Associate Degree | 159 (74.0%) | 56 (26.1%) |
| Bachelor's Degree or higher | 163 (59.5%) | 111 (40.5%) |
Occupancy by Age of Householder in North Brookfield
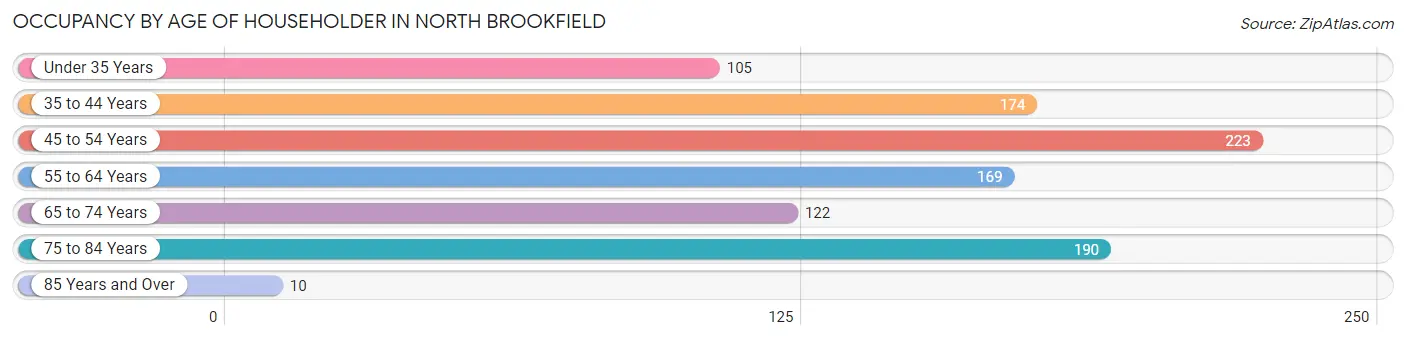
| Age Bracket | # Households | % Households |
| Under 35 Years | 105 | 10.6% |
| 35 to 44 Years | 174 | 17.5% |
| 45 to 54 Years | 223 | 22.5% |
| 55 to 64 Years | 169 | 17.0% |
| 65 to 74 Years | 122 | 12.3% |
| 75 to 84 Years | 190 | 19.1% |
| 85 Years and Over | 10 | 1.0% |
| Total | 993 | 100.0% |
Housing Finances in North Brookfield
Median Income by Occupancy in North Brookfield
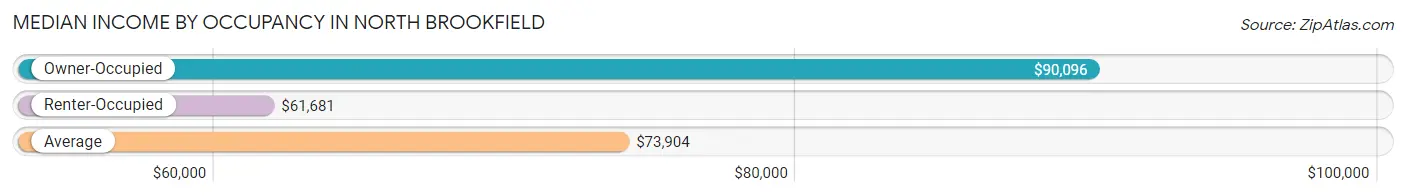
| Occupancy Type | # Households | Median Income |
| Owner-Occupied | 502 (50.5%) | $90,096 |
| Renter-Occupied | 491 (49.4%) | $61,681 |
| Average | 993 (100.0%) | $73,904 |
Occupancy by Householder Income Bracket in North Brookfield
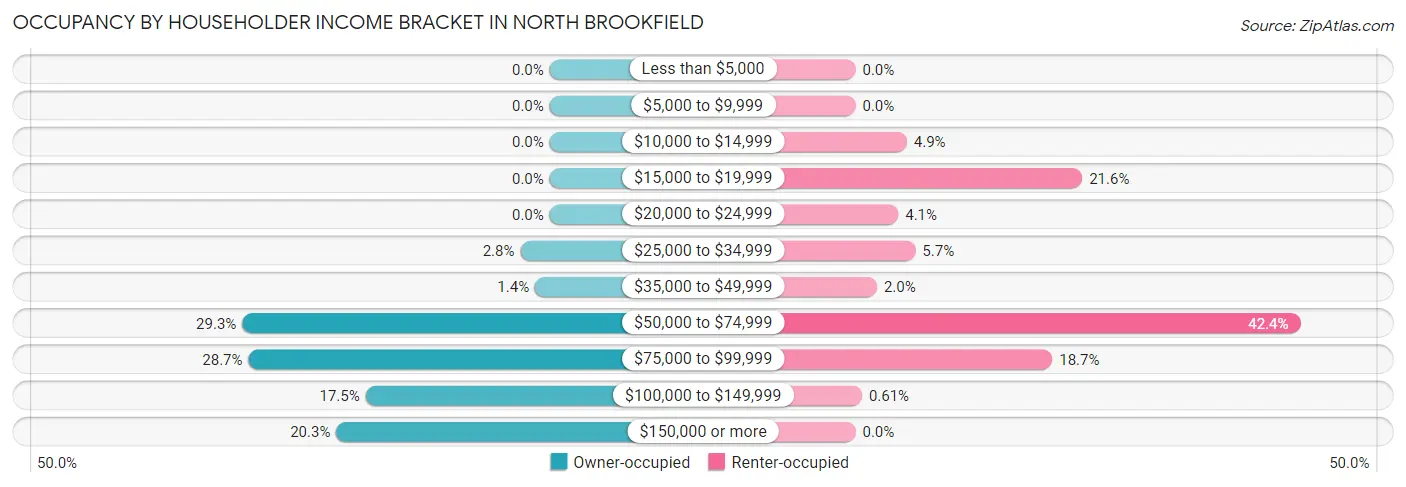
| Income Bracket | Owner-occupied | Renter-occupied |
| Less than $5,000 | 0 (0.0%) | 0 (0.0%) |
| $5,000 to $9,999 | 0 (0.0%) | 0 (0.0%) |
| $10,000 to $14,999 | 0 (0.0%) | 24 (4.9%) |
| $15,000 to $19,999 | 0 (0.0%) | 106 (21.6%) |
| $20,000 to $24,999 | 0 (0.0%) | 20 (4.1%) |
| $25,000 to $34,999 | 14 (2.8%) | 28 (5.7%) |
| $35,000 to $49,999 | 7 (1.4%) | 10 (2.0%) |
| $50,000 to $74,999 | 147 (29.3%) | 208 (42.4%) |
| $75,000 to $99,999 | 144 (28.7%) | 92 (18.7%) |
| $100,000 to $149,999 | 88 (17.5%) | 3 (0.6%) |
| $150,000 or more | 102 (20.3%) | 0 (0.0%) |
| Total | 502 (100.0%) | 491 (100.0%) |
Monthly Housing Cost Tiers in North Brookfield
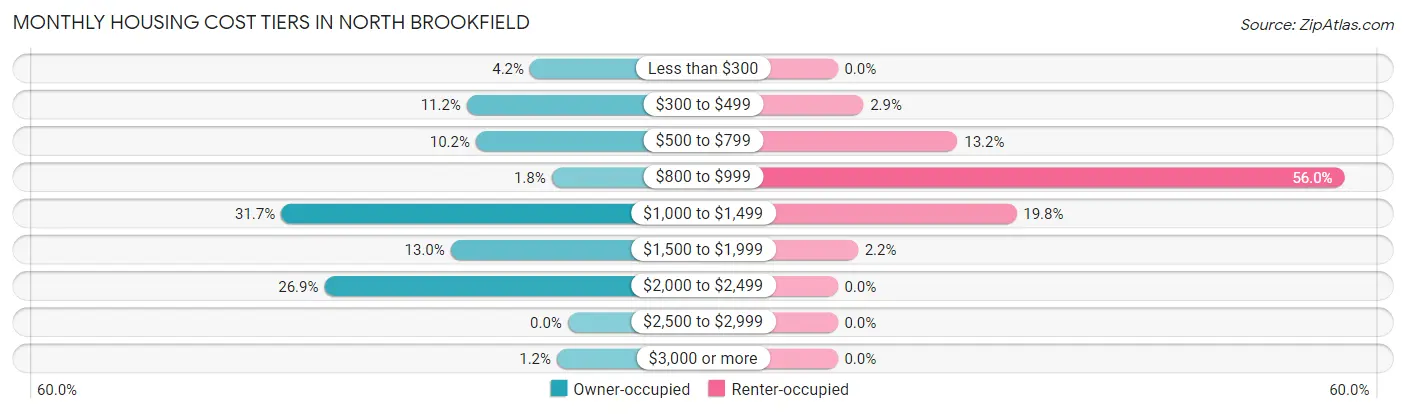
| Monthly Cost | Owner-occupied | Renter-occupied |
| Less than $300 | 21 (4.2%) | 0 (0.0%) |
| $300 to $499 | 56 (11.2%) | 14 (2.9%) |
| $500 to $799 | 51 (10.2%) | 65 (13.2%) |
| $800 to $999 | 9 (1.8%) | 275 (56.0%) |
| $1,000 to $1,499 | 159 (31.7%) | 97 (19.8%) |
| $1,500 to $1,999 | 65 (13.0%) | 11 (2.2%) |
| $2,000 to $2,499 | 135 (26.9%) | 0 (0.0%) |
| $2,500 to $2,999 | 0 (0.0%) | 0 (0.0%) |
| $3,000 or more | 6 (1.2%) | 0 (0.0%) |
| Total | 502 (100.0%) | 491 (100.0%) |
Physical Housing Characteristics in North Brookfield
Housing Structures in North Brookfield
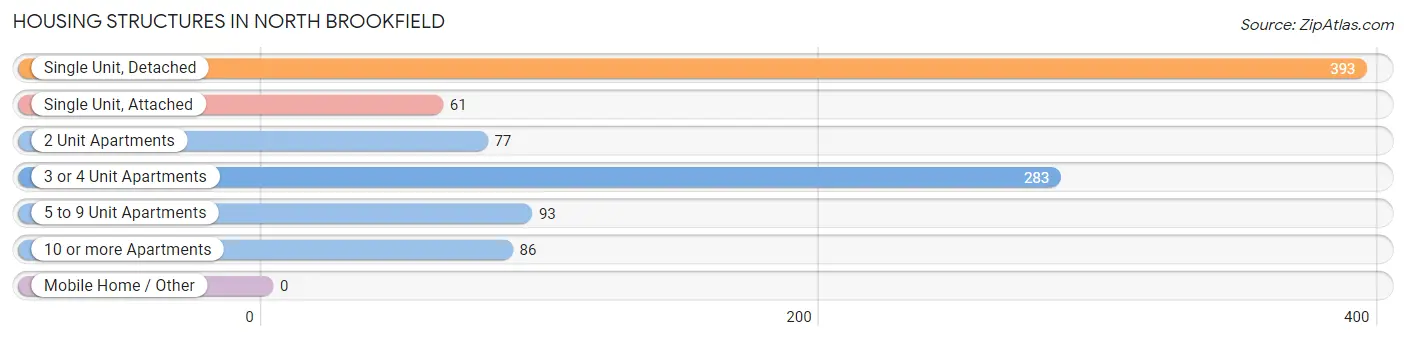
| Structure Type | # Housing Units | % Housing Units |
| Single Unit, Detached | 393 | 39.6% |
| Single Unit, Attached | 61 | 6.1% |
| 2 Unit Apartments | 77 | 7.7% |
| 3 or 4 Unit Apartments | 283 | 28.5% |
| 5 to 9 Unit Apartments | 93 | 9.4% |
| 10 or more Apartments | 86 | 8.7% |
| Mobile Home / Other | 0 | 0.0% |
| Total | 993 | 100.0% |
Housing Structures by Occupancy in North Brookfield
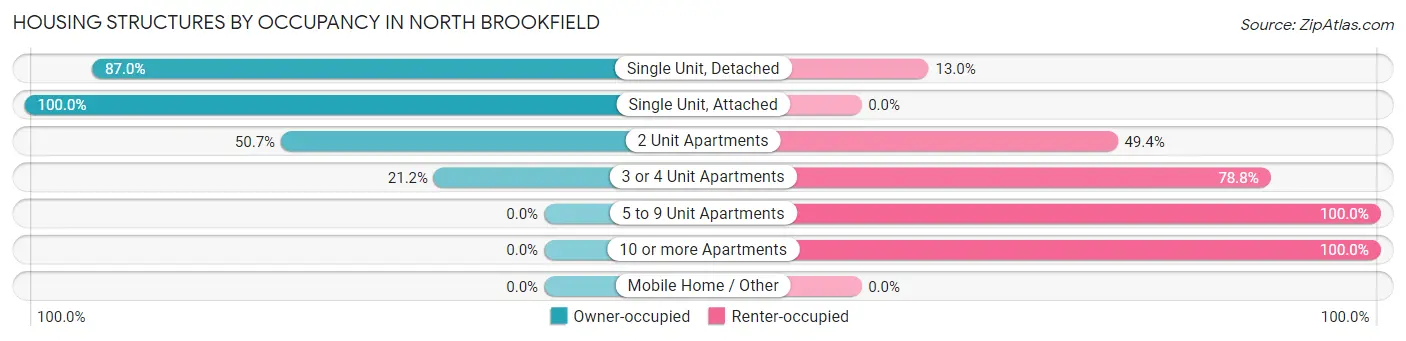
| Structure Type | Owner-occupied | Renter-occupied |
| Single Unit, Detached | 342 (87.0%) | 51 (13.0%) |
| Single Unit, Attached | 61 (100.0%) | 0 (0.0%) |
| 2 Unit Apartments | 39 (50.6%) | 38 (49.3%) |
| 3 or 4 Unit Apartments | 60 (21.2%) | 223 (78.8%) |
| 5 to 9 Unit Apartments | 0 (0.0%) | 93 (100.0%) |
| 10 or more Apartments | 0 (0.0%) | 86 (100.0%) |
| Mobile Home / Other | 0 (0.0%) | 0 (0.0%) |
| Total | 502 (50.5%) | 491 (49.4%) |
Housing Structures by Number of Rooms in North Brookfield
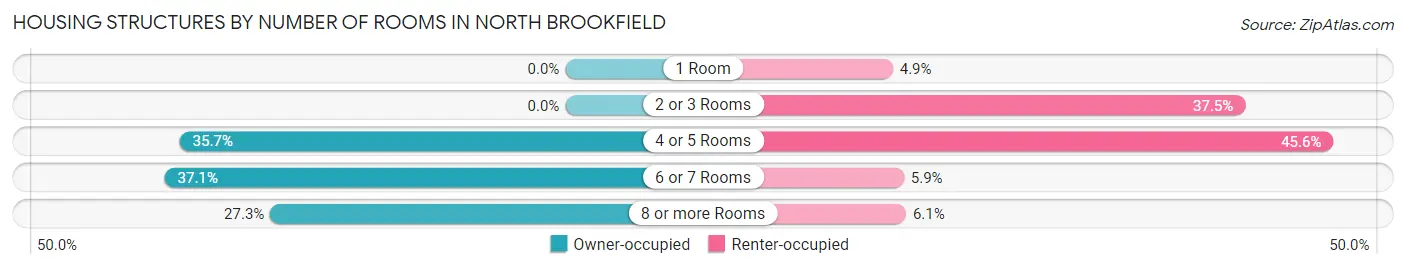
| Number of Rooms | Owner-occupied | Renter-occupied |
| 1 Room | 0 (0.0%) | 24 (4.9%) |
| 2 or 3 Rooms | 0 (0.0%) | 184 (37.5%) |
| 4 or 5 Rooms | 179 (35.7%) | 224 (45.6%) |
| 6 or 7 Rooms | 186 (37.0%) | 29 (5.9%) |
| 8 or more Rooms | 137 (27.3%) | 30 (6.1%) |
| Total | 502 (100.0%) | 491 (100.0%) |
Housing Structure by Heating Type in North Brookfield
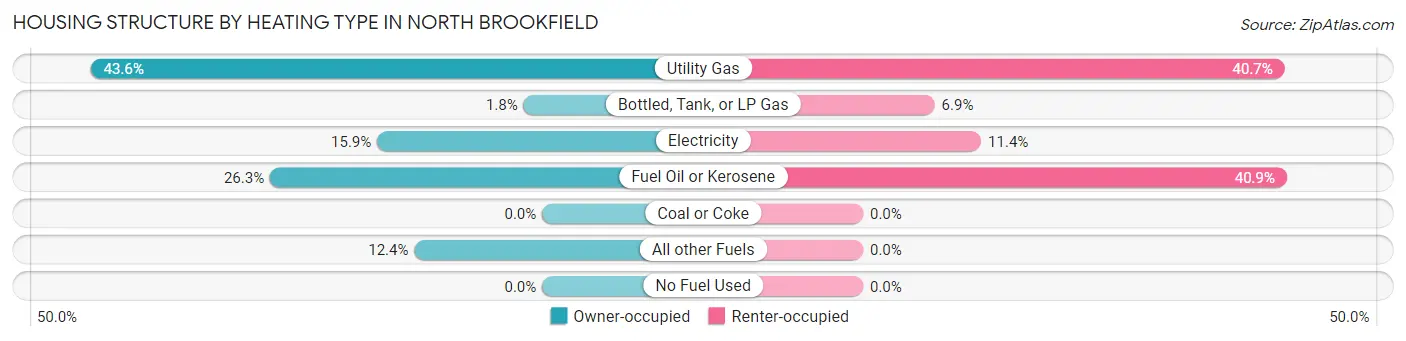
| Heating Type | Owner-occupied | Renter-occupied |
| Utility Gas | 219 (43.6%) | 200 (40.7%) |
| Bottled, Tank, or LP Gas | 9 (1.8%) | 34 (6.9%) |
| Electricity | 80 (15.9%) | 56 (11.4%) |
| Fuel Oil or Kerosene | 132 (26.3%) | 201 (40.9%) |
| Coal or Coke | 0 (0.0%) | 0 (0.0%) |
| All other Fuels | 62 (12.3%) | 0 (0.0%) |
| No Fuel Used | 0 (0.0%) | 0 (0.0%) |
| Total | 502 (100.0%) | 491 (100.0%) |
Household Vehicle Usage in North Brookfield
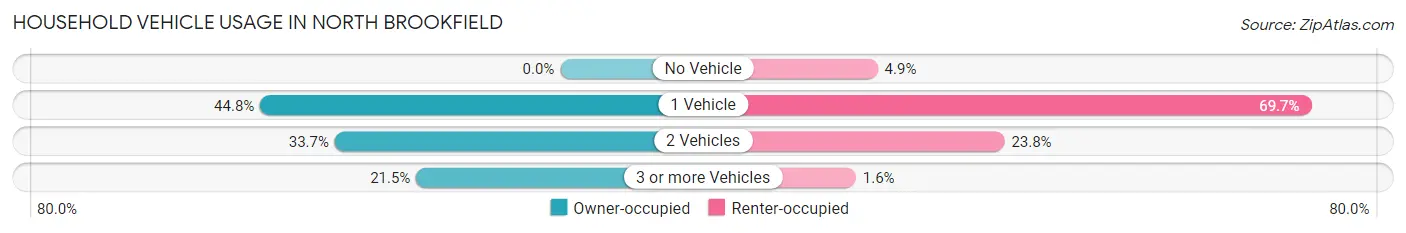
| Vehicles per Household | Owner-occupied | Renter-occupied |
| No Vehicle | 0 (0.0%) | 24 (4.9%) |
| 1 Vehicle | 225 (44.8%) | 342 (69.7%) |
| 2 Vehicles | 169 (33.7%) | 117 (23.8%) |
| 3 or more Vehicles | 108 (21.5%) | 8 (1.6%) |
| Total | 502 (100.0%) | 491 (100.0%) |
Real Estate & Mortgages in North Brookfield
Real Estate and Mortgage Overview in North Brookfield
| Characteristic | Without Mortgage | With Mortgage |
| Housing Units | 150 | 352 |
| Median Property Value | $233,100 | $221,400 |
| Median Household Income | $86,167 | $82 |
| Monthly Housing Costs | $496 | $0 |
| Real Estate Taxes | $2,438 | $0 |
Property Value by Mortgage Status in North Brookfield
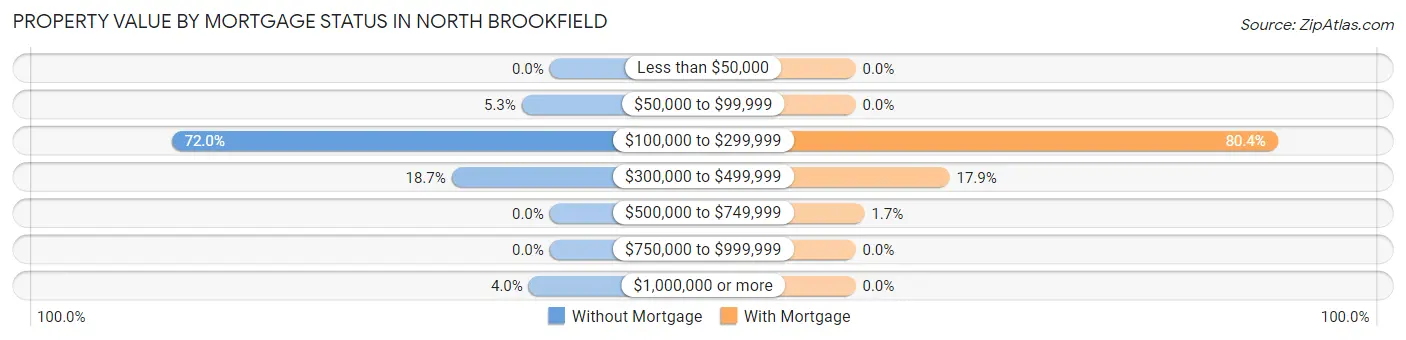
| Property Value | Without Mortgage | With Mortgage |
| Less than $50,000 | 0 (0.0%) | 0 (0.0%) |
| $50,000 to $99,999 | 8 (5.3%) | 0 (0.0%) |
| $100,000 to $299,999 | 108 (72.0%) | 283 (80.4%) |
| $300,000 to $499,999 | 28 (18.7%) | 63 (17.9%) |
| $500,000 to $749,999 | 0 (0.0%) | 6 (1.7%) |
| $750,000 to $999,999 | 0 (0.0%) | 0 (0.0%) |
| $1,000,000 or more | 6 (4.0%) | 0 (0.0%) |
| Total | 150 (100.0%) | 352 (100.0%) |
Household Income by Mortgage Status in North Brookfield
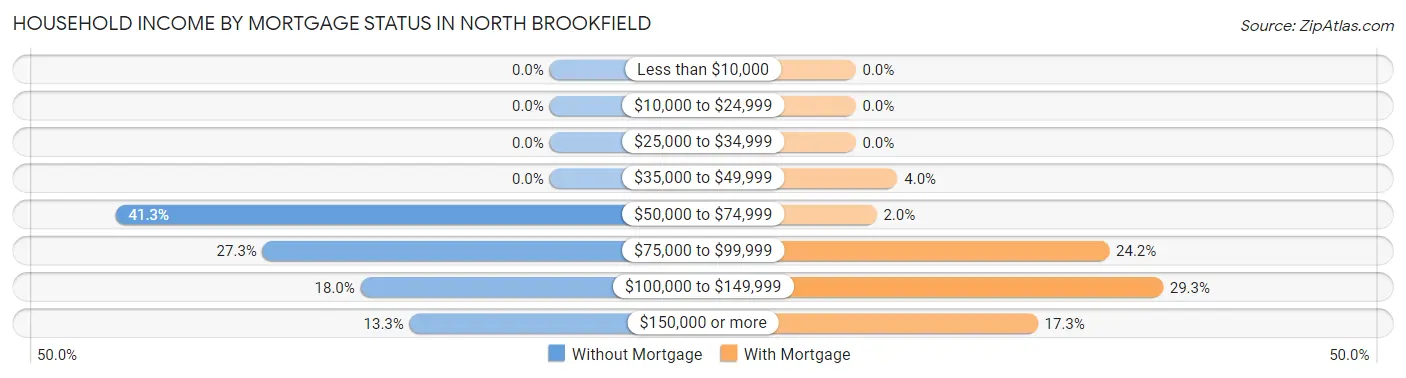
| Household Income | Without Mortgage | With Mortgage |
| Less than $10,000 | 0 (0.0%) | 0 (0.0%) |
| $10,000 to $24,999 | 0 (0.0%) | 0 (0.0%) |
| $25,000 to $34,999 | 0 (0.0%) | 0 (0.0%) |
| $35,000 to $49,999 | 0 (0.0%) | 14 (4.0%) |
| $50,000 to $74,999 | 62 (41.3%) | 7 (2.0%) |
| $75,000 to $99,999 | 41 (27.3%) | 85 (24.1%) |
| $100,000 to $149,999 | 27 (18.0%) | 103 (29.3%) |
| $150,000 or more | 20 (13.3%) | 61 (17.3%) |
| Total | 150 (100.0%) | 352 (100.0%) |
Property Value to Household Income Ratio in North Brookfield
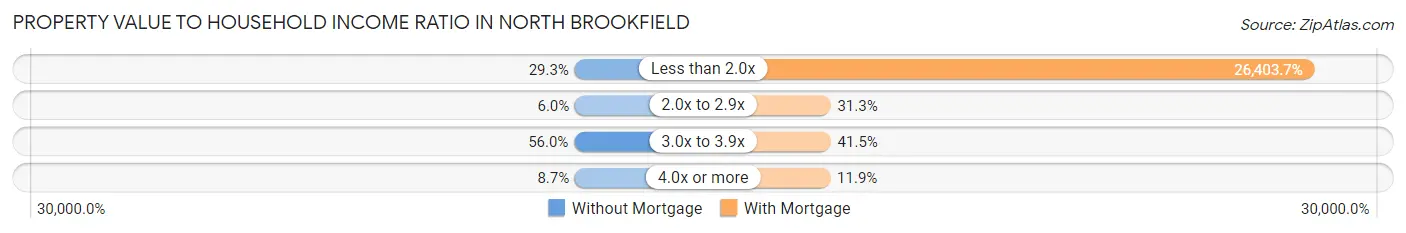
| Value-to-Income Ratio | Without Mortgage | With Mortgage |
| Less than 2.0x | 44 (29.3%) | 92,941 (26,403.7%) |
| 2.0x to 2.9x | 9 (6.0%) | 110 (31.2%) |
| 3.0x to 3.9x | 84 (56.0%) | 146 (41.5%) |
| 4.0x or more | 13 (8.7%) | 42 (11.9%) |
| Total | 150 (100.0%) | 352 (100.0%) |
Real Estate Taxes by Mortgage Status in North Brookfield
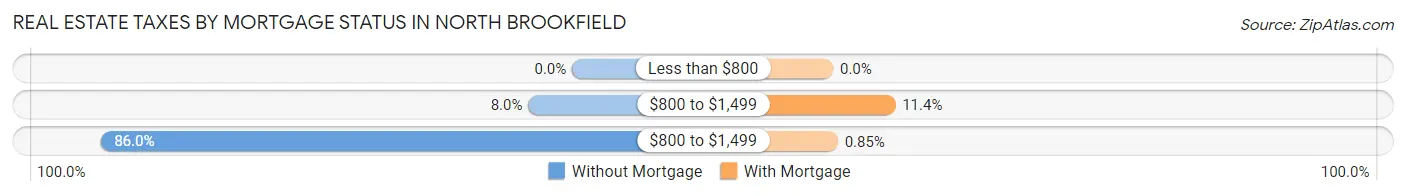
| Property Taxes | Without Mortgage | With Mortgage |
| Less than $800 | 0 (0.0%) | 0 (0.0%) |
| $800 to $1,499 | 12 (8.0%) | 40 (11.4%) |
| $800 to $1,499 | 129 (86.0%) | 3 (0.9%) |
| Total | 150 (100.0%) | 352 (100.0%) |
Health & Disability in North Brookfield
Health Insurance Coverage by Age in North Brookfield
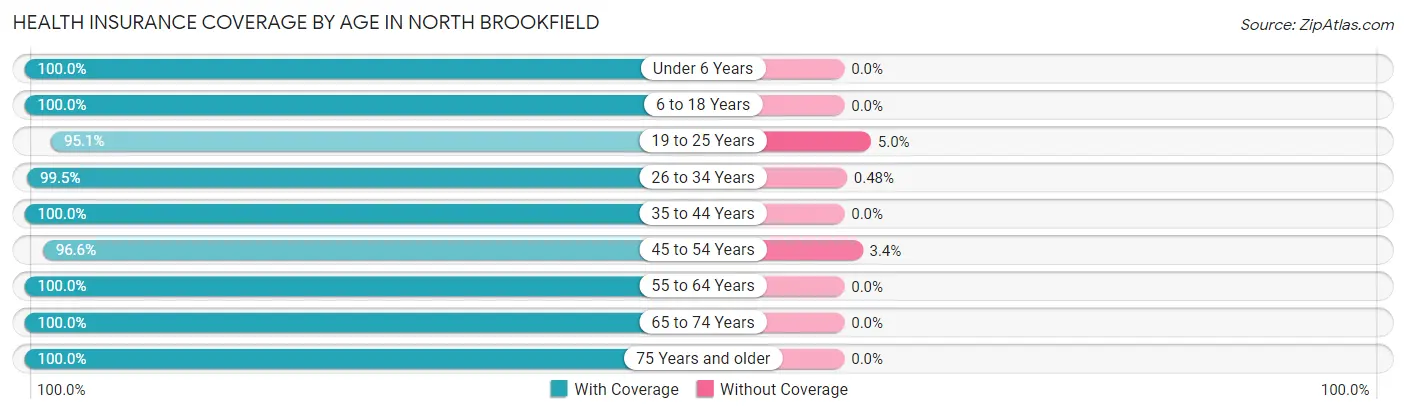
| Age Bracket | With Coverage | Without Coverage |
| Under 6 Years | 82 (100.0%) | 0 (0.0%) |
| 6 to 18 Years | 432 (100.0%) | 0 (0.0%) |
| 19 to 25 Years | 192 (95.1%) | 10 (5.0%) |
| 26 to 34 Years | 209 (99.5%) | 1 (0.5%) |
| 35 to 44 Years | 303 (100.0%) | 0 (0.0%) |
| 45 to 54 Years | 341 (96.6%) | 12 (3.4%) |
| 55 to 64 Years | 425 (100.0%) | 0 (0.0%) |
| 65 to 74 Years | 213 (100.0%) | 0 (0.0%) |
| 75 Years and older | 217 (100.0%) | 0 (0.0%) |
| Total | 2,414 (99.1%) | 23 (0.9%) |
Health Insurance Coverage by Citizenship Status in North Brookfield
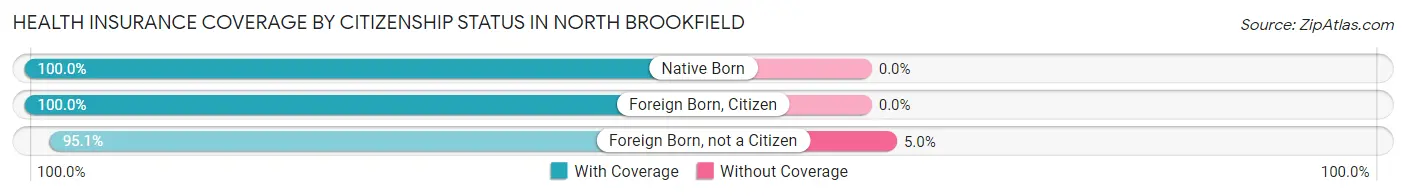
| Citizenship Status | With Coverage | Without Coverage |
| Native Born | 82 (100.0%) | 0 (0.0%) |
| Foreign Born, Citizen | 432 (100.0%) | 0 (0.0%) |
| Foreign Born, not a Citizen | 192 (95.1%) | 10 (5.0%) |
Health Insurance Coverage by Household Income in North Brookfield
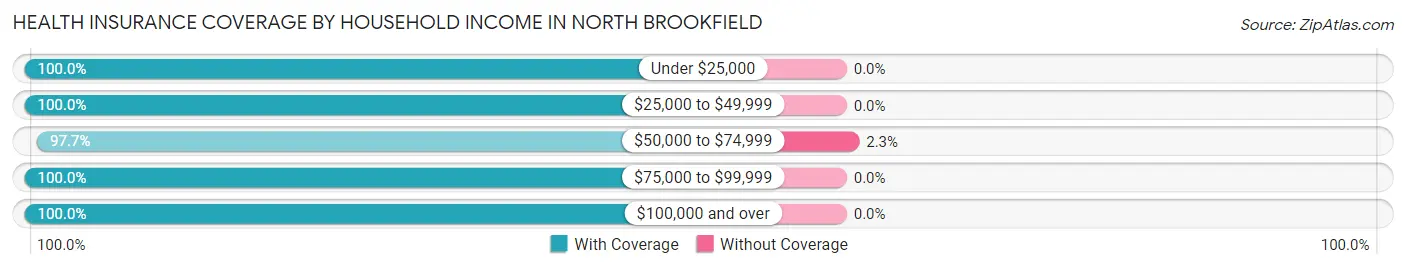
| Household Income | With Coverage | Without Coverage |
| Under $25,000 | 150 (100.0%) | 0 (0.0%) |
| $25,000 to $49,999 | 111 (100.0%) | 0 (0.0%) |
| $50,000 to $74,999 | 919 (97.7%) | 22 (2.3%) |
| $75,000 to $99,999 | 618 (100.0%) | 0 (0.0%) |
| $100,000 and over | 614 (100.0%) | 0 (0.0%) |
Public vs Private Health Insurance Coverage by Age in North Brookfield
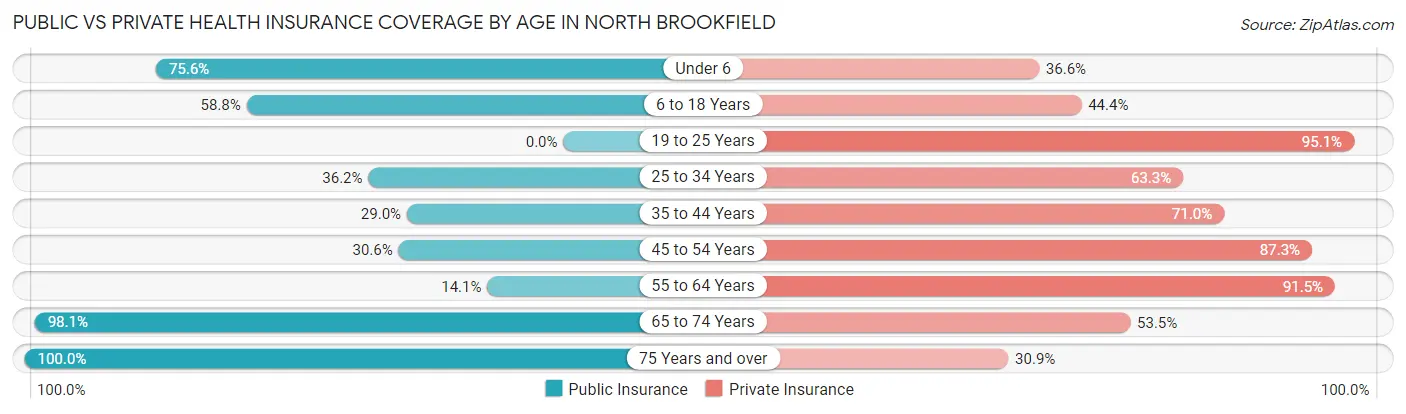
| Age Bracket | Public Insurance | Private Insurance |
| Under 6 | 62 (75.6%) | 30 (36.6%) |
| 6 to 18 Years | 254 (58.8%) | 192 (44.4%) |
| 19 to 25 Years | 0 (0.0%) | 192 (95.1%) |
| 25 to 34 Years | 76 (36.2%) | 133 (63.3%) |
| 35 to 44 Years | 88 (29.0%) | 215 (71.0%) |
| 45 to 54 Years | 108 (30.6%) | 308 (87.3%) |
| 55 to 64 Years | 60 (14.1%) | 389 (91.5%) |
| 65 to 74 Years | 209 (98.1%) | 114 (53.5%) |
| 75 Years and over | 217 (100.0%) | 67 (30.9%) |
| Total | 1,074 (44.1%) | 1,640 (67.3%) |
Disability Status by Sex by Age in North Brookfield
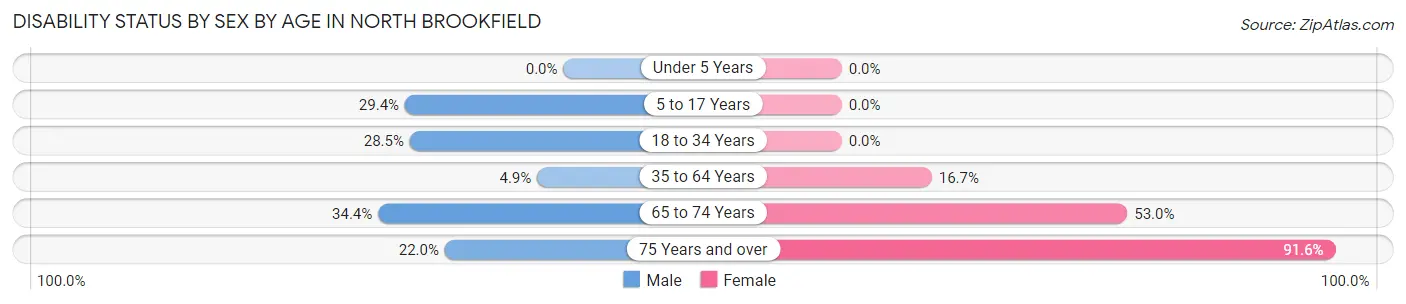
| Age Bracket | Male | Female |
| Under 5 Years | 0 (0.0%) | 0 (0.0%) |
| 5 to 17 Years | 65 (29.4%) | 0 (0.0%) |
| 18 to 34 Years | 57 (28.5%) | 0 (0.0%) |
| 35 to 64 Years | 29 (4.9%) | 81 (16.7%) |
| 65 to 74 Years | 33 (34.4%) | 62 (53.0%) |
| 75 Years and over | 11 (22.0%) | 153 (91.6%) |
Disability Class by Sex by Age in North Brookfield
Disability Class: Hearing Difficulty
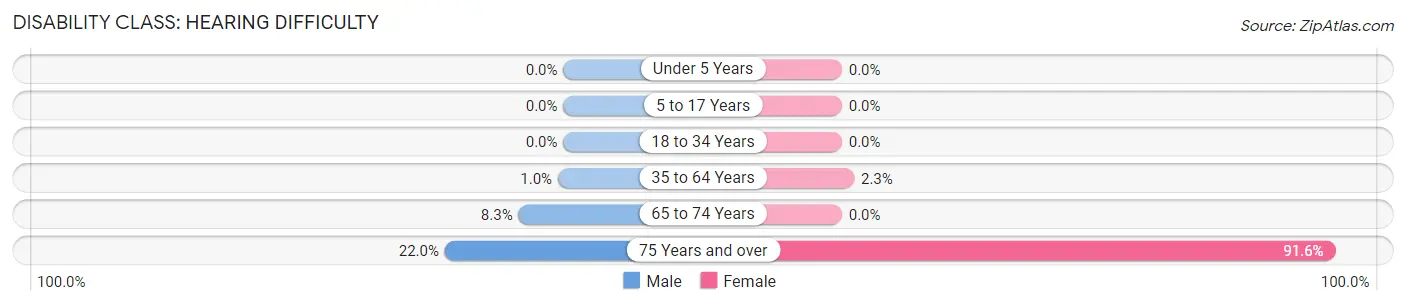
| Age Bracket | Male | Female |
| Under 5 Years | 0 (0.0%) | 0 (0.0%) |
| 5 to 17 Years | 0 (0.0%) | 0 (0.0%) |
| 18 to 34 Years | 0 (0.0%) | 0 (0.0%) |
| 35 to 64 Years | 6 (1.0%) | 11 (2.3%) |
| 65 to 74 Years | 8 (8.3%) | 0 (0.0%) |
| 75 Years and over | 11 (22.0%) | 153 (91.6%) |
Disability Class: Vision Difficulty
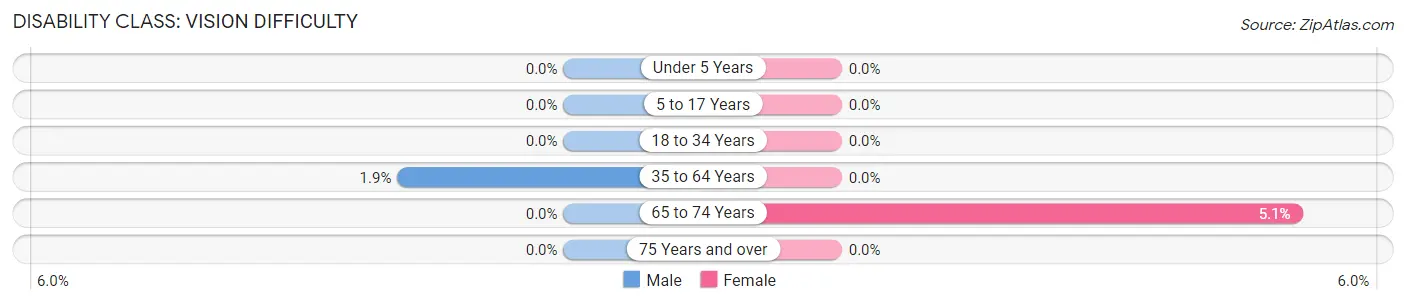
| Age Bracket | Male | Female |
| Under 5 Years | 0 (0.0%) | 0 (0.0%) |
| 5 to 17 Years | 0 (0.0%) | 0 (0.0%) |
| 18 to 34 Years | 0 (0.0%) | 0 (0.0%) |
| 35 to 64 Years | 11 (1.8%) | 0 (0.0%) |
| 65 to 74 Years | 0 (0.0%) | 6 (5.1%) |
| 75 Years and over | 0 (0.0%) | 0 (0.0%) |
Disability Class: Cognitive Difficulty
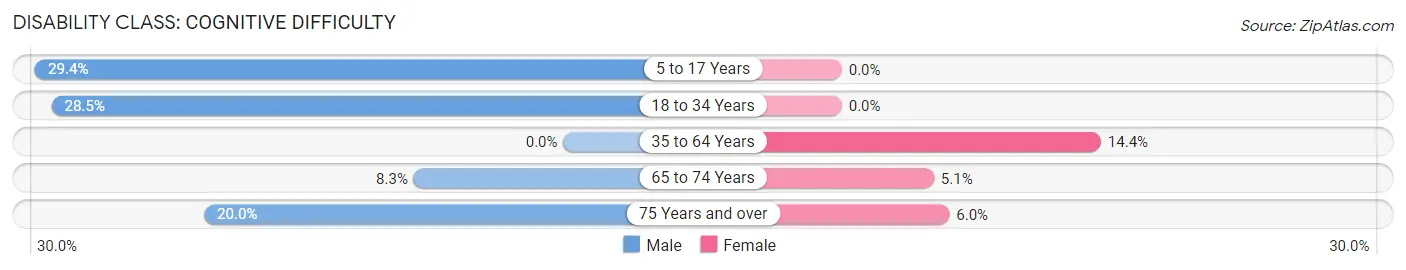
| Age Bracket | Male | Female |
| 5 to 17 Years | 65 (29.4%) | 0 (0.0%) |
| 18 to 34 Years | 57 (28.5%) | 0 (0.0%) |
| 35 to 64 Years | 0 (0.0%) | 70 (14.4%) |
| 65 to 74 Years | 8 (8.3%) | 6 (5.1%) |
| 75 Years and over | 10 (20.0%) | 10 (6.0%) |
Disability Class: Ambulatory Difficulty
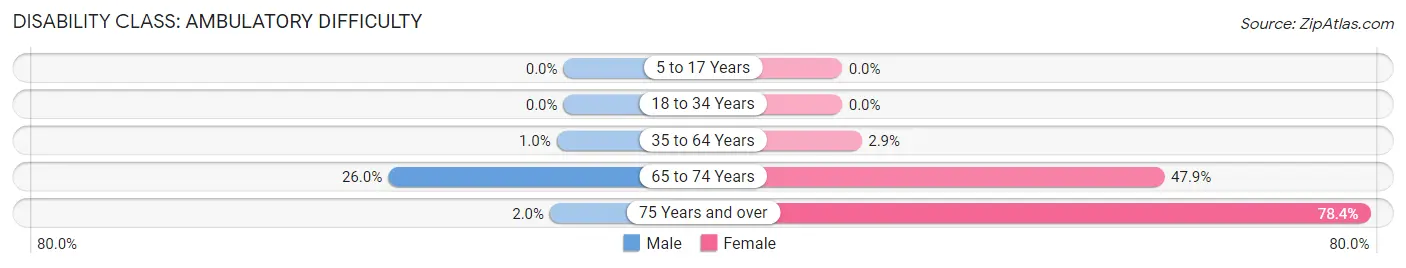
| Age Bracket | Male | Female |
| 5 to 17 Years | 0 (0.0%) | 0 (0.0%) |
| 18 to 34 Years | 0 (0.0%) | 0 (0.0%) |
| 35 to 64 Years | 6 (1.0%) | 14 (2.9%) |
| 65 to 74 Years | 25 (26.0%) | 56 (47.9%) |
| 75 Years and over | 1 (2.0%) | 131 (78.4%) |
Disability Class: Self-Care Difficulty
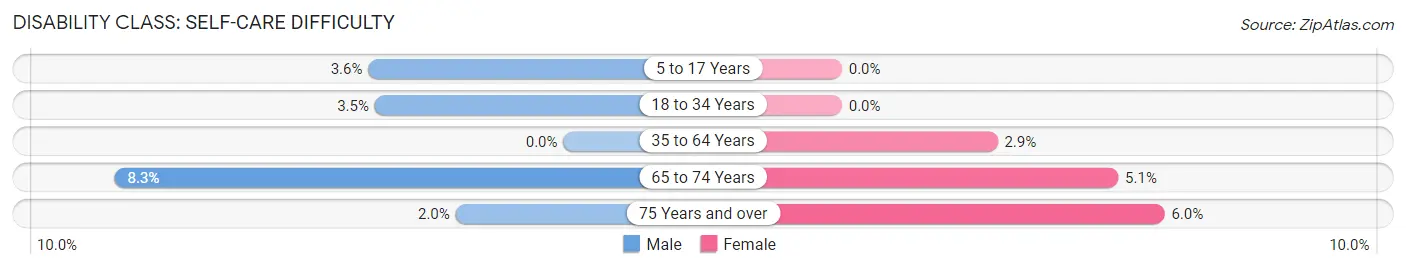
| Age Bracket | Male | Female |
| 5 to 17 Years | 8 (3.6%) | 0 (0.0%) |
| 18 to 34 Years | 7 (3.5%) | 0 (0.0%) |
| 35 to 64 Years | 0 (0.0%) | 14 (2.9%) |
| 65 to 74 Years | 8 (8.3%) | 6 (5.1%) |
| 75 Years and over | 1 (2.0%) | 10 (6.0%) |
Technology Access in North Brookfield
Computing Device Access in North Brookfield
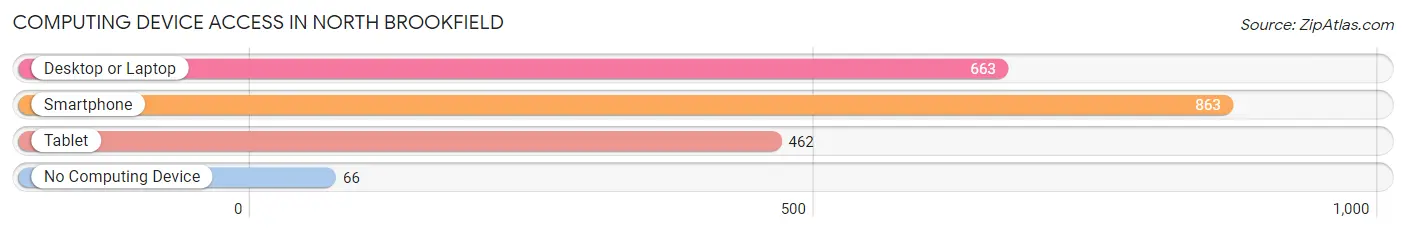
| Device Type | # Households | % Households |
| Desktop or Laptop | 663 | 66.8% |
| Smartphone | 863 | 86.9% |
| Tablet | 462 | 46.5% |
| No Computing Device | 66 | 6.7% |
| Total | 993 | 100.0% |
Internet Access in North Brookfield
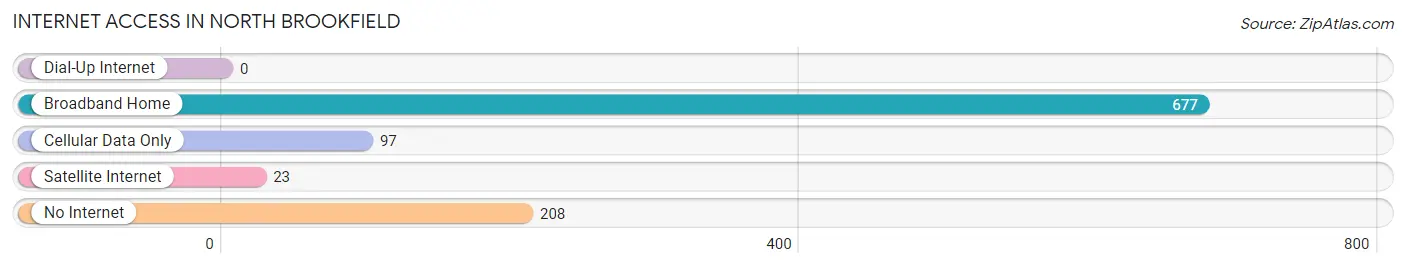
| Internet Type | # Households | % Households |
| Dial-Up Internet | 0 | 0.0% |
| Broadband Home | 677 | 68.2% |
| Cellular Data Only | 97 | 9.8% |
| Satellite Internet | 23 | 2.3% |
| No Internet | 208 | 20.9% |
| Total | 993 | 100.0% |
North Brookfield Summary
History
North Brookfield is a town located in Worcester County, Massachusetts. It was first settled in 1717 and was officially incorporated in 1812. The town was originally part of the Quaboag Plantation, which was established in 1660. The town was named after the brook that runs through it, which was named after the town of Brookfield in England.
The town was primarily an agricultural community for much of its history. The town was known for its apple orchards, which were a major source of income for the town. The town also had a thriving lumber industry, which was used to build many of the homes and buildings in the area.
The town was also home to several mills, including a paper mill, a grist mill, and a saw mill. These mills provided employment for many of the town’s residents.
Geography
North Brookfield is located in central Massachusetts, about 25 miles west of Worcester. The town is bordered by the towns of West Brookfield to the north, East Brookfield to the east, Spencer to the south, and Warren to the west.
The town is located in the Quaboag Valley, which is a low-lying area between the Quaboag and Ware Rivers. The town is mostly flat, with some hills in the northern part of town. The highest point in the town is the summit of Mount Zion, which is 845 feet above sea level.
The town is home to several lakes, including Lake Lashaway, Lake Quacumquasit, and Lake Wickaboag. These lakes provide recreational opportunities for the town’s residents.
Economy
The economy of North Brookfield is largely based on agriculture and manufacturing. The town is home to several apple orchards, which produce a variety of apples for sale in the local area. The town also has a thriving lumber industry, which produces lumber for use in construction and furniture making.
The town is also home to several manufacturing companies, including a paper mill, a grist mill, and a saw mill. These companies provide employment for many of the town’s residents.
Demographics
As of the 2010 census, the town had a population of 4,680. The racial makeup of the town was 97.2% White, 0.7% African American, 0.3% Native American, 0.3% Asian, 0.1% Pacific Islander, 0.3% from other races, and 1.2% from two or more races. Hispanic or Latino of any race were 1.2% of the population.
The median household income in the town was $54,917, and the median family income was $63,750. The per capita income for the town was $25,945. About 8.2% of families and 10.2% of the population were below the poverty line, including 14.2% of those under age 18 and 5.2% of those age 65 or over.
Common Questions
What is Per Capita Income in North Brookfield?
Per Capita income in North Brookfield is $35,392.
What is the Median Family Income in North Brookfield?
Median Family Income in North Brookfield is $80,758.
What is the Median Household income in North Brookfield?
Median Household Income in North Brookfield is $73,904.
What is Income or Wage Gap in North Brookfield?
Income or Wage Gap in North Brookfield is 46.9%.
Women in North Brookfield earn 53.1 cents for every dollar earned by a man.
What is Inequality or Gini Index in North Brookfield?
Inequality or Gini Index in North Brookfield is 0.34.
What is the Total Population of North Brookfield?
Total Population of North Brookfield is 2,437.
What is the Total Male Population of North Brookfield?
Total Male Population of North Brookfield is 1,186.
What is the Total Female Population of North Brookfield?
Total Female Population of North Brookfield is 1,251.
What is the Ratio of Males per 100 Females in North Brookfield?
There are 94.80 Males per 100 Females in North Brookfield.
What is the Ratio of Females per 100 Males in North Brookfield?
There are 105.48 Females per 100 Males in North Brookfield.
What is the Median Population Age in North Brookfield?
Median Population Age in North Brookfield is 44.0 Years.
What is the Average Family Size in North Brookfield
Average Family Size in North Brookfield is 3.1 People.
What is the Average Household Size in North Brookfield
Average Household Size in North Brookfield is 2.5 People.
How Large is the Labor Force in North Brookfield?
There are 1,405 People in the Labor Forcein in North Brookfield.
What is the Percentage of People in the Labor Force in North Brookfield?
68.7% of People are in the Labor Force in North Brookfield.
What is the Unemployment Rate in North Brookfield?
Unemployment Rate in North Brookfield is 2.0%.