Hopkinton, MA Map & Demographics
Hopkinton Map
Hopkinton Overview
$116,491
PER CAPITA INCOME
$250,001
AVG FAMILY INCOME
$168,393
AVG HOUSEHOLD INCOME
33.0%
WAGE / INCOME GAP [ % ]
67.0¢/ $1
WAGE / INCOME GAP [ $ ]
0.54
INEQUALITY / GINI INDEX
3,298
TOTAL POPULATION
1,400
MALE POPULATION
1,898
FEMALE POPULATION
73.76
MALES / 100 FEMALES
135.57
FEMALES / 100 MALES
52.7
MEDIAN AGE
3.3
AVG FAMILY SIZE
2.5
AVG HOUSEHOLD SIZE
1,859
LABOR FORCE [ PEOPLE ]
67.0%
PERCENT IN LABOR FORCE
4.1%
UNEMPLOYMENT RATE
Hopkinton Zip Codes
Income in Hopkinton
Income Overview in Hopkinton
Per Capita Income in Hopkinton is $116,491, while median incomes of families and households are $250,001 and $168,393 respectively.
| Characteristic | Number | Measure |
| Per Capita Income | 3,298 | $116,491 |
| Median Family Income | 847 | $250,001 |
| Mean Family Income | 847 | $411,805 |
| Median Household Income | 1,269 | $168,393 |
| Mean Household Income | 1,269 | $291,007 |
| Income Deficit | 847 | $0 |
| Wage / Income Gap (%) | 3,298 | 32.99% |
| Wage / Income Gap ($) | 3,298 | 67.01¢ per $1 |
| Gini / Inequality Index | 3,298 | 0.54 |
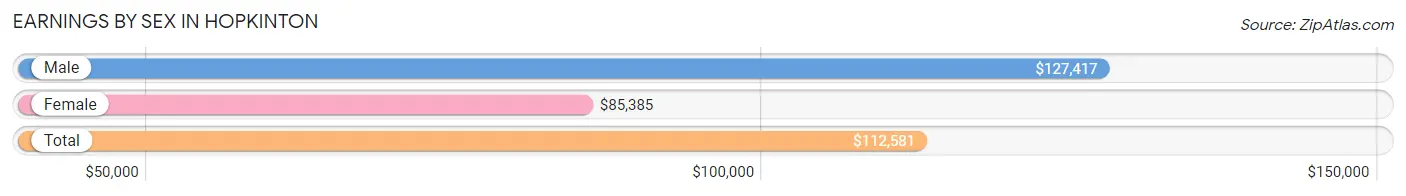
Earnings by Sex in Hopkinton
Average Earnings in Hopkinton are $112,581, $127,417 for men and $85,385 for women, a difference of 33.0%.
| Sex | Number | Average Earnings |
| Male | 1,046 (53.6%) | $127,417 |
| Female | 904 (46.4%) | $85,385 |
| Total | 1,950 (100.0%) | $112,581 |
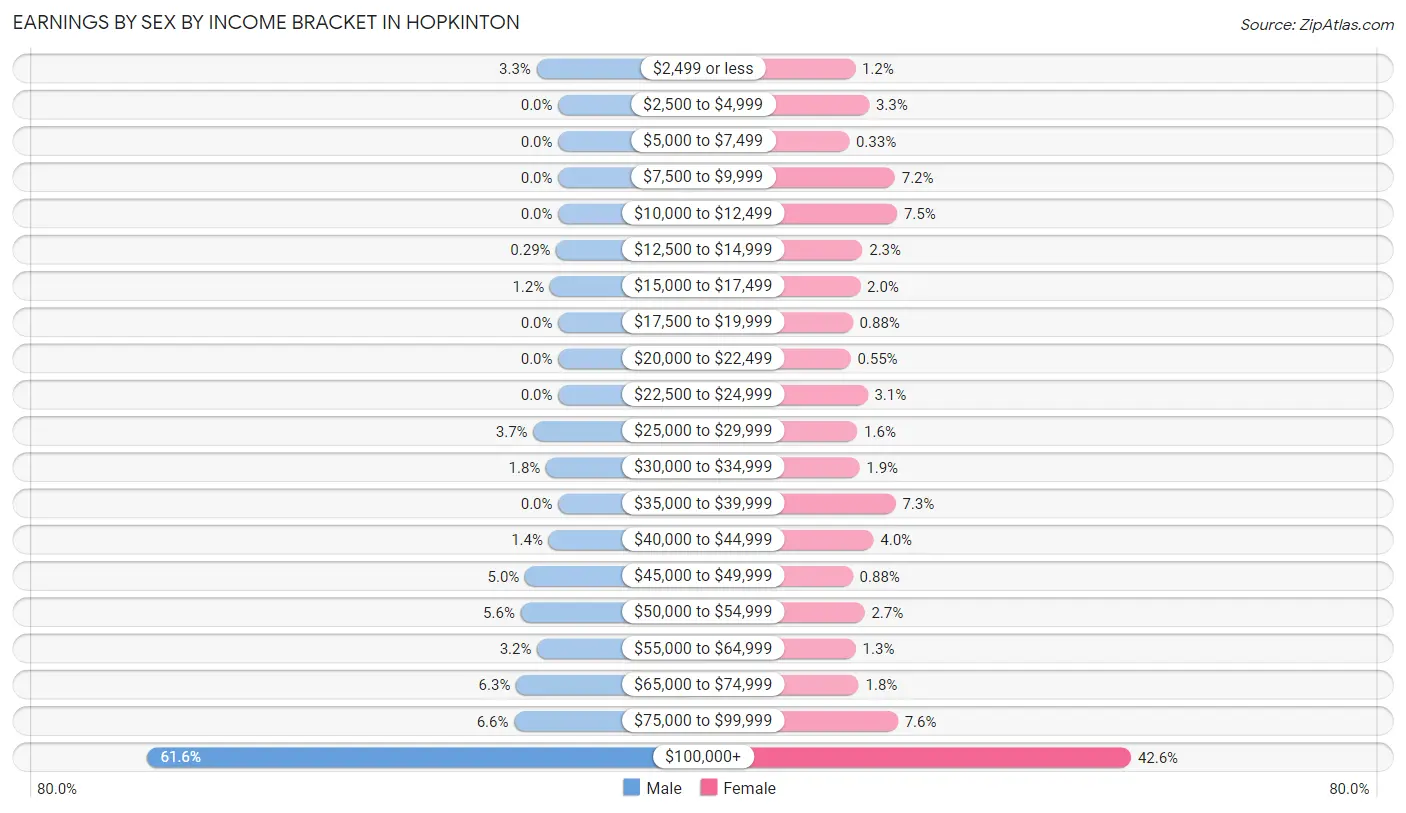
Earnings by Sex by Income Bracket in Hopkinton
The most common earnings brackets in Hopkinton are $100,000+ for men (644 | 61.6%) and $100,000+ for women (385 | 42.6%).
| Income | Male | Female |
| $2,499 or less | 34 (3.3%) | 11 (1.2%) |
| $2,500 to $4,999 | 0 (0.0%) | 30 (3.3%) |
| $5,000 to $7,499 | 0 (0.0%) | 3 (0.3%) |
| $7,500 to $9,999 | 0 (0.0%) | 65 (7.2%) |
| $10,000 to $12,499 | 0 (0.0%) | 68 (7.5%) |
| $12,500 to $14,999 | 3 (0.3%) | 21 (2.3%) |
| $15,000 to $17,499 | 13 (1.2%) | 18 (2.0%) |
| $17,500 to $19,999 | 0 (0.0%) | 8 (0.9%) |
| $20,000 to $22,499 | 0 (0.0%) | 5 (0.5%) |
| $22,500 to $24,999 | 0 (0.0%) | 28 (3.1%) |
| $25,000 to $29,999 | 39 (3.7%) | 14 (1.5%) |
| $30,000 to $34,999 | 19 (1.8%) | 17 (1.9%) |
| $35,000 to $39,999 | 0 (0.0%) | 66 (7.3%) |
| $40,000 to $44,999 | 15 (1.4%) | 36 (4.0%) |
| $45,000 to $49,999 | 52 (5.0%) | 8 (0.9%) |
| $50,000 to $54,999 | 59 (5.6%) | 24 (2.6%) |
| $55,000 to $64,999 | 33 (3.2%) | 12 (1.3%) |
| $65,000 to $74,999 | 66 (6.3%) | 16 (1.8%) |
| $75,000 to $99,999 | 69 (6.6%) | 69 (7.6%) |
| $100,000+ | 644 (61.6%) | 385 (42.6%) |
| Total | 1,046 (100.0%) | 904 (100.0%) |
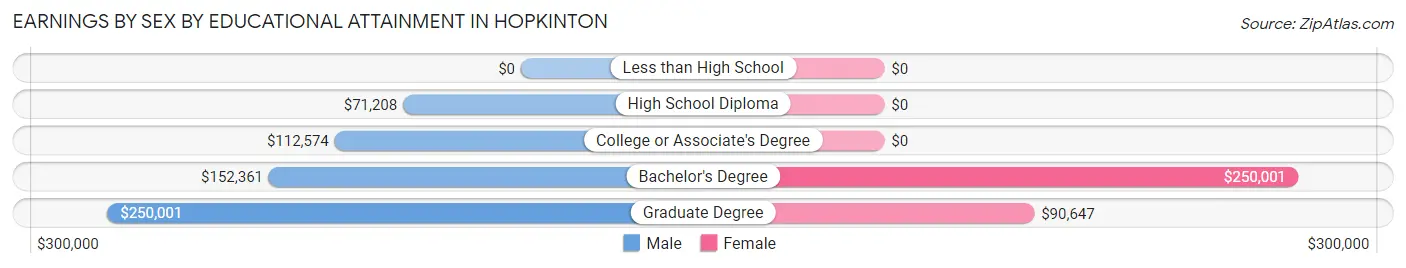
Earnings by Sex by Educational Attainment in Hopkinton
| Educational Attainment | Male Income | Female Income |
| Less than High School | - | - |
| High School Diploma | $71,208 | $0 |
| College or Associate's Degree | $112,574 | $0 |
| Bachelor's Degree | $152,361 | $250,001 |
| Graduate Degree | $250,001 | $90,647 |
| Total | - | - |
Family Income in Hopkinton
Family Income Brackets in Hopkinton
According to the Hopkinton family income data, there are 574 families falling into the $200,000+ income range, which is the most common income bracket and makes up 67.8% of all families.
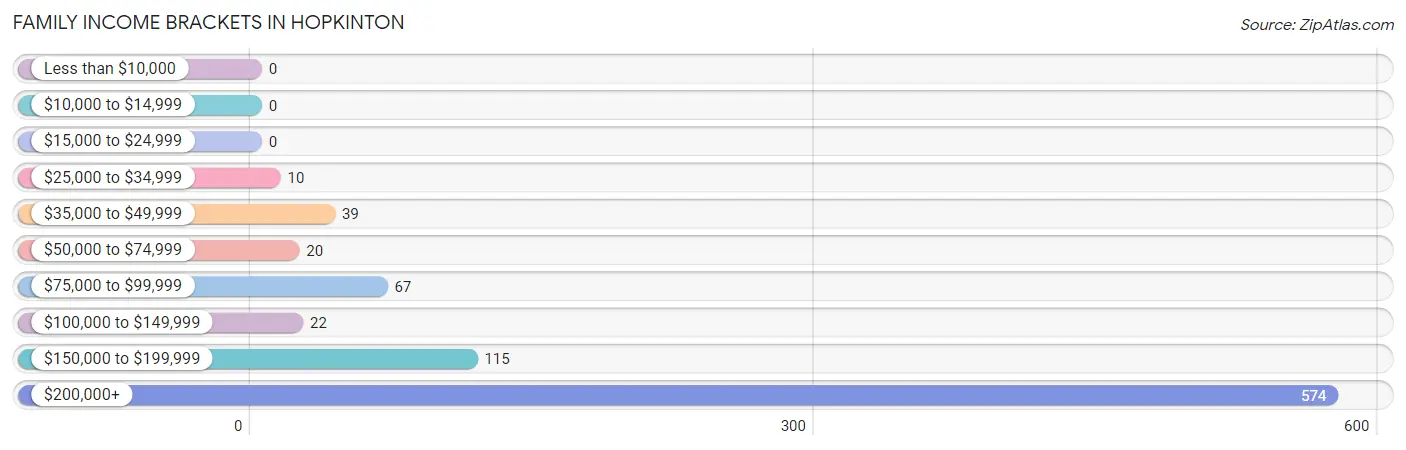
| Income Bracket | # Families | % Families |
| Less than $10,000 | 0 | 0.0% |
| $10,000 to $14,999 | 0 | 0.0% |
| $15,000 to $24,999 | 0 | 0.0% |
| $25,000 to $34,999 | 10 | 1.2% |
| $35,000 to $49,999 | 39 | 4.6% |
| $50,000 to $74,999 | 20 | 2.4% |
| $75,000 to $99,999 | 67 | 7.9% |
| $100,000 to $149,999 | 22 | 2.6% |
| $150,000 to $199,999 | 115 | 13.6% |
| $200,000+ | 574 | 67.8% |
Family Income by Famaliy Size in Hopkinton
3-person families (379 | 44.8%) account for the highest median family income in Hopkinton with $250,001 per family, while 2-person families (218 | 25.7%) have the highest median income of $87,692 per family member.
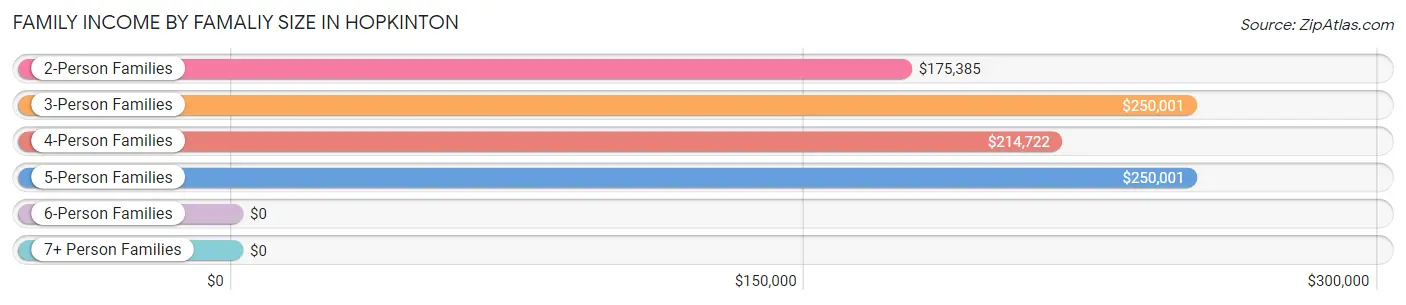
| Income Bracket | # Families | Median Income |
| 2-Person Families | 218 (25.7%) | $175,385 |
| 3-Person Families | 379 (44.8%) | $250,001 |
| 4-Person Families | 168 (19.8%) | $214,722 |
| 5-Person Families | 36 (4.3%) | $250,001 |
| 6-Person Families | 14 (1.7%) | $0 |
| 7+ Person Families | 32 (3.8%) | $0 |
| Total | 847 (100.0%) | $250,001 |
Family Income by Number of Earners in Hopkinton
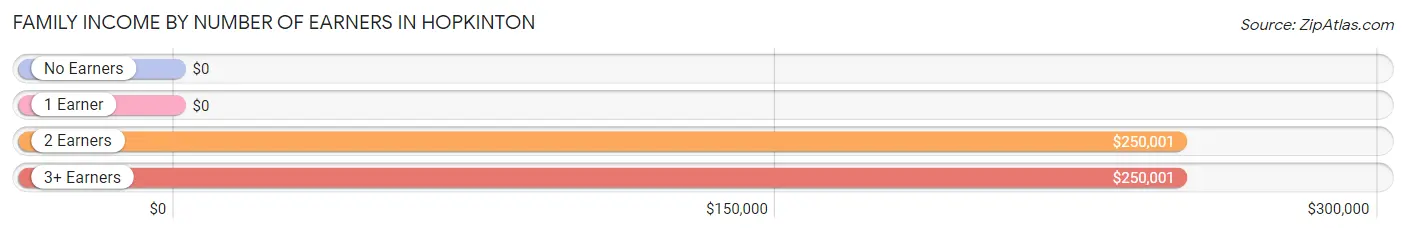
| Number of Earners | # Families | Median Income |
| No Earners | 33 (3.9%) | $0 |
| 1 Earner | 154 (18.2%) | $0 |
| 2 Earners | 496 (58.6%) | $250,001 |
| 3+ Earners | 164 (19.4%) | $250,001 |
| Total | 847 (100.0%) | $250,001 |
Household Income in Hopkinton
Household Income Brackets in Hopkinton
With 574 households falling in the category, the $200,000+ income range is the most frequent in Hopkinton, accounting for 45.2% of all households. In contrast, only 41 households (3.2%) fall into the less than $10,000 income bracket, making it the least populous group.
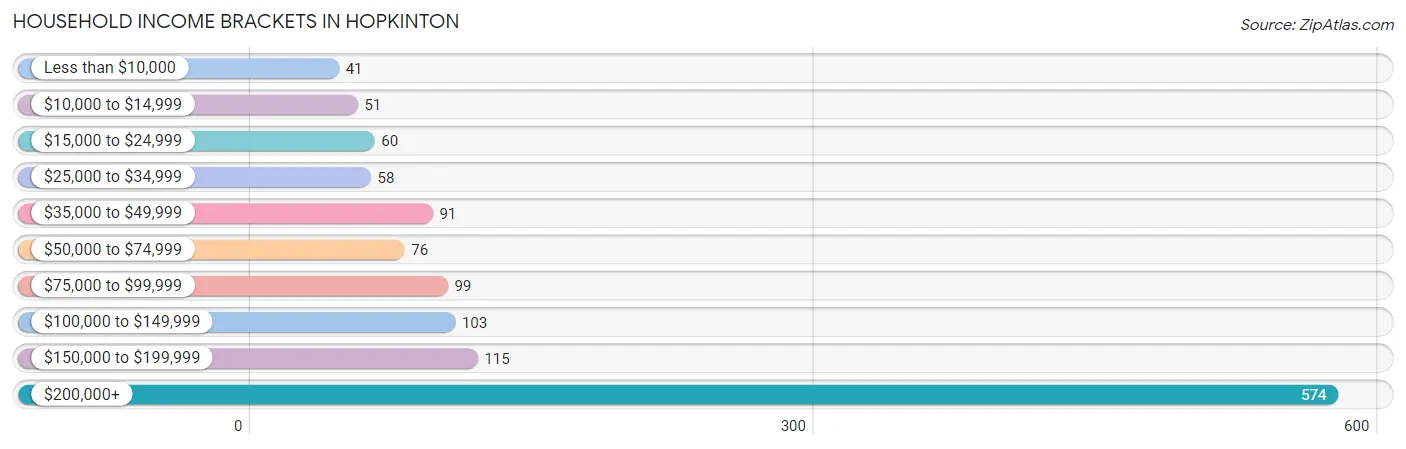
| Income Bracket | # Households | % Households |
| Less than $10,000 | 41 | 3.2% |
| $10,000 to $14,999 | 51 | 4.0% |
| $15,000 to $24,999 | 60 | 4.7% |
| $25,000 to $34,999 | 58 | 4.6% |
| $35,000 to $49,999 | 91 | 7.2% |
| $50,000 to $74,999 | 76 | 6.0% |
| $75,000 to $99,999 | 99 | 7.8% |
| $100,000 to $149,999 | 103 | 8.1% |
| $150,000 to $199,999 | 115 | 9.1% |
| $200,000+ | 574 | 45.2% |
Household Income by Householder Age in Hopkinton
The median household income in Hopkinton is $168,393, with the highest median household income of $250,001 found in the 25 to 44 years age bracket for the primary householder. A total of 151 households (11.9%) fall into this category. Meanwhile, the 15 to 24 years age bracket for the primary householder has the lowest median household income of $0, with 28 households (2.2%) in this group.
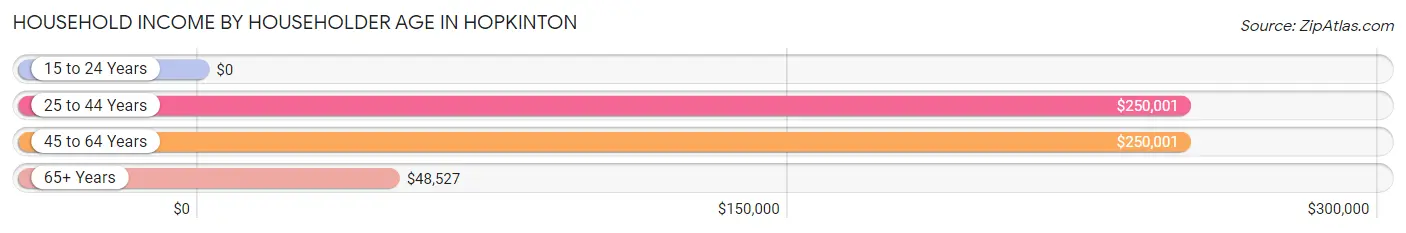
| Income Bracket | # Households | Median Income |
| 15 to 24 Years | 28 (2.2%) | $0 |
| 25 to 44 Years | 151 (11.9%) | $250,001 |
| 45 to 64 Years | 673 (53.0%) | $250,001 |
| 65+ Years | 417 (32.9%) | $48,527 |
| Total | 1,269 (100.0%) | $168,393 |
Poverty in Hopkinton
Income Below Poverty by Sex and Age in Hopkinton
With 0.7% poverty level for males and 5.1% for females among the residents of Hopkinton, 16 and 17 year old males and 65 to 74 year old females are the most vulnerable to poverty, with 4 males (13.3%) and 55 females (33.1%) in their respective age groups living below the poverty level.
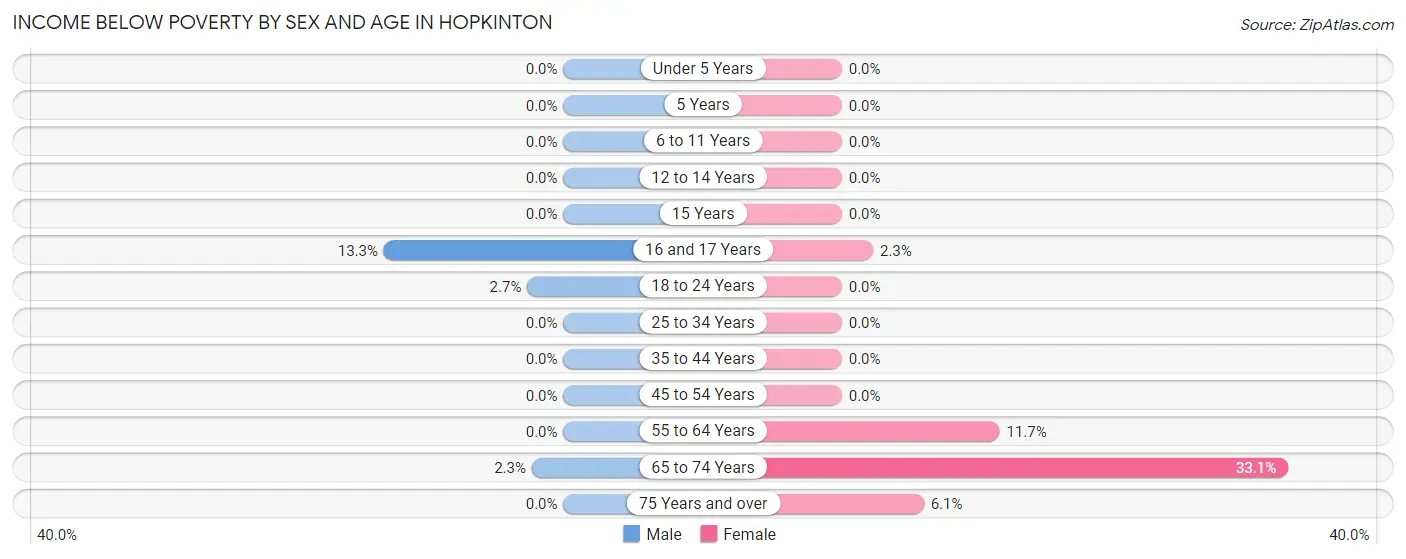
| Age Bracket | Male | Female |
| Under 5 Years | 0 (0.0%) | 0 (0.0%) |
| 5 Years | 0 (0.0%) | 0 (0.0%) |
| 6 to 11 Years | 0 (0.0%) | 0 (0.0%) |
| 12 to 14 Years | 0 (0.0%) | 0 (0.0%) |
| 15 Years | 0 (0.0%) | 0 (0.0%) |
| 16 and 17 Years | 4 (13.3%) | 6 (2.3%) |
| 18 to 24 Years | 3 (2.7%) | 0 (0.0%) |
| 25 to 34 Years | 0 (0.0%) | 0 (0.0%) |
| 35 to 44 Years | 0 (0.0%) | 0 (0.0%) |
| 45 to 54 Years | 0 (0.0%) | 0 (0.0%) |
| 55 to 64 Years | 0 (0.0%) | 24 (11.7%) |
| 65 to 74 Years | 3 (2.3%) | 55 (33.1%) |
| 75 Years and over | 0 (0.0%) | 11 (6.1%) |
| Total | 10 (0.7%) | 96 (5.1%) |
Income Above Poverty by Sex and Age in Hopkinton
According to the poverty statistics in Hopkinton, males aged under 5 years and females aged under 5 years are the age groups that are most secure financially, with 100.0% of males and 100.0% of females in these age groups living above the poverty line.
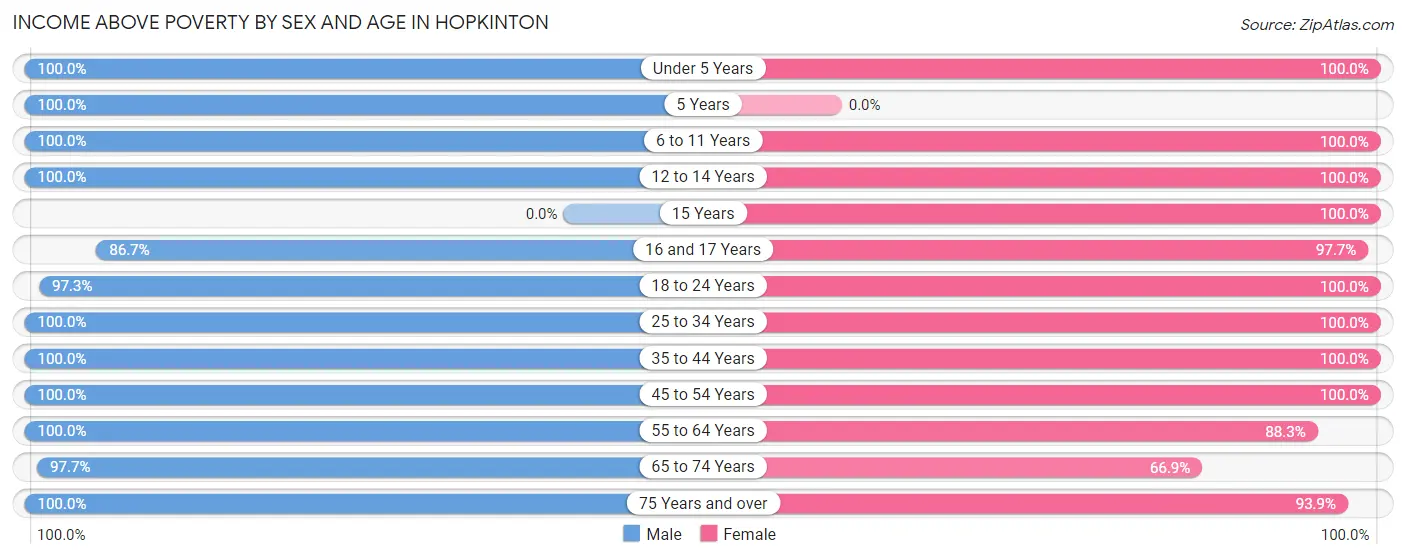
| Age Bracket | Male | Female |
| Under 5 Years | 79 (100.0%) | 81 (100.0%) |
| 5 Years | 23 (100.0%) | 0 (0.0%) |
| 6 to 11 Years | 97 (100.0%) | 107 (100.0%) |
| 12 to 14 Years | 29 (100.0%) | 64 (100.0%) |
| 15 Years | 0 (0.0%) | 36 (100.0%) |
| 16 and 17 Years | 26 (86.7%) | 253 (97.7%) |
| 18 to 24 Years | 109 (97.3%) | 167 (100.0%) |
| 25 to 34 Years | 49 (100.0%) | 62 (100.0%) |
| 35 to 44 Years | 127 (100.0%) | 124 (100.0%) |
| 45 to 54 Years | 352 (100.0%) | 438 (100.0%) |
| 55 to 64 Years | 232 (100.0%) | 181 (88.3%) |
| 65 to 74 Years | 125 (97.7%) | 111 (66.9%) |
| 75 Years and over | 122 (100.0%) | 170 (93.9%) |
| Total | 1,370 (99.3%) | 1,794 (94.9%) |
Income Below Poverty Among Married-Couple Families in Hopkinton
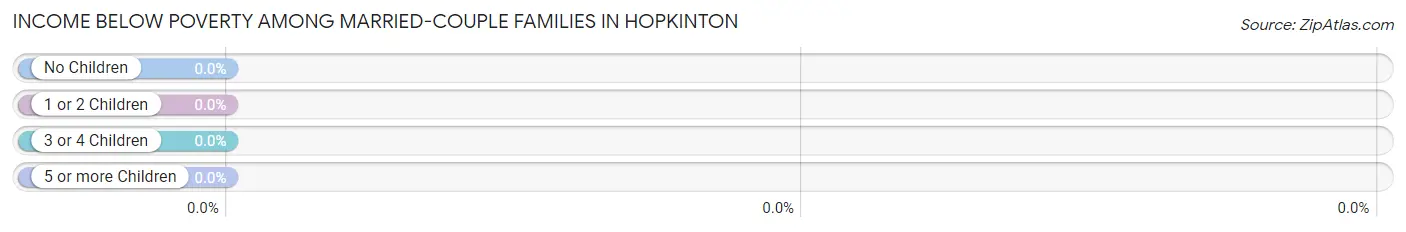
| Children | Above Poverty | Below Poverty |
| No Children | 294 (100.0%) | 0 (0.0%) |
| 1 or 2 Children | 408 (100.0%) | 0 (0.0%) |
| 3 or 4 Children | 21 (100.0%) | 0 (0.0%) |
| 5 or more Children | 23 (100.0%) | 0 (0.0%) |
| Total | 746 (100.0%) | 0 (0.0%) |
Income Below Poverty Among Single-Parent Households in Hopkinton
| Children | Single Father | Single Mother |
| No Children | 0 (0.0%) | 0 (0.0%) |
| 1 or 2 Children | 0 (0.0%) | 0 (0.0%) |
| 3 or 4 Children | 0 (0.0%) | 0 (0.0%) |
| 5 or more Children | 0 (0.0%) | 0 (0.0%) |
| Total | 0 (0.0%) | 0 (0.0%) |
Income Below Poverty Among Married-Couple vs Single-Parent Households in Hopkinton
| Children | Married-Couple Families | Single-Parent Households |
| No Children | 0 (0.0%) | 0 (0.0%) |
| 1 or 2 Children | 0 (0.0%) | 0 (0.0%) |
| 3 or 4 Children | 0 (0.0%) | 0 (0.0%) |
| 5 or more Children | 0 (0.0%) | 0 (0.0%) |
| Total | 0 (0.0%) | 0 (0.0%) |
Race in Hopkinton
The most populous races in Hopkinton are White / Caucasian (3,050 | 92.5%), Two or more Races (167 | 5.1%), and Hispanic or Latino (57 | 1.7%).
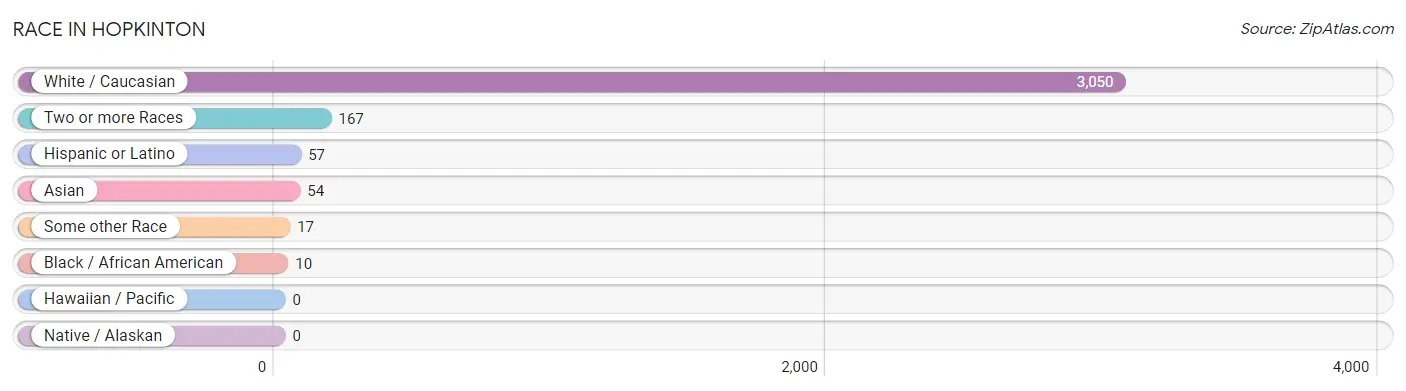
| Race | # Population | % Population |
| Asian | 54 | 1.6% |
| Black / African American | 10 | 0.3% |
| Hawaiian / Pacific | 0 | 0.0% |
| Hispanic or Latino | 57 | 1.7% |
| Native / Alaskan | 0 | 0.0% |
| White / Caucasian | 3,050 | 92.5% |
| Two or more Races | 167 | 5.1% |
| Some other Race | 17 | 0.5% |
| Total | 3,298 | 100.0% |
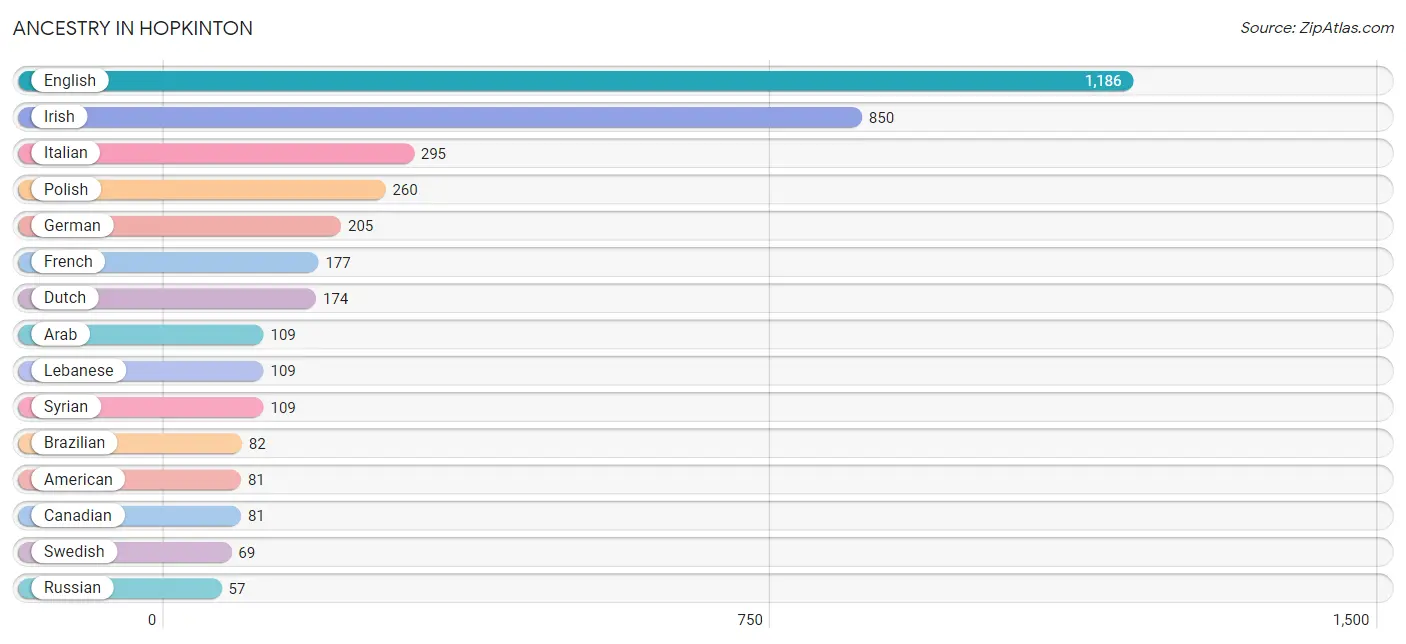
Ancestry in Hopkinton
The most populous ancestries reported in Hopkinton are English (1,186 | 36.0%), Irish (850 | 25.8%), Italian (295 | 8.9%), Polish (260 | 7.9%), and German (205 | 6.2%), together accounting for 84.8% of all Hopkinton residents.
| Ancestry | # Population | % Population |
| American | 81 | 2.5% |
| Arab | 109 | 3.3% |
| Brazilian | 82 | 2.5% |
| Burmese | 32 | 1.0% |
| Canadian | 81 | 2.5% |
| Central American | 15 | 0.4% |
| Czech | 18 | 0.5% |
| Dutch | 174 | 5.3% |
| Eastern European | 17 | 0.5% |
| English | 1,186 | 36.0% |
| French | 177 | 5.4% |
| French Canadian | 56 | 1.7% |
| German | 205 | 6.2% |
| Guatemalan | 15 | 0.4% |
| Haitian | 3 | 0.1% |
| Indian (Asian) | 4 | 0.1% |
| Irish | 850 | 25.8% |
| Italian | 295 | 8.9% |
| Lebanese | 109 | 3.3% |
| Pakistani | 9 | 0.3% |
| Polish | 260 | 7.9% |
| Portuguese | 29 | 0.9% |
| Puerto Rican | 35 | 1.1% |
| Russian | 57 | 1.7% |
| Scotch-Irish | 9 | 0.3% |
| Scottish | 18 | 0.5% |
| Swedish | 69 | 2.1% |
| Syrian | 109 | 3.3% |
| Thai | 29 | 0.9% | View All 29 Rows |
Immigrants in Hopkinton
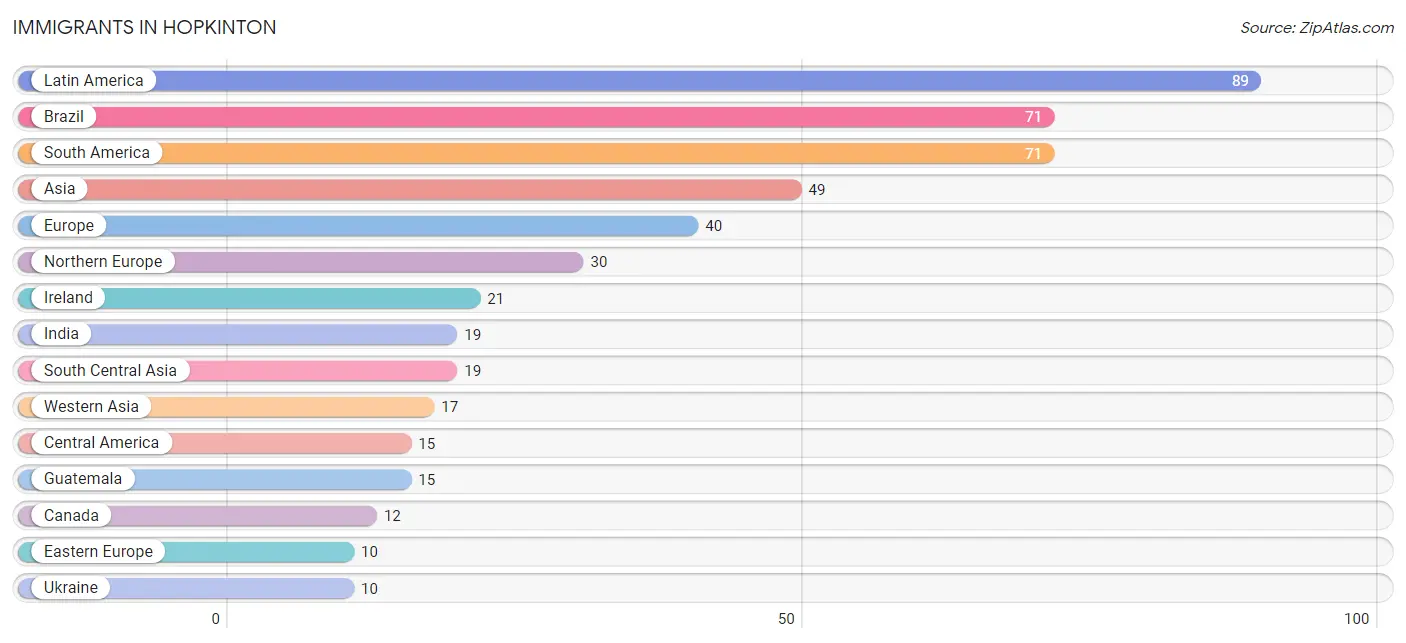
The most numerous immigrant groups reported in Hopkinton came from Latin America (89 | 2.7%), Brazil (71 | 2.1%), South America (71 | 2.1%), Asia (49 | 1.5%), and Europe (40 | 1.2%), together accounting for 9.7% of all Hopkinton residents.
| Immigration Origin | # Population | % Population |
| Africa | 3 | 0.1% |
| Asia | 49 | 1.5% |
| Brazil | 71 | 2.1% |
| Canada | 12 | 0.4% |
| Caribbean | 3 | 0.1% |
| Central America | 15 | 0.4% |
| China | 4 | 0.1% |
| Eastern Asia | 4 | 0.1% |
| Eastern Europe | 10 | 0.3% |
| England | 9 | 0.3% |
| Europe | 40 | 1.2% |
| Guatemala | 15 | 0.4% |
| Haiti | 3 | 0.1% |
| India | 19 | 0.6% |
| Ireland | 21 | 0.6% |
| Latin America | 89 | 2.7% |
| Northern Europe | 30 | 0.9% |
| South Africa | 3 | 0.1% |
| South America | 71 | 2.1% |
| South Central Asia | 19 | 0.6% |
| South Eastern Asia | 9 | 0.3% |
| Thailand | 9 | 0.3% |
| Ukraine | 10 | 0.3% |
| Western Asia | 17 | 0.5% | View All 24 Rows |
Sex and Age in Hopkinton
Sex and Age in Hopkinton
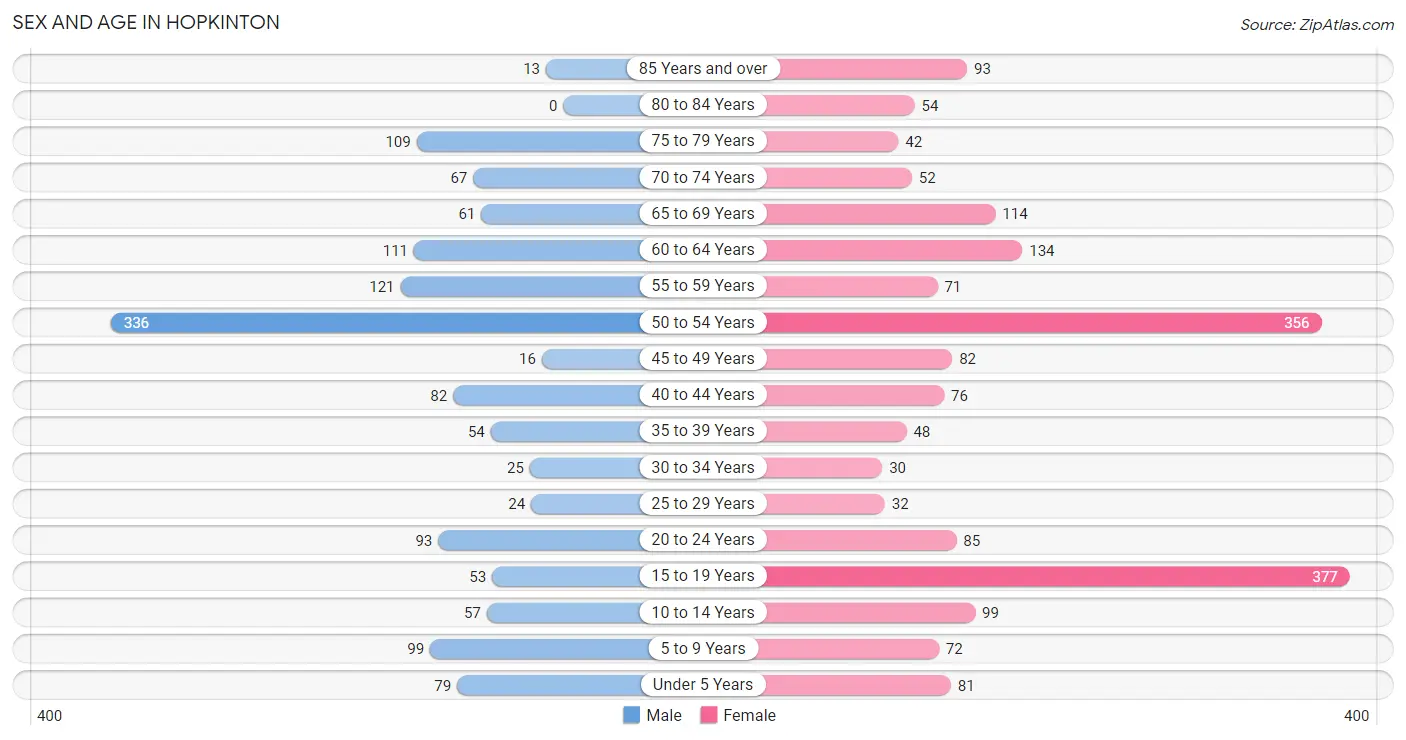
The most populous age groups in Hopkinton are 50 to 54 Years (336 | 24.0%) for men and 15 to 19 Years (377 | 19.9%) for women.
| Age Bracket | Male | Female |
| Under 5 Years | 79 (5.6%) | 81 (4.3%) |
| 5 to 9 Years | 99 (7.1%) | 72 (3.8%) |
| 10 to 14 Years | 57 (4.1%) | 99 (5.2%) |
| 15 to 19 Years | 53 (3.8%) | 377 (19.9%) |
| 20 to 24 Years | 93 (6.6%) | 85 (4.5%) |
| 25 to 29 Years | 24 (1.7%) | 32 (1.7%) |
| 30 to 34 Years | 25 (1.8%) | 30 (1.6%) |
| 35 to 39 Years | 54 (3.9%) | 48 (2.5%) |
| 40 to 44 Years | 82 (5.9%) | 76 (4.0%) |
| 45 to 49 Years | 16 (1.1%) | 82 (4.3%) |
| 50 to 54 Years | 336 (24.0%) | 356 (18.8%) |
| 55 to 59 Years | 121 (8.6%) | 71 (3.7%) |
| 60 to 64 Years | 111 (7.9%) | 134 (7.1%) |
| 65 to 69 Years | 61 (4.4%) | 114 (6.0%) |
| 70 to 74 Years | 67 (4.8%) | 52 (2.7%) |
| 75 to 79 Years | 109 (7.8%) | 42 (2.2%) |
| 80 to 84 Years | 0 (0.0%) | 54 (2.9%) |
| 85 Years and over | 13 (0.9%) | 93 (4.9%) |
| Total | 1,400 (100.0%) | 1,898 (100.0%) |
Families and Households in Hopkinton
Median Family Size in Hopkinton
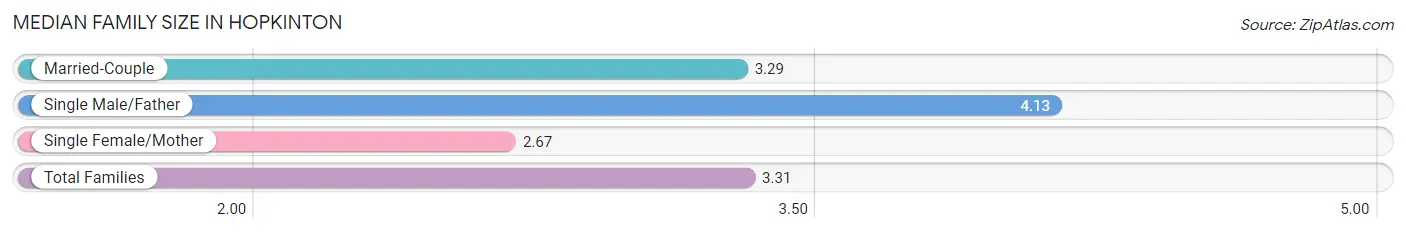
The median family size in Hopkinton is 3.31 persons per family, with single male/father families (55 | 6.5%) accounting for the largest median family size of 4.13 persons per family. On the other hand, single female/mother families (46 | 5.4%) represent the smallest median family size with 2.67 persons per family.
| Family Type | # Families | Family Size |
| Married-Couple | 746 (88.1%) | 3.29 |
| Single Male/Father | 55 (6.5%) | 4.13 |
| Single Female/Mother | 46 (5.4%) | 2.67 |
| Total Families | 847 (100.0%) | 3.31 |
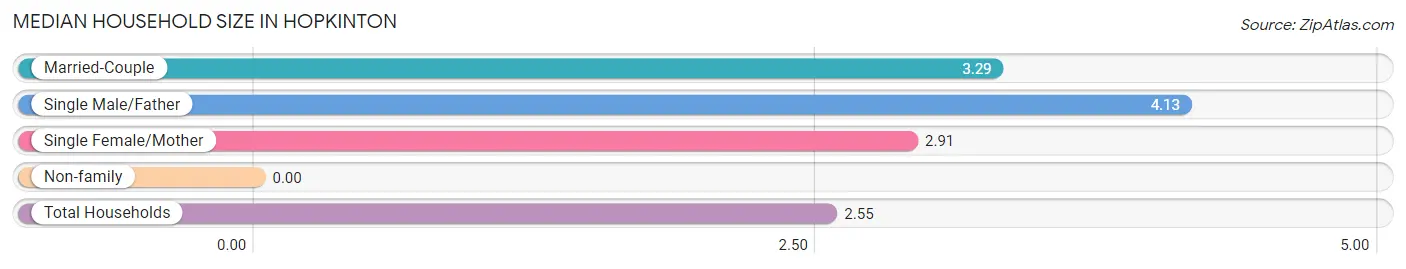
Median Household Size in Hopkinton
| Household Type | # Households | Household Size |
| Married-Couple | 746 (58.8%) | 3.29 |
| Single Male/Father | 55 (4.3%) | 4.13 |
| Single Female/Mother | 46 (3.6%) | 2.91 |
| Non-family | 422 (33.3%) | - |
| Total Households | 1,269 (100.0%) | 2.55 |
Household Size by Marriage Status in Hopkinton
Out of a total of 1,269 households in Hopkinton, 847 (66.7%) are family households, while 422 (33.3%) are nonfamily households. The most numerous type of family households are 3-person households, comprising 390, and the most common type of nonfamily households are 1-person households, comprising 422.
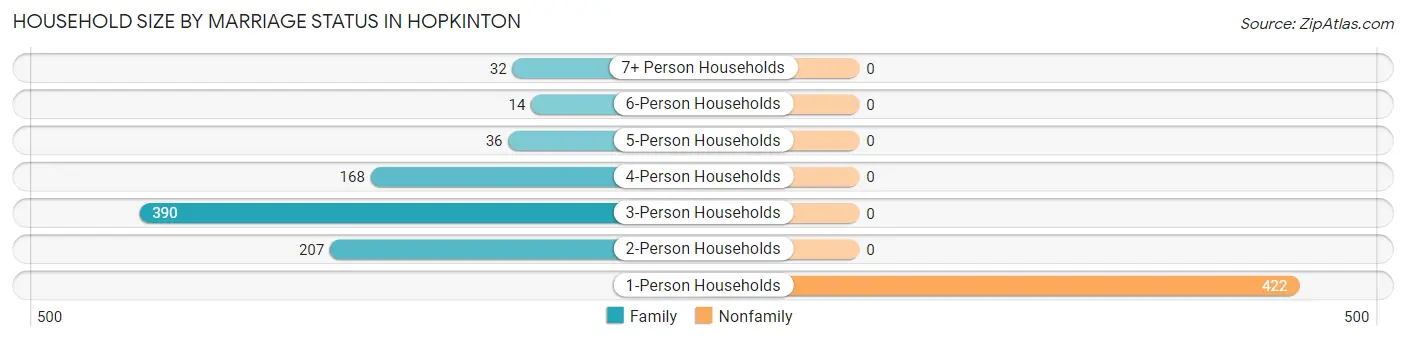
| Household Size | Family Households | Nonfamily Households |
| 1-Person Households | - | 422 (33.3%) |
| 2-Person Households | 207 (16.3%) | 0 (0.0%) |
| 3-Person Households | 390 (30.7%) | 0 (0.0%) |
| 4-Person Households | 168 (13.2%) | 0 (0.0%) |
| 5-Person Households | 36 (2.8%) | 0 (0.0%) |
| 6-Person Households | 14 (1.1%) | 0 (0.0%) |
| 7+ Person Households | 32 (2.5%) | 0 (0.0%) |
| Total | 847 (66.7%) | 422 (33.3%) |
Female Fertility in Hopkinton
Fertility by Age in Hopkinton
Average fertility rate in Hopkinton is 38.0 births per 1,000 women. Women in the age bracket of 20 to 34 years have the highest fertility rate with 109.0 births per 1,000 women. Women in the age bracket of 20 to 34 years acount for 57.1% of all women with births.
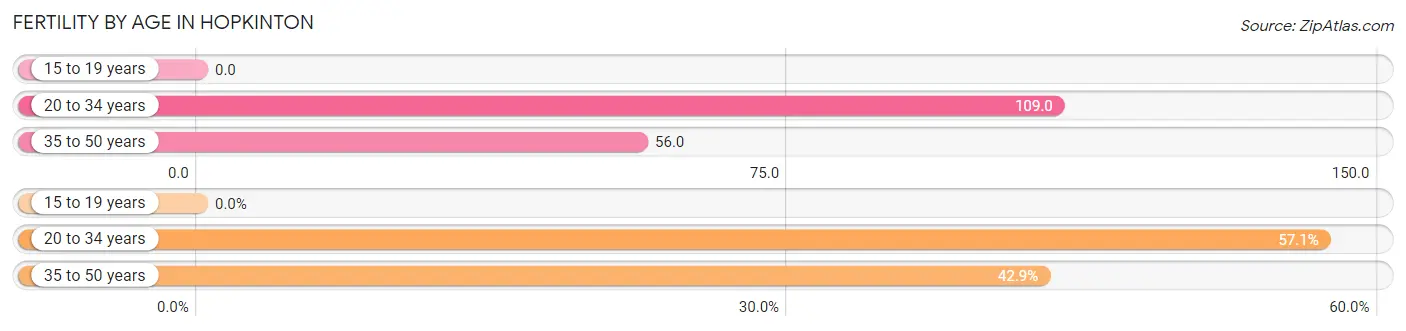
| Age Bracket | Women with Births | Births / 1,000 Women |
| 15 to 19 years | 0 (0.0%) | 0.0 |
| 20 to 34 years | 16 (57.1%) | 109.0 |
| 35 to 50 years | 12 (42.9%) | 56.0 |
| Total | 28 (100.0%) | 38.0 |
Fertility by Age by Marriage Status in Hopkinton
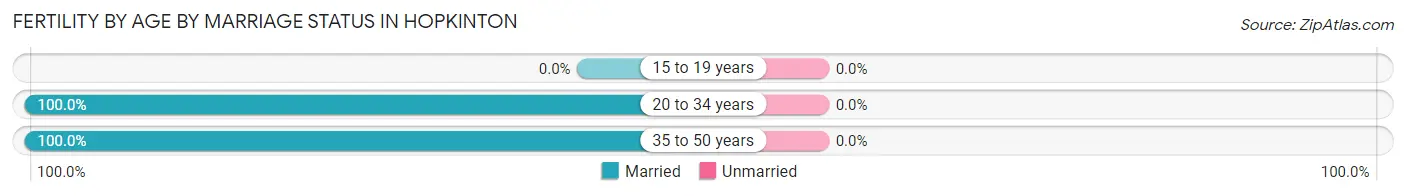
| Age Bracket | Married | Unmarried |
| 15 to 19 years | 0 (0.0%) | 0 (0.0%) |
| 20 to 34 years | 16 (100.0%) | 0 (0.0%) |
| 35 to 50 years | 12 (100.0%) | 0 (0.0%) |
| Total | 28 (100.0%) | 0 (0.0%) |
Fertility by Education in Hopkinton
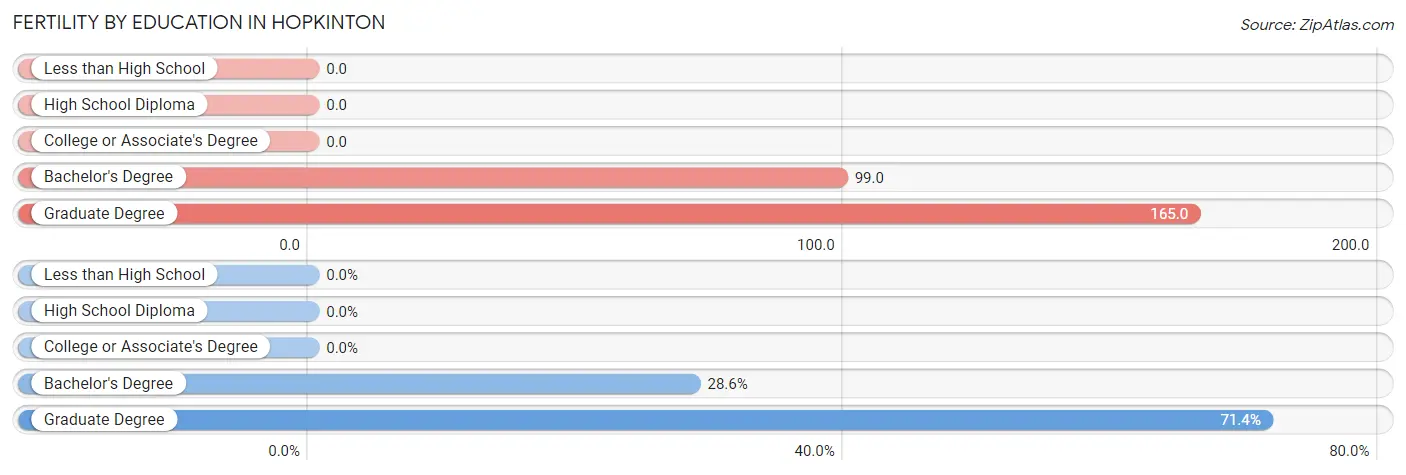
| Educational Attainment | Women with Births | Births / 1,000 Women |
| Less than High School | 0 (0.0%) | 0.0 |
| High School Diploma | 0 (0.0%) | 0.0 |
| College or Associate's Degree | 0 (0.0%) | 0.0 |
| Bachelor's Degree | 8 (28.6%) | 99.0 |
| Graduate Degree | 20 (71.4%) | 165.0 |
| Total | 28 (100.0%) | 38.0 |
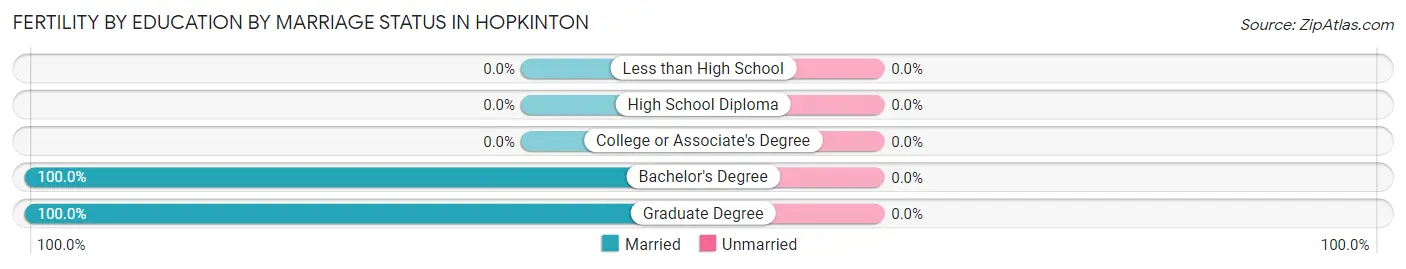
Fertility by Education by Marriage Status in Hopkinton
| Educational Attainment | Married | Unmarried |
| Less than High School | 0 (0.0%) | 0 (0.0%) |
| High School Diploma | 0 (0.0%) | 0 (0.0%) |
| College or Associate's Degree | 0 (0.0%) | 0 (0.0%) |
| Bachelor's Degree | 8 (100.0%) | 0 (0.0%) |
| Graduate Degree | 20 (100.0%) | 0 (0.0%) |
| Total | 28 (100.0%) | 0 (0.0%) |
Employment Characteristics in Hopkinton
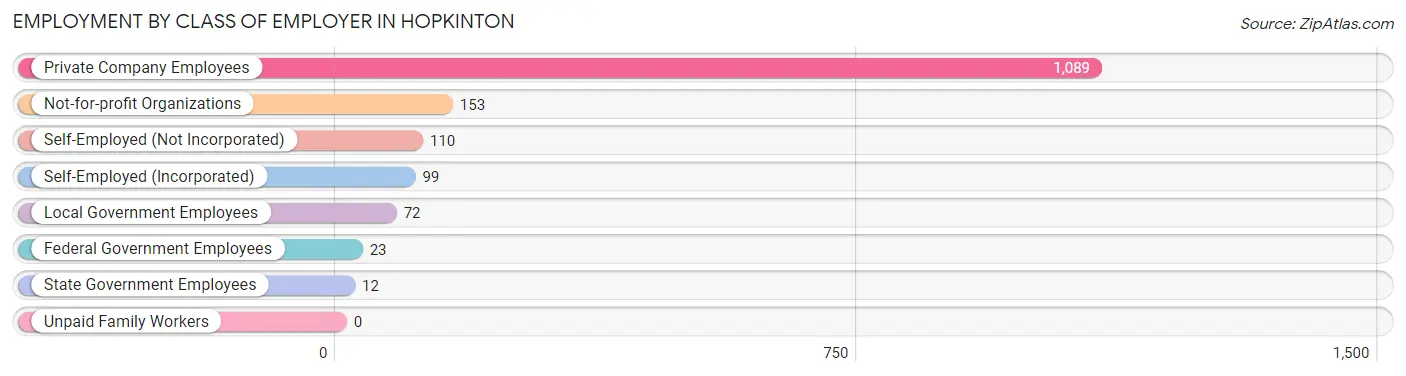
Employment by Class of Employer in Hopkinton
Among the 1,558 employed individuals in Hopkinton, private company employees (1,089 | 69.9%), not-for-profit organizations (153 | 9.8%), and self-employed (not incorporated) (110 | 7.1%) make up the most common classes of employment.
| Employer Class | # Employees | % Employees |
| Private Company Employees | 1,089 | 69.9% |
| Self-Employed (Incorporated) | 99 | 6.4% |
| Self-Employed (Not Incorporated) | 110 | 7.1% |
| Not-for-profit Organizations | 153 | 9.8% |
| Local Government Employees | 72 | 4.6% |
| State Government Employees | 12 | 0.8% |
| Federal Government Employees | 23 | 1.5% |
| Unpaid Family Workers | 0 | 0.0% |
| Total | 1,558 | 100.0% |
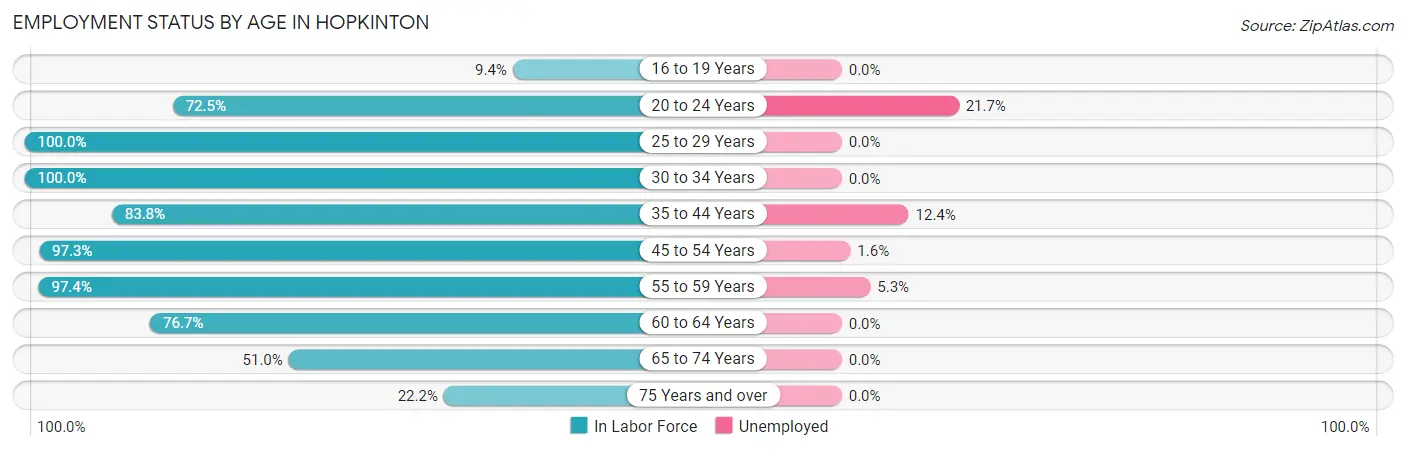
Employment Status by Age in Hopkinton
According to the labor force statistics for Hopkinton, out of the total population over 16 years of age (2,775), 67.0% or 1,859 individuals are in the labor force, with 4.1% or 76 of them unemployed. The age group with the highest labor force participation rate is 25 to 29 years, with 100.0% or 56 individuals in the labor force. Within the labor force, the 20 to 24 years age range has the highest percentage of unemployed individuals, with 21.7% or 28 of them being unemployed.
| Age Bracket | In Labor Force | Unemployed |
| 16 to 19 Years | 37 (9.4%) | 0 (0.0%) |
| 20 to 24 Years | 129 (72.5%) | 28 (21.7%) |
| 25 to 29 Years | 56 (100.0%) | 0 (0.0%) |
| 30 to 34 Years | 55 (100.0%) | 0 (0.0%) |
| 35 to 44 Years | 218 (83.8%) | 27 (12.4%) |
| 45 to 54 Years | 769 (97.3%) | 12 (1.6%) |
| 55 to 59 Years | 187 (97.4%) | 10 (5.3%) |
| 60 to 64 Years | 188 (76.7%) | 0 (0.0%) |
| 65 to 74 Years | 150 (51.0%) | 0 (0.0%) |
| 75 Years and over | 69 (22.2%) | 0 (0.0%) |
| Total | 1,859 (67.0%) | 76 (4.1%) |
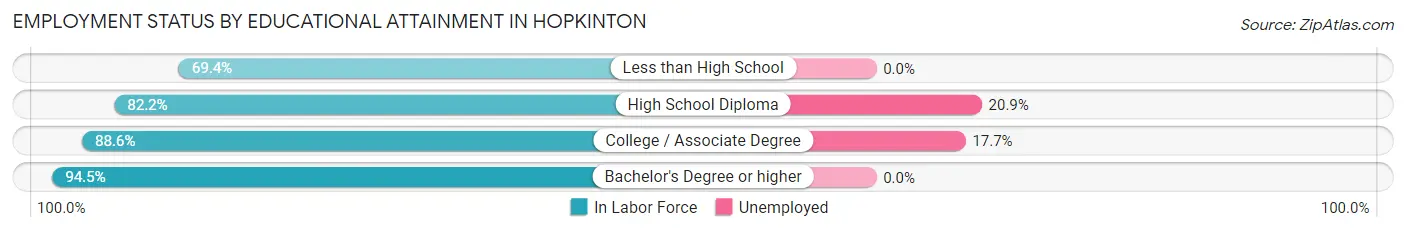
Employment Status by Educational Attainment in Hopkinton
According to labor force statistics for Hopkinton, 92.2% of individuals (1,473) out of the total population between 25 and 64 years of age (1,598) are in the labor force, with 3.3% or 49 of them being unemployed. The group with the highest labor force participation rate are those with the educational attainment of bachelor's degree or higher, with 94.5% or 1,195 individuals in the labor force. Within the labor force, individuals with high school diploma education have the highest percentage of unemployment, with 20.9% or 27 of them being unemployed.
| Educational Attainment | In Labor Force | Unemployed |
| Less than High School | 25 (69.4%) | 0 (0.0%) |
| High School Diploma | 129 (82.2%) | 33 (20.9%) |
| College / Associate Degree | 124 (88.6%) | 25 (17.7%) |
| Bachelor's Degree or higher | 1,195 (94.5%) | 0 (0.0%) |
| Total | 1,473 (92.2%) | 53 (3.3%) |
Employment Occupations by Sex in Hopkinton
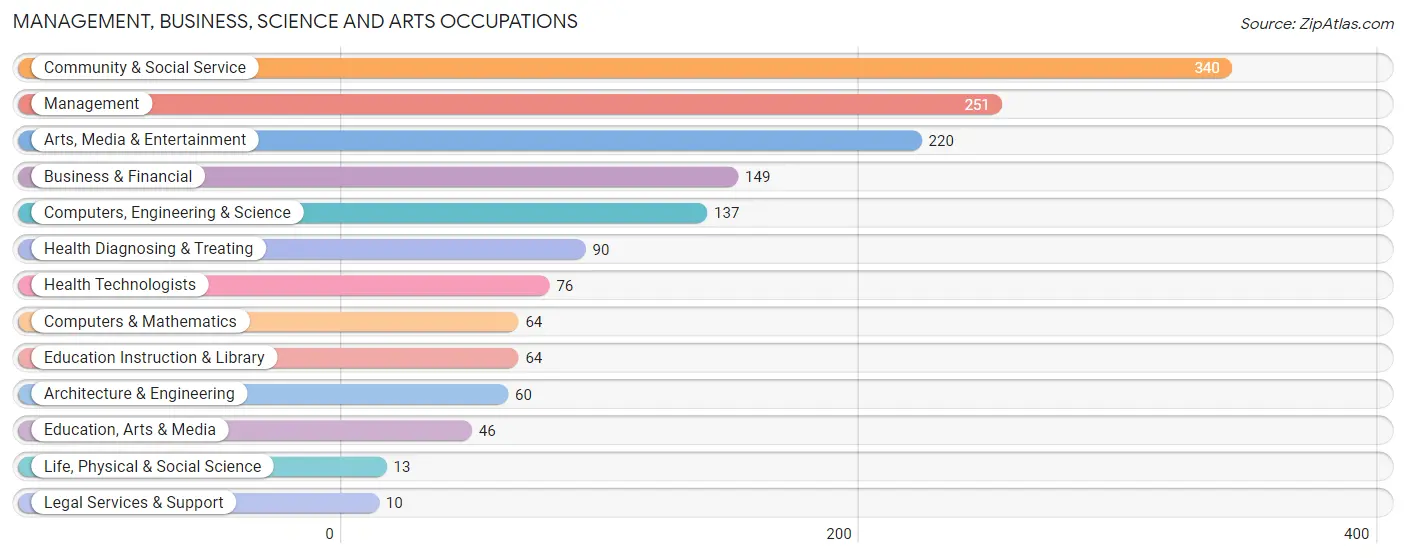
Management, Business, Science and Arts Occupations
The most common Management, Business, Science and Arts occupations in Hopkinton are Community & Social Service (340 | 19.1%), Management (251 | 14.1%), Arts, Media & Entertainment (220 | 12.3%), Business & Financial (149 | 8.4%), and Computers, Engineering & Science (137 | 7.7%).
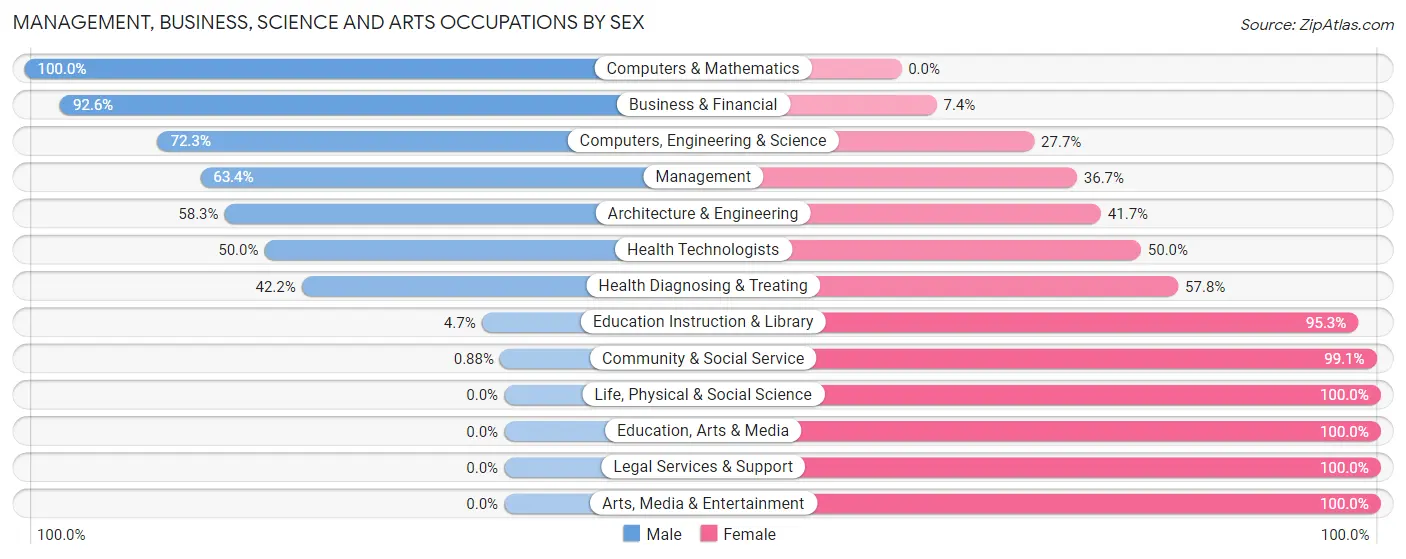
Management, Business, Science and Arts Occupations by Sex
Within the Management, Business, Science and Arts occupations in Hopkinton, the most male-oriented occupations are Computers & Mathematics (100.0%), Business & Financial (92.6%), and Computers, Engineering & Science (72.3%), while the most female-oriented occupations are Life, Physical & Social Science (100.0%), Education, Arts & Media (100.0%), and Legal Services & Support (100.0%).
| Occupation | Male | Female |
| Management | 159 (63.3%) | 92 (36.6%) |
| Business & Financial | 138 (92.6%) | 11 (7.4%) |
| Computers, Engineering & Science | 99 (72.3%) | 38 (27.7%) |
| Computers & Mathematics | 64 (100.0%) | 0 (0.0%) |
| Architecture & Engineering | 35 (58.3%) | 25 (41.7%) |
| Life, Physical & Social Science | 0 (0.0%) | 13 (100.0%) |
| Community & Social Service | 3 (0.9%) | 337 (99.1%) |
| Education, Arts & Media | 0 (0.0%) | 46 (100.0%) |
| Legal Services & Support | 0 (0.0%) | 10 (100.0%) |
| Education Instruction & Library | 3 (4.7%) | 61 (95.3%) |
| Arts, Media & Entertainment | 0 (0.0%) | 220 (100.0%) |
| Health Diagnosing & Treating | 38 (42.2%) | 52 (57.8%) |
| Health Technologists | 38 (50.0%) | 38 (50.0%) |
| Total (Category) | 437 (45.2%) | 530 (54.8%) |
| Total (Overall) | 1,009 (56.7%) | 772 (43.3%) |
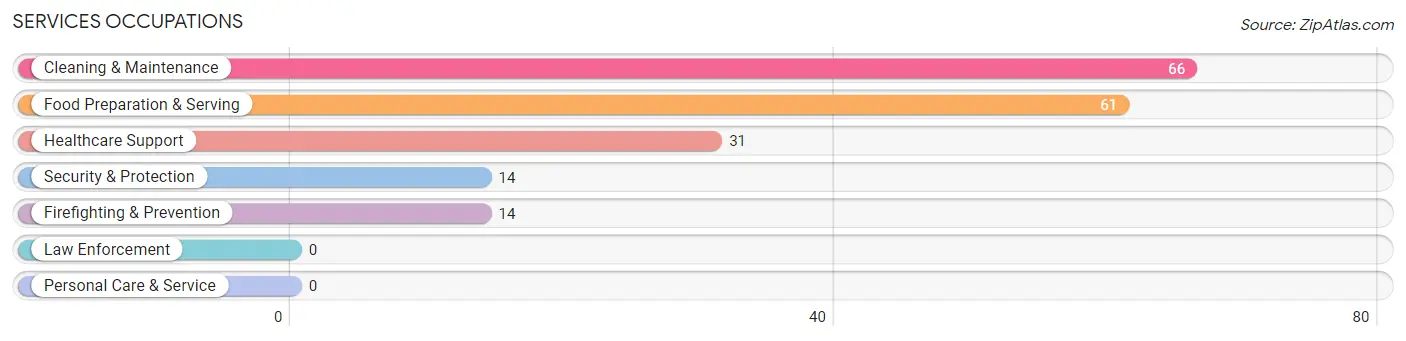
Services Occupations
The most common Services occupations in Hopkinton are Cleaning & Maintenance (66 | 3.7%), Food Preparation & Serving (61 | 3.4%), Healthcare Support (31 | 1.7%), Security & Protection (14 | 0.8%), and Firefighting & Prevention (14 | 0.8%).
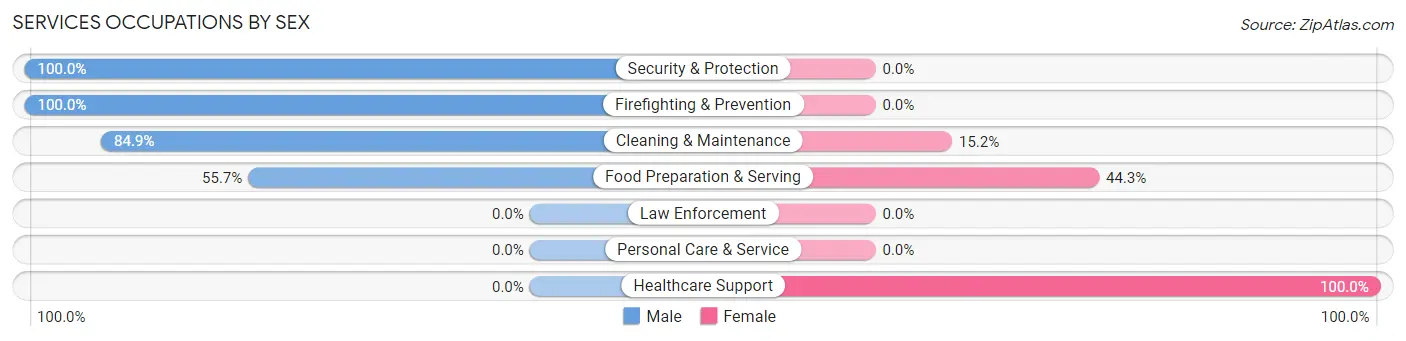
Services Occupations by Sex
Within the Services occupations in Hopkinton, the most male-oriented occupations are Security & Protection (100.0%), Firefighting & Prevention (100.0%), and Cleaning & Maintenance (84.9%), while the most female-oriented occupations are Healthcare Support (100.0%), Food Preparation & Serving (44.3%), and Cleaning & Maintenance (15.1%).
| Occupation | Male | Female |
| Healthcare Support | 0 (0.0%) | 31 (100.0%) |
| Security & Protection | 14 (100.0%) | 0 (0.0%) |
| Firefighting & Prevention | 14 (100.0%) | 0 (0.0%) |
| Law Enforcement | 0 (0.0%) | 0 (0.0%) |
| Food Preparation & Serving | 34 (55.7%) | 27 (44.3%) |
| Cleaning & Maintenance | 56 (84.9%) | 10 (15.1%) |
| Personal Care & Service | 0 (0.0%) | 0 (0.0%) |
| Total (Category) | 104 (60.5%) | 68 (39.5%) |
| Total (Overall) | 1,009 (56.7%) | 772 (43.3%) |
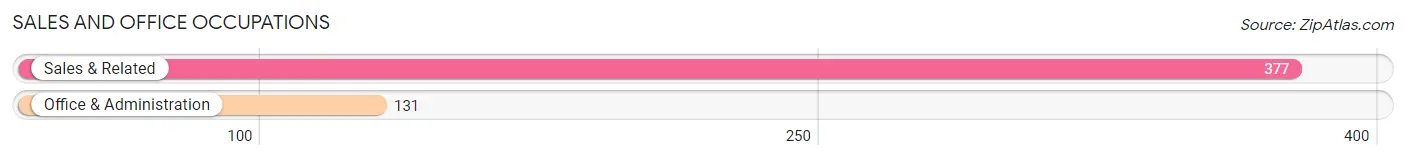
Sales and Office Occupations
The most common Sales and Office occupations in Hopkinton are Sales & Related (377 | 21.2%), and Office & Administration (131 | 7.4%).
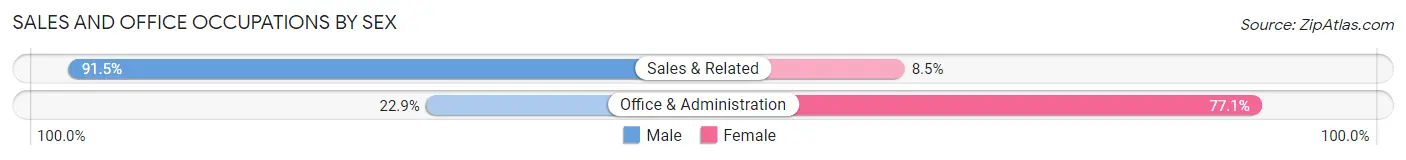
Sales and Office Occupations by Sex
| Occupation | Male | Female |
| Sales & Related | 345 (91.5%) | 32 (8.5%) |
| Office & Administration | 30 (22.9%) | 101 (77.1%) |
| Total (Category) | 375 (73.8%) | 133 (26.2%) |
| Total (Overall) | 1,009 (56.7%) | 772 (43.3%) |
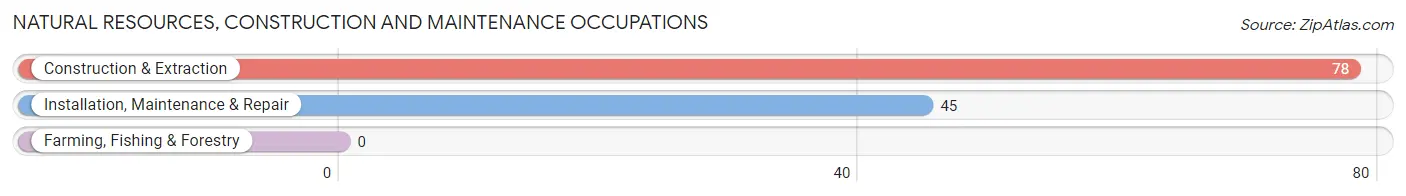
Natural Resources, Construction and Maintenance Occupations
The most common Natural Resources, Construction and Maintenance occupations in Hopkinton are Construction & Extraction (78 | 4.4%), and Installation, Maintenance & Repair (45 | 2.5%).
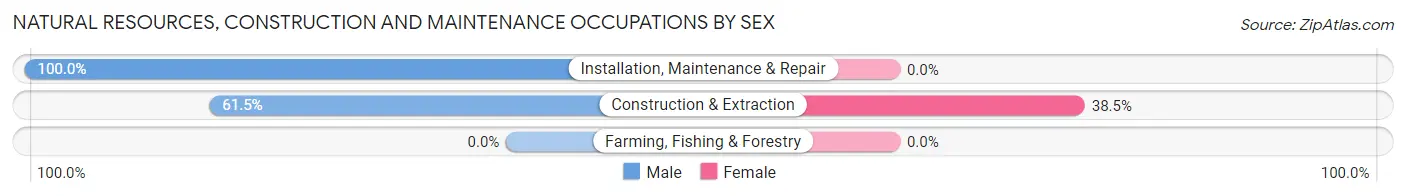
Natural Resources, Construction and Maintenance Occupations by Sex
| Occupation | Male | Female |
| Farming, Fishing & Forestry | 0 (0.0%) | 0 (0.0%) |
| Construction & Extraction | 48 (61.5%) | 30 (38.5%) |
| Installation, Maintenance & Repair | 45 (100.0%) | 0 (0.0%) |
| Total (Category) | 93 (75.6%) | 30 (24.4%) |
| Total (Overall) | 1,009 (56.7%) | 772 (43.3%) |
Production, Transportation and Moving Occupations
The most common Production, Transportation and Moving occupations in Hopkinton are , and Material Moving (11 | 0.6%).
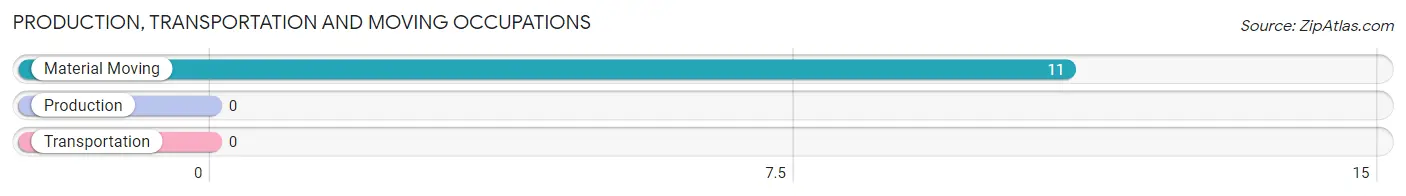
Production, Transportation and Moving Occupations by Sex
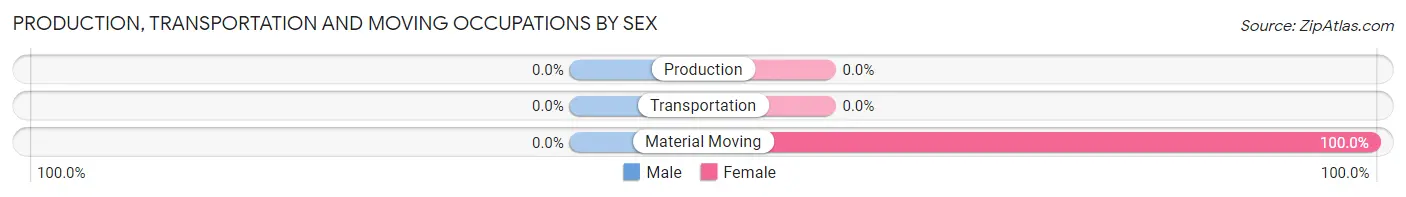
| Occupation | Male | Female |
| Production | 0 (0.0%) | 0 (0.0%) |
| Transportation | 0 (0.0%) | 0 (0.0%) |
| Material Moving | 0 (0.0%) | 11 (100.0%) |
| Total (Category) | 0 (0.0%) | 11 (100.0%) |
| Total (Overall) | 1,009 (56.7%) | 772 (43.3%) |
Employment Industries by Sex in Hopkinton
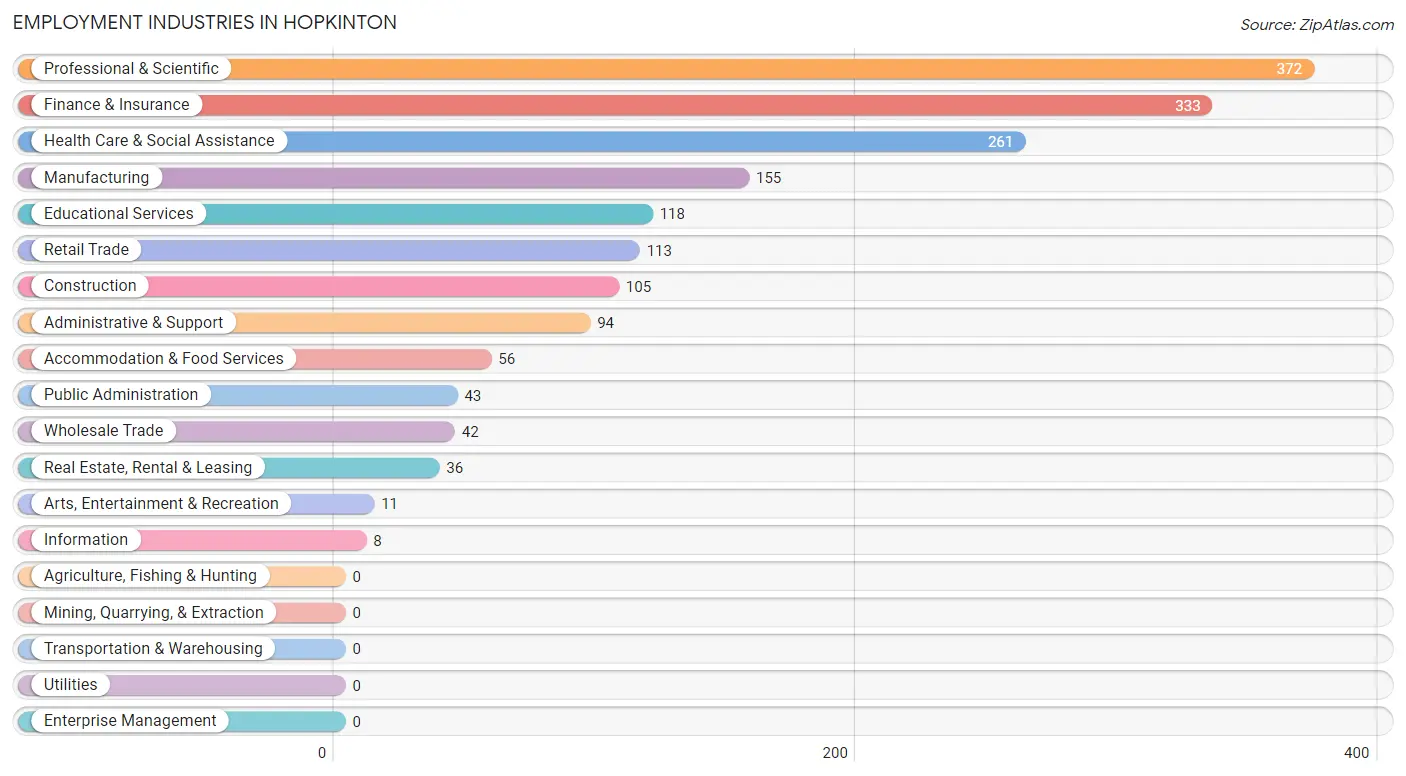
Employment Industries in Hopkinton
The major employment industries in Hopkinton include Professional & Scientific (372 | 20.9%), Finance & Insurance (333 | 18.7%), Health Care & Social Assistance (261 | 14.6%), Manufacturing (155 | 8.7%), and Educational Services (118 | 6.6%).
Employment Industries by Sex in Hopkinton
The Hopkinton industries that see more men than women are Wholesale Trade (100.0%), Information (100.0%), and Real Estate, Rental & Leasing (100.0%), whereas the industries that tend to have a higher number of women are Arts, Entertainment & Recreation (100.0%), Professional & Scientific (80.1%), and Educational Services (66.1%).
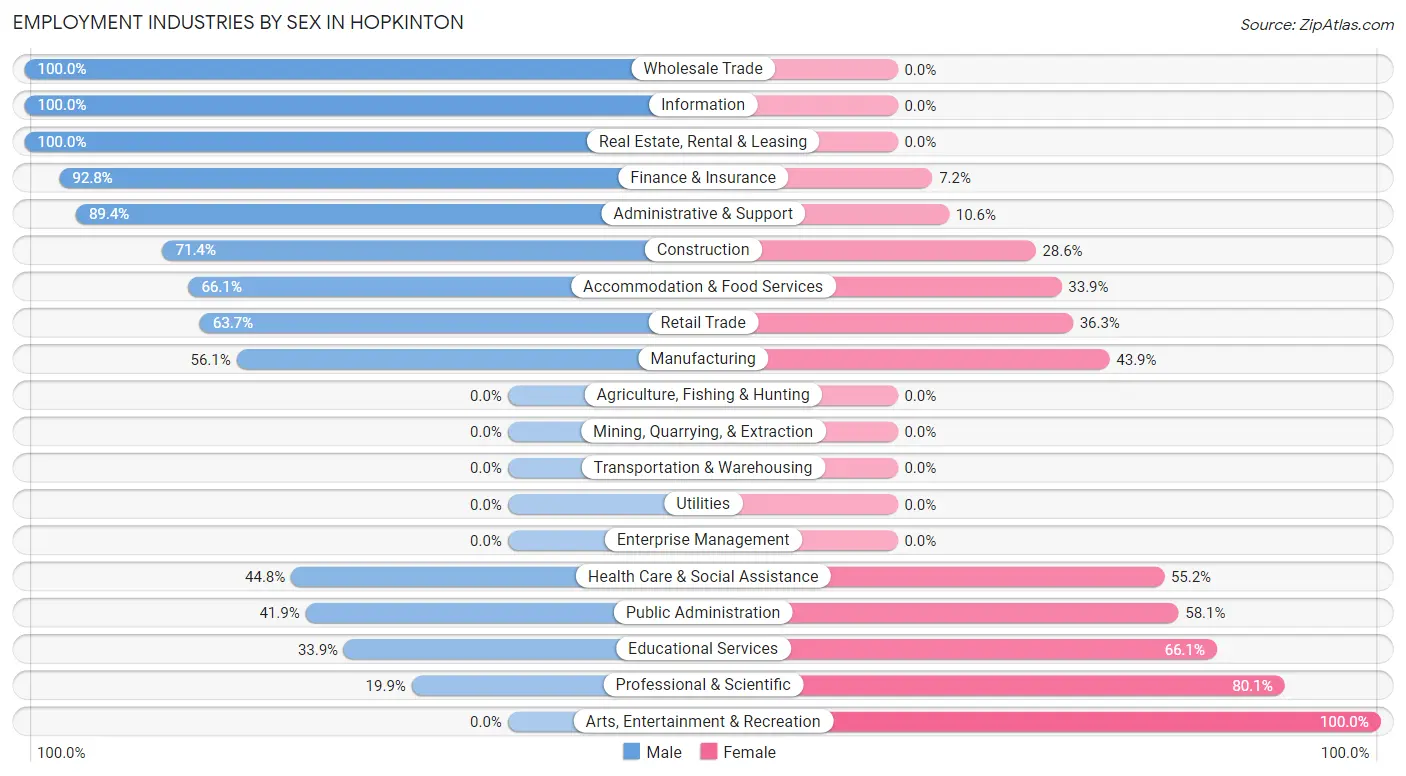
| Industry | Male | Female |
| Agriculture, Fishing & Hunting | 0 (0.0%) | 0 (0.0%) |
| Mining, Quarrying, & Extraction | 0 (0.0%) | 0 (0.0%) |
| Construction | 75 (71.4%) | 30 (28.6%) |
| Manufacturing | 87 (56.1%) | 68 (43.9%) |
| Wholesale Trade | 42 (100.0%) | 0 (0.0%) |
| Retail Trade | 72 (63.7%) | 41 (36.3%) |
| Transportation & Warehousing | 0 (0.0%) | 0 (0.0%) |
| Utilities | 0 (0.0%) | 0 (0.0%) |
| Information | 8 (100.0%) | 0 (0.0%) |
| Finance & Insurance | 309 (92.8%) | 24 (7.2%) |
| Real Estate, Rental & Leasing | 36 (100.0%) | 0 (0.0%) |
| Professional & Scientific | 74 (19.9%) | 298 (80.1%) |
| Enterprise Management | 0 (0.0%) | 0 (0.0%) |
| Administrative & Support | 84 (89.4%) | 10 (10.6%) |
| Educational Services | 40 (33.9%) | 78 (66.1%) |
| Health Care & Social Assistance | 117 (44.8%) | 144 (55.2%) |
| Arts, Entertainment & Recreation | 0 (0.0%) | 11 (100.0%) |
| Accommodation & Food Services | 37 (66.1%) | 19 (33.9%) |
| Public Administration | 18 (41.9%) | 25 (58.1%) |
| Total | 1,009 (56.7%) | 772 (43.3%) |
Education in Hopkinton
School Enrollment in Hopkinton
The most common levels of schooling among the 885 students in Hopkinton are high school (360 | 40.7%), college / undergraduate (143 | 16.2%), and elementary school (140 | 15.8%).
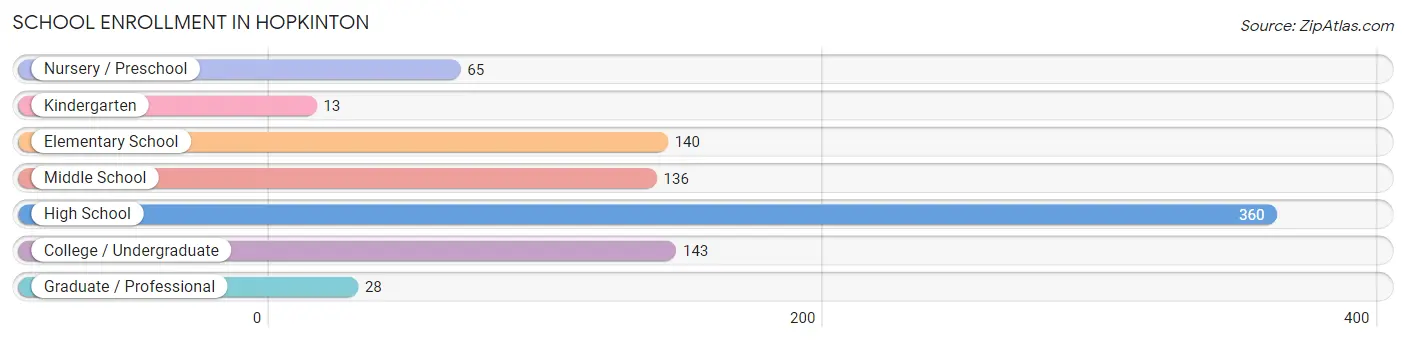
| School Level | # Students | % Students |
| Nursery / Preschool | 65 | 7.3% |
| Kindergarten | 13 | 1.5% |
| Elementary School | 140 | 15.8% |
| Middle School | 136 | 15.4% |
| High School | 360 | 40.7% |
| College / Undergraduate | 143 | 16.2% |
| Graduate / Professional | 28 | 3.2% |
| Total | 885 | 100.0% |
School Enrollment by Age by Funding Source in Hopkinton
Out of a total of 885 students who are enrolled in schools in Hopkinton, 219 (24.7%) attend a private institution, while the remaining 666 (75.3%) are enrolled in public schools. The age group of 18 to 19 year olds has the highest likelihood of being enrolled in private schools, with 70 (95.9% in the age bracket) enrolled. Conversely, the age group of 35 years and over has the lowest likelihood of being enrolled in a private school, with 10 (100.0% in the age bracket) attending a public institution.
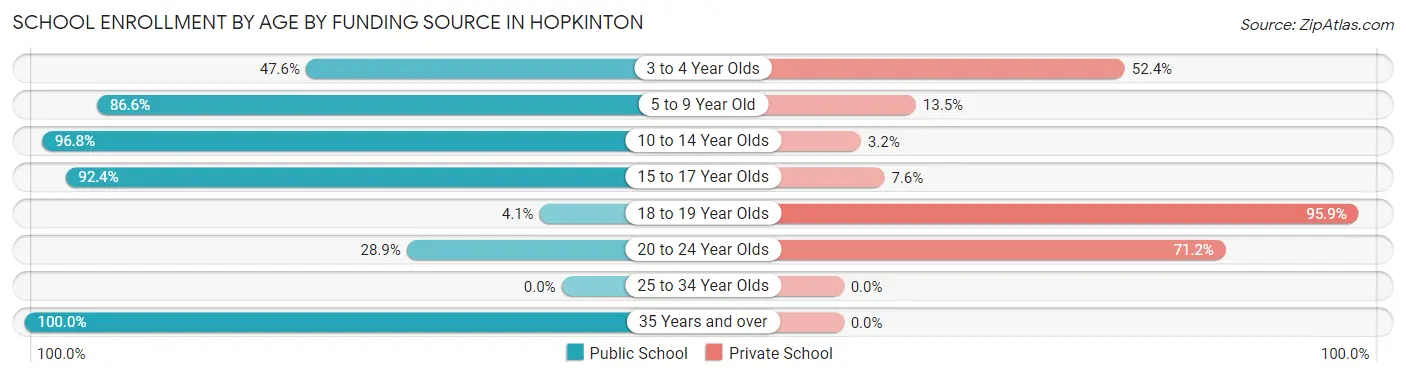
| Age Bracket | Public School | Private School |
| 3 to 4 Year Olds | 20 (47.6%) | 22 (52.4%) |
| 5 to 9 Year Old | 148 (86.6%) | 23 (13.5%) |
| 10 to 14 Year Olds | 151 (96.8%) | 5 (3.2%) |
| 15 to 17 Year Olds | 304 (92.4%) | 25 (7.6%) |
| 18 to 19 Year Olds | 3 (4.1%) | 70 (95.9%) |
| 20 to 24 Year Olds | 30 (28.8%) | 74 (71.2%) |
| 25 to 34 Year Olds | 0 (0.0%) | 0 (0.0%) |
| 35 Years and over | 10 (100.0%) | 0 (0.0%) |
| Total | 666 (75.3%) | 219 (24.7%) |
Educational Attainment by Field of Study in Hopkinton
Social sciences (303 | 20.3%), business (246 | 16.5%), visual & performing arts (243 | 16.3%), engineering (151 | 10.1%), and arts & humanities (98 | 6.6%) are the most common fields of study among 1,490 individuals in Hopkinton who have obtained a bachelor's degree or higher.
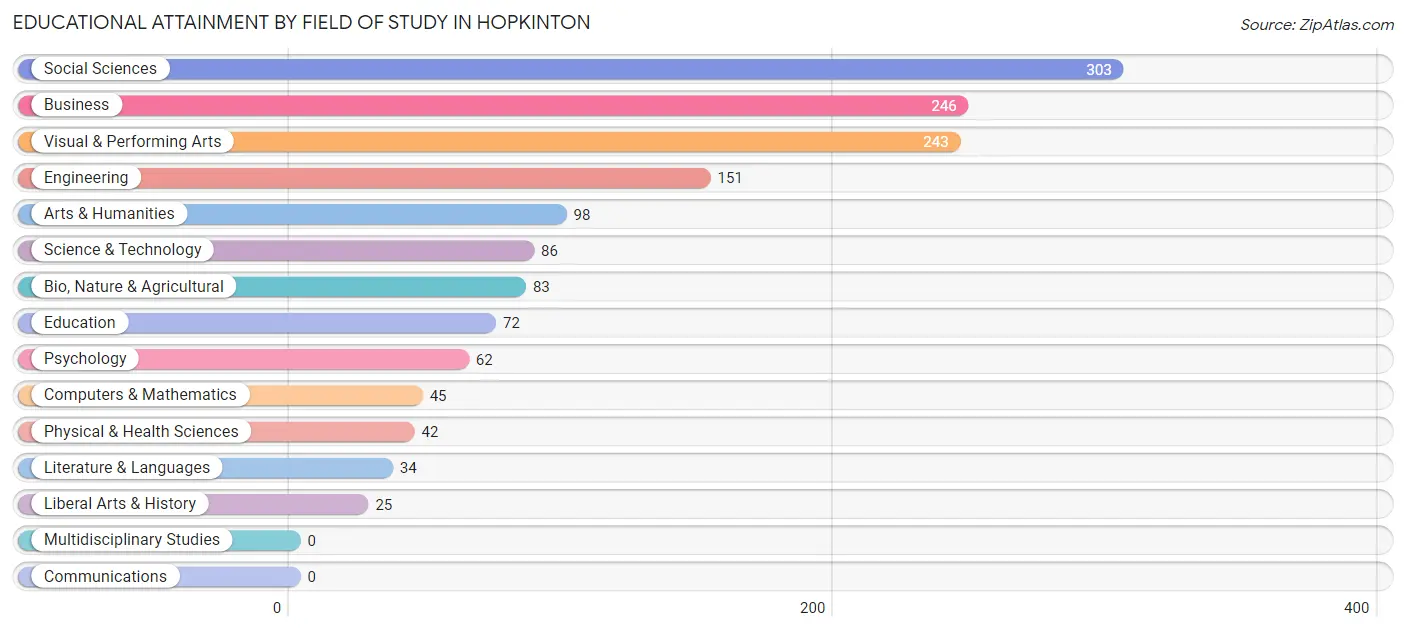
| Field of Study | # Graduates | % Graduates |
| Computers & Mathematics | 45 | 3.0% |
| Bio, Nature & Agricultural | 83 | 5.6% |
| Physical & Health Sciences | 42 | 2.8% |
| Psychology | 62 | 4.2% |
| Social Sciences | 303 | 20.3% |
| Engineering | 151 | 10.1% |
| Multidisciplinary Studies | 0 | 0.0% |
| Science & Technology | 86 | 5.8% |
| Business | 246 | 16.5% |
| Education | 72 | 4.8% |
| Literature & Languages | 34 | 2.3% |
| Liberal Arts & History | 25 | 1.7% |
| Visual & Performing Arts | 243 | 16.3% |
| Communications | 0 | 0.0% |
| Arts & Humanities | 98 | 6.6% |
| Total | 1,490 | 100.0% |
Transportation & Commute in Hopkinton
Vehicle Availability by Sex in Hopkinton
The most prevalent vehicle ownership categories in Hopkinton are males with 3 vehicles (471, accounting for 47.0%) and females with 3 vehicles (102, making up 86.0%).
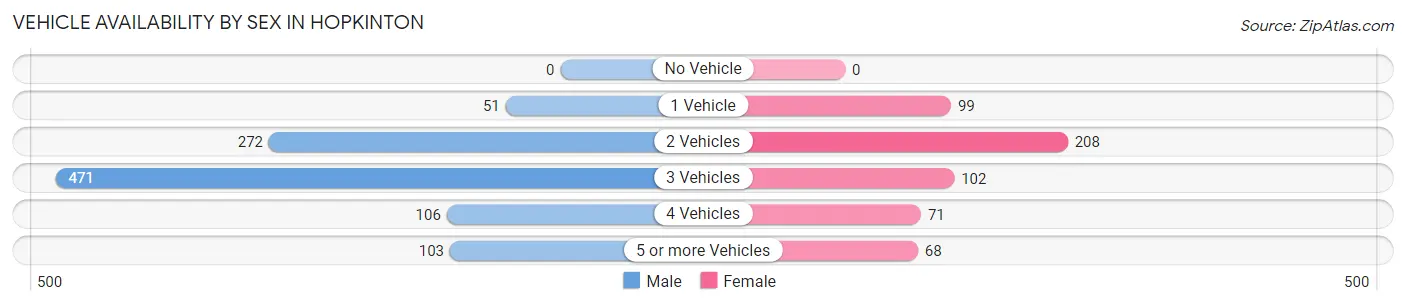
| Vehicles Available | Male | Female |
| No Vehicle | 0 (0.0%) | 0 (0.0%) |
| 1 Vehicle | 51 (5.1%) | 99 (18.1%) |
| 2 Vehicles | 272 (27.1%) | 208 (38.0%) |
| 3 Vehicles | 471 (47.0%) | 102 (18.6%) |
| 4 Vehicles | 106 (10.6%) | 71 (13.0%) |
| 5 or more Vehicles | 103 (10.3%) | 68 (12.4%) |
| Total | 1,003 (100.0%) | 548 (100.0%) |
Commute Time in Hopkinton
The most frequently occuring commute durations in Hopkinton are 45 to 59 minutes (520 commuters, 39.3%), 10 to 14 minutes (113 commuters, 8.5%), and 60 to 89 minutes (110 commuters, 8.3%).
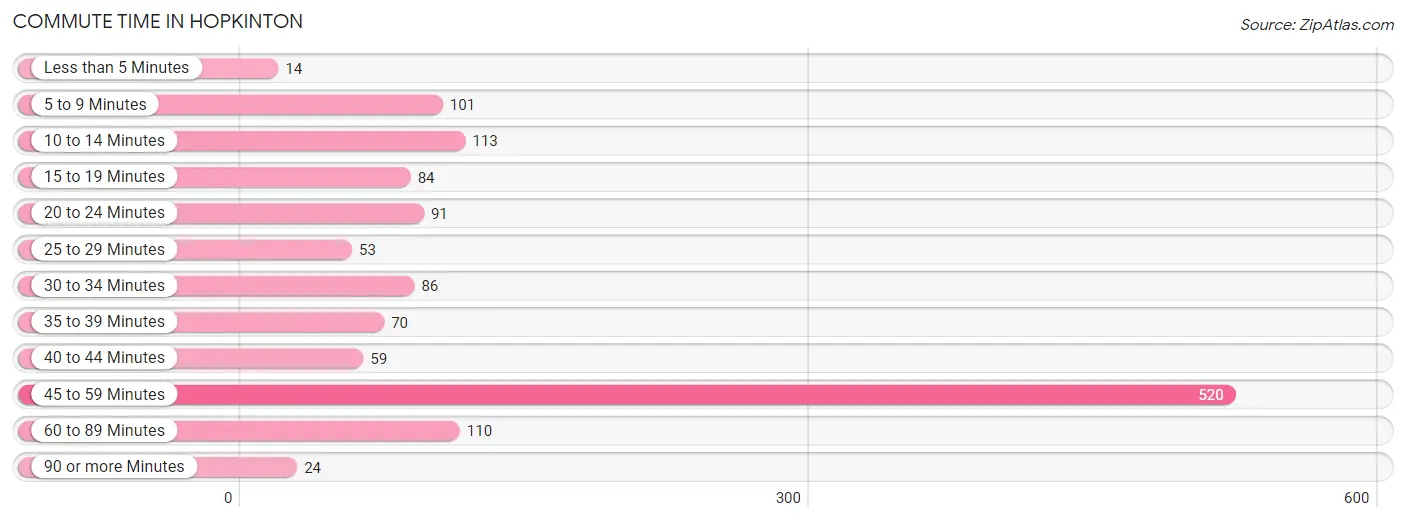
| Commute Time | # Commuters | % Commuters |
| Less than 5 Minutes | 14 | 1.1% |
| 5 to 9 Minutes | 101 | 7.6% |
| 10 to 14 Minutes | 113 | 8.5% |
| 15 to 19 Minutes | 84 | 6.3% |
| 20 to 24 Minutes | 91 | 6.9% |
| 25 to 29 Minutes | 53 | 4.0% |
| 30 to 34 Minutes | 86 | 6.5% |
| 35 to 39 Minutes | 70 | 5.3% |
| 40 to 44 Minutes | 59 | 4.4% |
| 45 to 59 Minutes | 520 | 39.3% |
| 60 to 89 Minutes | 110 | 8.3% |
| 90 or more Minutes | 24 | 1.8% |
Commute Time by Sex in Hopkinton
The most common commute times in Hopkinton are 45 to 59 minutes (426 commuters, 46.8%) for males and 45 to 59 minutes (94 commuters, 22.7%) for females.
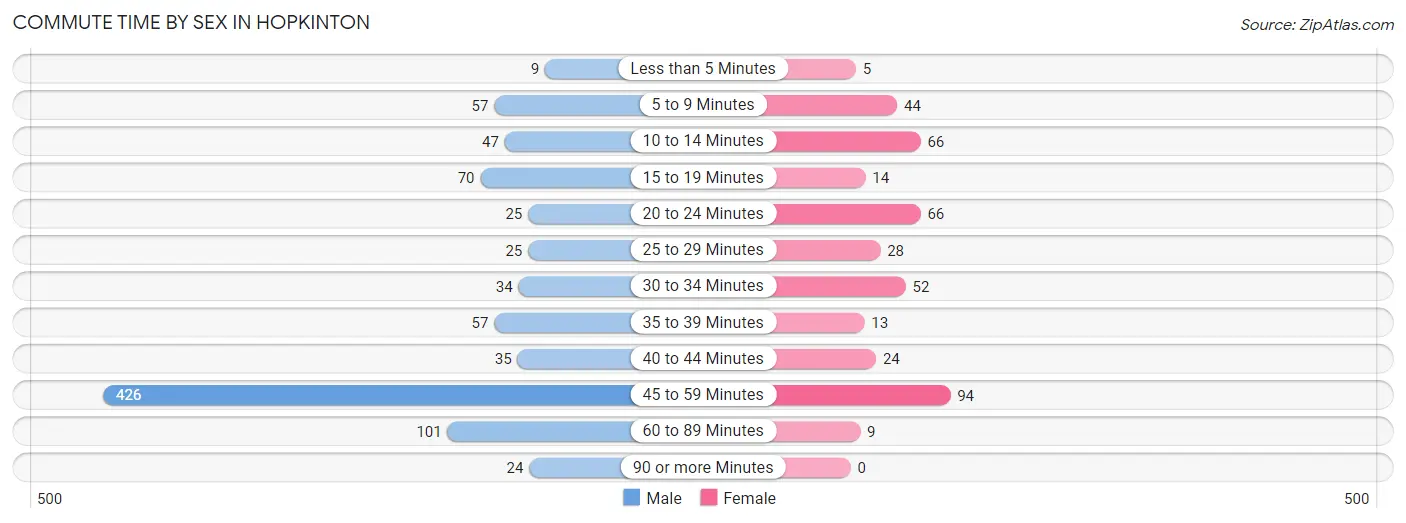
| Commute Time | Male | Female |
| Less than 5 Minutes | 9 (1.0%) | 5 (1.2%) |
| 5 to 9 Minutes | 57 (6.3%) | 44 (10.6%) |
| 10 to 14 Minutes | 47 (5.2%) | 66 (15.9%) |
| 15 to 19 Minutes | 70 (7.7%) | 14 (3.4%) |
| 20 to 24 Minutes | 25 (2.8%) | 66 (15.9%) |
| 25 to 29 Minutes | 25 (2.8%) | 28 (6.8%) |
| 30 to 34 Minutes | 34 (3.7%) | 52 (12.5%) |
| 35 to 39 Minutes | 57 (6.3%) | 13 (3.1%) |
| 40 to 44 Minutes | 35 (3.8%) | 24 (5.8%) |
| 45 to 59 Minutes | 426 (46.8%) | 94 (22.7%) |
| 60 to 89 Minutes | 101 (11.1%) | 9 (2.2%) |
| 90 or more Minutes | 24 (2.6%) | 0 (0.0%) |
Time of Departure to Work by Sex in Hopkinton
The most frequent times of departure to work in Hopkinton are 12:00 AM to 4:59 AM (256, 28.1%) for males and 8:00 AM to 8:29 AM (81, 19.5%) for females.
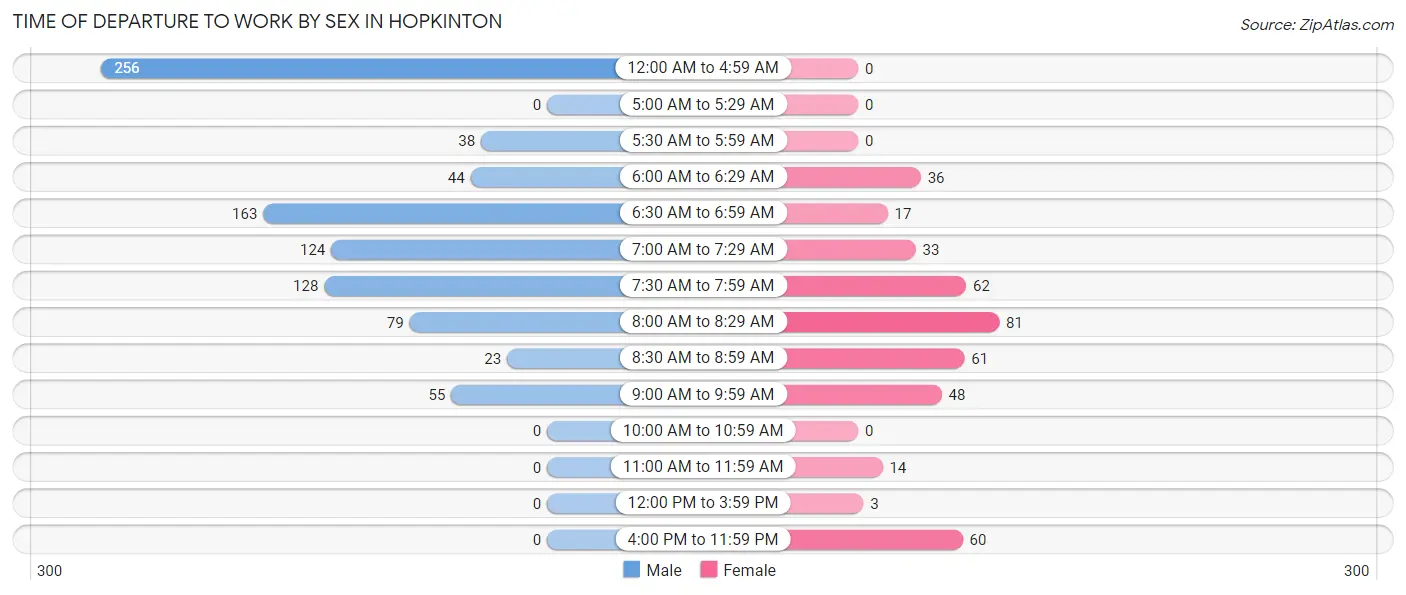
| Time of Departure | Male | Female |
| 12:00 AM to 4:59 AM | 256 (28.1%) | 0 (0.0%) |
| 5:00 AM to 5:29 AM | 0 (0.0%) | 0 (0.0%) |
| 5:30 AM to 5:59 AM | 38 (4.2%) | 0 (0.0%) |
| 6:00 AM to 6:29 AM | 44 (4.8%) | 36 (8.7%) |
| 6:30 AM to 6:59 AM | 163 (17.9%) | 17 (4.1%) |
| 7:00 AM to 7:29 AM | 124 (13.6%) | 33 (8.0%) |
| 7:30 AM to 7:59 AM | 128 (14.1%) | 62 (14.9%) |
| 8:00 AM to 8:29 AM | 79 (8.7%) | 81 (19.5%) |
| 8:30 AM to 8:59 AM | 23 (2.5%) | 61 (14.7%) |
| 9:00 AM to 9:59 AM | 55 (6.0%) | 48 (11.6%) |
| 10:00 AM to 10:59 AM | 0 (0.0%) | 0 (0.0%) |
| 11:00 AM to 11:59 AM | 0 (0.0%) | 14 (3.4%) |
| 12:00 PM to 3:59 PM | 0 (0.0%) | 3 (0.7%) |
| 4:00 PM to 11:59 PM | 0 (0.0%) | 60 (14.5%) |
| Total | 910 (100.0%) | 415 (100.0%) |
Housing Occupancy in Hopkinton
Occupancy by Ownership in Hopkinton
Of the total 1,269 dwellings in Hopkinton, owner-occupied units account for 989 (77.9%), while renter-occupied units make up 280 (22.1%).
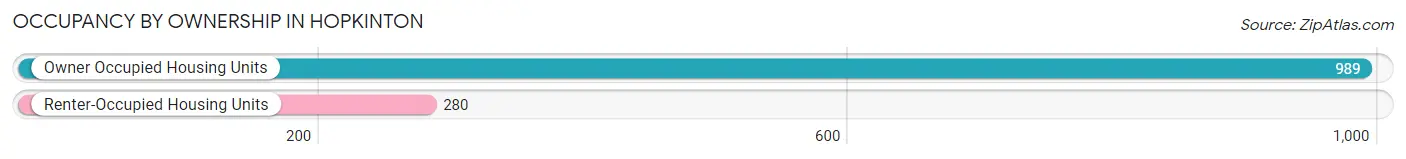
| Occupancy | # Housing Units | % Housing Units |
| Owner Occupied Housing Units | 989 | 77.9% |
| Renter-Occupied Housing Units | 280 | 22.1% |
| Total Occupied Housing Units | 1,269 | 100.0% |
Occupancy by Household Size in Hopkinton
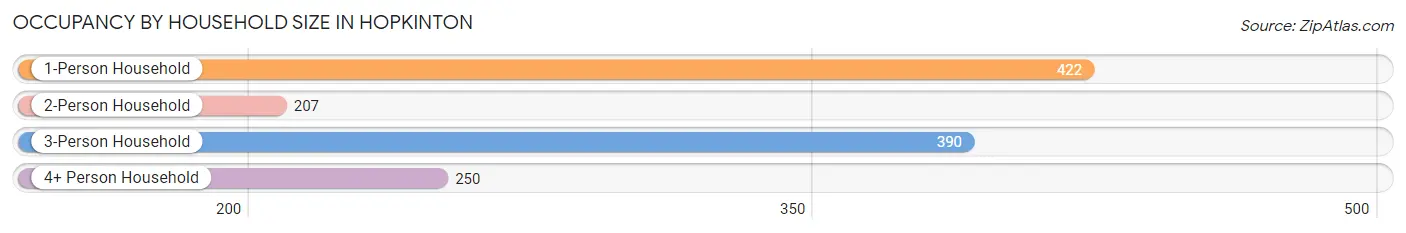
| Household Size | # Housing Units | % Housing Units |
| 1-Person Household | 422 | 33.3% |
| 2-Person Household | 207 | 16.3% |
| 3-Person Household | 390 | 30.7% |
| 4+ Person Household | 250 | 19.7% |
| Total Housing Units | 1,269 | 100.0% |
Occupancy by Ownership by Household Size in Hopkinton
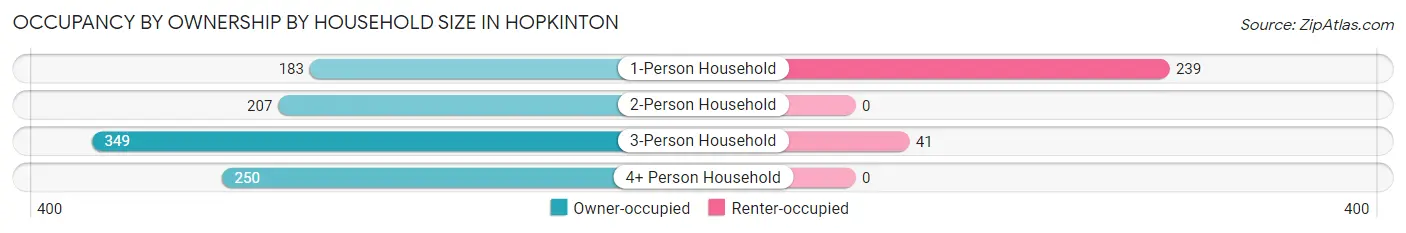
| Household Size | Owner-occupied | Renter-occupied |
| 1-Person Household | 183 (43.4%) | 239 (56.6%) |
| 2-Person Household | 207 (100.0%) | 0 (0.0%) |
| 3-Person Household | 349 (89.5%) | 41 (10.5%) |
| 4+ Person Household | 250 (100.0%) | 0 (0.0%) |
| Total Housing Units | 989 (77.9%) | 280 (22.1%) |
Occupancy by Educational Attainment in Hopkinton
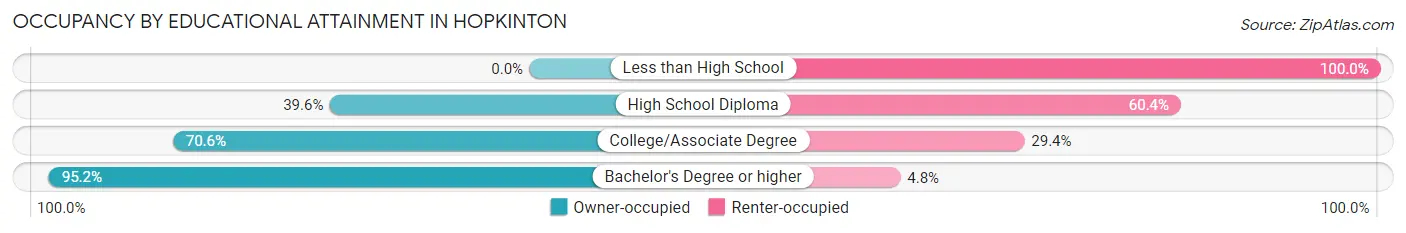
| Household Size | Owner-occupied | Renter-occupied |
| Less than High School | 0 (0.0%) | 6 (100.0%) |
| High School Diploma | 118 (39.6%) | 180 (60.4%) |
| College/Associate Degree | 137 (70.6%) | 57 (29.4%) |
| Bachelor's Degree or higher | 734 (95.2%) | 37 (4.8%) |
Occupancy by Age of Householder in Hopkinton
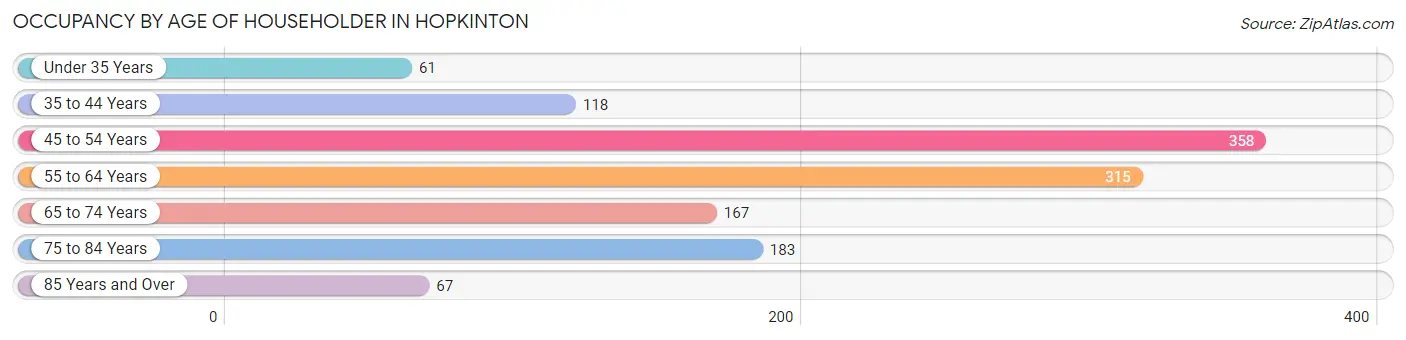
| Age Bracket | # Households | % Households |
| Under 35 Years | 61 | 4.8% |
| 35 to 44 Years | 118 | 9.3% |
| 45 to 54 Years | 358 | 28.2% |
| 55 to 64 Years | 315 | 24.8% |
| 65 to 74 Years | 167 | 13.2% |
| 75 to 84 Years | 183 | 14.4% |
| 85 Years and Over | 67 | 5.3% |
| Total | 1,269 | 100.0% |
Housing Finances in Hopkinton
Median Income by Occupancy in Hopkinton
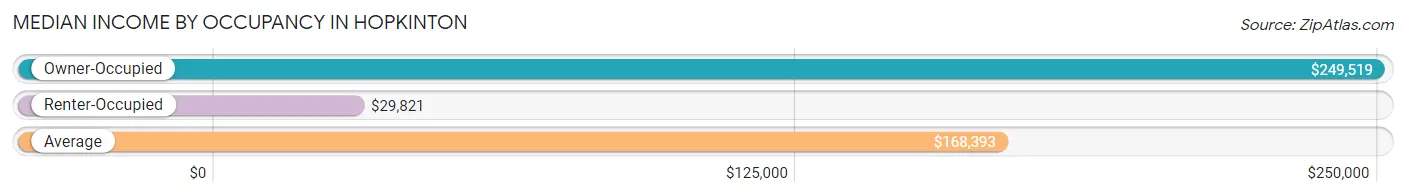
| Occupancy Type | # Households | Median Income |
| Owner-Occupied | 989 (77.9%) | $249,519 |
| Renter-Occupied | 280 (22.1%) | $29,821 |
| Average | 1,269 (100.0%) | $168,393 |
Occupancy by Householder Income Bracket in Hopkinton
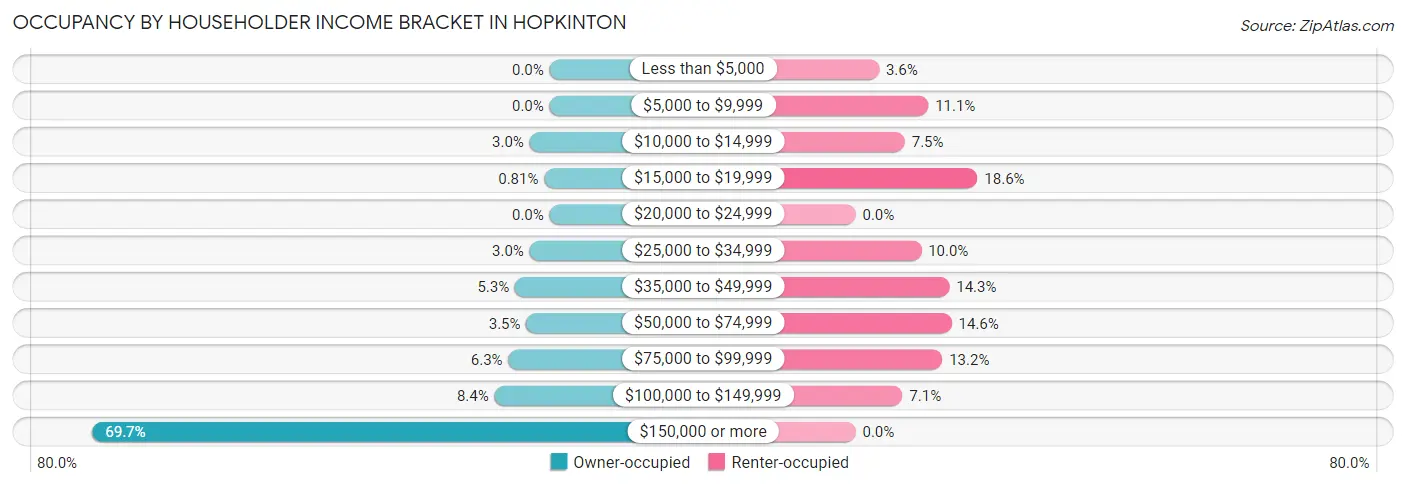
| Income Bracket | Owner-occupied | Renter-occupied |
| Less than $5,000 | 0 (0.0%) | 10 (3.6%) |
| $5,000 to $9,999 | 0 (0.0%) | 31 (11.1%) |
| $10,000 to $14,999 | 30 (3.0%) | 21 (7.5%) |
| $15,000 to $19,999 | 8 (0.8%) | 52 (18.6%) |
| $20,000 to $24,999 | 0 (0.0%) | 0 (0.0%) |
| $25,000 to $34,999 | 30 (3.0%) | 28 (10.0%) |
| $35,000 to $49,999 | 52 (5.3%) | 40 (14.3%) |
| $50,000 to $74,999 | 35 (3.5%) | 41 (14.6%) |
| $75,000 to $99,999 | 62 (6.3%) | 37 (13.2%) |
| $100,000 to $149,999 | 83 (8.4%) | 20 (7.1%) |
| $150,000 or more | 689 (69.7%) | 0 (0.0%) |
| Total | 989 (100.0%) | 280 (100.0%) |
Monthly Housing Cost Tiers in Hopkinton
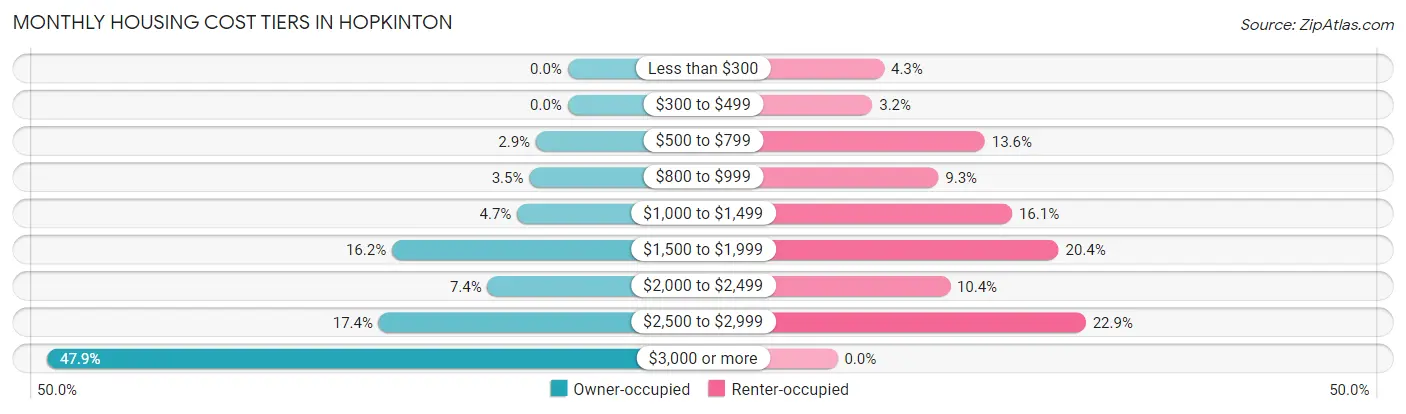
| Monthly Cost | Owner-occupied | Renter-occupied |
| Less than $300 | 0 (0.0%) | 12 (4.3%) |
| $300 to $499 | 0 (0.0%) | 9 (3.2%) |
| $500 to $799 | 29 (2.9%) | 38 (13.6%) |
| $800 to $999 | 35 (3.5%) | 26 (9.3%) |
| $1,000 to $1,499 | 46 (4.6%) | 45 (16.1%) |
| $1,500 to $1,999 | 160 (16.2%) | 57 (20.4%) |
| $2,000 to $2,499 | 73 (7.4%) | 29 (10.4%) |
| $2,500 to $2,999 | 172 (17.4%) | 64 (22.9%) |
| $3,000 or more | 474 (47.9%) | 0 (0.0%) |
| Total | 989 (100.0%) | 280 (100.0%) |
Physical Housing Characteristics in Hopkinton
Housing Structures in Hopkinton
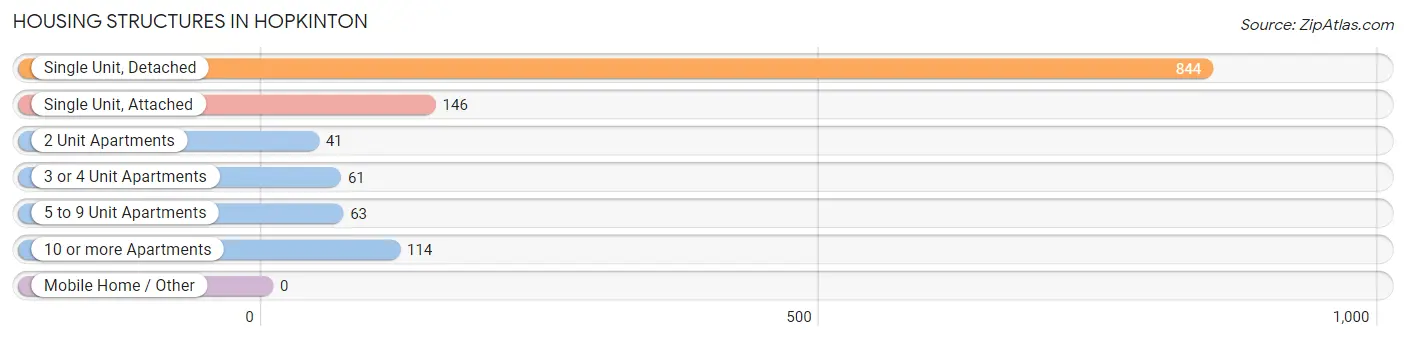
| Structure Type | # Housing Units | % Housing Units |
| Single Unit, Detached | 844 | 66.5% |
| Single Unit, Attached | 146 | 11.5% |
| 2 Unit Apartments | 41 | 3.2% |
| 3 or 4 Unit Apartments | 61 | 4.8% |
| 5 to 9 Unit Apartments | 63 | 5.0% |
| 10 or more Apartments | 114 | 9.0% |
| Mobile Home / Other | 0 | 0.0% |
| Total | 1,269 | 100.0% |
Housing Structures by Occupancy in Hopkinton
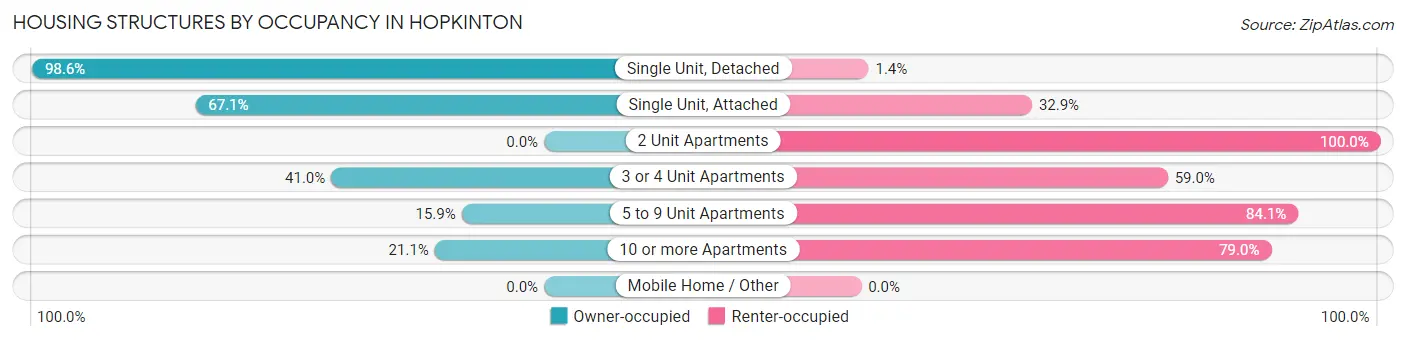
| Structure Type | Owner-occupied | Renter-occupied |
| Single Unit, Detached | 832 (98.6%) | 12 (1.4%) |
| Single Unit, Attached | 98 (67.1%) | 48 (32.9%) |
| 2 Unit Apartments | 0 (0.0%) | 41 (100.0%) |
| 3 or 4 Unit Apartments | 25 (41.0%) | 36 (59.0%) |
| 5 to 9 Unit Apartments | 10 (15.9%) | 53 (84.1%) |
| 10 or more Apartments | 24 (21.0%) | 90 (78.9%) |
| Mobile Home / Other | 0 (0.0%) | 0 (0.0%) |
| Total | 989 (77.9%) | 280 (22.1%) |
Housing Structures by Number of Rooms in Hopkinton
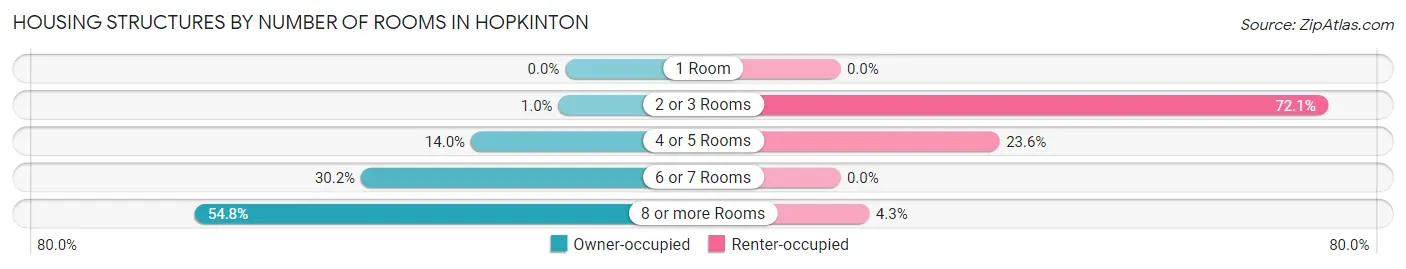
| Number of Rooms | Owner-occupied | Renter-occupied |
| 1 Room | 0 (0.0%) | 0 (0.0%) |
| 2 or 3 Rooms | 10 (1.0%) | 202 (72.1%) |
| 4 or 5 Rooms | 138 (14.0%) | 66 (23.6%) |
| 6 or 7 Rooms | 299 (30.2%) | 0 (0.0%) |
| 8 or more Rooms | 542 (54.8%) | 12 (4.3%) |
| Total | 989 (100.0%) | 280 (100.0%) |
Housing Structure by Heating Type in Hopkinton
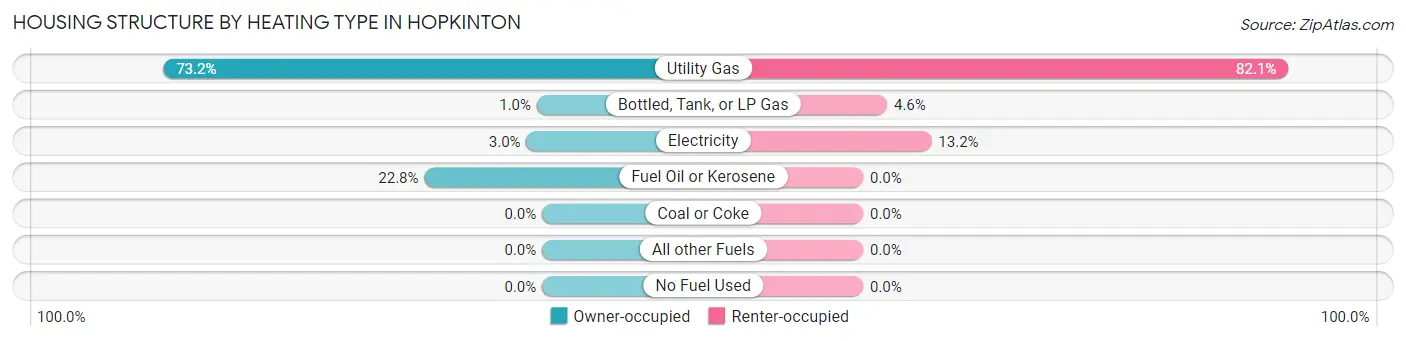
| Heating Type | Owner-occupied | Renter-occupied |
| Utility Gas | 724 (73.2%) | 230 (82.1%) |
| Bottled, Tank, or LP Gas | 10 (1.0%) | 13 (4.6%) |
| Electricity | 30 (3.0%) | 37 (13.2%) |
| Fuel Oil or Kerosene | 225 (22.8%) | 0 (0.0%) |
| Coal or Coke | 0 (0.0%) | 0 (0.0%) |
| All other Fuels | 0 (0.0%) | 0 (0.0%) |
| No Fuel Used | 0 (0.0%) | 0 (0.0%) |
| Total | 989 (100.0%) | 280 (100.0%) |
Household Vehicle Usage in Hopkinton
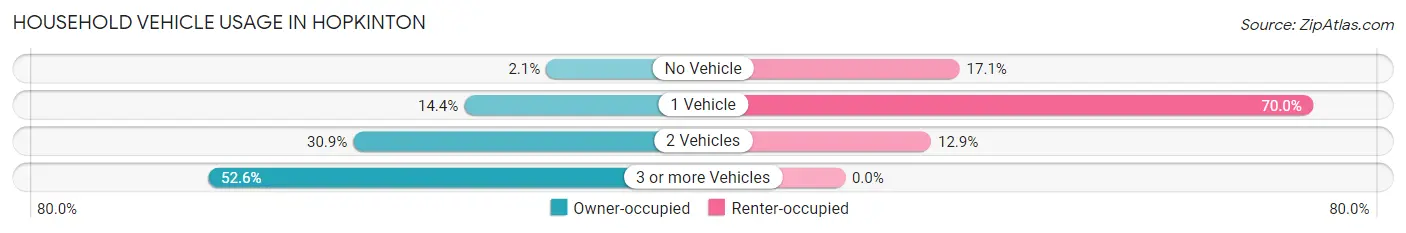
| Vehicles per Household | Owner-occupied | Renter-occupied |
| No Vehicle | 21 (2.1%) | 48 (17.1%) |
| 1 Vehicle | 142 (14.4%) | 196 (70.0%) |
| 2 Vehicles | 306 (30.9%) | 36 (12.9%) |
| 3 or more Vehicles | 520 (52.6%) | 0 (0.0%) |
| Total | 989 (100.0%) | 280 (100.0%) |
Real Estate & Mortgages in Hopkinton
Real Estate and Mortgage Overview in Hopkinton
| Characteristic | Without Mortgage | With Mortgage |
| Housing Units | 195 | 794 |
| Median Property Value | $578,500 | $607,700 |
| Median Household Income | $89,327 | $646 |
| Monthly Housing Costs | $1,389 | $474 |
| Real Estate Taxes | $7,221 | $0 |
Property Value by Mortgage Status in Hopkinton
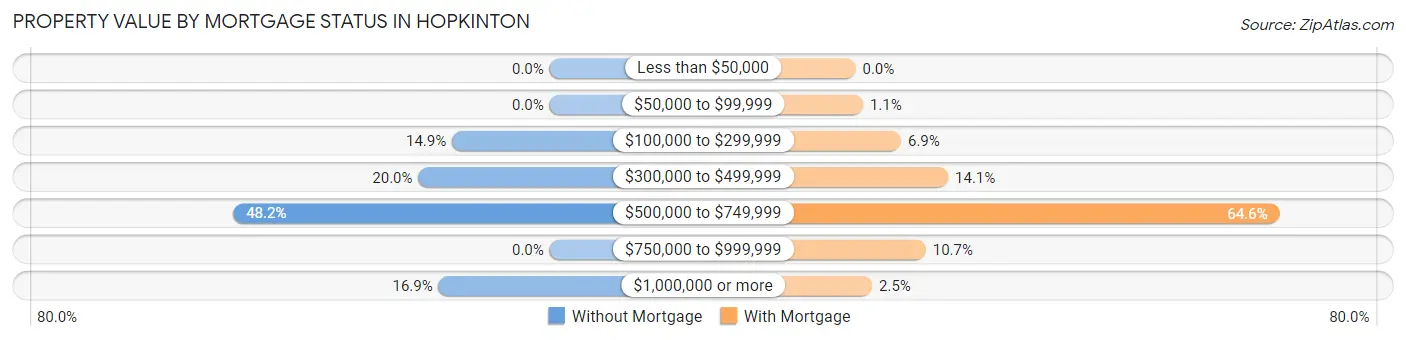
| Property Value | Without Mortgage | With Mortgage |
| Less than $50,000 | 0 (0.0%) | 0 (0.0%) |
| $50,000 to $99,999 | 0 (0.0%) | 9 (1.1%) |
| $100,000 to $299,999 | 29 (14.9%) | 55 (6.9%) |
| $300,000 to $499,999 | 39 (20.0%) | 112 (14.1%) |
| $500,000 to $749,999 | 94 (48.2%) | 513 (64.6%) |
| $750,000 to $999,999 | 0 (0.0%) | 85 (10.7%) |
| $1,000,000 or more | 33 (16.9%) | 20 (2.5%) |
| Total | 195 (100.0%) | 794 (100.0%) |
Household Income by Mortgage Status in Hopkinton
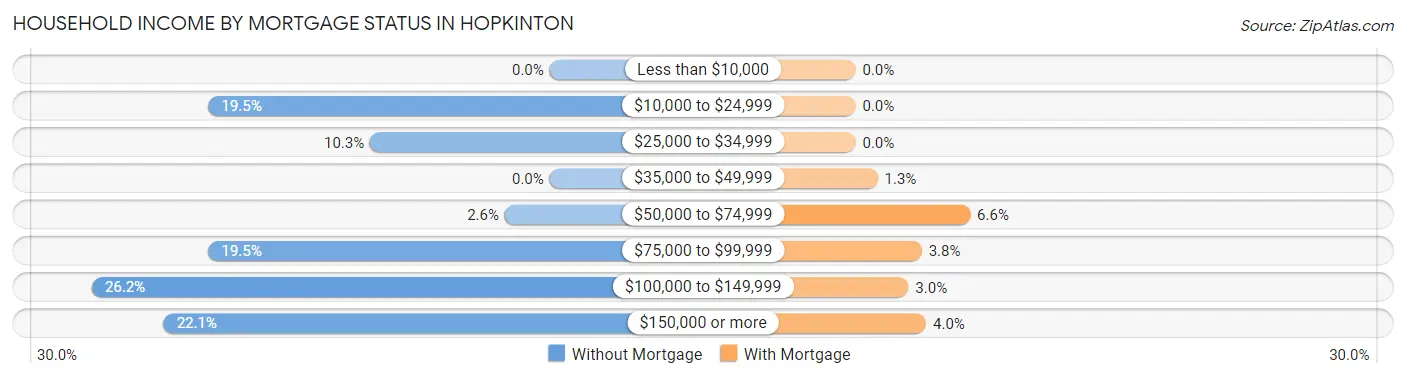
| Household Income | Without Mortgage | With Mortgage |
| Less than $10,000 | 0 (0.0%) | 0 (0.0%) |
| $10,000 to $24,999 | 38 (19.5%) | 0 (0.0%) |
| $25,000 to $34,999 | 20 (10.3%) | 0 (0.0%) |
| $35,000 to $49,999 | 0 (0.0%) | 10 (1.3%) |
| $50,000 to $74,999 | 5 (2.6%) | 52 (6.6%) |
| $75,000 to $99,999 | 38 (19.5%) | 30 (3.8%) |
| $100,000 to $149,999 | 51 (26.2%) | 24 (3.0%) |
| $150,000 or more | 43 (22.1%) | 32 (4.0%) |
| Total | 195 (100.0%) | 794 (100.0%) |
Property Value to Household Income Ratio in Hopkinton
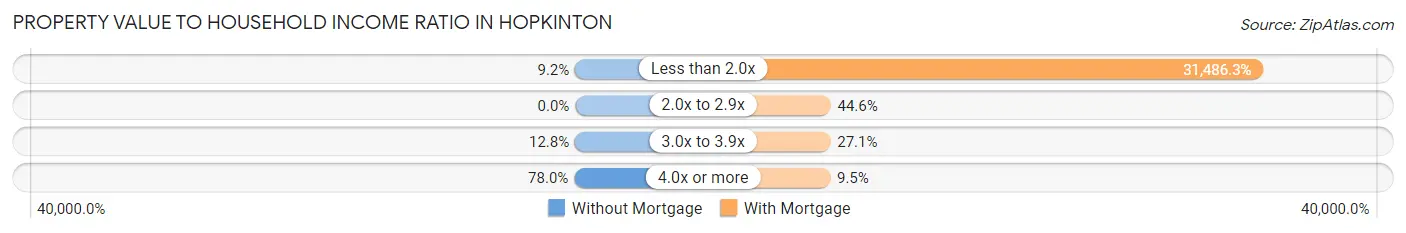
| Value-to-Income Ratio | Without Mortgage | With Mortgage |
| Less than 2.0x | 18 (9.2%) | 250,001 (31,486.3%) |
| 2.0x to 2.9x | 0 (0.0%) | 354 (44.6%) |
| 3.0x to 3.9x | 25 (12.8%) | 215 (27.1%) |
| 4.0x or more | 152 (77.9%) | 75 (9.5%) |
| Total | 195 (100.0%) | 794 (100.0%) |
Real Estate Taxes by Mortgage Status in Hopkinton
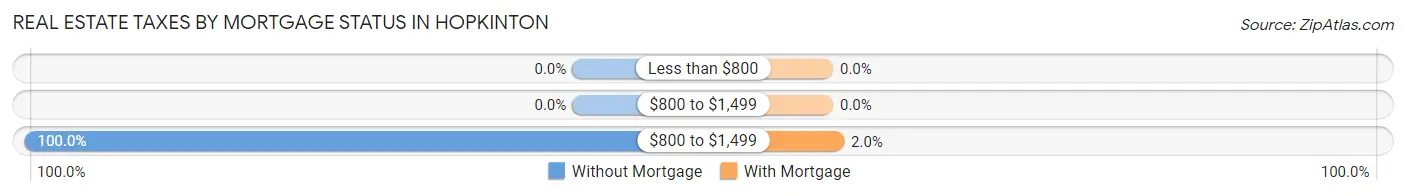
| Property Taxes | Without Mortgage | With Mortgage |
| Less than $800 | 0 (0.0%) | 0 (0.0%) |
| $800 to $1,499 | 0 (0.0%) | 0 (0.0%) |
| $800 to $1,499 | 195 (100.0%) | 16 (2.0%) |
| Total | 195 (100.0%) | 794 (100.0%) |
Health & Disability in Hopkinton
Health Insurance Coverage by Age in Hopkinton
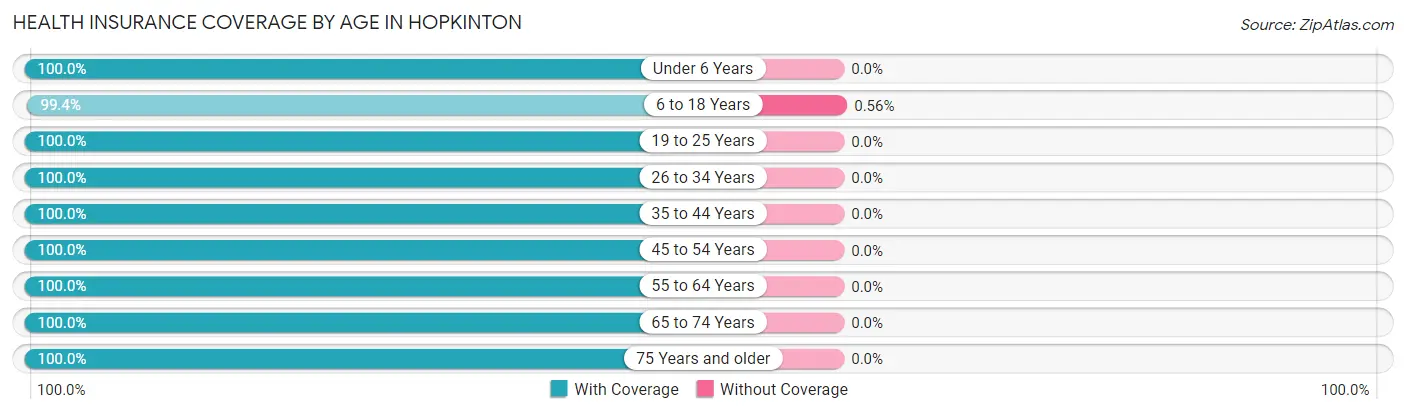
| Age Bracket | With Coverage | Without Coverage |
| Under 6 Years | 183 (100.0%) | 0 (0.0%) |
| 6 to 18 Years | 705 (99.4%) | 4 (0.6%) |
| 19 to 25 Years | 216 (100.0%) | 0 (0.0%) |
| 26 to 34 Years | 87 (100.0%) | 0 (0.0%) |
| 35 to 44 Years | 251 (100.0%) | 0 (0.0%) |
| 45 to 54 Years | 790 (100.0%) | 0 (0.0%) |
| 55 to 64 Years | 437 (100.0%) | 0 (0.0%) |
| 65 to 74 Years | 294 (100.0%) | 0 (0.0%) |
| 75 Years and older | 303 (100.0%) | 0 (0.0%) |
| Total | 3,266 (99.9%) | 4 (0.1%) |
Health Insurance Coverage by Citizenship Status in Hopkinton
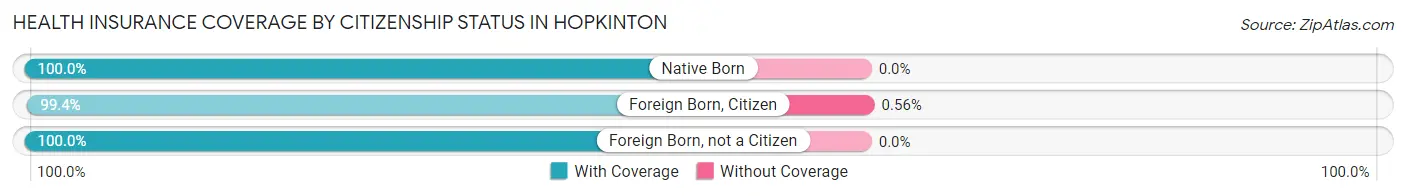
| Citizenship Status | With Coverage | Without Coverage |
| Native Born | 183 (100.0%) | 0 (0.0%) |
| Foreign Born, Citizen | 705 (99.4%) | 4 (0.6%) |
| Foreign Born, not a Citizen | 216 (100.0%) | 0 (0.0%) |
Health Insurance Coverage by Household Income in Hopkinton
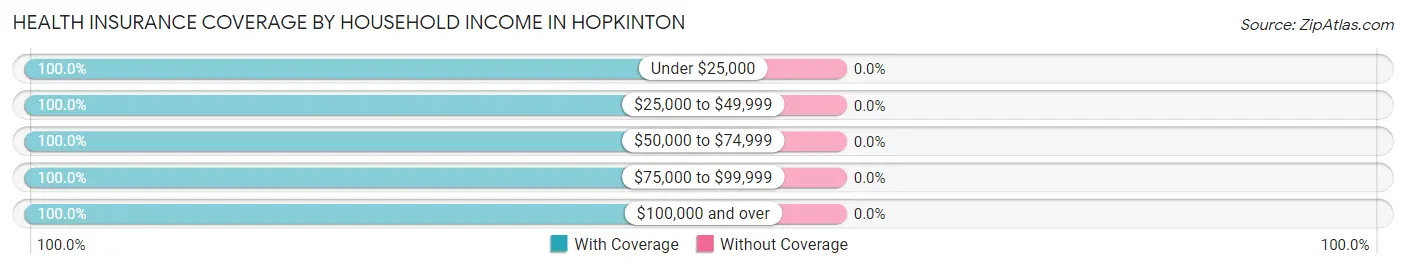
| Household Income | With Coverage | Without Coverage |
| Under $25,000 | 152 (100.0%) | 0 (0.0%) |
| $25,000 to $49,999 | 250 (100.0%) | 0 (0.0%) |
| $50,000 to $74,999 | 118 (100.0%) | 0 (0.0%) |
| $75,000 to $99,999 | 184 (100.0%) | 0 (0.0%) |
| $100,000 and over | 2,533 (100.0%) | 0 (0.0%) |
Public vs Private Health Insurance Coverage by Age in Hopkinton
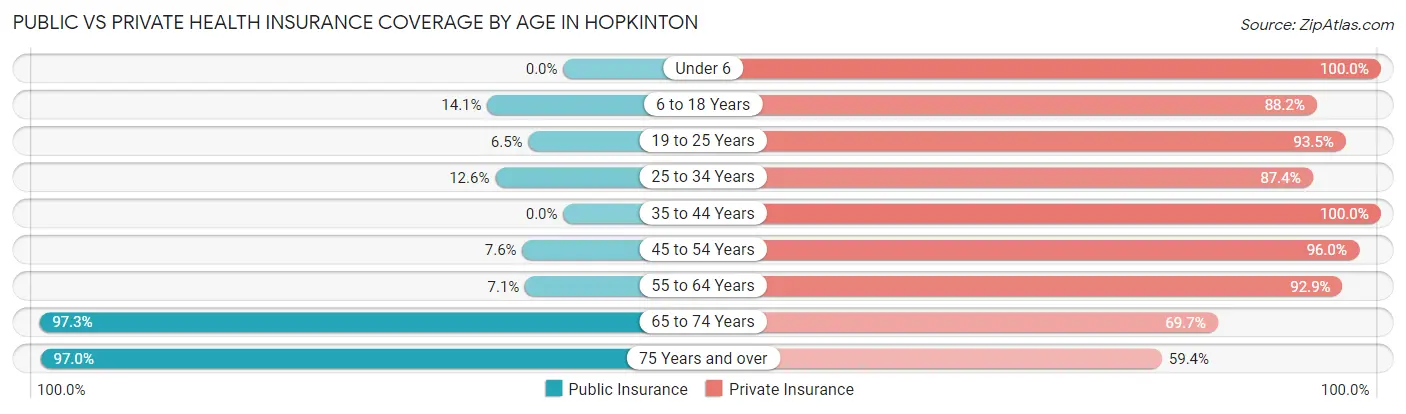
| Age Bracket | Public Insurance | Private Insurance |
| Under 6 | 0 (0.0%) | 183 (100.0%) |
| 6 to 18 Years | 100 (14.1%) | 625 (88.1%) |
| 19 to 25 Years | 14 (6.5%) | 202 (93.5%) |
| 25 to 34 Years | 11 (12.6%) | 76 (87.4%) |
| 35 to 44 Years | 0 (0.0%) | 251 (100.0%) |
| 45 to 54 Years | 60 (7.6%) | 758 (96.0%) |
| 55 to 64 Years | 31 (7.1%) | 406 (92.9%) |
| 65 to 74 Years | 286 (97.3%) | 205 (69.7%) |
| 75 Years and over | 294 (97.0%) | 180 (59.4%) |
| Total | 796 (24.3%) | 2,886 (88.3%) |
Disability Status by Sex by Age in Hopkinton
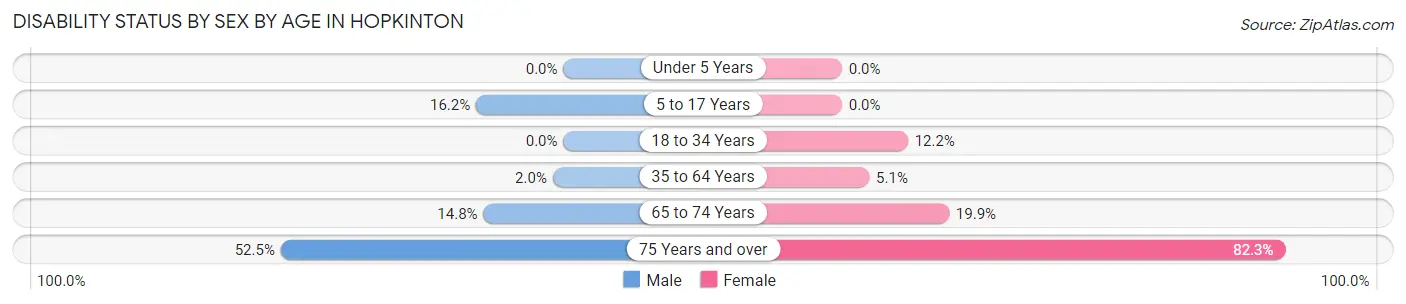
| Age Bracket | Male | Female |
| Under 5 Years | 0 (0.0%) | 0 (0.0%) |
| 5 to 17 Years | 29 (16.2%) | 0 (0.0%) |
| 18 to 34 Years | 0 (0.0%) | 28 (12.2%) |
| 35 to 64 Years | 14 (2.0%) | 39 (5.1%) |
| 65 to 74 Years | 19 (14.8%) | 33 (19.9%) |
| 75 Years and over | 64 (52.5%) | 149 (82.3%) |
Disability Class by Sex by Age in Hopkinton
Disability Class: Hearing Difficulty
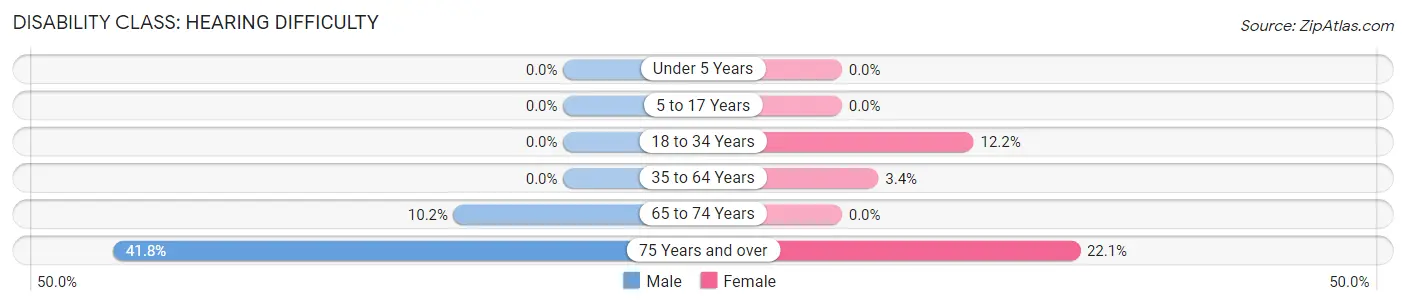
| Age Bracket | Male | Female |
| Under 5 Years | 0 (0.0%) | 0 (0.0%) |
| 5 to 17 Years | 0 (0.0%) | 0 (0.0%) |
| 18 to 34 Years | 0 (0.0%) | 28 (12.2%) |
| 35 to 64 Years | 0 (0.0%) | 26 (3.4%) |
| 65 to 74 Years | 13 (10.2%) | 0 (0.0%) |
| 75 Years and over | 51 (41.8%) | 40 (22.1%) |
Disability Class: Vision Difficulty
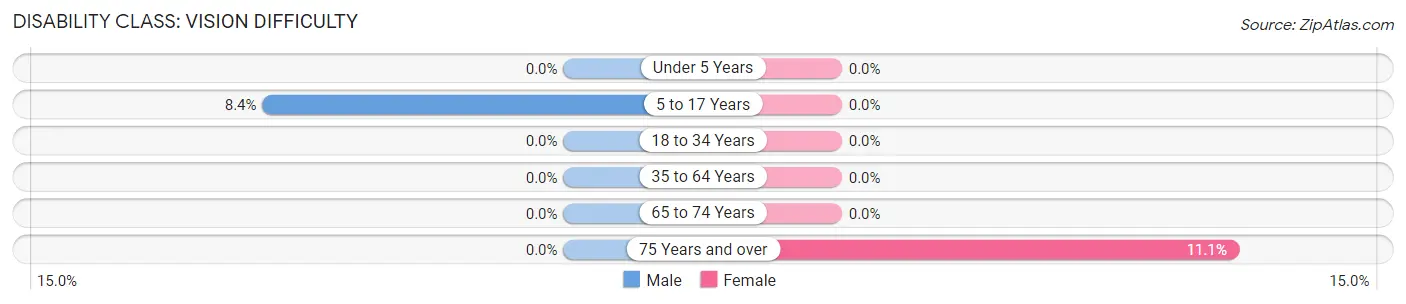
| Age Bracket | Male | Female |
| Under 5 Years | 0 (0.0%) | 0 (0.0%) |
| 5 to 17 Years | 15 (8.4%) | 0 (0.0%) |
| 18 to 34 Years | 0 (0.0%) | 0 (0.0%) |
| 35 to 64 Years | 0 (0.0%) | 0 (0.0%) |
| 65 to 74 Years | 0 (0.0%) | 0 (0.0%) |
| 75 Years and over | 0 (0.0%) | 20 (11.1%) |
Disability Class: Cognitive Difficulty
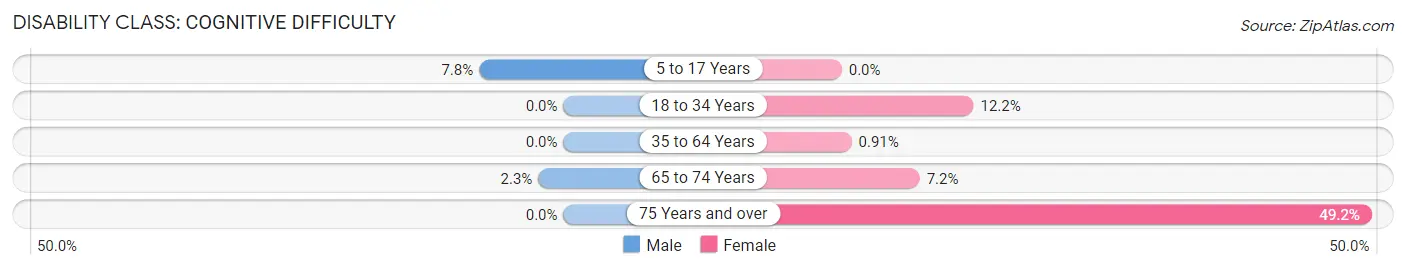
| Age Bracket | Male | Female |
| 5 to 17 Years | 14 (7.8%) | 0 (0.0%) |
| 18 to 34 Years | 0 (0.0%) | 28 (12.2%) |
| 35 to 64 Years | 0 (0.0%) | 7 (0.9%) |
| 65 to 74 Years | 3 (2.3%) | 12 (7.2%) |
| 75 Years and over | 0 (0.0%) | 89 (49.2%) |
Disability Class: Ambulatory Difficulty
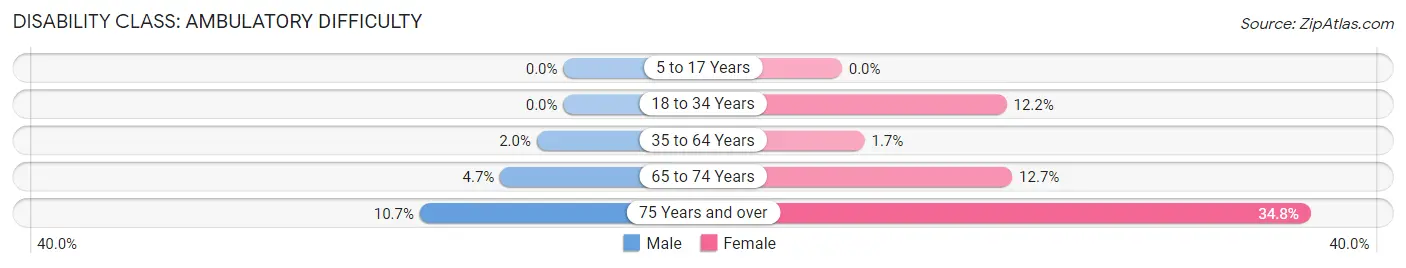
| Age Bracket | Male | Female |
| 5 to 17 Years | 0 (0.0%) | 0 (0.0%) |
| 18 to 34 Years | 0 (0.0%) | 28 (12.2%) |
| 35 to 64 Years | 14 (2.0%) | 13 (1.7%) |
| 65 to 74 Years | 6 (4.7%) | 21 (12.7%) |
| 75 Years and over | 13 (10.7%) | 63 (34.8%) |
Disability Class: Self-Care Difficulty
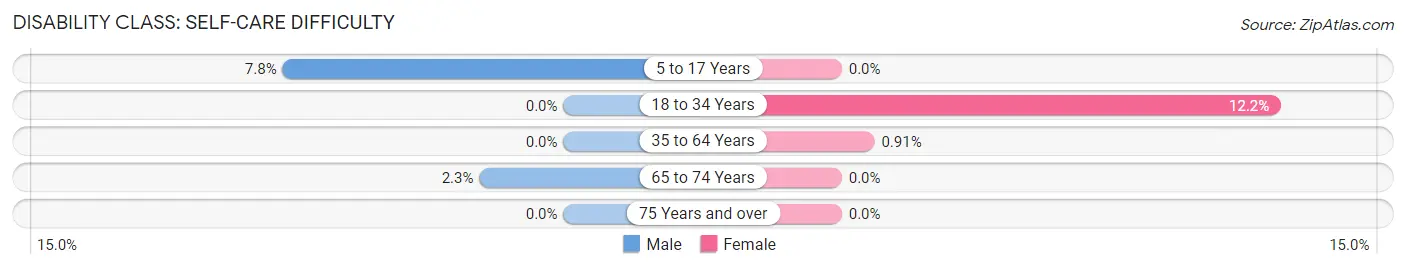
| Age Bracket | Male | Female |
| 5 to 17 Years | 14 (7.8%) | 0 (0.0%) |
| 18 to 34 Years | 0 (0.0%) | 28 (12.2%) |
| 35 to 64 Years | 0 (0.0%) | 7 (0.9%) |
| 65 to 74 Years | 3 (2.3%) | 0 (0.0%) |
| 75 Years and over | 0 (0.0%) | 0 (0.0%) |
Technology Access in Hopkinton
Computing Device Access in Hopkinton
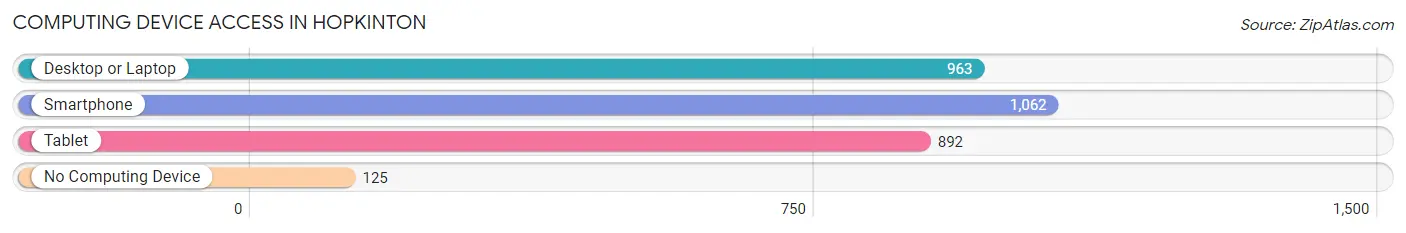
| Device Type | # Households | % Households |
| Desktop or Laptop | 963 | 75.9% |
| Smartphone | 1,062 | 83.7% |
| Tablet | 892 | 70.3% |
| No Computing Device | 125 | 9.9% |
| Total | 1,269 | 100.0% |
Internet Access in Hopkinton
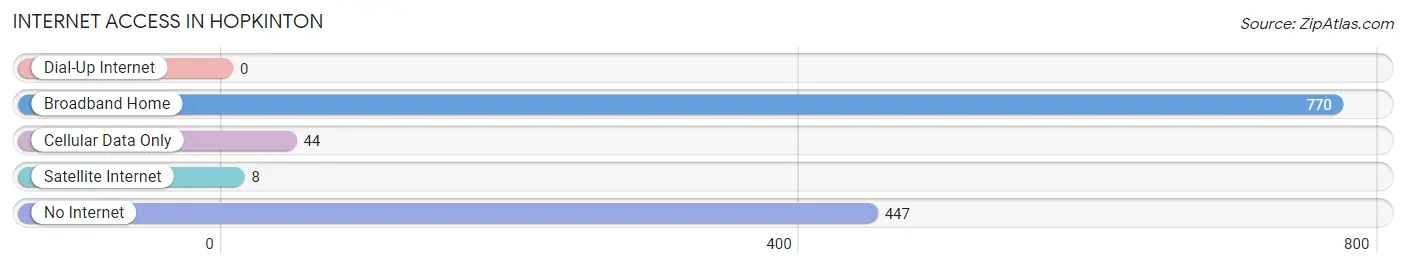
| Internet Type | # Households | % Households |
| Dial-Up Internet | 0 | 0.0% |
| Broadband Home | 770 | 60.7% |
| Cellular Data Only | 44 | 3.5% |
| Satellite Internet | 8 | 0.6% |
| No Internet | 447 | 35.2% |
| Total | 1,269 | 100.0% |
Hopkinton Summary
Hopkinton, MA is a town located in Middlesex County, Massachusetts, United States. It is situated approximately 25 miles west of Boston and is part of the Greater Boston metropolitan area. The town was incorporated in 1715 and is home to a population of approximately 17,000 people.
History
The area that is now Hopkinton was originally inhabited by the Nipmuc tribe, who were part of the Algonquian language family. The first European settlers arrived in the area in 1650 and the town was officially incorporated in 1715. The town was named after Edward Hopkin, an early settler who was granted land in the area in 1660.
In the late 18th century, Hopkinton became an important stop on the Boston-Worcester Turnpike, which was the first major road connecting Boston and Worcester. The town was also home to several mills, which provided employment for many of the town’s residents.
In the 19th century, Hopkinton became a popular summer resort destination for wealthy Bostonians. The town was home to several large estates, including the estate of John Adams, the second President of the United States.
Geography
Hopkinton is located in eastern Massachusetts, approximately 25 miles west of Boston. The town is situated in the Blackstone Valley, which is part of the larger Connecticut River Valley. The town is bordered by the towns of Ashland to the north, Southborough to the east, Westborough to the south, and Upton to the west.
The town is located on the western edge of the Blackstone River, which is the longest river in Massachusetts. The town is also home to several ponds, including Lake Maspenock, Lake Whitehall, and Lake Winthrop.
Economy
Hopkinton’s economy is largely based on the service industry, with many residents employed in retail, healthcare, and education. The town is also home to several technology companies, including EMC Corporation, which is one of the largest data storage companies in the world.
The town is also home to several large employers, including the Massachusetts Department of Transportation, which employs over 1,000 people in the town. The town is also home to several large medical facilities, including the Milford Regional Medical Center and the MetroWest Medical Center.
Demographics
As of the 2010 census, Hopkinton had a population of 17,000 people. The town has a median household income of $107,000, which is significantly higher than the national average. The town is also home to a large number of college-educated residents, with over 50% of the population having a bachelor’s degree or higher.
The town is also home to a large number of immigrants, with over 10% of the population being foreign-born. The largest ethnic groups in the town are Irish, Italian, and German. The town is also home to a large number of religious denominations, with the largest being Catholic, followed by Protestant and Jewish.
Common Questions
What is Per Capita Income in Hopkinton?
Per Capita income in Hopkinton is $116,491.
What is the Median Family Income in Hopkinton?
Median Family Income in Hopkinton is $250,001.
What is the Median Household income in Hopkinton?
Median Household Income in Hopkinton is $168,393.
What is Income or Wage Gap in Hopkinton?
Income or Wage Gap in Hopkinton is 33.0%.
Women in Hopkinton earn 67.0 cents for every dollar earned by a man.
What is Inequality or Gini Index in Hopkinton?
Inequality or Gini Index in Hopkinton is 0.54.
What is the Total Population of Hopkinton?
Total Population of Hopkinton is 3,298.
What is the Total Male Population of Hopkinton?
Total Male Population of Hopkinton is 1,400.
What is the Total Female Population of Hopkinton?
Total Female Population of Hopkinton is 1,898.
What is the Ratio of Males per 100 Females in Hopkinton?
There are 73.76 Males per 100 Females in Hopkinton.
What is the Ratio of Females per 100 Males in Hopkinton?
There are 135.57 Females per 100 Males in Hopkinton.
What is the Median Population Age in Hopkinton?
Median Population Age in Hopkinton is 52.7 Years.
What is the Average Family Size in Hopkinton
Average Family Size in Hopkinton is 3.3 People.
What is the Average Household Size in Hopkinton
Average Household Size in Hopkinton is 2.5 People.
How Large is the Labor Force in Hopkinton?
There are 1,859 People in the Labor Forcein in Hopkinton.
What is the Percentage of People in the Labor Force in Hopkinton?
67.0% of People are in the Labor Force in Hopkinton.
What is the Unemployment Rate in Hopkinton?
Unemployment Rate in Hopkinton is 4.1%.