Cities with the Highest Percentage of Population Employed in Business & Financial in Delaware
RELATED REPORTS & OPTIONS
Business & Financial
Delaware
Compare Cities
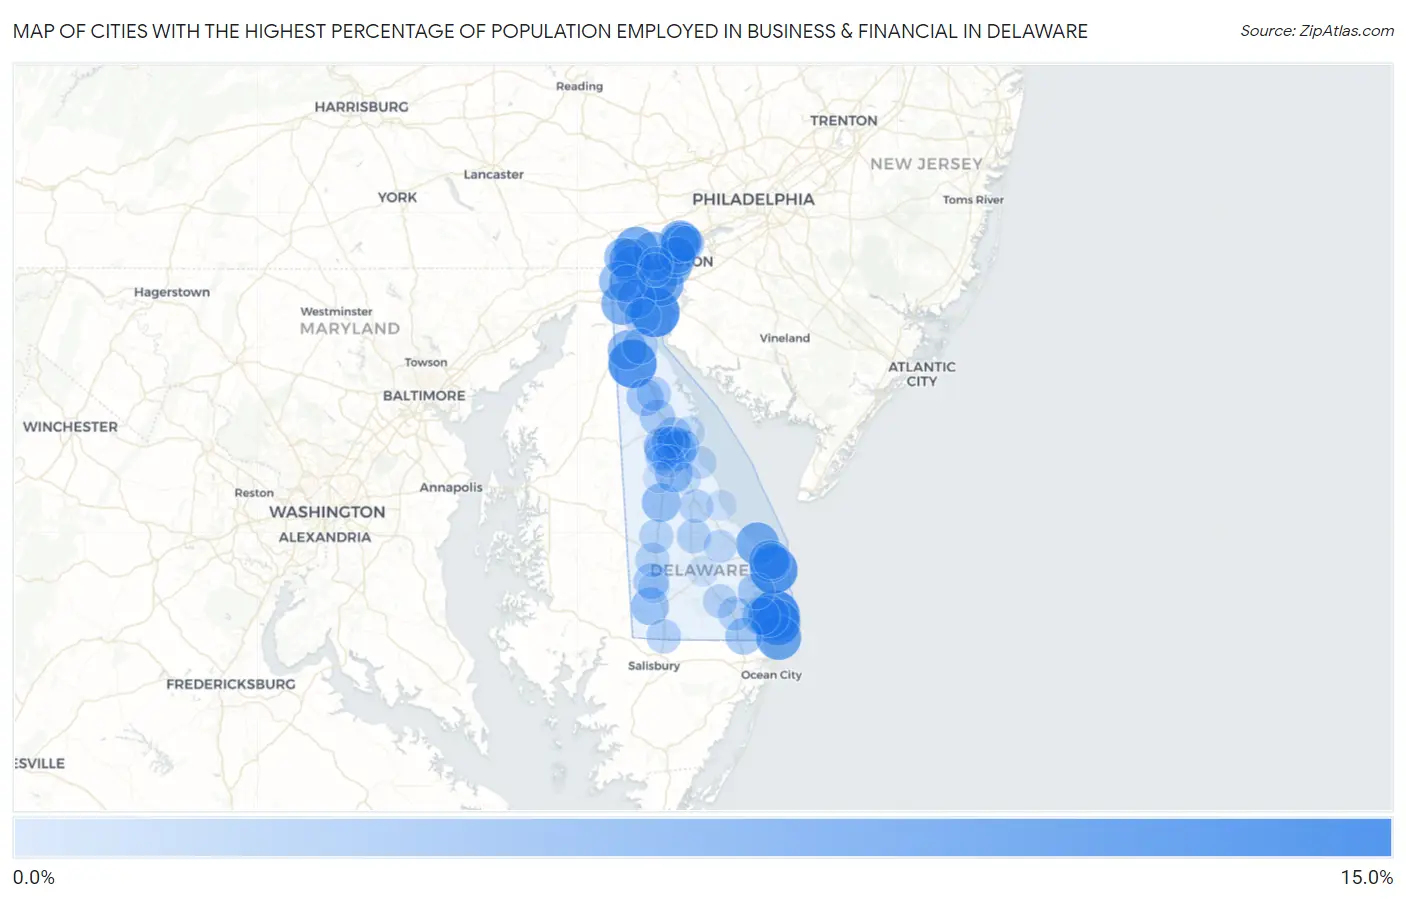
Map of Cities with the Highest Percentage of Population Employed in Business & Financial in Delaware
0.0%
15.0%
Cities with the Highest Percentage of Population Employed in Business & Financial in Delaware
| City | % Employed | vs State | vs National | |
| 1. | Bethany Beach | 14.8% | 6.1%(+8.75)#1 | 5.8%(+9.07)#825 |
| 2. | Delaware City | 14.6% | 6.1%(+8.49)#2 | 5.8%(+8.81)#866 |
| 3. | Townsend | 13.9% | 6.1%(+7.86)#3 | 5.8%(+8.18)#963 |
| 4. | Dewey Beach | 13.3% | 6.1%(+7.21)#4 | 5.8%(+7.53)#1,115 |
| 5. | South Bethany | 11.8% | 6.1%(+5.72)#5 | 5.8%(+6.04)#1,553 |
| 6. | Fenwick Island | 11.2% | 6.1%(+5.13)#6 | 5.8%(+5.45)#1,800 |
| 7. | New Castle | 10.9% | 6.1%(+4.80)#7 | 5.8%(+5.12)#1,961 |
| 8. | Hockessin | 10.4% | 6.1%(+4.27)#8 | 5.8%(+4.59)#2,223 |
| 9. | Pike Creek | 9.9% | 6.1%(+3.78)#9 | 5.8%(+4.10)#2,528 |
| 10. | Lewes | 9.6% | 6.1%(+3.52)#10 | 5.8%(+3.84)#2,691 |
| 11. | Rehoboth Beach | 9.2% | 6.1%(+3.11)#11 | 5.8%(+3.43)#3,018 |
| 12. | Glasgow | 9.2% | 6.1%(+3.09)#12 | 5.8%(+3.41)#3,034 |
| 13. | Ocean View | 8.8% | 6.1%(+2.72)#13 | 5.8%(+3.04)#3,347 |
| 14. | Arden | 8.7% | 6.1%(+2.61)#14 | 5.8%(+2.93)#3,458 |
| 15. | Wilmington | 8.1% | 6.1%(+1.97)#15 | 5.8%(+2.29)#4,112 |
| 16. | Ardentown | 8.0% | 6.1%(+1.92)#16 | 5.8%(+2.24)#4,180 |
| 17. | Wilmington Manor | 7.9% | 6.1%(+1.87)#17 | 5.8%(+2.19)#4,229 |
| 18. | Edgemoor | 7.9% | 6.1%(+1.80)#18 | 5.8%(+2.12)#4,329 |
| 19. | Pike Creek Valley | 7.8% | 6.1%(+1.71)#19 | 5.8%(+2.03)#4,442 |
| 20. | Middletown | 7.1% | 6.1%(+1.06)#20 | 5.8%(+1.38)#5,236 |
| 21. | Newark | 7.1% | 6.1%(+0.974)#21 | 5.8%(+1.29)#5,358 |
| 22. | Greenville | 7.0% | 6.1%(+0.924)#22 | 5.8%(+1.24)#5,430 |
| 23. | Rising Sun Lebanon | 6.9% | 6.1%(+0.831)#23 | 5.8%(+1.15)#5,576 |
| 24. | North Star | 6.8% | 6.1%(+0.698)#24 | 5.8%(+1.02)#5,786 |
| 25. | Bear | 6.7% | 6.1%(+0.608)#25 | 5.8%(+0.929)#5,945 |
| 26. | Harrington | 6.5% | 6.1%(+0.406)#26 | 5.8%(+0.726)#6,260 |
| 27. | Highland Acres | 6.1% | 6.1%(+0.057)#27 | 5.8%(+0.378)#6,842 |
| 28. | Ardencroft | 6.1% | 6.1%(+0.057)#28 | 5.8%(+0.378)#6,846 |
| 29. | Camden | 6.0% | 6.1%(-0.057)#29 | 5.8%(+0.264)#7,061 |
| 30. | Bethel | 5.9% | 6.1%(-0.201)#30 | 5.8%(+0.120)#7,365 |
| 31. | Brookside | 5.8% | 6.1%(-0.257)#31 | 5.8%(+0.063)#7,462 |
| 32. | Millville | 5.7% | 6.1%(-0.369)#32 | 5.8%(-0.048)#7,665 |
| 33. | Wyoming | 5.6% | 6.1%(-0.519)#33 | 5.8%(-0.199)#7,981 |
| 34. | Riverview | 5.5% | 6.1%(-0.613)#34 | 5.8%(-0.293)#8,223 |
| 35. | Clayton | 5.3% | 6.1%(-0.832)#35 | 5.8%(-0.511)#8,683 |
| 36. | Selbyville | 5.1% | 6.1%(-1.03)#36 | 5.8%(-0.712)#9,140 |
| 37. | Long Neck | 4.9% | 6.1%(-1.17)#37 | 5.8%(-0.853)#9,448 |
| 38. | St Georges | 4.9% | 6.1%(-1.22)#38 | 5.8%(-0.895)#9,565 |
| 39. | Bellefonte | 4.8% | 6.1%(-1.23)#39 | 5.8%(-0.914)#9,606 |
| 40. | Henlopen Acres | 4.7% | 6.1%(-1.40)#40 | 5.8%(-1.08)#9,973 |
| 41. | Dover | 4.5% | 6.1%(-1.63)#41 | 5.8%(-1.31)#10,567 |
| 42. | Claymont | 4.4% | 6.1%(-1.64)#42 | 5.8%(-1.32)#10,602 |
| 43. | Cheswold | 4.3% | 6.1%(-1.80)#43 | 5.8%(-1.47)#10,998 |
| 44. | Seaford | 4.2% | 6.1%(-1.84)#44 | 5.8%(-1.52)#11,110 |
| 45. | Odessa | 4.2% | 6.1%(-1.87)#45 | 5.8%(-1.55)#11,175 |
| 46. | Dover Base Housing | 4.2% | 6.1%(-1.89)#46 | 5.8%(-1.56)#11,230 |
| 47. | Delmar | 3.3% | 6.1%(-2.75)#47 | 5.8%(-2.43)#13,610 |
| 48. | Smyrna | 3.3% | 6.1%(-2.77)#48 | 5.8%(-2.45)#13,695 |
| 49. | Bridgeville | 3.2% | 6.1%(-2.86)#49 | 5.8%(-2.54)#13,945 |
| 50. | Greenwood | 3.2% | 6.1%(-2.89)#50 | 5.8%(-2.57)#14,061 |
| 51. | Ellendale | 3.2% | 6.1%(-2.89)#51 | 5.8%(-2.57)#14,067 |
| 52. | Dagsboro | 3.0% | 6.1%(-3.07)#52 | 5.8%(-2.75)#14,644 |
| 53. | Millsboro | 2.9% | 6.1%(-3.21)#53 | 5.8%(-2.88)#15,081 |
| 54. | Milford | 2.9% | 6.1%(-3.21)#54 | 5.8%(-2.89)#15,086 |
| 55. | Elsmere | 2.8% | 6.1%(-3.25)#55 | 5.8%(-2.93)#15,228 |
| 56. | Newport | 2.8% | 6.1%(-3.31)#56 | 5.8%(-2.99)#15,413 |
| 57. | Kent Acres | 2.5% | 6.1%(-3.63)#57 | 5.8%(-3.31)#16,441 |
| 58. | Milton | 2.2% | 6.1%(-3.89)#58 | 5.8%(-3.57)#17,278 |
| 59. | Rodney Village | 2.0% | 6.1%(-4.07)#59 | 5.8%(-3.75)#17,854 |
| 60. | Bowers | 2.0% | 6.1%(-4.12)#60 | 5.8%(-3.80)#18,022 |
| 61. | Woodside East | 1.9% | 6.1%(-4.21)#61 | 5.8%(-3.89)#18,307 |
| 62. | Little Creek | 1.5% | 6.1%(-4.61)#62 | 5.8%(-4.29)#19,544 |
| 63. | Frederica | 1.4% | 6.1%(-4.64)#63 | 5.8%(-4.32)#19,627 |
| 64. | Blades | 1.3% | 6.1%(-4.77)#64 | 5.8%(-4.45)#20,033 |
| 65. | Woodside | 0.89% | 6.1%(-5.19)#65 | 5.8%(-4.87)#21,158 |
| 66. | Felton | 0.73% | 6.1%(-5.35)#66 | 5.8%(-5.03)#21,600 |
| 67. | Georgetown | 0.64% | 6.1%(-5.44)#67 | 5.8%(-5.12)#21,803 |
| 68. | Slaughter Beach | 0.57% | 6.1%(-5.51)#68 | 5.8%(-5.19)#21,944 |
1
Common Questions
What are the Top 10 Cities with the Highest Percentage of Population Employed in Business & Financial in Delaware?
Top 10 Cities with the Highest Percentage of Population Employed in Business & Financial in Delaware are:
#1
14.8%
#2
14.6%
#3
13.9%
#4
13.3%
#5
11.8%
#6
11.2%
#7
10.9%
#8
10.4%
#9
9.9%
#10
9.6%
What city has the Highest Percentage of Population Employed in Business & Financial in Delaware?
Bethany Beach has the Highest Percentage of Population Employed in Business & Financial in Delaware with 14.8%.
What is the Percentage of Population Employed in Business & Financial in the State of Delaware?
Percentage of Population Employed in Business & Financial in Delaware is 6.1%.
What is the Percentage of Population Employed in Business & Financial in the United States?
Percentage of Population Employed in Business & Financial in the United States is 5.8%.