East Dennis, MA Map & Demographics
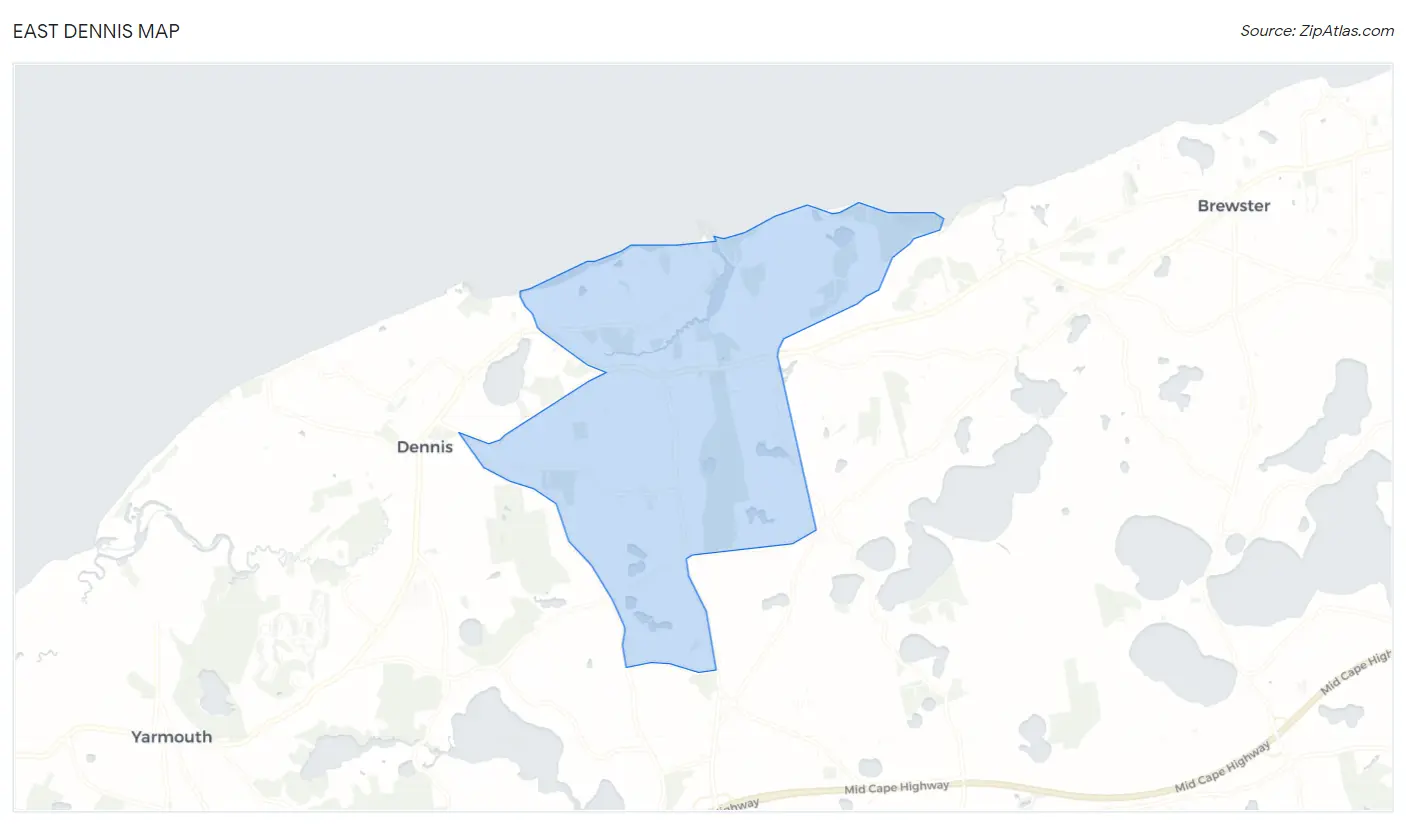
East Dennis Map
East Dennis Overview
$51,815
PER CAPITA INCOME
$125,927
AVG FAMILY INCOME
$85,321
AVG HOUSEHOLD INCOME
45.6%
WAGE / INCOME GAP [ % ]
54.4¢/ $1
WAGE / INCOME GAP [ $ ]
0.44
INEQUALITY / GINI INDEX
3,711
TOTAL POPULATION
1,629
MALE POPULATION
2,082
FEMALE POPULATION
78.24
MALES / 100 FEMALES
127.81
FEMALES / 100 MALES
63.0
MEDIAN AGE
2.9
AVG FAMILY SIZE
2.3
AVG HOUSEHOLD SIZE
1,782
LABOR FORCE [ PEOPLE ]
51.4%
PERCENT IN LABOR FORCE
4.9%
UNEMPLOYMENT RATE
East Dennis Zip Codes
East Dennis Area Codes
Income in East Dennis
Income Overview in East Dennis
Per Capita Income in East Dennis is $51,815, while median incomes of families and households are $125,927 and $85,321 respectively.
| Characteristic | Number | Measure |
| Per Capita Income | 3,711 | $51,815 |
| Median Family Income | 1,069 | $125,927 |
| Mean Family Income | 1,069 | $137,644 |
| Median Household Income | 1,583 | $85,321 |
| Mean Household Income | 1,583 | $118,153 |
| Income Deficit | 1,069 | $0 |
| Wage / Income Gap (%) | 3,711 | 45.56% |
| Wage / Income Gap ($) | 3,711 | 54.44¢ per $1 |
| Gini / Inequality Index | 3,711 | 0.44 |
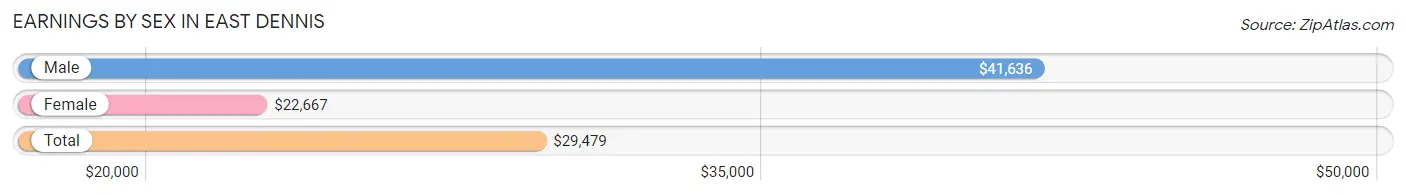
Earnings by Sex in East Dennis
Average Earnings in East Dennis are $29,479, $41,636 for men and $22,667 for women, a difference of 45.6%.
| Sex | Number | Average Earnings |
| Male | 862 (46.7%) | $41,636 |
| Female | 984 (53.3%) | $22,667 |
| Total | 1,846 (100.0%) | $29,479 |
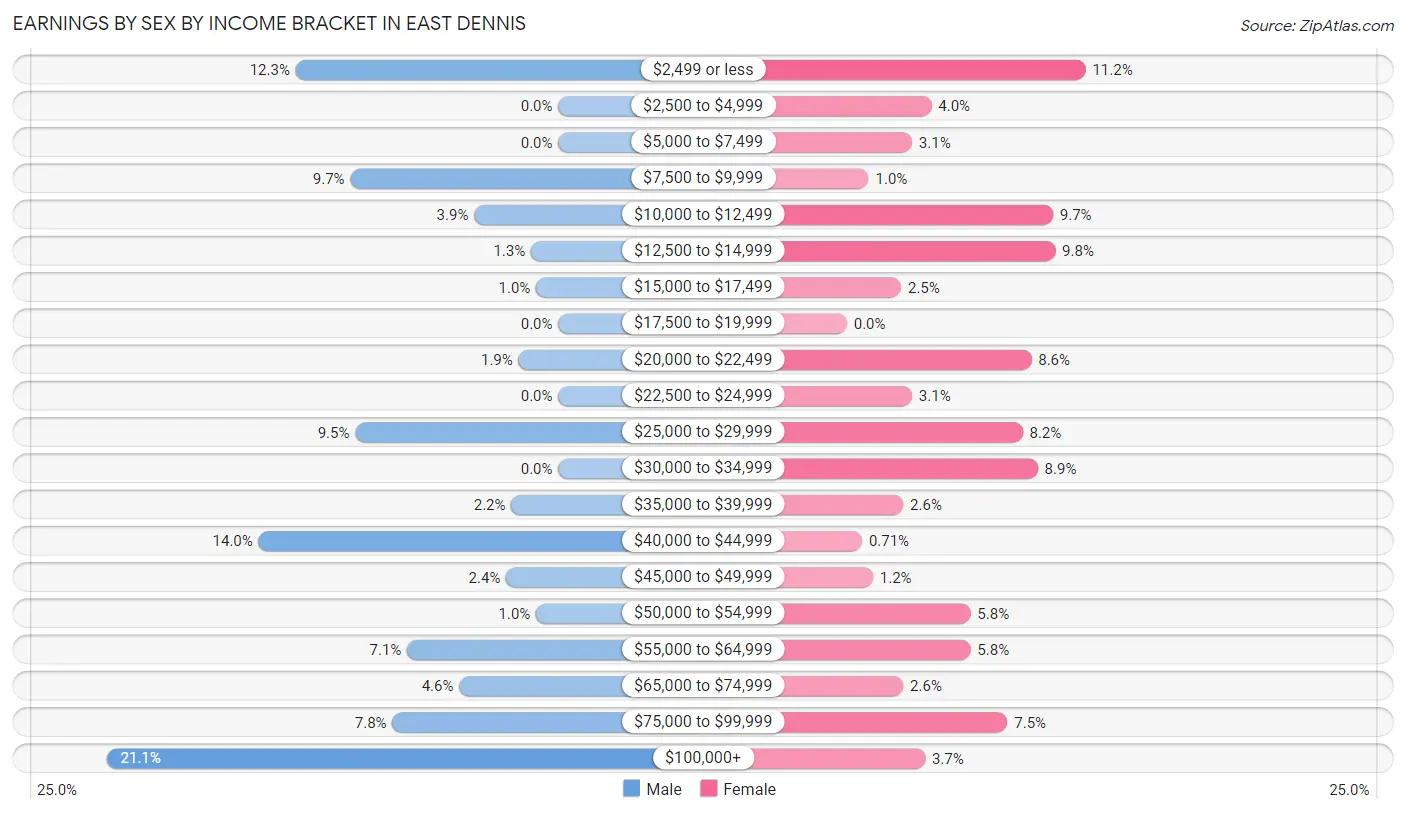
Earnings by Sex by Income Bracket in East Dennis
The most common earnings brackets in East Dennis are $100,000+ for men (182 | 21.1%) and $2,499 or less for women (110 | 11.2%).
| Income | Male | Female |
| $2,499 or less | 106 (12.3%) | 110 (11.2%) |
| $2,500 to $4,999 | 0 (0.0%) | 39 (4.0%) |
| $5,000 to $7,499 | 0 (0.0%) | 30 (3.0%) |
| $7,500 to $9,999 | 84 (9.7%) | 10 (1.0%) |
| $10,000 to $12,499 | 34 (3.9%) | 95 (9.7%) |
| $12,500 to $14,999 | 11 (1.3%) | 96 (9.8%) |
| $15,000 to $17,499 | 9 (1.0%) | 25 (2.5%) |
| $17,500 to $19,999 | 0 (0.0%) | 0 (0.0%) |
| $20,000 to $22,499 | 16 (1.9%) | 85 (8.6%) |
| $22,500 to $24,999 | 0 (0.0%) | 30 (3.0%) |
| $25,000 to $29,999 | 82 (9.5%) | 81 (8.2%) |
| $30,000 to $34,999 | 0 (0.0%) | 88 (8.9%) |
| $35,000 to $39,999 | 19 (2.2%) | 26 (2.6%) |
| $40,000 to $44,999 | 121 (14.0%) | 7 (0.7%) |
| $45,000 to $49,999 | 21 (2.4%) | 12 (1.2%) |
| $50,000 to $54,999 | 9 (1.0%) | 57 (5.8%) |
| $55,000 to $64,999 | 61 (7.1%) | 57 (5.8%) |
| $65,000 to $74,999 | 40 (4.6%) | 26 (2.6%) |
| $75,000 to $99,999 | 67 (7.8%) | 74 (7.5%) |
| $100,000+ | 182 (21.1%) | 36 (3.7%) |
| Total | 862 (100.0%) | 984 (100.0%) |
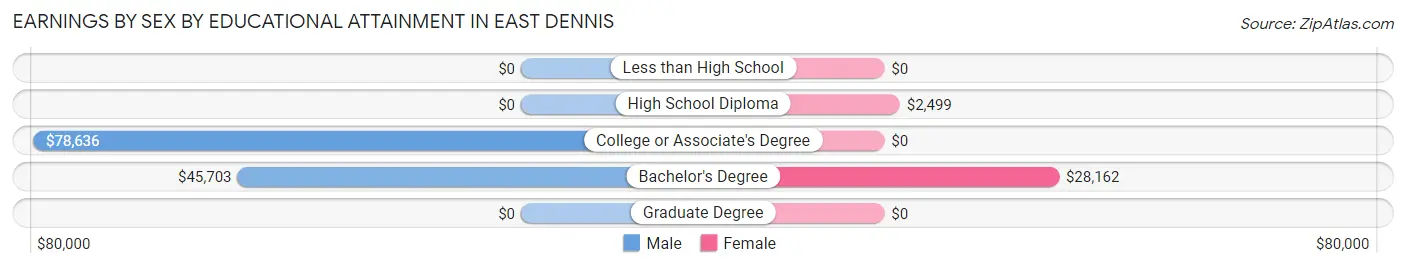
Earnings by Sex by Educational Attainment in East Dennis
Average earnings in East Dennis are $46,641 for men and $25,368 for women, a difference of 45.6%. Men with an educational attainment of college or associate's degree enjoy the highest average annual earnings of $78,636, while those with bachelor's degree education earn the least with $45,703. Women with an educational attainment of bachelor's degree earn the most with the average annual earnings of $28,162, while those with high school diploma education have the smallest earnings of $2,499.
| Educational Attainment | Male Income | Female Income |
| Less than High School | - | - |
| High School Diploma | - | - |
| College or Associate's Degree | $78,636 | $0 |
| Bachelor's Degree | $45,703 | $28,162 |
| Graduate Degree | - | - |
| Total | $46,641 | $25,368 |
Family Income in East Dennis
Family Income Brackets in East Dennis
According to the East Dennis family income data, there are 245 families falling into the $150,000 to $199,999 income range, which is the most common income bracket and makes up 22.9% of all families.
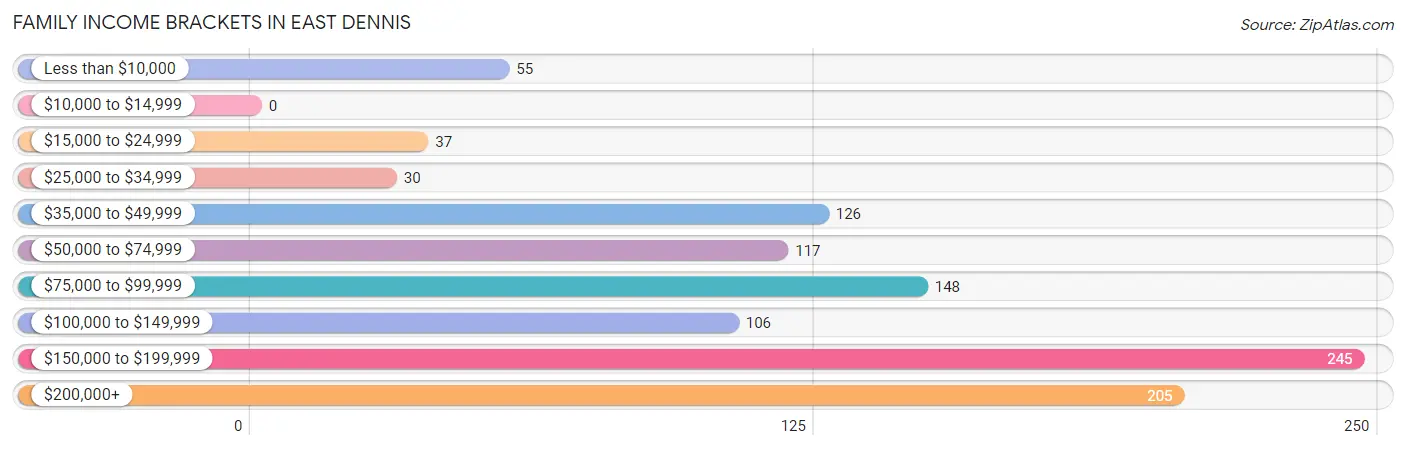
| Income Bracket | # Families | % Families |
| Less than $10,000 | 55 | 5.1% |
| $10,000 to $14,999 | 0 | 0.0% |
| $15,000 to $24,999 | 37 | 3.5% |
| $25,000 to $34,999 | 30 | 2.8% |
| $35,000 to $49,999 | 126 | 11.8% |
| $50,000 to $74,999 | 117 | 10.9% |
| $75,000 to $99,999 | 148 | 13.8% |
| $100,000 to $149,999 | 106 | 9.9% |
| $150,000 to $199,999 | 245 | 22.9% |
| $200,000+ | 205 | 19.2% |
Family Income by Famaliy Size in East Dennis
4-person families (137 | 12.8%) account for the highest median family income in East Dennis with $165,729 per family, while 2-person families (666 | 62.3%) have the highest median income of $56,528 per family member.
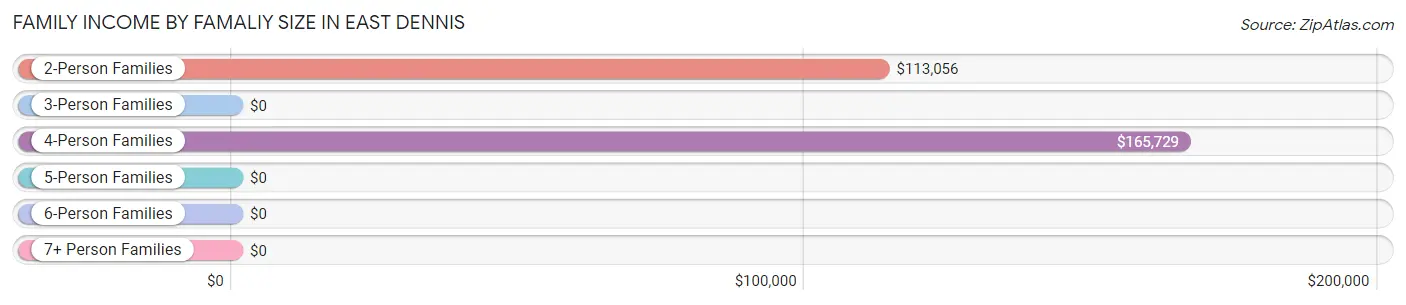
| Income Bracket | # Families | Median Income |
| 2-Person Families | 666 (62.3%) | $113,056 |
| 3-Person Families | 170 (15.9%) | $0 |
| 4-Person Families | 137 (12.8%) | $165,729 |
| 5-Person Families | 93 (8.7%) | $0 |
| 6-Person Families | 3 (0.3%) | $0 |
| 7+ Person Families | 0 (0.0%) | $0 |
| Total | 1,069 (100.0%) | $125,927 |
Family Income by Number of Earners in East Dennis
The median family income in East Dennis is $125,927, with families comprising 2 earners (223) having the highest median family income of $162,850, while families with 1 earner (311) have the lowest median family income of $51,193, accounting for 20.9% and 29.1% of families, respectively.
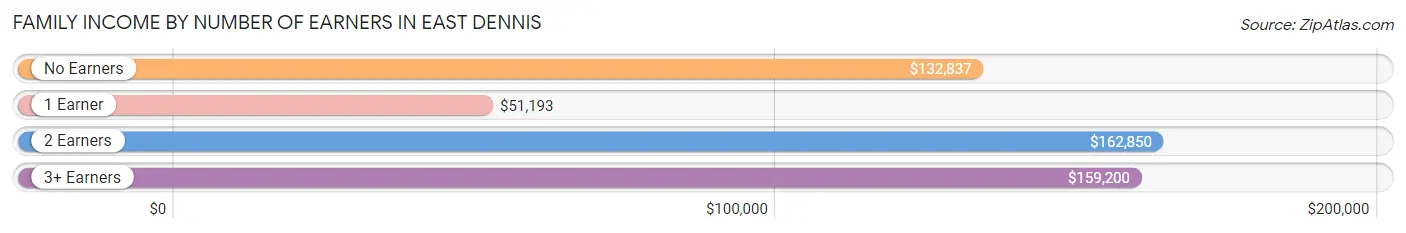
| Number of Earners | # Families | Median Income |
| No Earners | 353 (33.0%) | $132,837 |
| 1 Earner | 311 (29.1%) | $51,193 |
| 2 Earners | 223 (20.9%) | $162,850 |
| 3+ Earners | 182 (17.0%) | $159,200 |
| Total | 1,069 (100.0%) | $125,927 |
Household Income in East Dennis
Household Income Brackets in East Dennis
With 258 households falling in the category, the $200,000+ income range is the most frequent in East Dennis, accounting for 16.3% of all households. In contrast, only 8 households (0.5%) fall into the $10,000 to $14,999 income bracket, making it the least populous group.
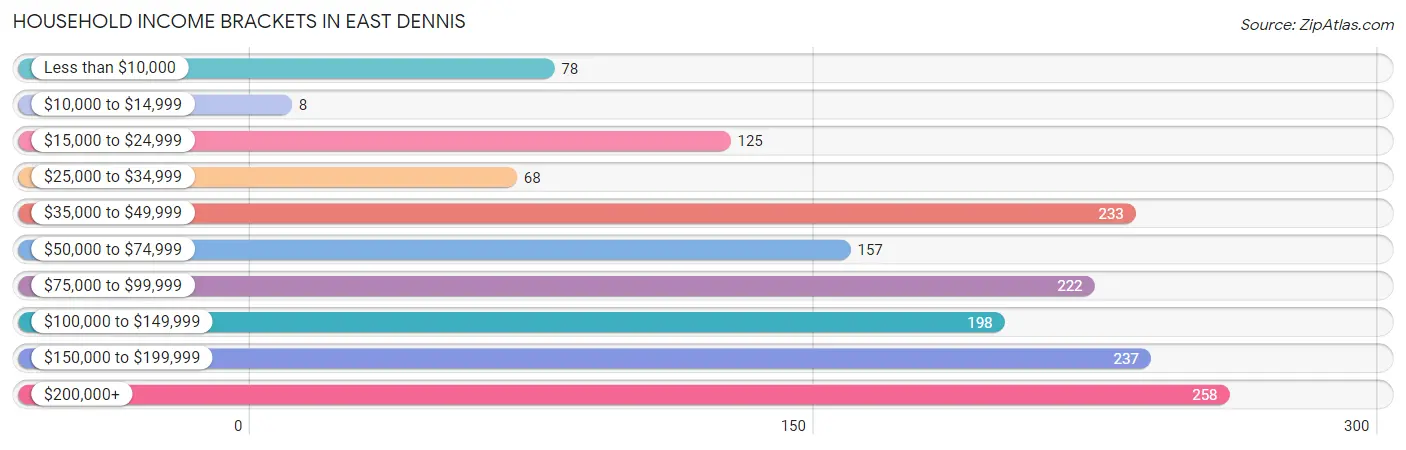
| Income Bracket | # Households | % Households |
| Less than $10,000 | 78 | 4.9% |
| $10,000 to $14,999 | 8 | 0.5% |
| $15,000 to $24,999 | 125 | 7.9% |
| $25,000 to $34,999 | 68 | 4.3% |
| $35,000 to $49,999 | 233 | 14.7% |
| $50,000 to $74,999 | 157 | 9.9% |
| $75,000 to $99,999 | 222 | 14.0% |
| $100,000 to $149,999 | 198 | 12.5% |
| $150,000 to $199,999 | 237 | 15.0% |
| $200,000+ | 258 | 16.3% |
Household Income by Householder Age in East Dennis
The median household income in East Dennis is $85,321, with the highest median household income of $85,179 found in the 65+ years age bracket for the primary householder. A total of 981 households (62.0%) fall into this category.
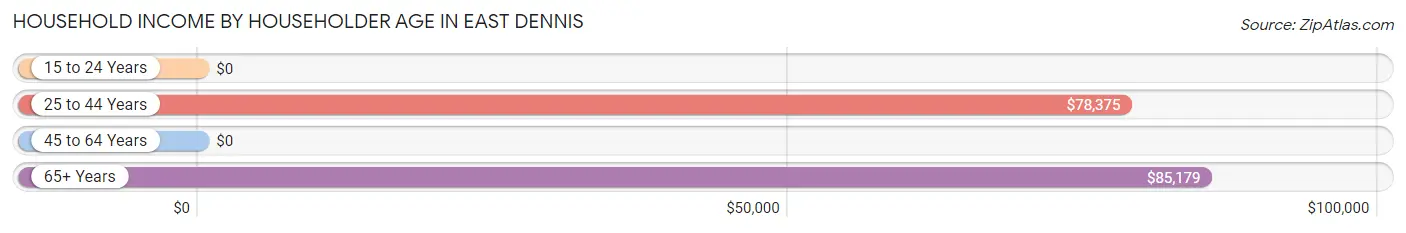
| Income Bracket | # Households | Median Income |
| 15 to 24 Years | 0 (0.0%) | $0 |
| 25 to 44 Years | 217 (13.7%) | $78,375 |
| 45 to 64 Years | 385 (24.3%) | $0 |
| 65+ Years | 981 (62.0%) | $85,179 |
| Total | 1,583 (100.0%) | $85,321 |
Poverty in East Dennis
Income Below Poverty by Sex and Age in East Dennis
With 5.4% poverty level for males and 7.2% for females among the residents of East Dennis, 12 to 14 year old males and 6 to 11 year old females are the most vulnerable to poverty, with 19 males (67.9%) and 17 females (46.0%) in their respective age groups living below the poverty level.
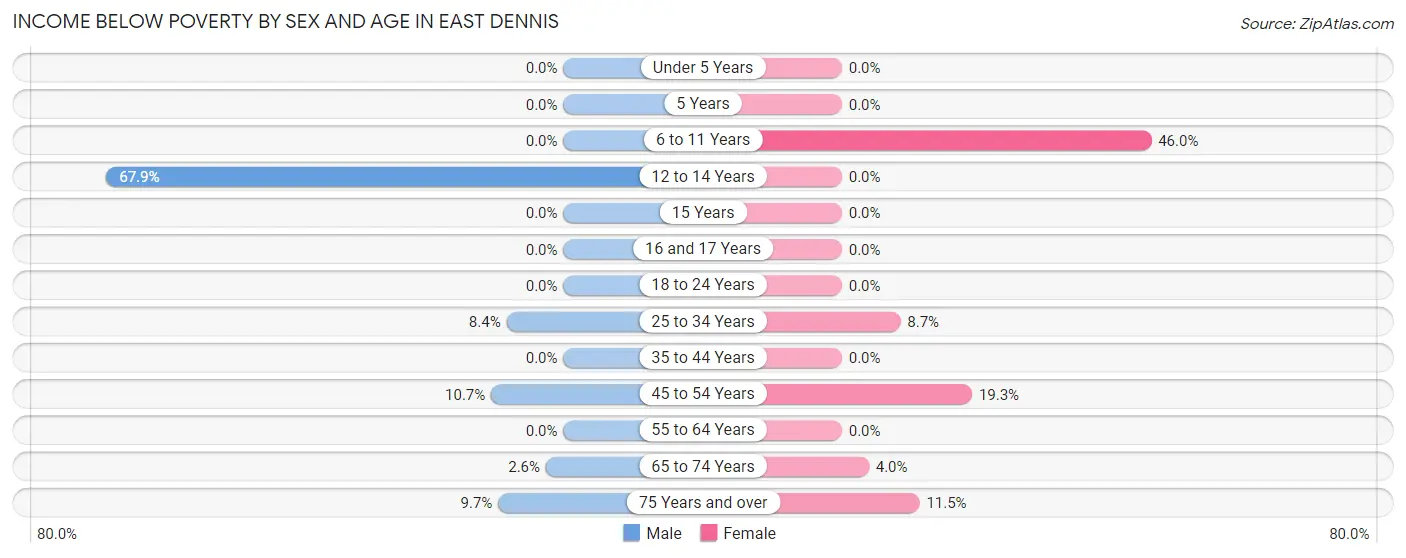
| Age Bracket | Male | Female |
| Under 5 Years | 0 (0.0%) | 0 (0.0%) |
| 5 Years | 0 (0.0%) | 0 (0.0%) |
| 6 to 11 Years | 0 (0.0%) | 17 (46.0%) |
| 12 to 14 Years | 19 (67.9%) | 0 (0.0%) |
| 15 Years | 0 (0.0%) | 0 (0.0%) |
| 16 and 17 Years | 0 (0.0%) | 0 (0.0%) |
| 18 to 24 Years | 0 (0.0%) | 0 (0.0%) |
| 25 to 34 Years | 13 (8.4%) | 18 (8.7%) |
| 35 to 44 Years | 0 (0.0%) | 0 (0.0%) |
| 45 to 54 Years | 19 (10.7%) | 29 (19.3%) |
| 55 to 64 Years | 0 (0.0%) | 0 (0.0%) |
| 65 to 74 Years | 10 (2.6%) | 18 (4.0%) |
| 75 Years and over | 27 (9.7%) | 67 (11.5%) |
| Total | 88 (5.4%) | 149 (7.2%) |
Income Above Poverty by Sex and Age in East Dennis
According to the poverty statistics in East Dennis, males aged under 5 years and females aged 5 years are the age groups that are most secure financially, with 100.0% of males and 100.0% of females in these age groups living above the poverty line.
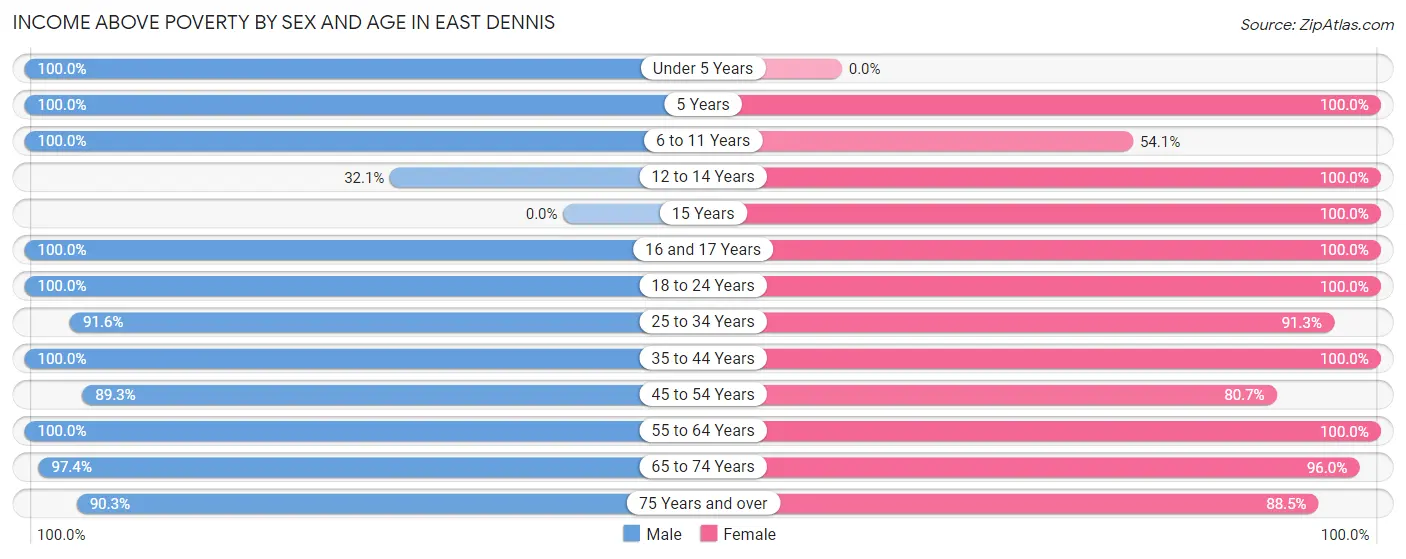
| Age Bracket | Male | Female |
| Under 5 Years | 48 (100.0%) | 0 (0.0%) |
| 5 Years | 54 (100.0%) | 10 (100.0%) |
| 6 to 11 Years | 24 (100.0%) | 20 (54.0%) |
| 12 to 14 Years | 9 (32.1%) | 25 (100.0%) |
| 15 Years | 0 (0.0%) | 18 (100.0%) |
| 16 and 17 Years | 9 (100.0%) | 30 (100.0%) |
| 18 to 24 Years | 174 (100.0%) | 72 (100.0%) |
| 25 to 34 Years | 141 (91.6%) | 189 (91.3%) |
| 35 to 44 Years | 181 (100.0%) | 176 (100.0%) |
| 45 to 54 Years | 158 (89.3%) | 121 (80.7%) |
| 55 to 64 Years | 117 (100.0%) | 327 (100.0%) |
| 65 to 74 Years | 374 (97.4%) | 431 (96.0%) |
| 75 Years and over | 252 (90.3%) | 514 (88.5%) |
| Total | 1,541 (94.6%) | 1,933 (92.8%) |
Income Below Poverty Among Married-Couple Families in East Dennis
The poverty statistics for married-couple families in East Dennis show that 4.9% or 37 of the total 761 families live below the poverty line. Families with no children have the highest poverty rate of 5.7%, comprising of 37 families. On the other hand, families with 1 or 2 children have the lowest poverty rate of 0.0%, which includes 0 families.
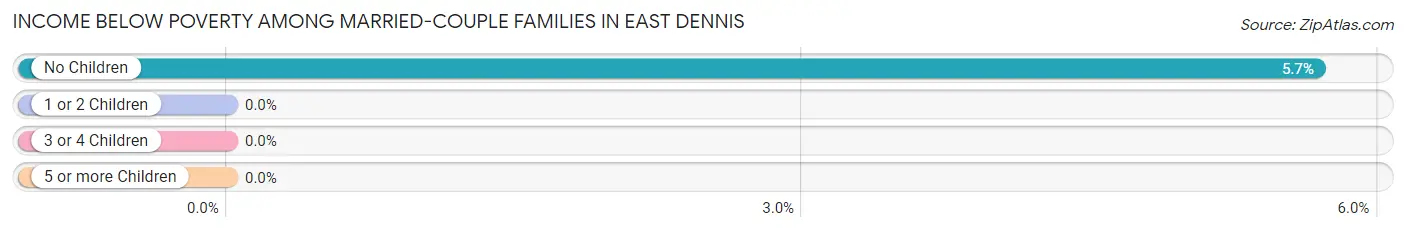
| Children | Above Poverty | Below Poverty |
| No Children | 614 (94.3%) | 37 (5.7%) |
| 1 or 2 Children | 110 (100.0%) | 0 (0.0%) |
| 3 or 4 Children | 0 (0.0%) | 0 (0.0%) |
| 5 or more Children | 0 (0.0%) | 0 (0.0%) |
| Total | 724 (95.1%) | 37 (4.9%) |
Income Below Poverty Among Single-Parent Households in East Dennis
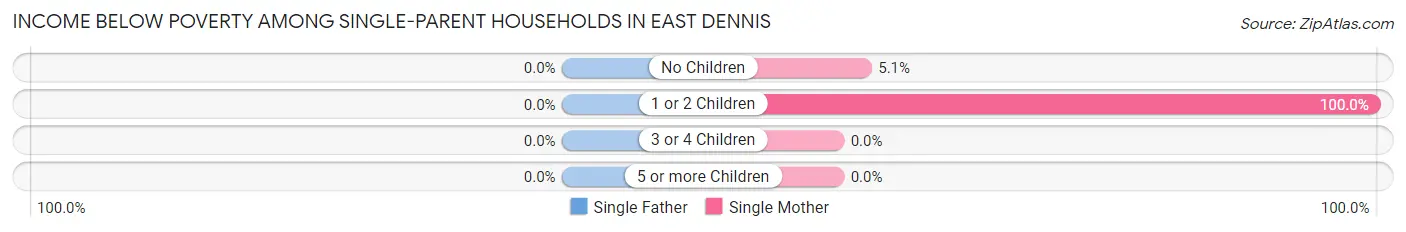
| Children | Single Father | Single Mother |
| No Children | 0 (0.0%) | 11 (5.1%) |
| 1 or 2 Children | 0 (0.0%) | 36 (100.0%) |
| 3 or 4 Children | 0 (0.0%) | 0 (0.0%) |
| 5 or more Children | 0 (0.0%) | 0 (0.0%) |
| Total | 0 (0.0%) | 47 (18.4%) |
Income Below Poverty Among Married-Couple vs Single-Parent Households in East Dennis
The poverty data for East Dennis shows that 37 of the married-couple family households (4.9%) and 47 of the single-parent households (15.3%) are living below the poverty level. Within the married-couple family households, those with no children have the highest poverty rate, with 37 households (5.7%) falling below the poverty line. Among the single-parent households, those with 1 or 2 children have the highest poverty rate, with 36 household (78.3%) living below poverty.
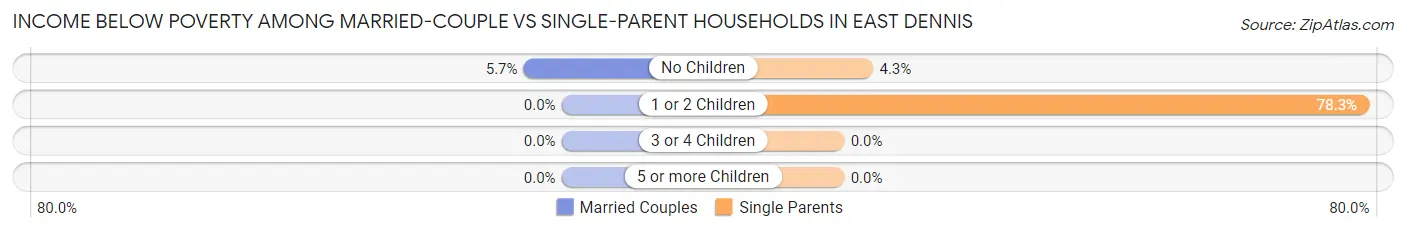
| Children | Married-Couple Families | Single-Parent Households |
| No Children | 37 (5.7%) | 11 (4.3%) |
| 1 or 2 Children | 0 (0.0%) | 36 (78.3%) |
| 3 or 4 Children | 0 (0.0%) | 0 (0.0%) |
| 5 or more Children | 0 (0.0%) | 0 (0.0%) |
| Total | 37 (4.9%) | 47 (15.3%) |
Race in East Dennis
The most populous races in East Dennis are White / Caucasian (3,550 | 95.7%), Two or more Races (55 | 1.5%), and Native / Alaskan (51 | 1.4%).
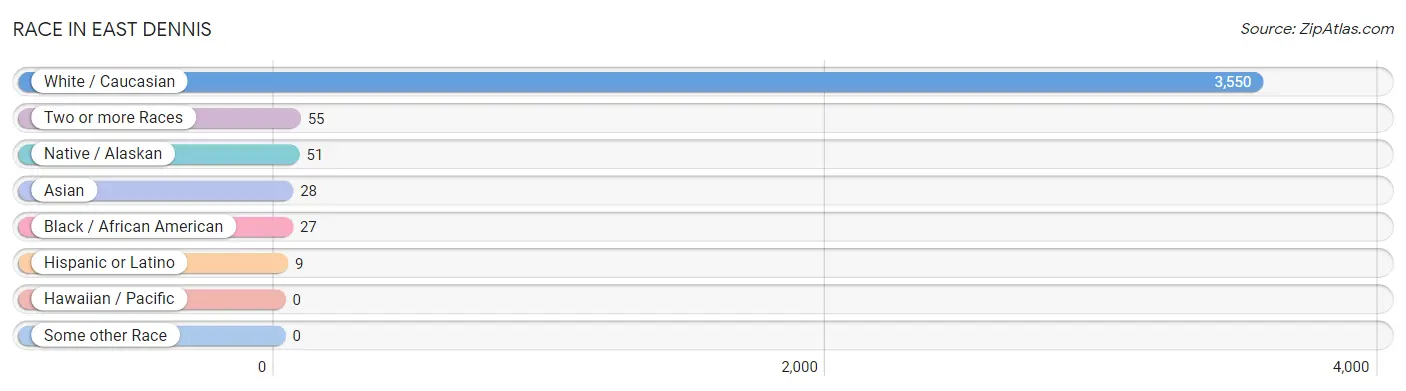
| Race | # Population | % Population |
| Asian | 28 | 0.7% |
| Black / African American | 27 | 0.7% |
| Hawaiian / Pacific | 0 | 0.0% |
| Hispanic or Latino | 9 | 0.2% |
| Native / Alaskan | 51 | 1.4% |
| White / Caucasian | 3,550 | 95.7% |
| Two or more Races | 55 | 1.5% |
| Some other Race | 0 | 0.0% |
| Total | 3,711 | 100.0% |
Ancestry in East Dennis
The most populous ancestries reported in East Dennis are Irish (1,259 | 33.9%), English (722 | 19.5%), German (446 | 12.0%), Polish (423 | 11.4%), and Lithuanian (344 | 9.3%), together accounting for 86.1% of all East Dennis residents.
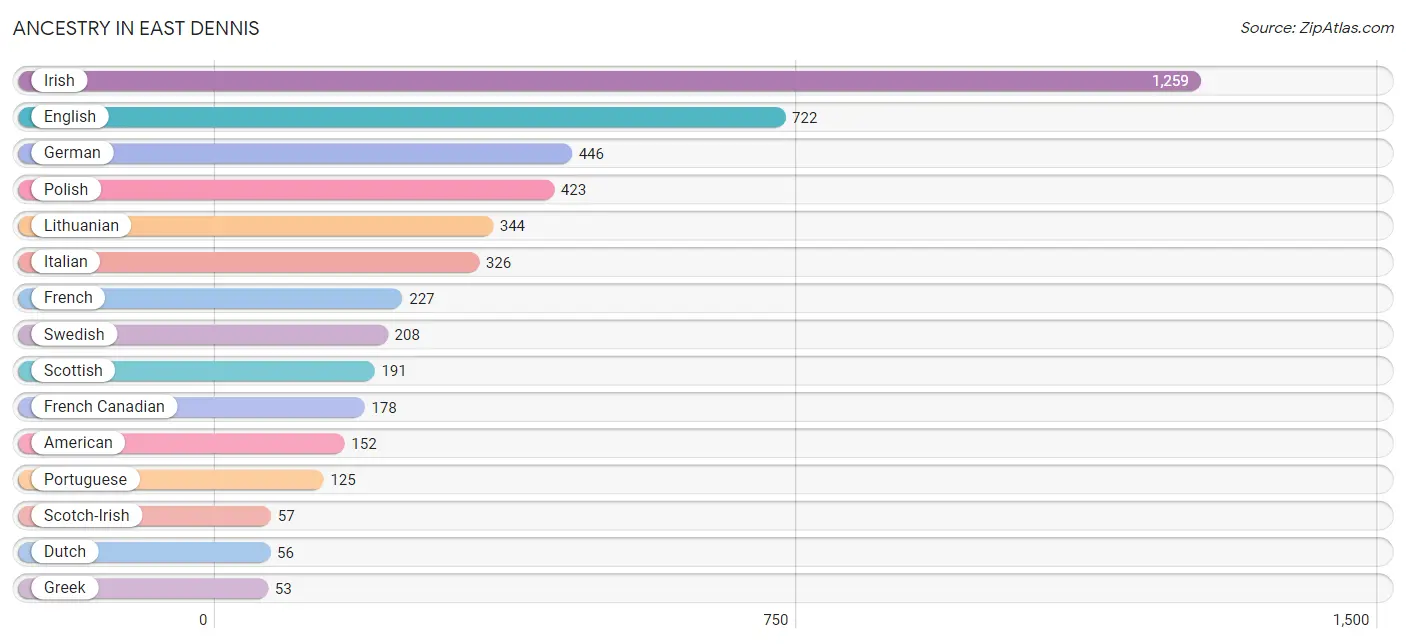
| Ancestry | # Population | % Population |
| American | 152 | 4.1% |
| British | 17 | 0.5% |
| Cuban | 9 | 0.2% |
| Dutch | 56 | 1.5% |
| English | 722 | 19.5% |
| Finnish | 11 | 0.3% |
| French | 227 | 6.1% |
| French Canadian | 178 | 4.8% |
| German | 446 | 12.0% |
| Greek | 53 | 1.4% |
| Haitian | 27 | 0.7% |
| Indian (Asian) | 28 | 0.7% |
| Irish | 1,259 | 33.9% |
| Italian | 326 | 8.8% |
| Lithuanian | 344 | 9.3% |
| Polish | 423 | 11.4% |
| Portuguese | 125 | 3.4% |
| Russian | 29 | 0.8% |
| Scotch-Irish | 57 | 1.5% |
| Scottish | 191 | 5.1% |
| Slavic | 27 | 0.7% |
| Swedish | 208 | 5.6% |
| Ukrainian | 52 | 1.4% |
| Welsh | 30 | 0.8% | View All 24 Rows |
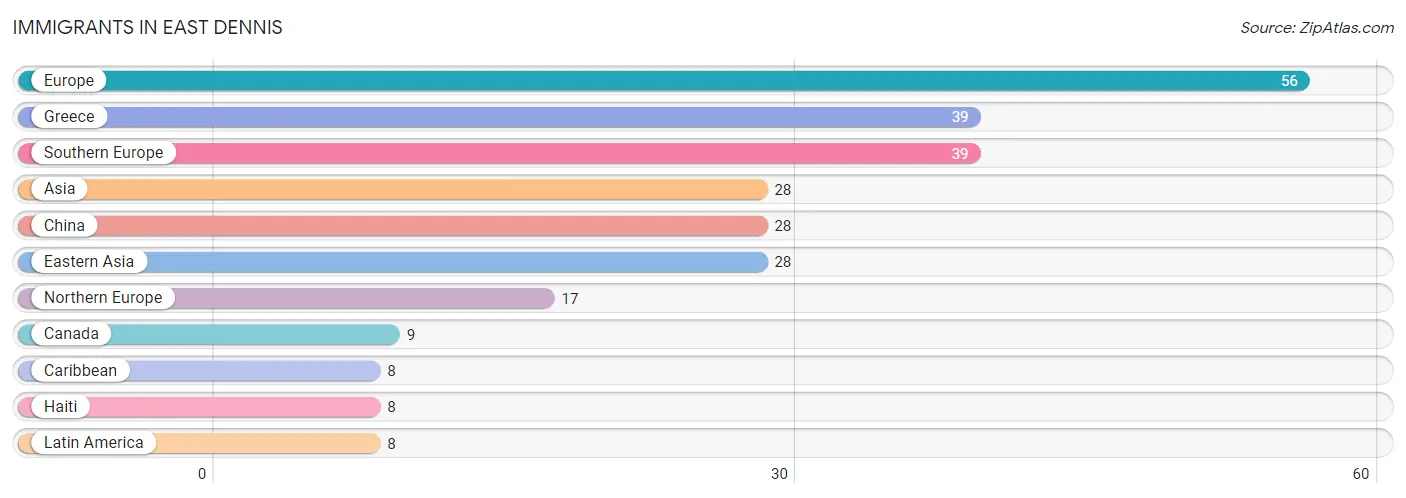
Immigrants in East Dennis
The most numerous immigrant groups reported in East Dennis came from Europe (56 | 1.5%), Greece (39 | 1.1%), Southern Europe (39 | 1.1%), Asia (28 | 0.7%), and China (28 | 0.7%), together accounting for 5.1% of all East Dennis residents.
| Immigration Origin | # Population | % Population |
| Asia | 28 | 0.7% |
| Canada | 9 | 0.2% |
| Caribbean | 8 | 0.2% |
| China | 28 | 0.7% |
| Eastern Asia | 28 | 0.7% |
| Europe | 56 | 1.5% |
| Greece | 39 | 1.1% |
| Haiti | 8 | 0.2% |
| Latin America | 8 | 0.2% |
| Northern Europe | 17 | 0.5% |
| Southern Europe | 39 | 1.1% | View All 11 Rows |
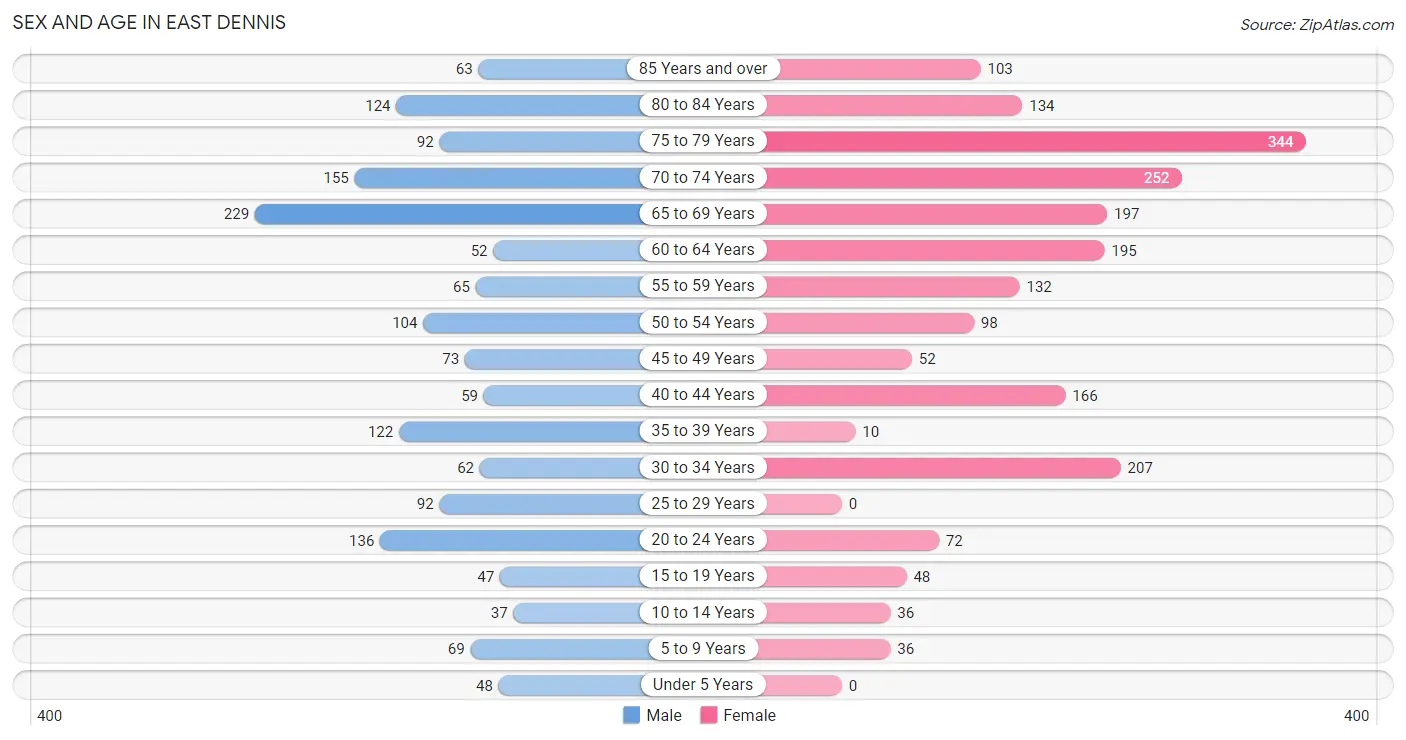
Sex and Age in East Dennis
Sex and Age in East Dennis
The most populous age groups in East Dennis are 65 to 69 Years (229 | 14.1%) for men and 75 to 79 Years (344 | 16.5%) for women.
| Age Bracket | Male | Female |
| Under 5 Years | 48 (2.9%) | 0 (0.0%) |
| 5 to 9 Years | 69 (4.2%) | 36 (1.7%) |
| 10 to 14 Years | 37 (2.3%) | 36 (1.7%) |
| 15 to 19 Years | 47 (2.9%) | 48 (2.3%) |
| 20 to 24 Years | 136 (8.4%) | 72 (3.5%) |
| 25 to 29 Years | 92 (5.7%) | 0 (0.0%) |
| 30 to 34 Years | 62 (3.8%) | 207 (9.9%) |
| 35 to 39 Years | 122 (7.5%) | 10 (0.5%) |
| 40 to 44 Years | 59 (3.6%) | 166 (8.0%) |
| 45 to 49 Years | 73 (4.5%) | 52 (2.5%) |
| 50 to 54 Years | 104 (6.4%) | 98 (4.7%) |
| 55 to 59 Years | 65 (4.0%) | 132 (6.3%) |
| 60 to 64 Years | 52 (3.2%) | 195 (9.4%) |
| 65 to 69 Years | 229 (14.1%) | 197 (9.5%) |
| 70 to 74 Years | 155 (9.5%) | 252 (12.1%) |
| 75 to 79 Years | 92 (5.7%) | 344 (16.5%) |
| 80 to 84 Years | 124 (7.6%) | 134 (6.4%) |
| 85 Years and over | 63 (3.9%) | 103 (5.0%) |
| Total | 1,629 (100.0%) | 2,082 (100.0%) |
Families and Households in East Dennis
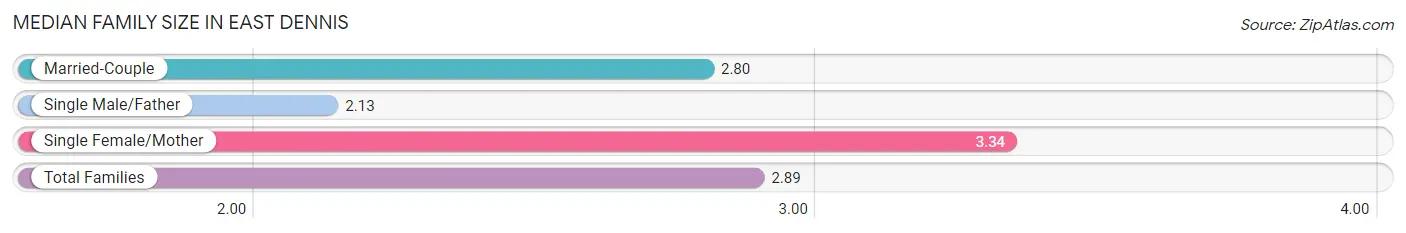
Median Family Size in East Dennis
The median family size in East Dennis is 2.89 persons per family, with single female/mother families (256 | 23.9%) accounting for the largest median family size of 3.34 persons per family. On the other hand, single male/father families (52 | 4.9%) represent the smallest median family size with 2.13 persons per family.
| Family Type | # Families | Family Size |
| Married-Couple | 761 (71.2%) | 2.80 |
| Single Male/Father | 52 (4.9%) | 2.13 |
| Single Female/Mother | 256 (23.9%) | 3.34 |
| Total Families | 1,069 (100.0%) | 2.89 |
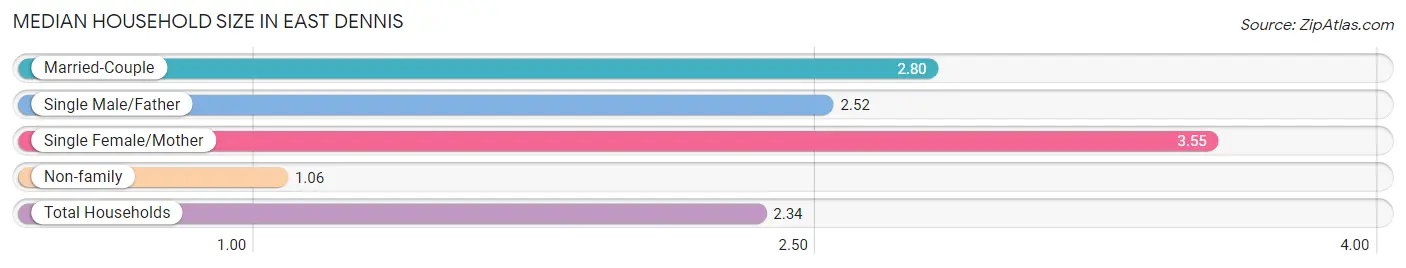
Median Household Size in East Dennis
The median household size in East Dennis is 2.34 persons per household, with single female/mother households (256 | 16.2%) accounting for the largest median household size of 3.55 persons per household. non-family households (514 | 32.5%) represent the smallest median household size with 1.06 persons per household.
| Household Type | # Households | Household Size |
| Married-Couple | 761 (48.1%) | 2.80 |
| Single Male/Father | 52 (3.3%) | 2.52 |
| Single Female/Mother | 256 (16.2%) | 3.55 |
| Non-family | 514 (32.5%) | 1.06 |
| Total Households | 1,583 (100.0%) | 2.34 |
Household Size by Marriage Status in East Dennis
Out of a total of 1,583 households in East Dennis, 1,069 (67.5%) are family households, while 514 (32.5%) are nonfamily households. The most numerous type of family households are 2-person households, comprising 592, and the most common type of nonfamily households are 1-person households, comprising 484.
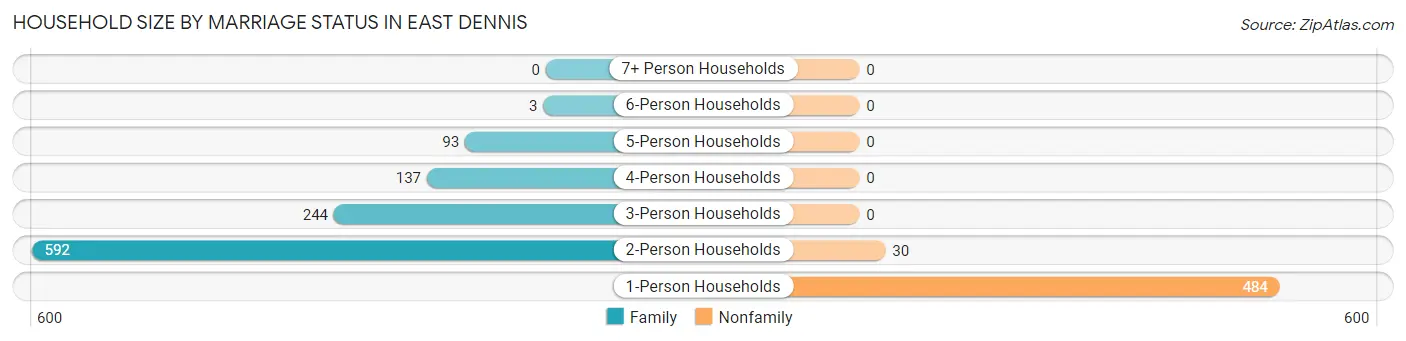
| Household Size | Family Households | Nonfamily Households |
| 1-Person Households | - | 484 (30.6%) |
| 2-Person Households | 592 (37.4%) | 30 (1.9%) |
| 3-Person Households | 244 (15.4%) | 0 (0.0%) |
| 4-Person Households | 137 (8.6%) | 0 (0.0%) |
| 5-Person Households | 93 (5.9%) | 0 (0.0%) |
| 6-Person Households | 3 (0.2%) | 0 (0.0%) |
| 7+ Person Households | 0 (0.0%) | 0 (0.0%) |
| Total | 1,069 (67.5%) | 514 (32.5%) |
Female Fertility in East Dennis
Fertility by Age in East Dennis
| Age Bracket | Women with Births | Births / 1,000 Women |
| 15 to 19 years | 0 (0.0%) | 0.0 |
| 20 to 34 years | 0 (0.0%) | 0.0 |
| 35 to 50 years | 0 (0.0%) | 0.0 |
| Total | 0 (0.0%) | 0.0 |
Fertility by Age by Marriage Status in East Dennis
| Age Bracket | Married | Unmarried |
| 15 to 19 years | 0 (0.0%) | 0 (0.0%) |
| 20 to 34 years | 0 (0.0%) | 0 (0.0%) |
| 35 to 50 years | 0 (0.0%) | 0 (0.0%) |
| Total | 0 (0.0%) | 0 (0.0%) |
Fertility by Education in East Dennis
| Educational Attainment | Women with Births | Births / 1,000 Women |
| Less than High School | 0 (0.0%) | 0.0 |
| High School Diploma | 0 (0.0%) | 0.0 |
| College or Associate's Degree | 0 (0.0%) | 0.0 |
| Bachelor's Degree | 0 (0.0%) | 0.0 |
| Graduate Degree | 0 (0.0%) | 0.0 |
| Total | 0 (0.0%) | 0.0 |
Fertility by Education by Marriage Status in East Dennis
| Educational Attainment | Married | Unmarried |
| Less than High School | 0 (0.0%) | 0 (0.0%) |
| High School Diploma | 0 (0.0%) | 0 (0.0%) |
| College or Associate's Degree | 0 (0.0%) | 0 (0.0%) |
| Bachelor's Degree | 0 (0.0%) | 0 (0.0%) |
| Graduate Degree | 0 (0.0%) | 0 (0.0%) |
| Total | 0 (0.0%) | 0 (0.0%) |
Employment Characteristics in East Dennis
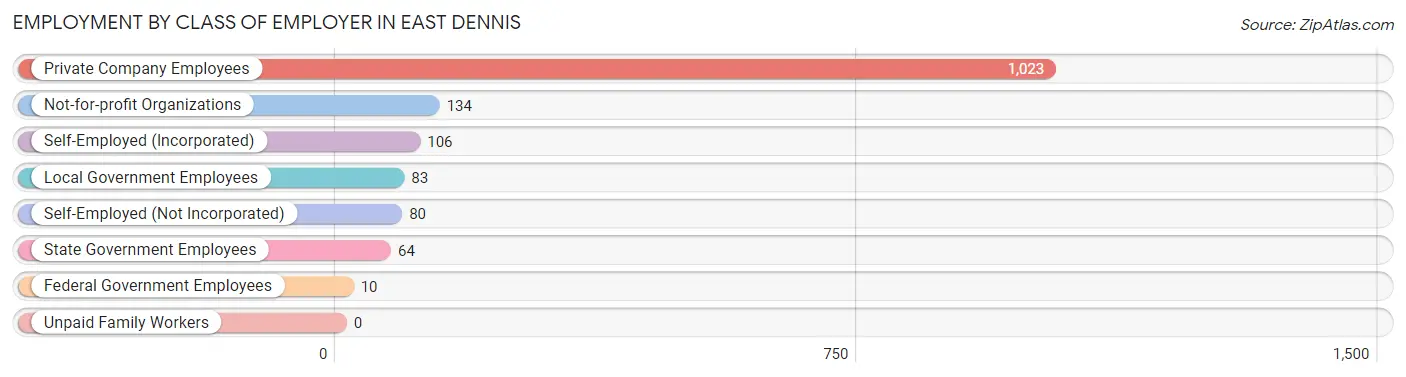
Employment by Class of Employer in East Dennis
Among the 1,500 employed individuals in East Dennis, private company employees (1,023 | 68.2%), not-for-profit organizations (134 | 8.9%), and self-employed (incorporated) (106 | 7.1%) make up the most common classes of employment.
| Employer Class | # Employees | % Employees |
| Private Company Employees | 1,023 | 68.2% |
| Self-Employed (Incorporated) | 106 | 7.1% |
| Self-Employed (Not Incorporated) | 80 | 5.3% |
| Not-for-profit Organizations | 134 | 8.9% |
| Local Government Employees | 83 | 5.5% |
| State Government Employees | 64 | 4.3% |
| Federal Government Employees | 10 | 0.7% |
| Unpaid Family Workers | 0 | 0.0% |
| Total | 1,500 | 100.0% |
Employment Status by Age in East Dennis
According to the labor force statistics for East Dennis, out of the total population over 16 years of age (3,467), 51.4% or 1,782 individuals are in the labor force, with 4.9% or 87 of them unemployed. The age group with the highest labor force participation rate is 30 to 34 years, with 93.3% or 251 individuals in the labor force. Within the labor force, the 55 to 59 years age range has the highest percentage of unemployed individuals, with 17.1% or 30 of them being unemployed.
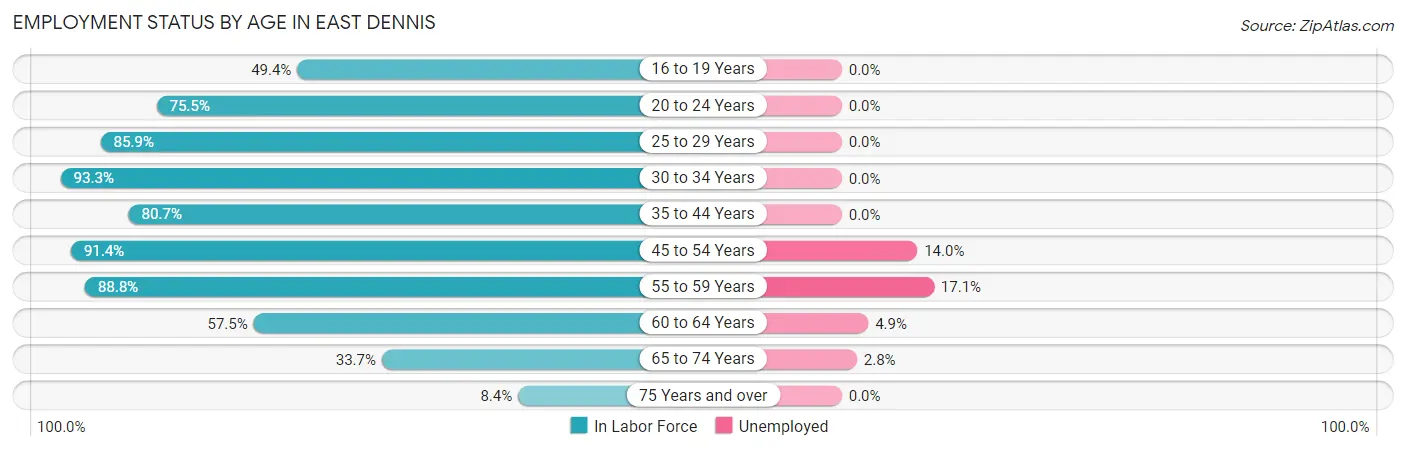
| Age Bracket | In Labor Force | Unemployed |
| 16 to 19 Years | 38 (49.4%) | 0 (0.0%) |
| 20 to 24 Years | 157 (75.5%) | 0 (0.0%) |
| 25 to 29 Years | 79 (85.9%) | 0 (0.0%) |
| 30 to 34 Years | 251 (93.3%) | 0 (0.0%) |
| 35 to 44 Years | 288 (80.7%) | 0 (0.0%) |
| 45 to 54 Years | 299 (91.4%) | 42 (14.0%) |
| 55 to 59 Years | 175 (88.8%) | 30 (17.1%) |
| 60 to 64 Years | 142 (57.5%) | 7 (4.9%) |
| 65 to 74 Years | 281 (33.7%) | 8 (2.8%) |
| 75 Years and over | 72 (8.4%) | 0 (0.0%) |
| Total | 1,782 (51.4%) | 87 (4.9%) |
Employment Status by Educational Attainment in East Dennis
According to labor force statistics for East Dennis, 82.9% of individuals (1,234) out of the total population between 25 and 64 years of age (1,489) are in the labor force, with 6.4% or 79 of them being unemployed. The group with the highest labor force participation rate are those with the educational attainment of bachelor's degree or higher, with 95.3% or 564 individuals in the labor force. Within the labor force, individuals with college / associate degree education have the highest percentage of unemployment, with 8.8% or 37 of them being unemployed.
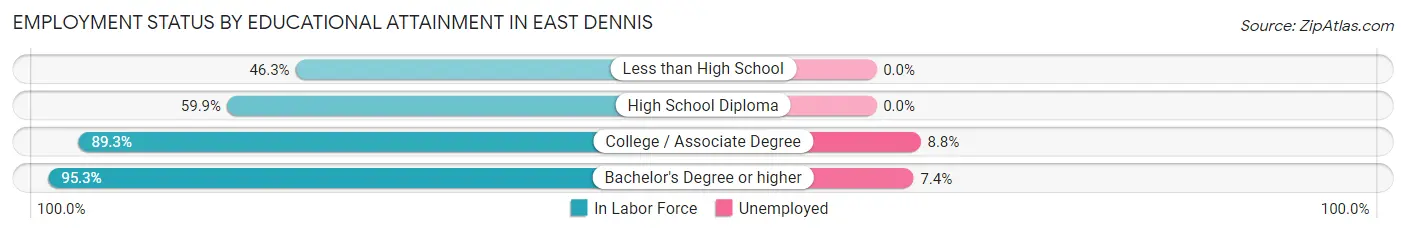
| Educational Attainment | In Labor Force | Unemployed |
| Less than High School | 19 (46.3%) | 0 (0.0%) |
| High School Diploma | 232 (59.9%) | 0 (0.0%) |
| College / Associate Degree | 419 (89.3%) | 41 (8.8%) |
| Bachelor's Degree or higher | 564 (95.3%) | 44 (7.4%) |
| Total | 1,234 (82.9%) | 95 (6.4%) |
Employment Occupations by Sex in East Dennis
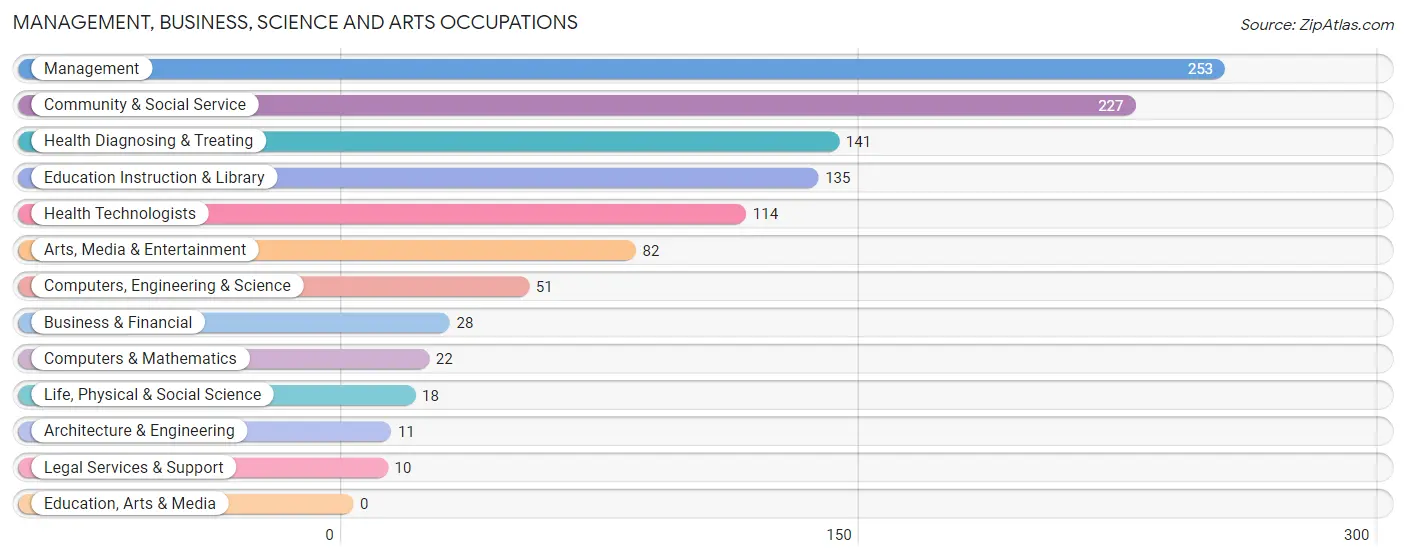
Management, Business, Science and Arts Occupations
The most common Management, Business, Science and Arts occupations in East Dennis are Management (253 | 14.9%), Community & Social Service (227 | 13.4%), Health Diagnosing & Treating (141 | 8.3%), Education Instruction & Library (135 | 8.0%), and Health Technologists (114 | 6.7%).
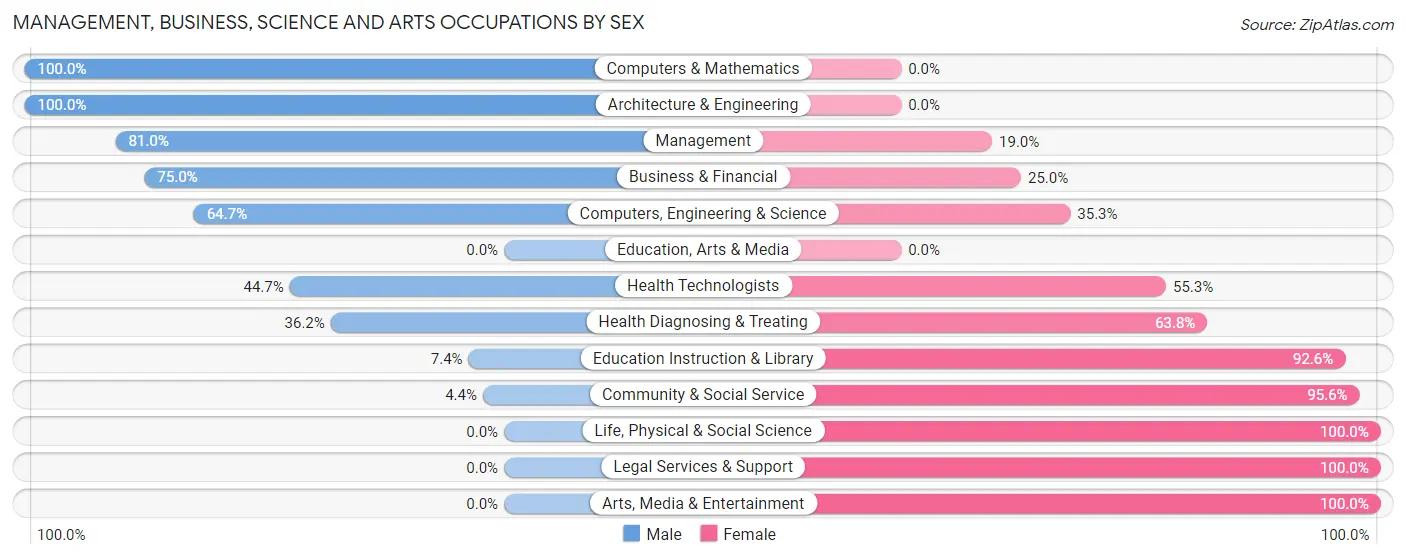
Management, Business, Science and Arts Occupations by Sex
Within the Management, Business, Science and Arts occupations in East Dennis, the most male-oriented occupations are Computers & Mathematics (100.0%), Architecture & Engineering (100.0%), and Management (81.0%), while the most female-oriented occupations are Life, Physical & Social Science (100.0%), Legal Services & Support (100.0%), and Arts, Media & Entertainment (100.0%).
| Occupation | Male | Female |
| Management | 205 (81.0%) | 48 (19.0%) |
| Business & Financial | 21 (75.0%) | 7 (25.0%) |
| Computers, Engineering & Science | 33 (64.7%) | 18 (35.3%) |
| Computers & Mathematics | 22 (100.0%) | 0 (0.0%) |
| Architecture & Engineering | 11 (100.0%) | 0 (0.0%) |
| Life, Physical & Social Science | 0 (0.0%) | 18 (100.0%) |
| Community & Social Service | 10 (4.4%) | 217 (95.6%) |
| Education, Arts & Media | 0 (0.0%) | 0 (0.0%) |
| Legal Services & Support | 0 (0.0%) | 10 (100.0%) |
| Education Instruction & Library | 10 (7.4%) | 125 (92.6%) |
| Arts, Media & Entertainment | 0 (0.0%) | 82 (100.0%) |
| Health Diagnosing & Treating | 51 (36.2%) | 90 (63.8%) |
| Health Technologists | 51 (44.7%) | 63 (55.3%) |
| Total (Category) | 320 (45.7%) | 380 (54.3%) |
| Total (Overall) | 814 (48.0%) | 881 (52.0%) |
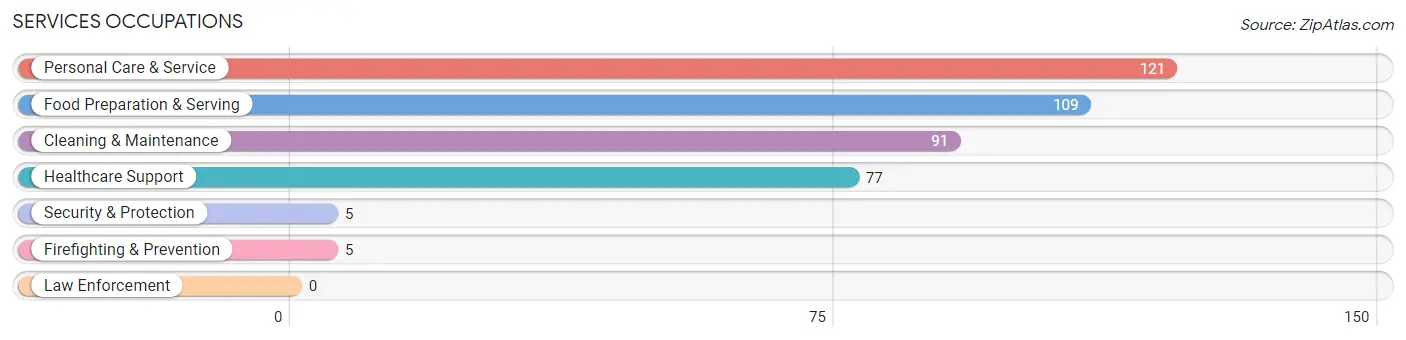
Services Occupations
The most common Services occupations in East Dennis are Personal Care & Service (121 | 7.1%), Food Preparation & Serving (109 | 6.4%), Cleaning & Maintenance (91 | 5.4%), Healthcare Support (77 | 4.5%), and Security & Protection (5 | 0.3%).
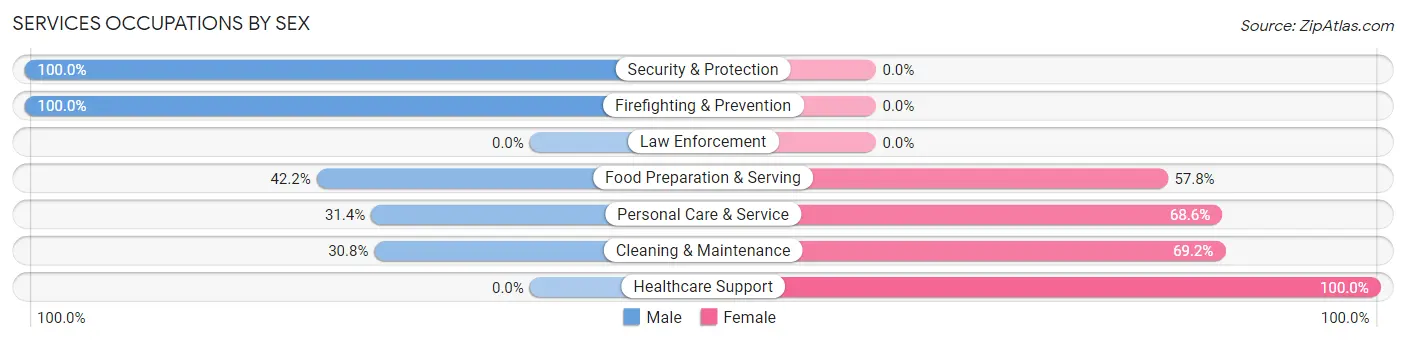
Services Occupations by Sex
Within the Services occupations in East Dennis, the most male-oriented occupations are Security & Protection (100.0%), Firefighting & Prevention (100.0%), and Food Preparation & Serving (42.2%), while the most female-oriented occupations are Healthcare Support (100.0%), Cleaning & Maintenance (69.2%), and Personal Care & Service (68.6%).
| Occupation | Male | Female |
| Healthcare Support | 0 (0.0%) | 77 (100.0%) |
| Security & Protection | 5 (100.0%) | 0 (0.0%) |
| Firefighting & Prevention | 5 (100.0%) | 0 (0.0%) |
| Law Enforcement | 0 (0.0%) | 0 (0.0%) |
| Food Preparation & Serving | 46 (42.2%) | 63 (57.8%) |
| Cleaning & Maintenance | 28 (30.8%) | 63 (69.2%) |
| Personal Care & Service | 38 (31.4%) | 83 (68.6%) |
| Total (Category) | 117 (29.0%) | 286 (71.0%) |
| Total (Overall) | 814 (48.0%) | 881 (52.0%) |
Sales and Office Occupations
The most common Sales and Office occupations in East Dennis are Sales & Related (150 | 8.8%), and Office & Administration (110 | 6.5%).
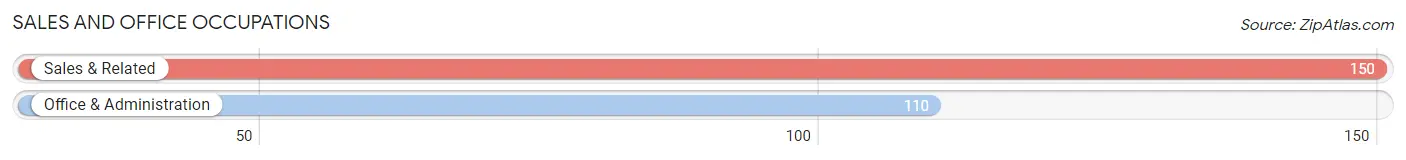
Sales and Office Occupations by Sex

| Occupation | Male | Female |
| Sales & Related | 77 (51.3%) | 73 (48.7%) |
| Office & Administration | 0 (0.0%) | 110 (100.0%) |
| Total (Category) | 77 (29.6%) | 183 (70.4%) |
| Total (Overall) | 814 (48.0%) | 881 (52.0%) |
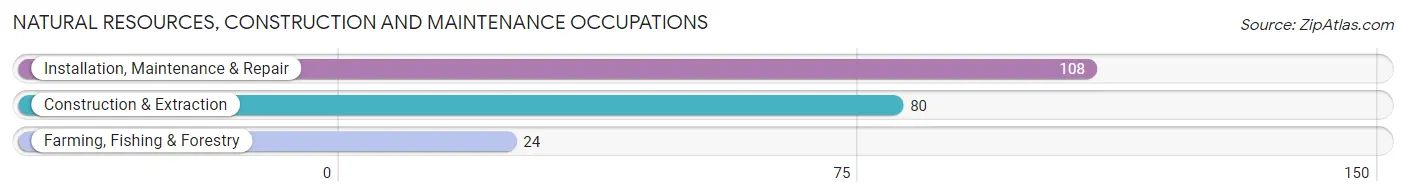
Natural Resources, Construction and Maintenance Occupations
The most common Natural Resources, Construction and Maintenance occupations in East Dennis are Installation, Maintenance & Repair (108 | 6.4%), Construction & Extraction (80 | 4.7%), and Farming, Fishing & Forestry (24 | 1.4%).
Natural Resources, Construction and Maintenance Occupations by Sex
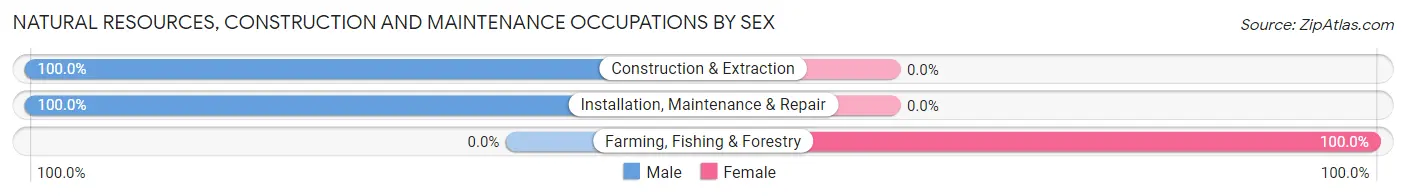
| Occupation | Male | Female |
| Farming, Fishing & Forestry | 0 (0.0%) | 24 (100.0%) |
| Construction & Extraction | 80 (100.0%) | 0 (0.0%) |
| Installation, Maintenance & Repair | 108 (100.0%) | 0 (0.0%) |
| Total (Category) | 188 (88.7%) | 24 (11.3%) |
| Total (Overall) | 814 (48.0%) | 881 (52.0%) |
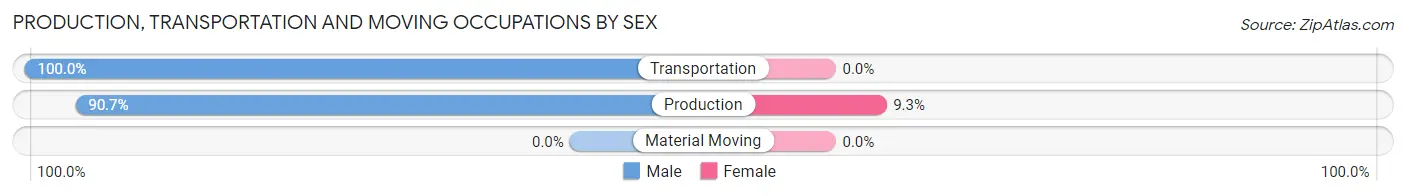
Production, Transportation and Moving Occupations
The most common Production, Transportation and Moving occupations in East Dennis are Production (86 | 5.1%), and Transportation (34 | 2.0%).
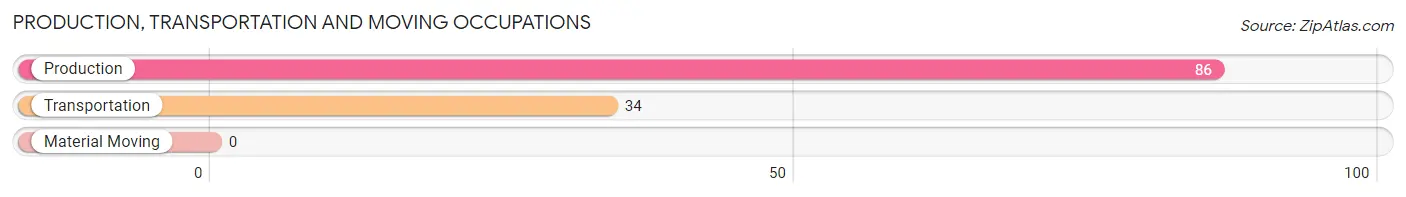
Production, Transportation and Moving Occupations by Sex
| Occupation | Male | Female |
| Production | 78 (90.7%) | 8 (9.3%) |
| Transportation | 34 (100.0%) | 0 (0.0%) |
| Material Moving | 0 (0.0%) | 0 (0.0%) |
| Total (Category) | 112 (93.3%) | 8 (6.7%) |
| Total (Overall) | 814 (48.0%) | 881 (52.0%) |
Employment Industries by Sex in East Dennis
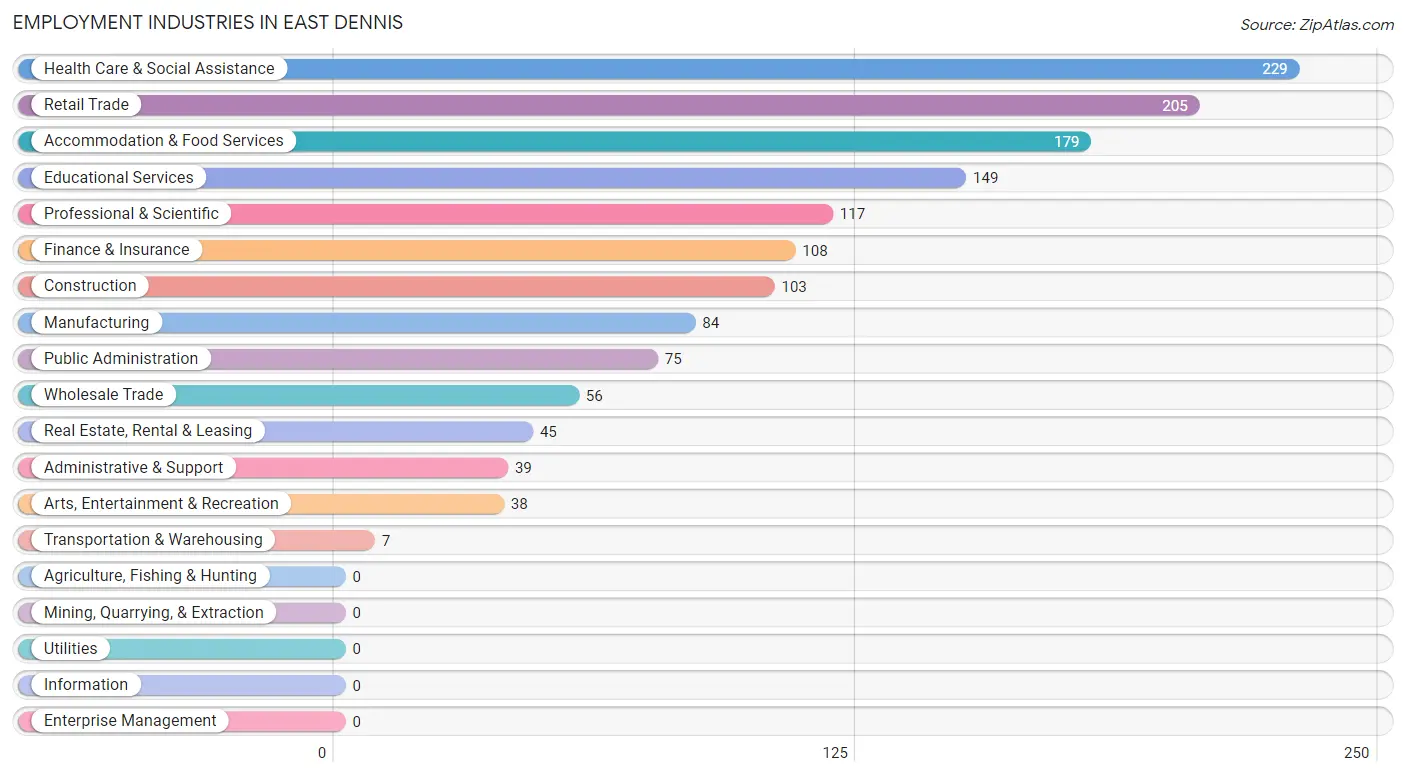
Employment Industries in East Dennis
The major employment industries in East Dennis include Health Care & Social Assistance (229 | 13.5%), Retail Trade (205 | 12.1%), Accommodation & Food Services (179 | 10.6%), Educational Services (149 | 8.8%), and Professional & Scientific (117 | 6.9%).
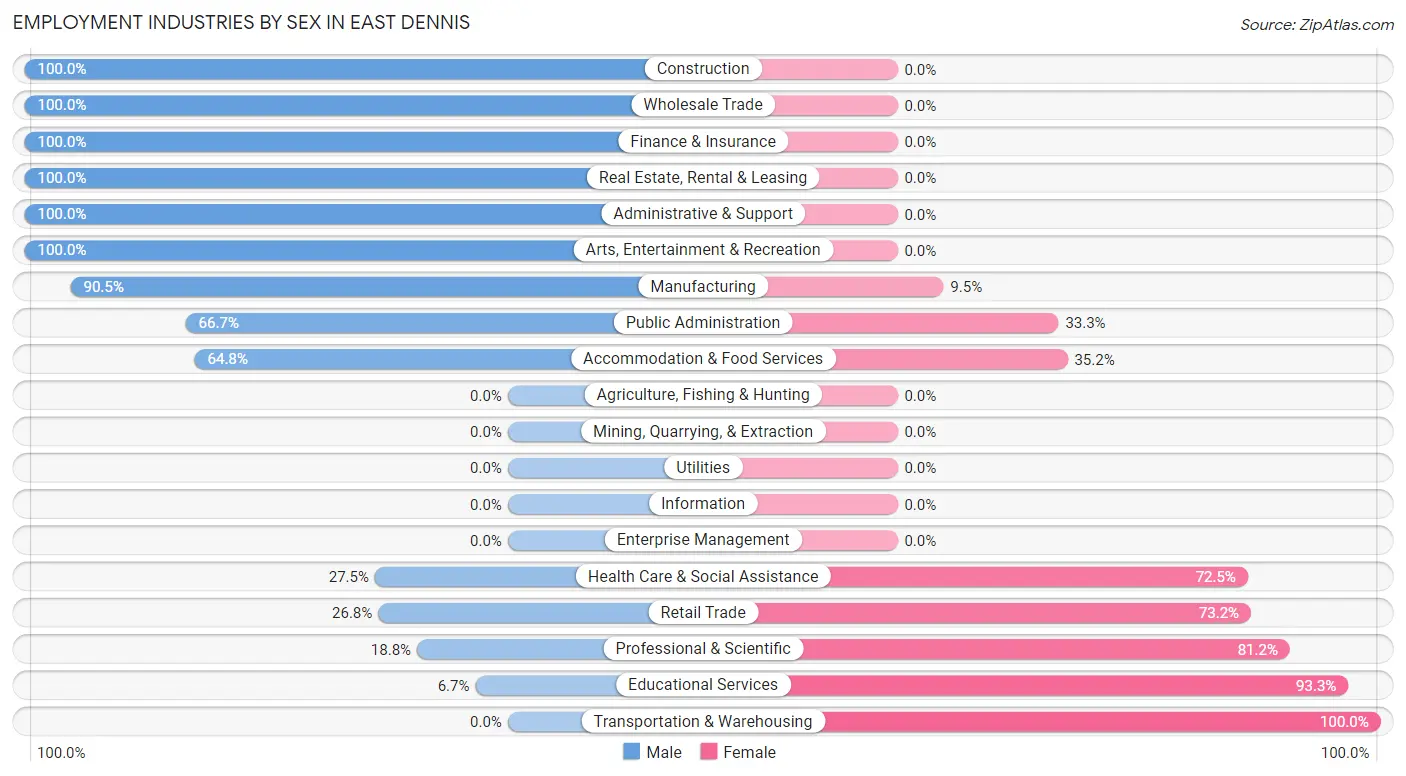
Employment Industries by Sex in East Dennis
The East Dennis industries that see more men than women are Construction (100.0%), Wholesale Trade (100.0%), and Finance & Insurance (100.0%), whereas the industries that tend to have a higher number of women are Transportation & Warehousing (100.0%), Educational Services (93.3%), and Professional & Scientific (81.2%).
| Industry | Male | Female |
| Agriculture, Fishing & Hunting | 0 (0.0%) | 0 (0.0%) |
| Mining, Quarrying, & Extraction | 0 (0.0%) | 0 (0.0%) |
| Construction | 103 (100.0%) | 0 (0.0%) |
| Manufacturing | 76 (90.5%) | 8 (9.5%) |
| Wholesale Trade | 56 (100.0%) | 0 (0.0%) |
| Retail Trade | 55 (26.8%) | 150 (73.2%) |
| Transportation & Warehousing | 0 (0.0%) | 7 (100.0%) |
| Utilities | 0 (0.0%) | 0 (0.0%) |
| Information | 0 (0.0%) | 0 (0.0%) |
| Finance & Insurance | 108 (100.0%) | 0 (0.0%) |
| Real Estate, Rental & Leasing | 45 (100.0%) | 0 (0.0%) |
| Professional & Scientific | 22 (18.8%) | 95 (81.2%) |
| Enterprise Management | 0 (0.0%) | 0 (0.0%) |
| Administrative & Support | 39 (100.0%) | 0 (0.0%) |
| Educational Services | 10 (6.7%) | 139 (93.3%) |
| Health Care & Social Assistance | 63 (27.5%) | 166 (72.5%) |
| Arts, Entertainment & Recreation | 38 (100.0%) | 0 (0.0%) |
| Accommodation & Food Services | 116 (64.8%) | 63 (35.2%) |
| Public Administration | 50 (66.7%) | 25 (33.3%) |
| Total | 814 (48.0%) | 881 (52.0%) |
Education in East Dennis
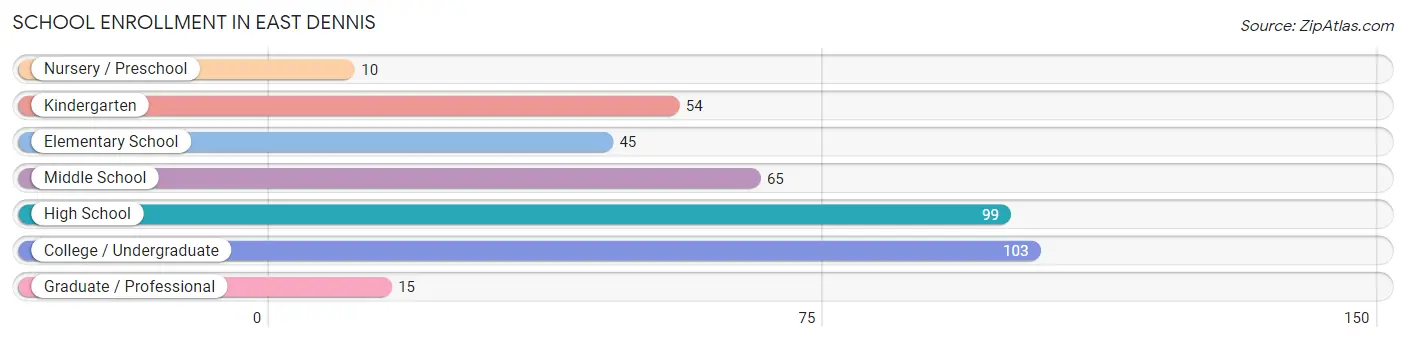
School Enrollment in East Dennis
The most common levels of schooling among the 391 students in East Dennis are college / undergraduate (103 | 26.3%), high school (99 | 25.3%), and middle school (65 | 16.6%).
| School Level | # Students | % Students |
| Nursery / Preschool | 10 | 2.6% |
| Kindergarten | 54 | 13.8% |
| Elementary School | 45 | 11.5% |
| Middle School | 65 | 16.6% |
| High School | 99 | 25.3% |
| College / Undergraduate | 103 | 26.3% |
| Graduate / Professional | 15 | 3.8% |
| Total | 391 | 100.0% |
School Enrollment by Age by Funding Source in East Dennis
Out of a total of 391 students who are enrolled in schools in East Dennis, 149 (38.1%) attend a private institution, while the remaining 242 (61.9%) are enrolled in public schools. The age group of 20 to 24 year olds has the highest likelihood of being enrolled in private schools, with 58 (100.0% in the age bracket) enrolled. Conversely, the age group of 15 to 17 year olds has the lowest likelihood of being enrolled in a private school, with 57 (100.0% in the age bracket) attending a public institution.
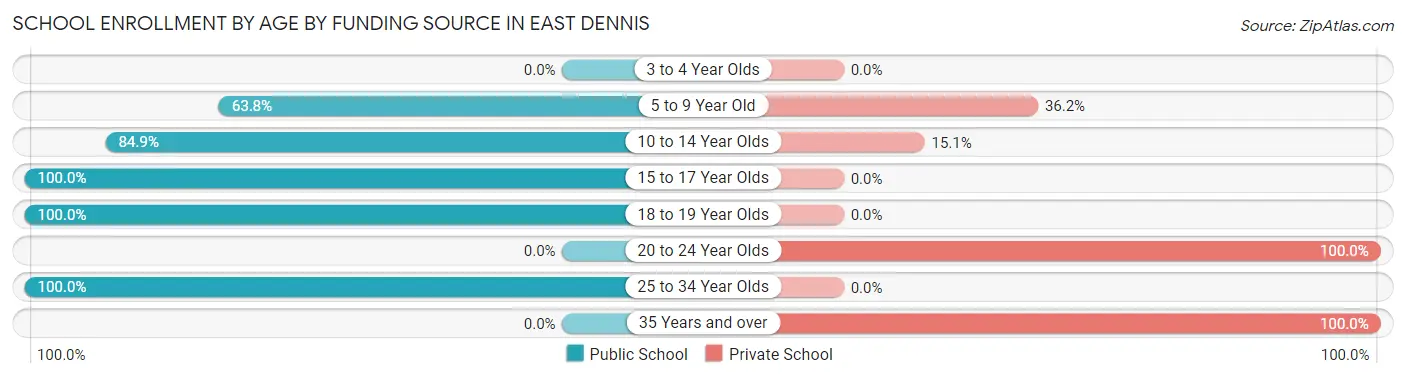
| Age Bracket | Public School | Private School |
| 3 to 4 Year Olds | 0 (0.0%) | 0 (0.0%) |
| 5 to 9 Year Old | 67 (63.8%) | 38 (36.2%) |
| 10 to 14 Year Olds | 62 (84.9%) | 11 (15.1%) |
| 15 to 17 Year Olds | 57 (100.0%) | 0 (0.0%) |
| 18 to 19 Year Olds | 38 (100.0%) | 0 (0.0%) |
| 20 to 24 Year Olds | 0 (0.0%) | 58 (100.0%) |
| 25 to 34 Year Olds | 18 (100.0%) | 0 (0.0%) |
| 35 Years and over | 0 (0.0%) | 42 (100.0%) |
| Total | 242 (61.9%) | 149 (38.1%) |
Educational Attainment by Field of Study in East Dennis
Education (281 | 18.3%), literature & languages (245 | 16.0%), business (186 | 12.1%), visual & performing arts (183 | 11.9%), and science & technology (167 | 10.9%) are the most common fields of study among 1,536 individuals in East Dennis who have obtained a bachelor's degree or higher.
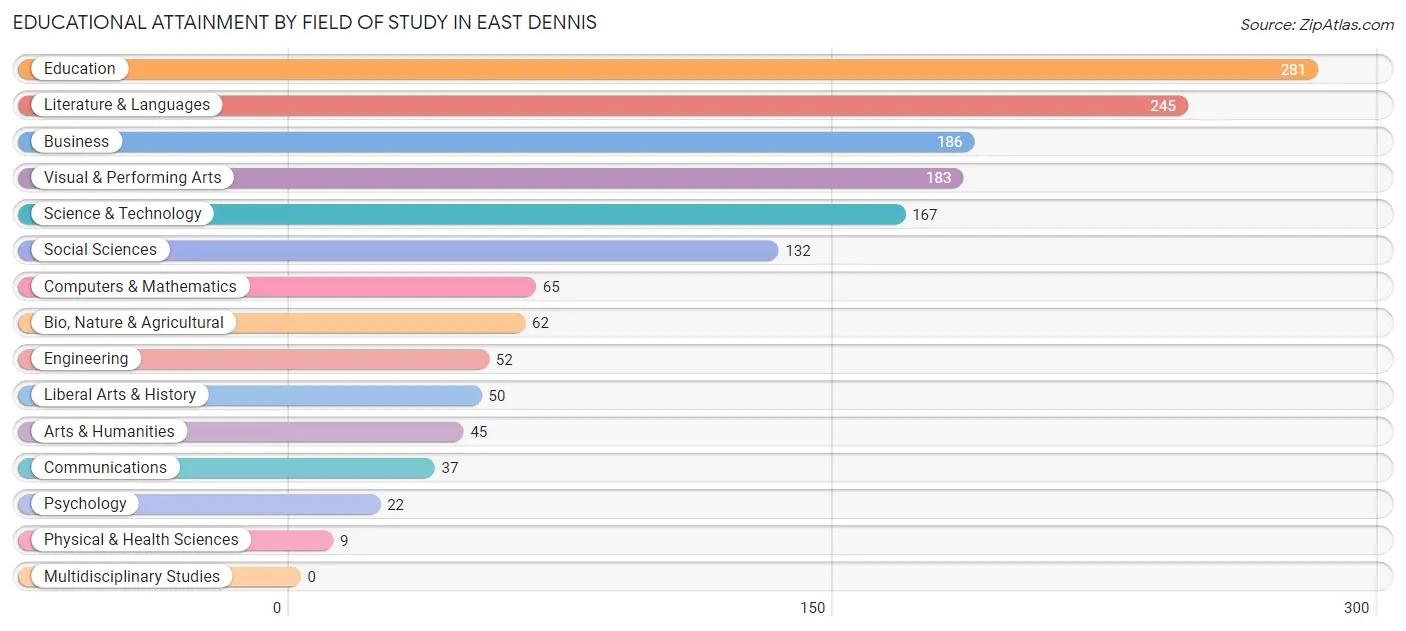
| Field of Study | # Graduates | % Graduates |
| Computers & Mathematics | 65 | 4.2% |
| Bio, Nature & Agricultural | 62 | 4.0% |
| Physical & Health Sciences | 9 | 0.6% |
| Psychology | 22 | 1.4% |
| Social Sciences | 132 | 8.6% |
| Engineering | 52 | 3.4% |
| Multidisciplinary Studies | 0 | 0.0% |
| Science & Technology | 167 | 10.9% |
| Business | 186 | 12.1% |
| Education | 281 | 18.3% |
| Literature & Languages | 245 | 16.0% |
| Liberal Arts & History | 50 | 3.3% |
| Visual & Performing Arts | 183 | 11.9% |
| Communications | 37 | 2.4% |
| Arts & Humanities | 45 | 2.9% |
| Total | 1,536 | 100.0% |
Transportation & Commute in East Dennis
Vehicle Availability by Sex in East Dennis
The most prevalent vehicle ownership categories in East Dennis are males with 2 vehicles (254, accounting for 35.9%) and females with 2 vehicles (220, making up 32.0%).
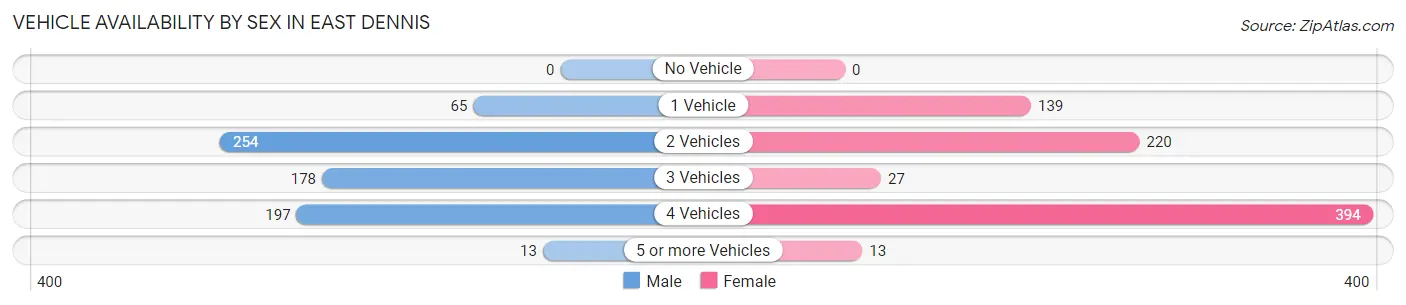
| Vehicles Available | Male | Female |
| No Vehicle | 0 (0.0%) | 0 (0.0%) |
| 1 Vehicle | 65 (9.2%) | 139 (17.5%) |
| 2 Vehicles | 254 (35.9%) | 220 (27.7%) |
| 3 Vehicles | 178 (25.2%) | 27 (3.4%) |
| 4 Vehicles | 197 (27.9%) | 394 (49.7%) |
| 5 or more Vehicles | 13 (1.8%) | 13 (1.6%) |
| Total | 707 (100.0%) | 793 (100.0%) |
Commute Time in East Dennis
The most frequently occuring commute durations in East Dennis are 10 to 14 minutes (264 commuters, 20.9%), 5 to 9 minutes (220 commuters, 17.4%), and 15 to 19 minutes (202 commuters, 16.0%).
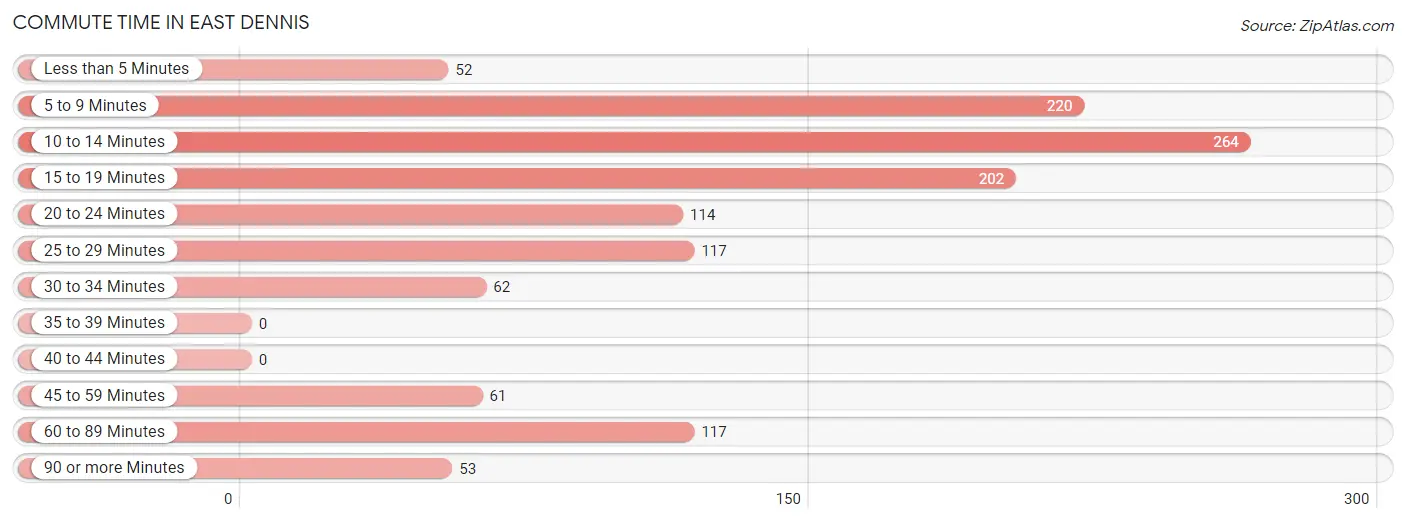
| Commute Time | # Commuters | % Commuters |
| Less than 5 Minutes | 52 | 4.1% |
| 5 to 9 Minutes | 220 | 17.4% |
| 10 to 14 Minutes | 264 | 20.9% |
| 15 to 19 Minutes | 202 | 16.0% |
| 20 to 24 Minutes | 114 | 9.0% |
| 25 to 29 Minutes | 117 | 9.3% |
| 30 to 34 Minutes | 62 | 4.9% |
| 35 to 39 Minutes | 0 | 0.0% |
| 40 to 44 Minutes | 0 | 0.0% |
| 45 to 59 Minutes | 61 | 4.8% |
| 60 to 89 Minutes | 117 | 9.3% |
| 90 or more Minutes | 53 | 4.2% |
Commute Time by Sex in East Dennis
The most common commute times in East Dennis are 10 to 14 minutes (138 commuters, 20.8%) for males and 15 to 19 minutes (128 commuters, 21.3%) for females.
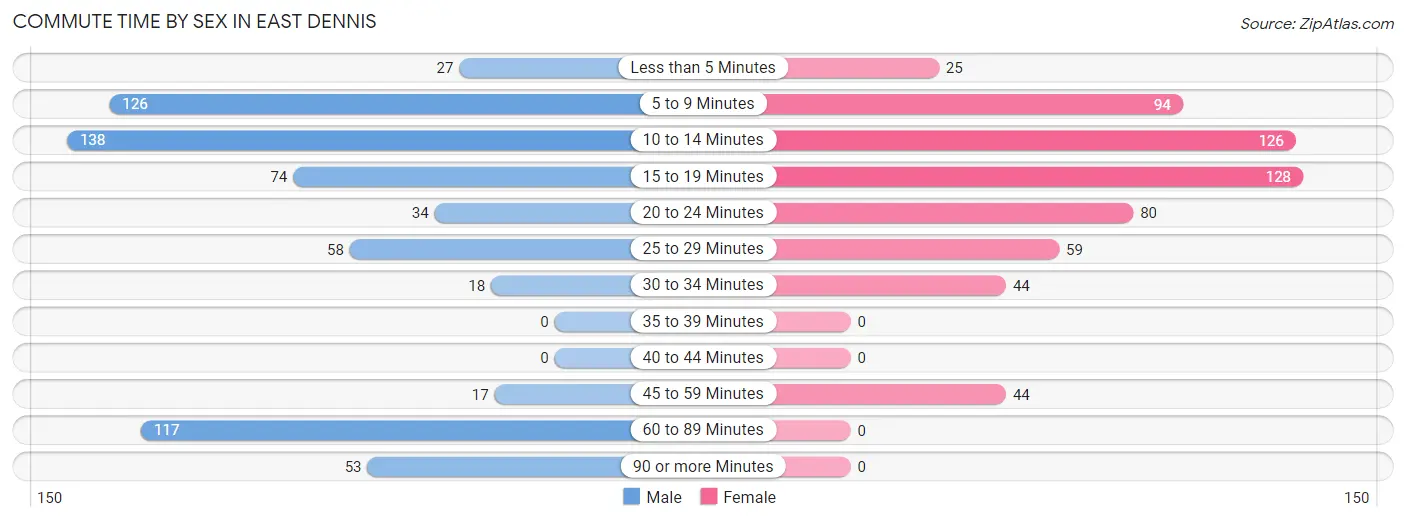
| Commute Time | Male | Female |
| Less than 5 Minutes | 27 (4.1%) | 25 (4.2%) |
| 5 to 9 Minutes | 126 (19.0%) | 94 (15.7%) |
| 10 to 14 Minutes | 138 (20.8%) | 126 (21.0%) |
| 15 to 19 Minutes | 74 (11.2%) | 128 (21.3%) |
| 20 to 24 Minutes | 34 (5.1%) | 80 (13.3%) |
| 25 to 29 Minutes | 58 (8.8%) | 59 (9.8%) |
| 30 to 34 Minutes | 18 (2.7%) | 44 (7.3%) |
| 35 to 39 Minutes | 0 (0.0%) | 0 (0.0%) |
| 40 to 44 Minutes | 0 (0.0%) | 0 (0.0%) |
| 45 to 59 Minutes | 17 (2.6%) | 44 (7.3%) |
| 60 to 89 Minutes | 117 (17.7%) | 0 (0.0%) |
| 90 or more Minutes | 53 (8.0%) | 0 (0.0%) |
Time of Departure to Work by Sex in East Dennis
The most frequent times of departure to work in East Dennis are 8:00 AM to 8:29 AM (134, 20.2%) for males and 9:00 AM to 9:59 AM (164, 27.3%) for females.
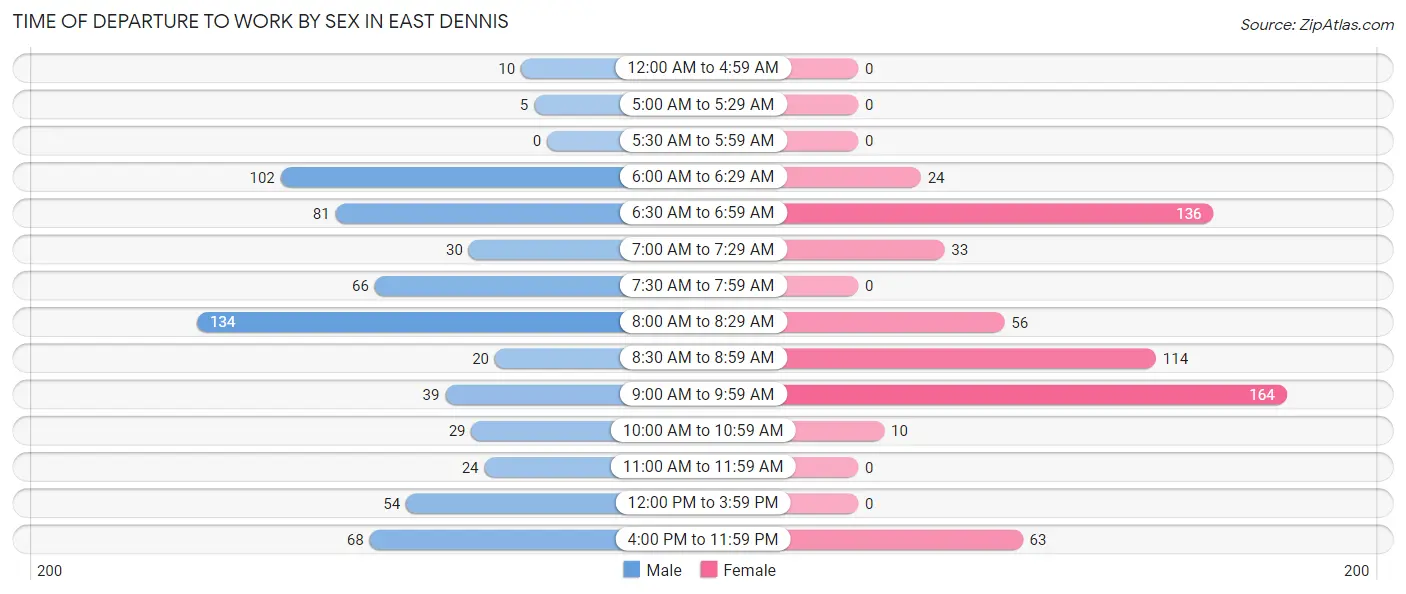
| Time of Departure | Male | Female |
| 12:00 AM to 4:59 AM | 10 (1.5%) | 0 (0.0%) |
| 5:00 AM to 5:29 AM | 5 (0.8%) | 0 (0.0%) |
| 5:30 AM to 5:59 AM | 0 (0.0%) | 0 (0.0%) |
| 6:00 AM to 6:29 AM | 102 (15.4%) | 24 (4.0%) |
| 6:30 AM to 6:59 AM | 81 (12.2%) | 136 (22.7%) |
| 7:00 AM to 7:29 AM | 30 (4.5%) | 33 (5.5%) |
| 7:30 AM to 7:59 AM | 66 (10.0%) | 0 (0.0%) |
| 8:00 AM to 8:29 AM | 134 (20.2%) | 56 (9.3%) |
| 8:30 AM to 8:59 AM | 20 (3.0%) | 114 (19.0%) |
| 9:00 AM to 9:59 AM | 39 (5.9%) | 164 (27.3%) |
| 10:00 AM to 10:59 AM | 29 (4.4%) | 10 (1.7%) |
| 11:00 AM to 11:59 AM | 24 (3.6%) | 0 (0.0%) |
| 12:00 PM to 3:59 PM | 54 (8.2%) | 0 (0.0%) |
| 4:00 PM to 11:59 PM | 68 (10.3%) | 63 (10.5%) |
| Total | 662 (100.0%) | 600 (100.0%) |
Housing Occupancy in East Dennis
Occupancy by Ownership in East Dennis
Of the total 1,583 dwellings in East Dennis, owner-occupied units account for 1,311 (82.8%), while renter-occupied units make up 272 (17.2%).
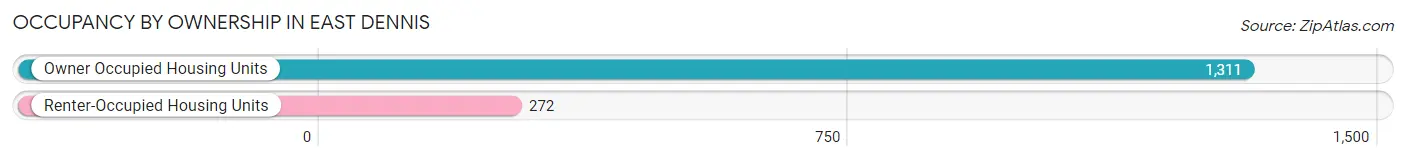
| Occupancy | # Housing Units | % Housing Units |
| Owner Occupied Housing Units | 1,311 | 82.8% |
| Renter-Occupied Housing Units | 272 | 17.2% |
| Total Occupied Housing Units | 1,583 | 100.0% |
Occupancy by Household Size in East Dennis
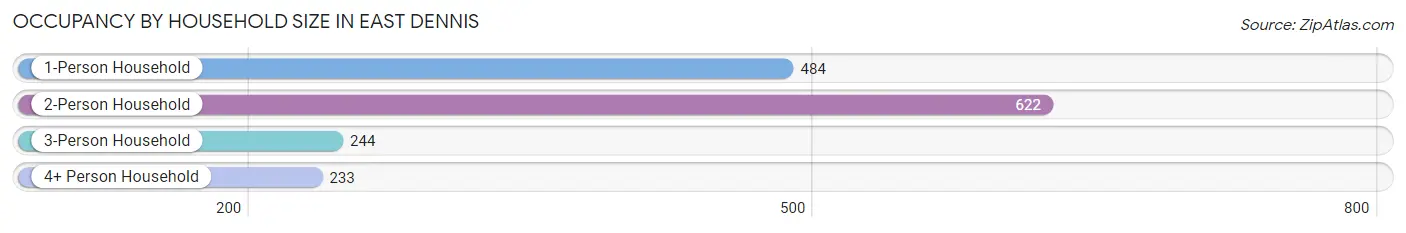
| Household Size | # Housing Units | % Housing Units |
| 1-Person Household | 484 | 30.6% |
| 2-Person Household | 622 | 39.3% |
| 3-Person Household | 244 | 15.4% |
| 4+ Person Household | 233 | 14.7% |
| Total Housing Units | 1,583 | 100.0% |
Occupancy by Ownership by Household Size in East Dennis
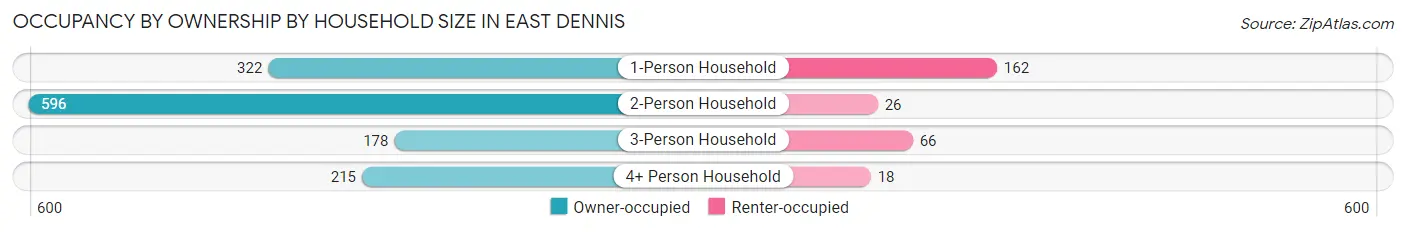
| Household Size | Owner-occupied | Renter-occupied |
| 1-Person Household | 322 (66.5%) | 162 (33.5%) |
| 2-Person Household | 596 (95.8%) | 26 (4.2%) |
| 3-Person Household | 178 (73.0%) | 66 (27.1%) |
| 4+ Person Household | 215 (92.3%) | 18 (7.7%) |
| Total Housing Units | 1,311 (82.8%) | 272 (17.2%) |
Occupancy by Educational Attainment in East Dennis
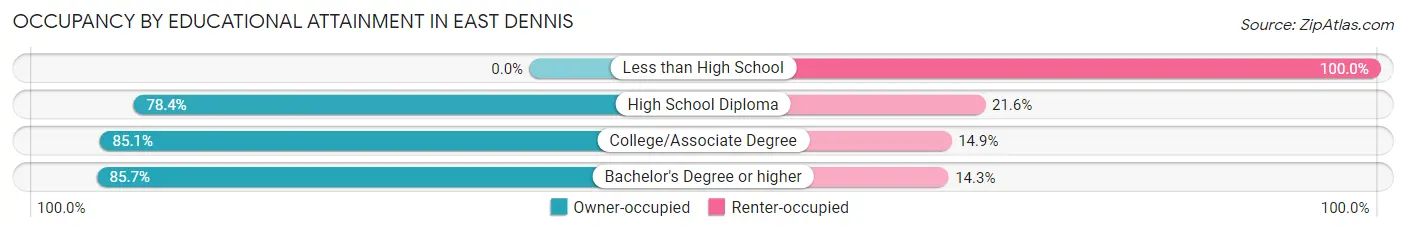
| Household Size | Owner-occupied | Renter-occupied |
| Less than High School | 0 (0.0%) | 22 (100.0%) |
| High School Diploma | 258 (78.4%) | 71 (21.6%) |
| College/Associate Degree | 429 (85.1%) | 75 (14.9%) |
| Bachelor's Degree or higher | 624 (85.7%) | 104 (14.3%) |
Occupancy by Age of Householder in East Dennis
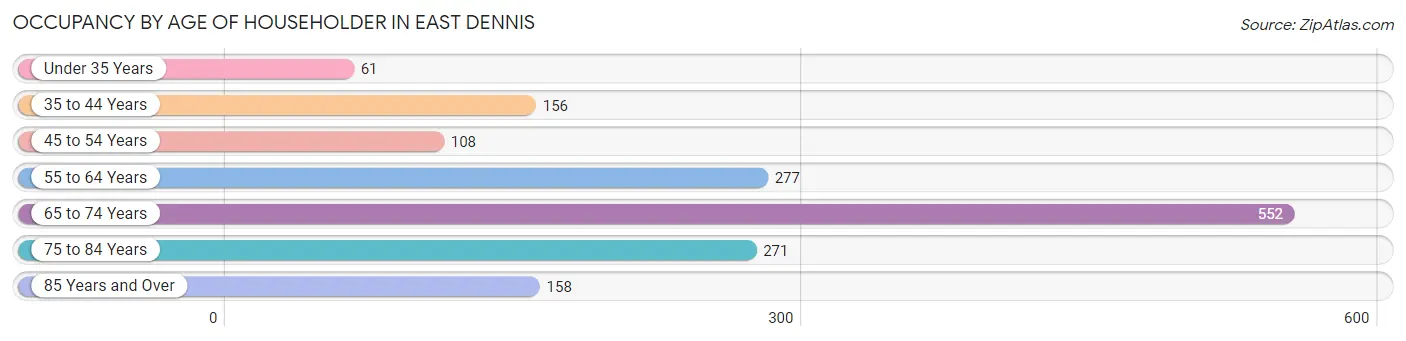
| Age Bracket | # Households | % Households |
| Under 35 Years | 61 | 3.8% |
| 35 to 44 Years | 156 | 9.9% |
| 45 to 54 Years | 108 | 6.8% |
| 55 to 64 Years | 277 | 17.5% |
| 65 to 74 Years | 552 | 34.9% |
| 75 to 84 Years | 271 | 17.1% |
| 85 Years and Over | 158 | 10.0% |
| Total | 1,583 | 100.0% |
Housing Finances in East Dennis
Median Income by Occupancy in East Dennis
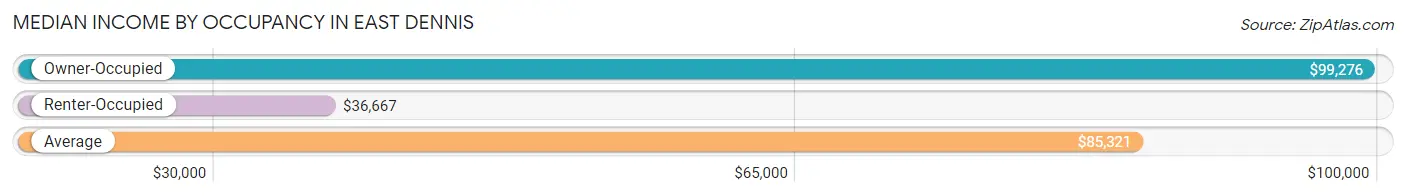
| Occupancy Type | # Households | Median Income |
| Owner-Occupied | 1,311 (82.8%) | $99,276 |
| Renter-Occupied | 272 (17.2%) | $36,667 |
| Average | 1,583 (100.0%) | $85,321 |
Occupancy by Householder Income Bracket in East Dennis
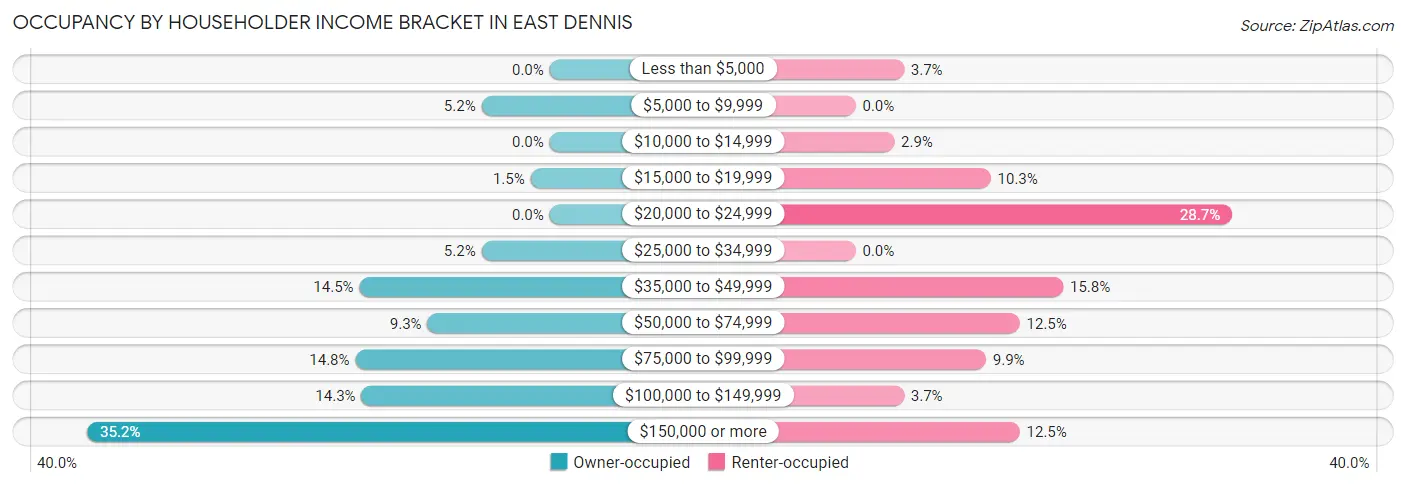
| Income Bracket | Owner-occupied | Renter-occupied |
| Less than $5,000 | 0 (0.0%) | 10 (3.7%) |
| $5,000 to $9,999 | 68 (5.2%) | 0 (0.0%) |
| $10,000 to $14,999 | 0 (0.0%) | 8 (2.9%) |
| $15,000 to $19,999 | 19 (1.5%) | 28 (10.3%) |
| $20,000 to $24,999 | 0 (0.0%) | 78 (28.7%) |
| $25,000 to $34,999 | 68 (5.2%) | 0 (0.0%) |
| $35,000 to $49,999 | 190 (14.5%) | 43 (15.8%) |
| $50,000 to $74,999 | 122 (9.3%) | 34 (12.5%) |
| $75,000 to $99,999 | 194 (14.8%) | 27 (9.9%) |
| $100,000 to $149,999 | 188 (14.3%) | 10 (3.7%) |
| $150,000 or more | 462 (35.2%) | 34 (12.5%) |
| Total | 1,311 (100.0%) | 272 (100.0%) |
Monthly Housing Cost Tiers in East Dennis
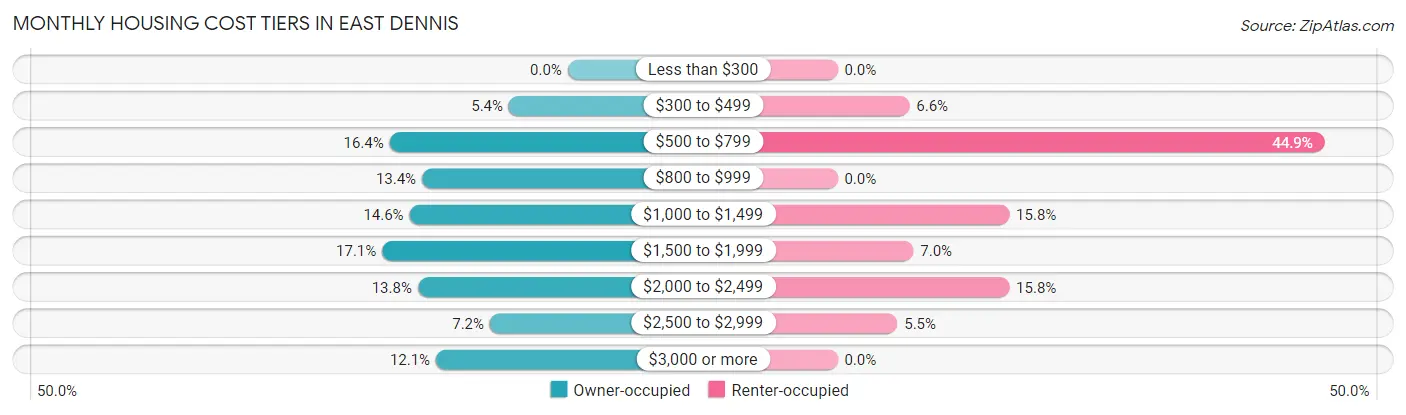
| Monthly Cost | Owner-occupied | Renter-occupied |
| Less than $300 | 0 (0.0%) | 0 (0.0%) |
| $300 to $499 | 71 (5.4%) | 18 (6.6%) |
| $500 to $799 | 215 (16.4%) | 122 (44.9%) |
| $800 to $999 | 176 (13.4%) | 0 (0.0%) |
| $1,000 to $1,499 | 191 (14.6%) | 43 (15.8%) |
| $1,500 to $1,999 | 224 (17.1%) | 19 (7.0%) |
| $2,000 to $2,499 | 181 (13.8%) | 43 (15.8%) |
| $2,500 to $2,999 | 94 (7.2%) | 15 (5.5%) |
| $3,000 or more | 159 (12.1%) | 0 (0.0%) |
| Total | 1,311 (100.0%) | 272 (100.0%) |
Physical Housing Characteristics in East Dennis
Housing Structures in East Dennis
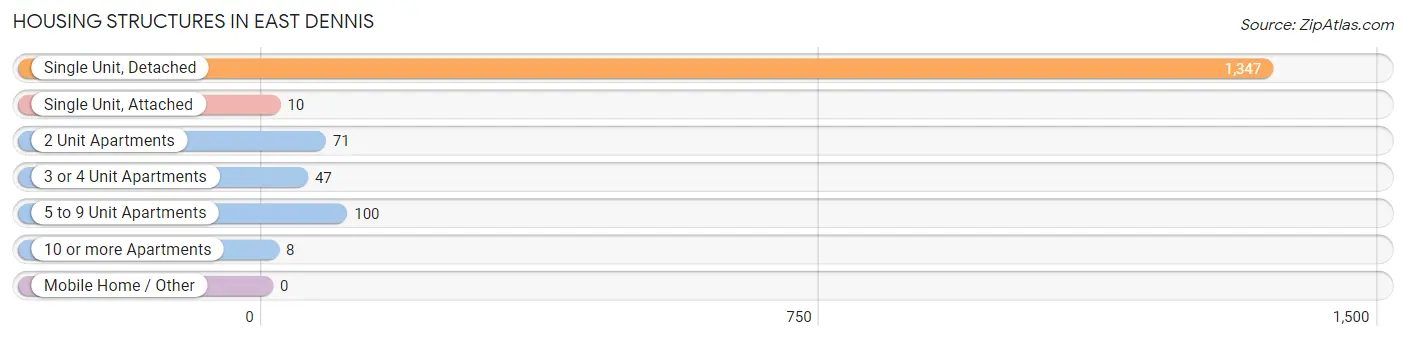
| Structure Type | # Housing Units | % Housing Units |
| Single Unit, Detached | 1,347 | 85.1% |
| Single Unit, Attached | 10 | 0.6% |
| 2 Unit Apartments | 71 | 4.5% |
| 3 or 4 Unit Apartments | 47 | 3.0% |
| 5 to 9 Unit Apartments | 100 | 6.3% |
| 10 or more Apartments | 8 | 0.5% |
| Mobile Home / Other | 0 | 0.0% |
| Total | 1,583 | 100.0% |
Housing Structures by Occupancy in East Dennis
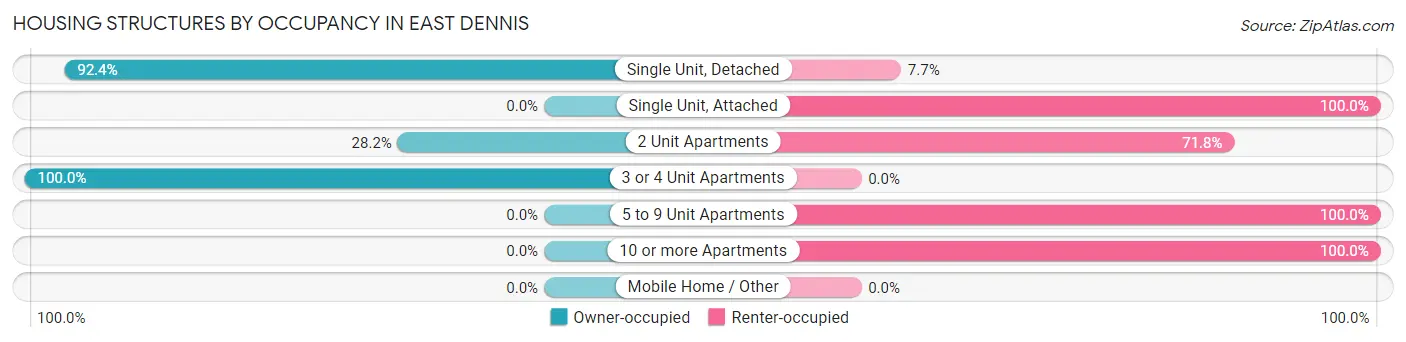
| Structure Type | Owner-occupied | Renter-occupied |
| Single Unit, Detached | 1,244 (92.3%) | 103 (7.6%) |
| Single Unit, Attached | 0 (0.0%) | 10 (100.0%) |
| 2 Unit Apartments | 20 (28.2%) | 51 (71.8%) |
| 3 or 4 Unit Apartments | 47 (100.0%) | 0 (0.0%) |
| 5 to 9 Unit Apartments | 0 (0.0%) | 100 (100.0%) |
| 10 or more Apartments | 0 (0.0%) | 8 (100.0%) |
| Mobile Home / Other | 0 (0.0%) | 0 (0.0%) |
| Total | 1,311 (82.8%) | 272 (17.2%) |
Housing Structures by Number of Rooms in East Dennis
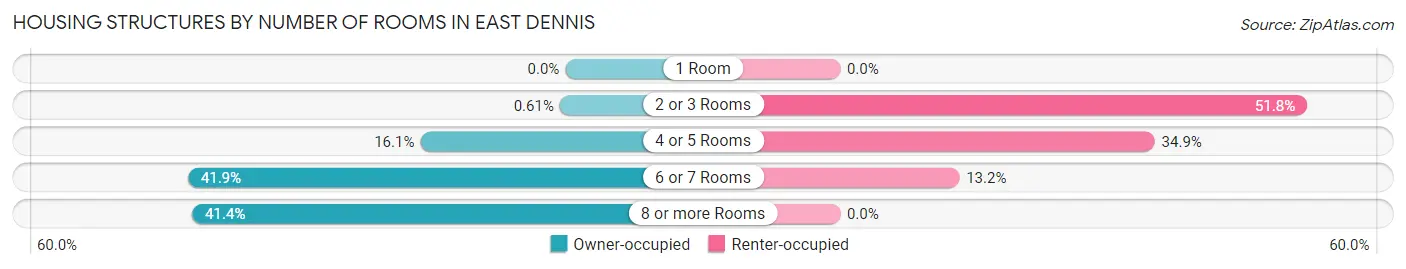
| Number of Rooms | Owner-occupied | Renter-occupied |
| 1 Room | 0 (0.0%) | 0 (0.0%) |
| 2 or 3 Rooms | 8 (0.6%) | 141 (51.8%) |
| 4 or 5 Rooms | 211 (16.1%) | 95 (34.9%) |
| 6 or 7 Rooms | 549 (41.9%) | 36 (13.2%) |
| 8 or more Rooms | 543 (41.4%) | 0 (0.0%) |
| Total | 1,311 (100.0%) | 272 (100.0%) |
Housing Structure by Heating Type in East Dennis
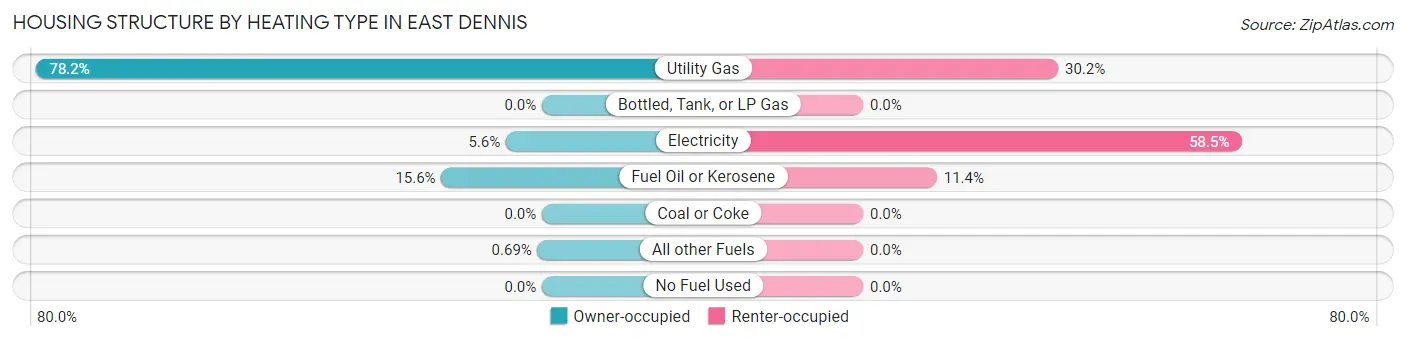
| Heating Type | Owner-occupied | Renter-occupied |
| Utility Gas | 1,025 (78.2%) | 82 (30.1%) |
| Bottled, Tank, or LP Gas | 0 (0.0%) | 0 (0.0%) |
| Electricity | 73 (5.6%) | 159 (58.5%) |
| Fuel Oil or Kerosene | 204 (15.6%) | 31 (11.4%) |
| Coal or Coke | 0 (0.0%) | 0 (0.0%) |
| All other Fuels | 9 (0.7%) | 0 (0.0%) |
| No Fuel Used | 0 (0.0%) | 0 (0.0%) |
| Total | 1,311 (100.0%) | 272 (100.0%) |
Household Vehicle Usage in East Dennis
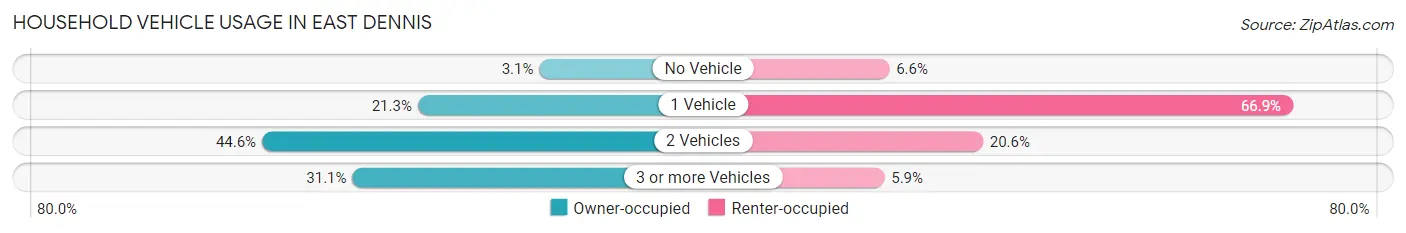
| Vehicles per Household | Owner-occupied | Renter-occupied |
| No Vehicle | 41 (3.1%) | 18 (6.6%) |
| 1 Vehicle | 279 (21.3%) | 182 (66.9%) |
| 2 Vehicles | 584 (44.6%) | 56 (20.6%) |
| 3 or more Vehicles | 407 (31.0%) | 16 (5.9%) |
| Total | 1,311 (100.0%) | 272 (100.0%) |
Real Estate & Mortgages in East Dennis
Real Estate and Mortgage Overview in East Dennis
| Characteristic | Without Mortgage | With Mortgage |
| Housing Units | 535 | 776 |
| Median Property Value | $612,600 | $667,300 |
| Median Household Income | $85,240 | $310 |
| Monthly Housing Costs | $781 | $159 |
| Real Estate Taxes | $2,958 | $0 |
Property Value by Mortgage Status in East Dennis
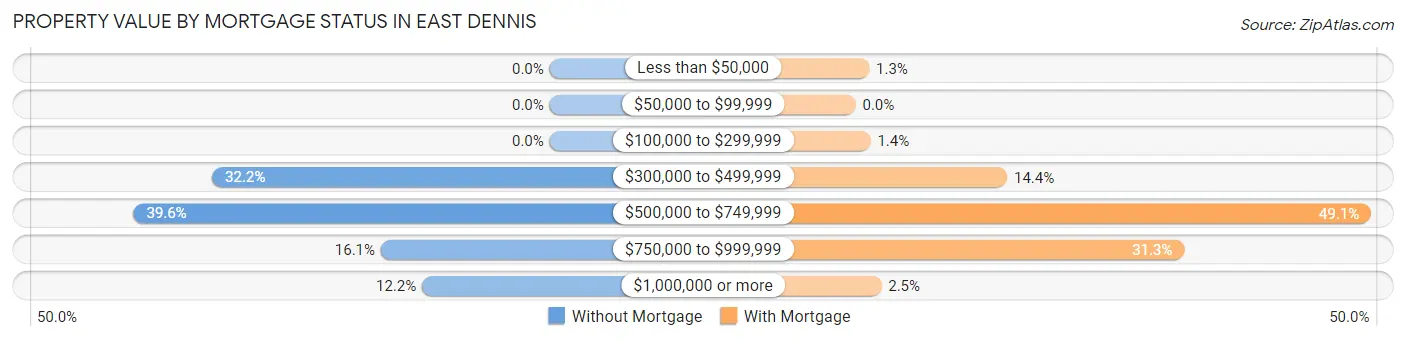
| Property Value | Without Mortgage | With Mortgage |
| Less than $50,000 | 0 (0.0%) | 10 (1.3%) |
| $50,000 to $99,999 | 0 (0.0%) | 0 (0.0%) |
| $100,000 to $299,999 | 0 (0.0%) | 11 (1.4%) |
| $300,000 to $499,999 | 172 (32.2%) | 112 (14.4%) |
| $500,000 to $749,999 | 212 (39.6%) | 381 (49.1%) |
| $750,000 to $999,999 | 86 (16.1%) | 243 (31.3%) |
| $1,000,000 or more | 65 (12.1%) | 19 (2.5%) |
| Total | 535 (100.0%) | 776 (100.0%) |
Household Income by Mortgage Status in East Dennis
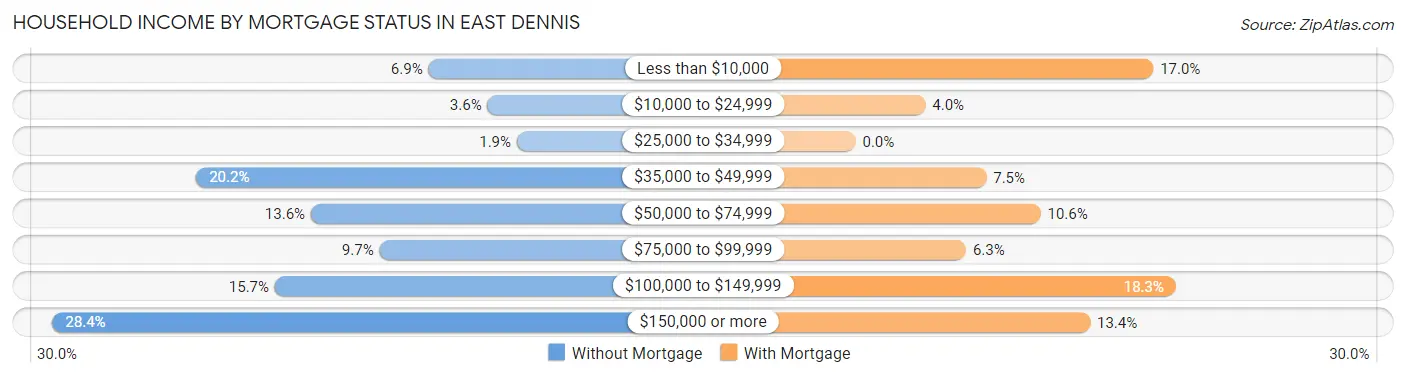
| Household Income | Without Mortgage | With Mortgage |
| Less than $10,000 | 37 (6.9%) | 132 (17.0%) |
| $10,000 to $24,999 | 19 (3.5%) | 31 (4.0%) |
| $25,000 to $34,999 | 10 (1.9%) | 0 (0.0%) |
| $35,000 to $49,999 | 108 (20.2%) | 58 (7.5%) |
| $50,000 to $74,999 | 73 (13.6%) | 82 (10.6%) |
| $75,000 to $99,999 | 52 (9.7%) | 49 (6.3%) |
| $100,000 to $149,999 | 84 (15.7%) | 142 (18.3%) |
| $150,000 or more | 152 (28.4%) | 104 (13.4%) |
| Total | 535 (100.0%) | 776 (100.0%) |
Property Value to Household Income Ratio in East Dennis
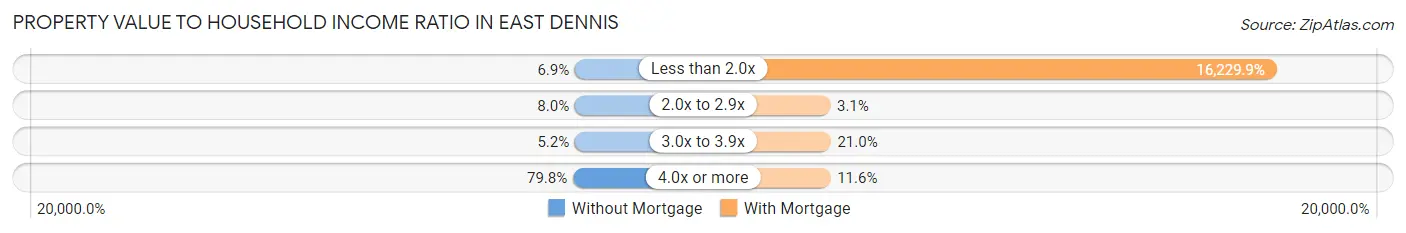
| Value-to-Income Ratio | Without Mortgage | With Mortgage |
| Less than 2.0x | 37 (6.9%) | 125,944 (16,229.9%) |
| 2.0x to 2.9x | 43 (8.0%) | 24 (3.1%) |
| 3.0x to 3.9x | 28 (5.2%) | 163 (21.0%) |
| 4.0x or more | 427 (79.8%) | 90 (11.6%) |
| Total | 535 (100.0%) | 776 (100.0%) |
Real Estate Taxes by Mortgage Status in East Dennis
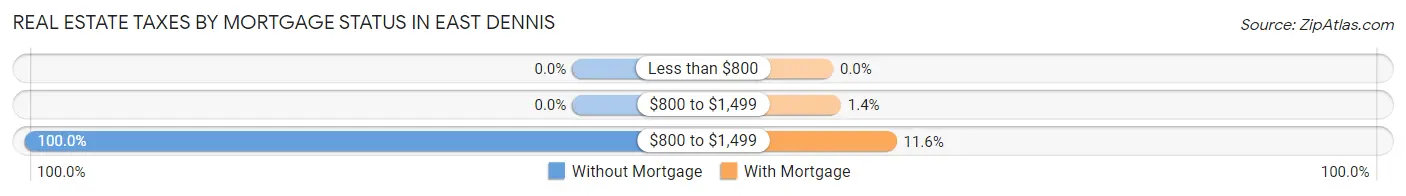
| Property Taxes | Without Mortgage | With Mortgage |
| Less than $800 | 0 (0.0%) | 0 (0.0%) |
| $800 to $1,499 | 0 (0.0%) | 11 (1.4%) |
| $800 to $1,499 | 535 (100.0%) | 90 (11.6%) |
| Total | 535 (100.0%) | 776 (100.0%) |
Health & Disability in East Dennis
Health Insurance Coverage by Age in East Dennis
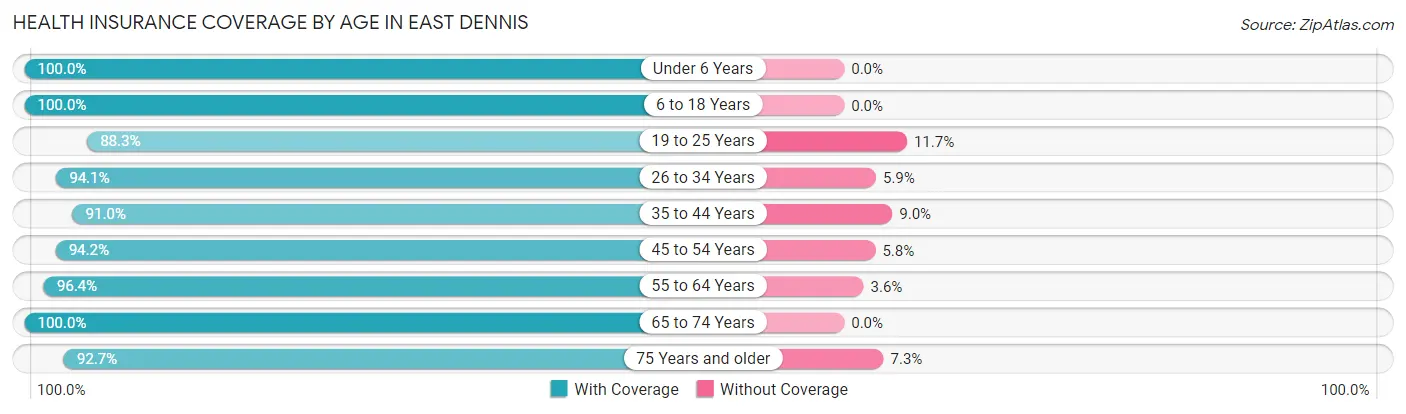
| Age Bracket | With Coverage | Without Coverage |
| Under 6 Years | 112 (100.0%) | 0 (0.0%) |
| 6 to 18 Years | 209 (100.0%) | 0 (0.0%) |
| 19 to 25 Years | 204 (88.3%) | 27 (11.7%) |
| 26 to 34 Years | 318 (94.1%) | 20 (5.9%) |
| 35 to 44 Years | 325 (91.0%) | 32 (9.0%) |
| 45 to 54 Years | 308 (94.2%) | 19 (5.8%) |
| 55 to 64 Years | 428 (96.4%) | 16 (3.6%) |
| 65 to 74 Years | 833 (100.0%) | 0 (0.0%) |
| 75 Years and older | 797 (92.7%) | 63 (7.3%) |
| Total | 3,534 (95.2%) | 177 (4.8%) |
Health Insurance Coverage by Citizenship Status in East Dennis
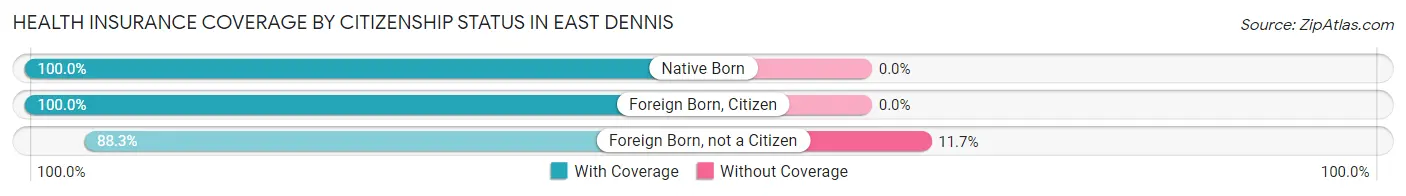
| Citizenship Status | With Coverage | Without Coverage |
| Native Born | 112 (100.0%) | 0 (0.0%) |
| Foreign Born, Citizen | 209 (100.0%) | 0 (0.0%) |
| Foreign Born, not a Citizen | 204 (88.3%) | 27 (11.7%) |
Health Insurance Coverage by Household Income in East Dennis
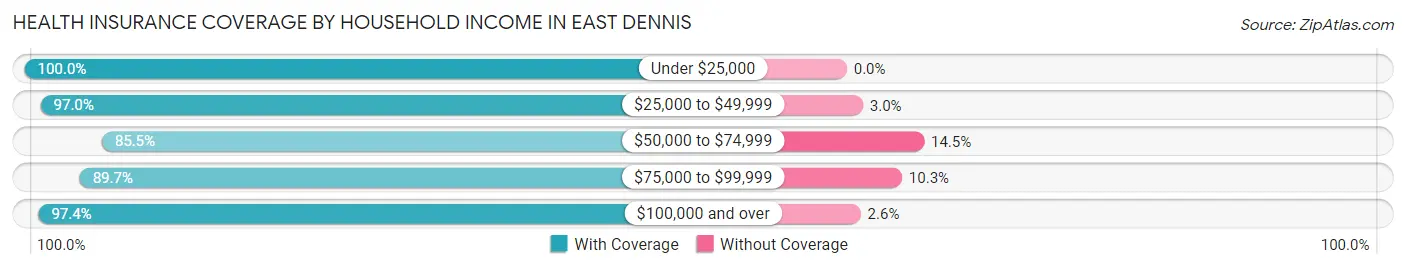
| Household Income | With Coverage | Without Coverage |
| Under $25,000 | 268 (100.0%) | 0 (0.0%) |
| $25,000 to $49,999 | 612 (97.0%) | 19 (3.0%) |
| $50,000 to $74,999 | 272 (85.5%) | 46 (14.5%) |
| $75,000 to $99,999 | 547 (89.7%) | 63 (10.3%) |
| $100,000 and over | 1,835 (97.4%) | 49 (2.6%) |
Public vs Private Health Insurance Coverage by Age in East Dennis
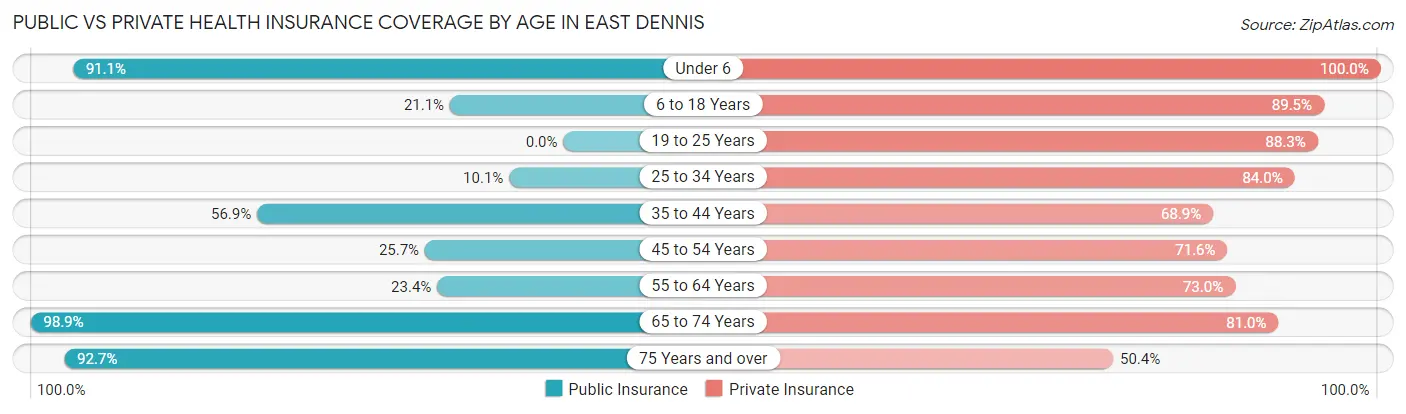
| Age Bracket | Public Insurance | Private Insurance |
| Under 6 | 102 (91.1%) | 112 (100.0%) |
| 6 to 18 Years | 44 (21.0%) | 187 (89.5%) |
| 19 to 25 Years | 0 (0.0%) | 204 (88.3%) |
| 25 to 34 Years | 34 (10.1%) | 284 (84.0%) |
| 35 to 44 Years | 203 (56.9%) | 246 (68.9%) |
| 45 to 54 Years | 84 (25.7%) | 234 (71.6%) |
| 55 to 64 Years | 104 (23.4%) | 324 (73.0%) |
| 65 to 74 Years | 824 (98.9%) | 675 (81.0%) |
| 75 Years and over | 797 (92.7%) | 433 (50.3%) |
| Total | 2,192 (59.1%) | 2,699 (72.7%) |
Disability Status by Sex by Age in East Dennis
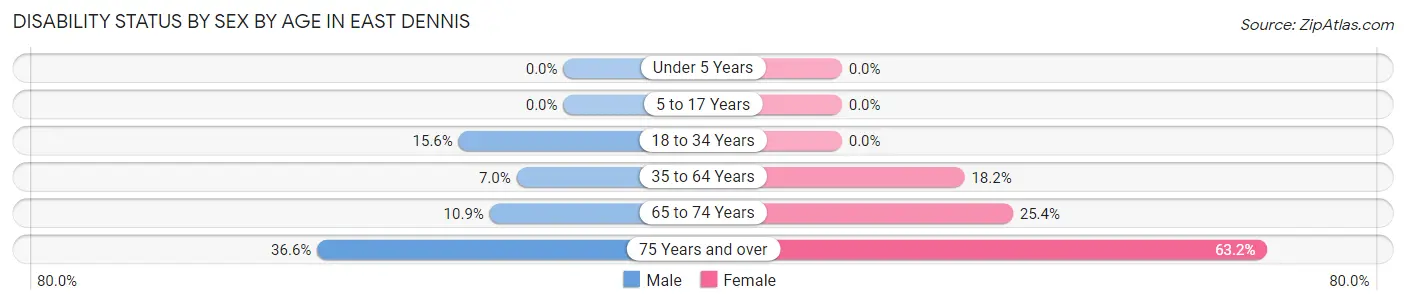
| Age Bracket | Male | Female |
| Under 5 Years | 0 (0.0%) | 0 (0.0%) |
| 5 to 17 Years | 0 (0.0%) | 0 (0.0%) |
| 18 to 34 Years | 51 (15.5%) | 0 (0.0%) |
| 35 to 64 Years | 33 (7.0%) | 119 (18.2%) |
| 65 to 74 Years | 42 (10.9%) | 114 (25.4%) |
| 75 Years and over | 102 (36.6%) | 367 (63.2%) |
Disability Class by Sex by Age in East Dennis
Disability Class: Hearing Difficulty
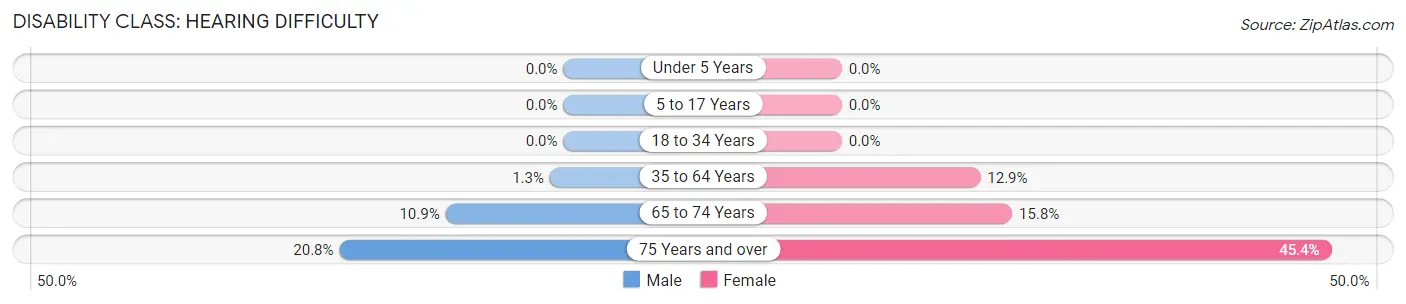
| Age Bracket | Male | Female |
| Under 5 Years | 0 (0.0%) | 0 (0.0%) |
| 5 to 17 Years | 0 (0.0%) | 0 (0.0%) |
| 18 to 34 Years | 0 (0.0%) | 0 (0.0%) |
| 35 to 64 Years | 6 (1.3%) | 84 (12.9%) |
| 65 to 74 Years | 42 (10.9%) | 71 (15.8%) |
| 75 Years and over | 58 (20.8%) | 264 (45.4%) |
Disability Class: Vision Difficulty
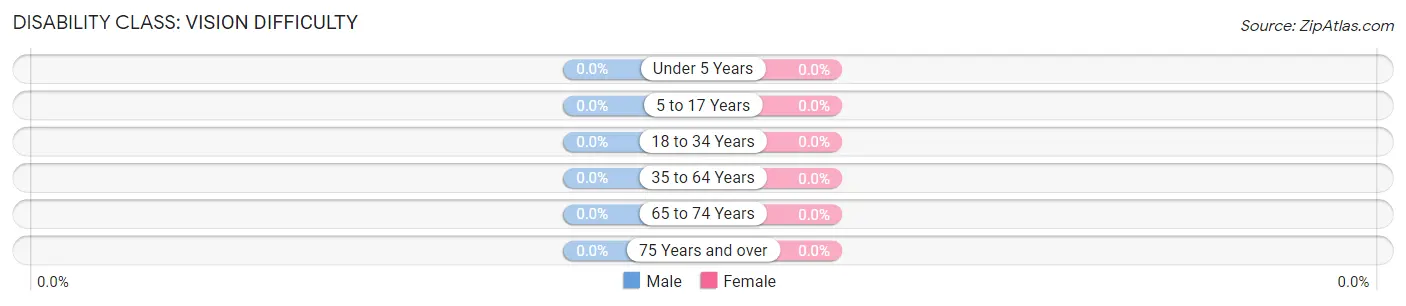
| Age Bracket | Male | Female |
| Under 5 Years | 0 (0.0%) | 0 (0.0%) |
| 5 to 17 Years | 0 (0.0%) | 0 (0.0%) |
| 18 to 34 Years | 0 (0.0%) | 0 (0.0%) |
| 35 to 64 Years | 0 (0.0%) | 0 (0.0%) |
| 65 to 74 Years | 0 (0.0%) | 0 (0.0%) |
| 75 Years and over | 0 (0.0%) | 0 (0.0%) |
Disability Class: Cognitive Difficulty
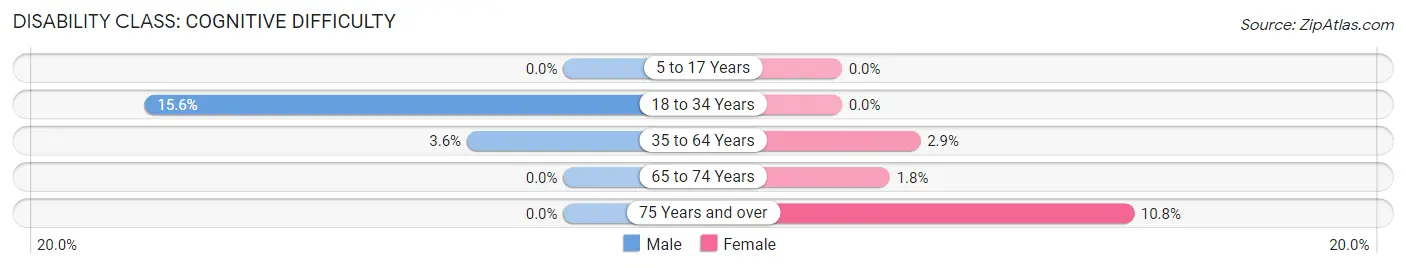
| Age Bracket | Male | Female |
| 5 to 17 Years | 0 (0.0%) | 0 (0.0%) |
| 18 to 34 Years | 51 (15.5%) | 0 (0.0%) |
| 35 to 64 Years | 17 (3.6%) | 19 (2.9%) |
| 65 to 74 Years | 0 (0.0%) | 8 (1.8%) |
| 75 Years and over | 0 (0.0%) | 63 (10.8%) |
Disability Class: Ambulatory Difficulty
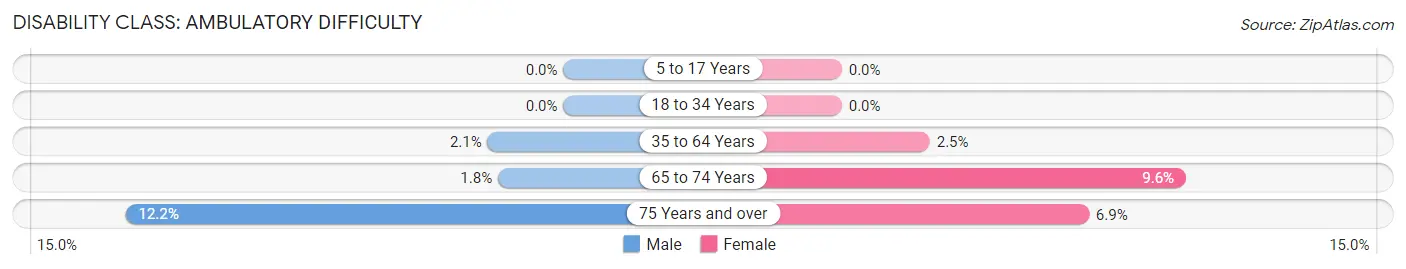
| Age Bracket | Male | Female |
| 5 to 17 Years | 0 (0.0%) | 0 (0.0%) |
| 18 to 34 Years | 0 (0.0%) | 0 (0.0%) |
| 35 to 64 Years | 10 (2.1%) | 16 (2.5%) |
| 65 to 74 Years | 7 (1.8%) | 43 (9.6%) |
| 75 Years and over | 34 (12.2%) | 40 (6.9%) |
Disability Class: Self-Care Difficulty
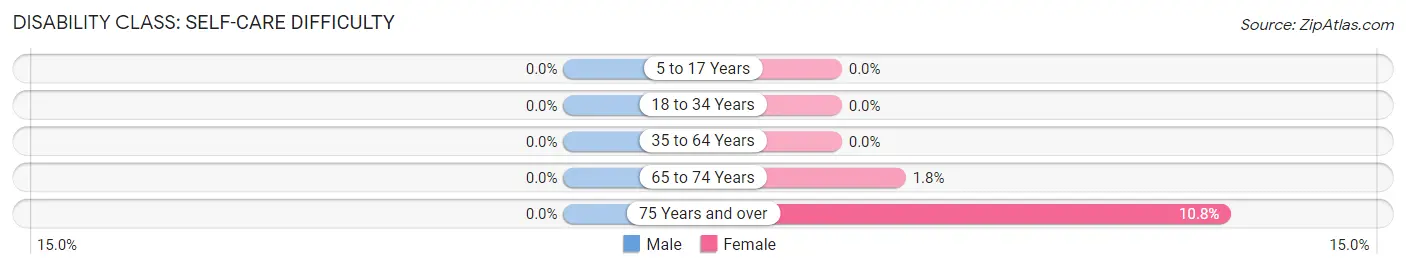
| Age Bracket | Male | Female |
| 5 to 17 Years | 0 (0.0%) | 0 (0.0%) |
| 18 to 34 Years | 0 (0.0%) | 0 (0.0%) |
| 35 to 64 Years | 0 (0.0%) | 0 (0.0%) |
| 65 to 74 Years | 0 (0.0%) | 8 (1.8%) |
| 75 Years and over | 0 (0.0%) | 63 (10.8%) |
Technology Access in East Dennis
Computing Device Access in East Dennis
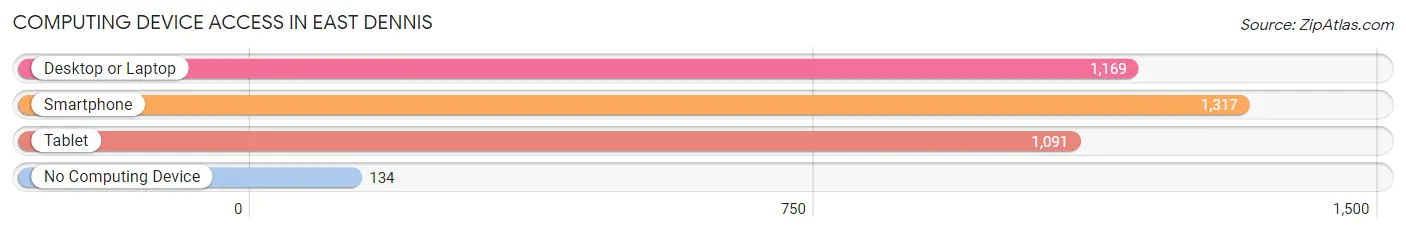
| Device Type | # Households | % Households |
| Desktop or Laptop | 1,169 | 73.9% |
| Smartphone | 1,317 | 83.2% |
| Tablet | 1,091 | 68.9% |
| No Computing Device | 134 | 8.5% |
| Total | 1,583 | 100.0% |
Internet Access in East Dennis
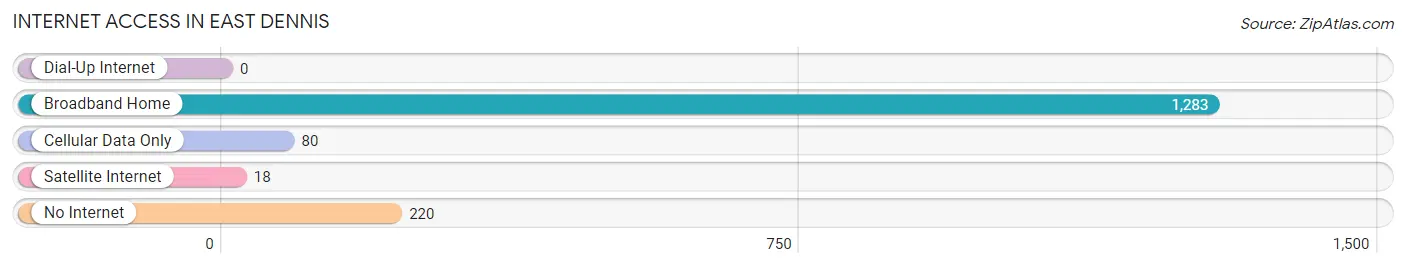
| Internet Type | # Households | % Households |
| Dial-Up Internet | 0 | 0.0% |
| Broadband Home | 1,283 | 81.0% |
| Cellular Data Only | 80 | 5.1% |
| Satellite Internet | 18 | 1.1% |
| No Internet | 220 | 13.9% |
| Total | 1,583 | 100.0% |
East Dennis Summary
Dennis is a town located in Barnstable County, Massachusetts, United States. The population was 14,207 at the 2010 census. The town encompasses five distinct villages, each of which has its own post office. These constituent villages are Dennis (including North Dennis), Dennis Port, East Dennis, South Dennis, and West Dennis.
History
Dennis was first settled in 1639 and was officially incorporated in 1793. The town was named after resident minister, Josiah Dennis. The town was originally part of the town of Yarmouth, and was known as the "eastern precinct". The town was officially incorporated in 1793.
Geography
Dennis is located in southeastern Massachusetts, bordered by the towns of Brewster to the north, Harwich to the east, Yarmouth to the south, and Barnstable to the west. The town is located on Cape Cod, and is approximately 25 miles south of the city of Plymouth.
The town is composed of five villages: Dennis, Dennis Port, East Dennis, South Dennis, and West Dennis. The villages are located along the shore of Cape Cod Bay and Nantucket Sound. The town is home to several beaches, including Corporation Beach, Mayflower Beach, and Chapin Beach.
Economy
The economy of Dennis is largely based on tourism. The town is home to several resorts and hotels, as well as numerous restaurants and shops. The town is also home to several marinas, which provide services to boaters and fishermen.
Demographics
As of the 2010 census, there were 14,207 people, 6,541 households, and 4,072 families residing in the town. The population density was 545.3 people per square mile (210.9/km2). There were 8,845 housing units at an average density of 339.3 per square mile (131.1/km2). The racial makeup of the town was 97.2% White, 0.7% African American, 0.2% Native American, 0.6% Asian, 0.1% Pacific Islander, 0.4% from other races, and 0.9% from two or more races. Hispanic or Latino of any race were 1.3% of the population.
There were 6,541 households, out of which 24.2% had children under the age of 18 living with them, 51.2% were married couples living together, 9.7% had a female householder with no husband present, and 35.2% were non-families. 28.7% of all households were made up of individuals, and 13.2% had someone living alone who was 65 years of age or older. The average household size was 2.17 and the average family size was 2.63.
In the town, the population was spread out, with 18.3% under the age of 18, 5.2% from 18 to 24, 24.2% from 25 to 44, 30.2% from 45 to 64, and 22.1% who were 65 years of age or older. The median age was 46 years. For every 100 females, there were 93.2 males. For every 100 females age 18 and over, there were 90.2 males.
The median income for a household in the town was $50,813, and the median income for a family was $60,945. Males had a median income of $41,890 versus $30,917 for females. The per capita income for the town was $27,945. About 4.2% of families and 6.3% of the population were below the poverty line, including 8.2% of those under age 18 and 4.7% of those age 65 or over.
Common Questions
What is Per Capita Income in East Dennis?
Per Capita income in East Dennis is $51,815.
What is the Median Family Income in East Dennis?
Median Family Income in East Dennis is $125,927.
What is the Median Household income in East Dennis?
Median Household Income in East Dennis is $85,321.
What is Income or Wage Gap in East Dennis?
Income or Wage Gap in East Dennis is 45.6%.
Women in East Dennis earn 54.4 cents for every dollar earned by a man.
What is Inequality or Gini Index in East Dennis?
Inequality or Gini Index in East Dennis is 0.44.
What is the Total Population of East Dennis?
Total Population of East Dennis is 3,711.
What is the Total Male Population of East Dennis?
Total Male Population of East Dennis is 1,629.
What is the Total Female Population of East Dennis?
Total Female Population of East Dennis is 2,082.
What is the Ratio of Males per 100 Females in East Dennis?
There are 78.24 Males per 100 Females in East Dennis.
What is the Ratio of Females per 100 Males in East Dennis?
There are 127.81 Females per 100 Males in East Dennis.
What is the Median Population Age in East Dennis?
Median Population Age in East Dennis is 63.0 Years.
What is the Average Family Size in East Dennis
Average Family Size in East Dennis is 2.9 People.
What is the Average Household Size in East Dennis
Average Household Size in East Dennis is 2.3 People.
How Large is the Labor Force in East Dennis?
There are 1,782 People in the Labor Forcein in East Dennis.
What is the Percentage of People in the Labor Force in East Dennis?
51.4% of People are in the Labor Force in East Dennis.
What is the Unemployment Rate in East Dennis?
Unemployment Rate in East Dennis is 4.9%.