Brookfield, MA Map & Demographics
Brookfield Map
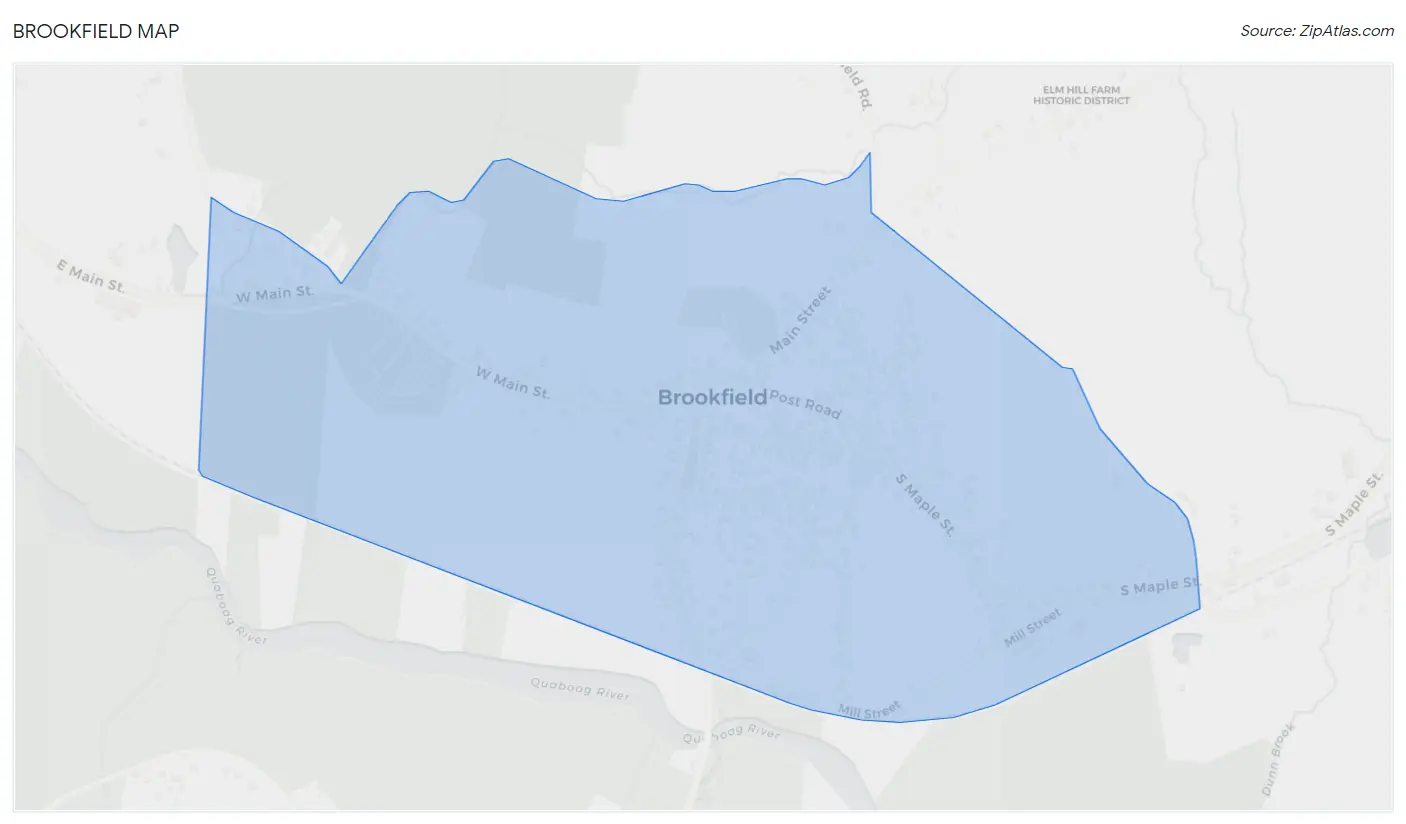
Brookfield Overview
$31,394
PER CAPITA INCOME
$98,750
AVG FAMILY INCOME
$68,299
AVG HOUSEHOLD INCOME
25.6%
WAGE / INCOME GAP [ % ]
74.4¢/ $1
WAGE / INCOME GAP [ $ ]
0.40
INEQUALITY / GINI INDEX
948
TOTAL POPULATION
461
MALE POPULATION
487
FEMALE POPULATION
94.66
MALES / 100 FEMALES
105.64
FEMALES / 100 MALES
38.0
MEDIAN AGE
3.6
AVG FAMILY SIZE
2.4
AVG HOUSEHOLD SIZE
583
LABOR FORCE [ PEOPLE ]
78.3%
PERCENT IN LABOR FORCE
2.7%
UNEMPLOYMENT RATE
Brookfield Zip Codes
Brookfield Area Codes
Income in Brookfield
Income Overview in Brookfield
Per Capita Income in Brookfield is $31,394, while median incomes of families and households are $98,750 and $68,299 respectively.
| Characteristic | Number | Measure |
| Per Capita Income | 948 | $31,394 |
| Median Family Income | 176 | $98,750 |
| Mean Family Income | 176 | $104,611 |
| Median Household Income | 391 | $68,299 |
| Mean Household Income | 391 | $74,274 |
| Income Deficit | 176 | $0 |
| Wage / Income Gap (%) | 948 | 25.61% |
| Wage / Income Gap ($) | 948 | 74.39¢ per $1 |
| Gini / Inequality Index | 948 | 0.40 |
Earnings by Sex in Brookfield
Average Earnings in Brookfield are $46,444, $36,563 for men and $49,148 for women, a difference of 25.6%.
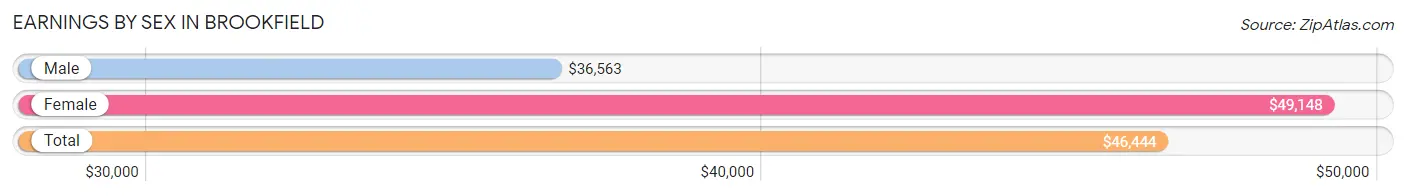
| Sex | Number | Average Earnings |
| Male | 348 (57.1%) | $36,563 |
| Female | 262 (42.9%) | $49,148 |
| Total | 610 (100.0%) | $46,444 |
Earnings by Sex by Income Bracket in Brookfield
The most common earnings brackets in Brookfield are $75,000 to $99,999 for men (84 | 24.1%) and $75,000 to $99,999 for women (45 | 17.2%).
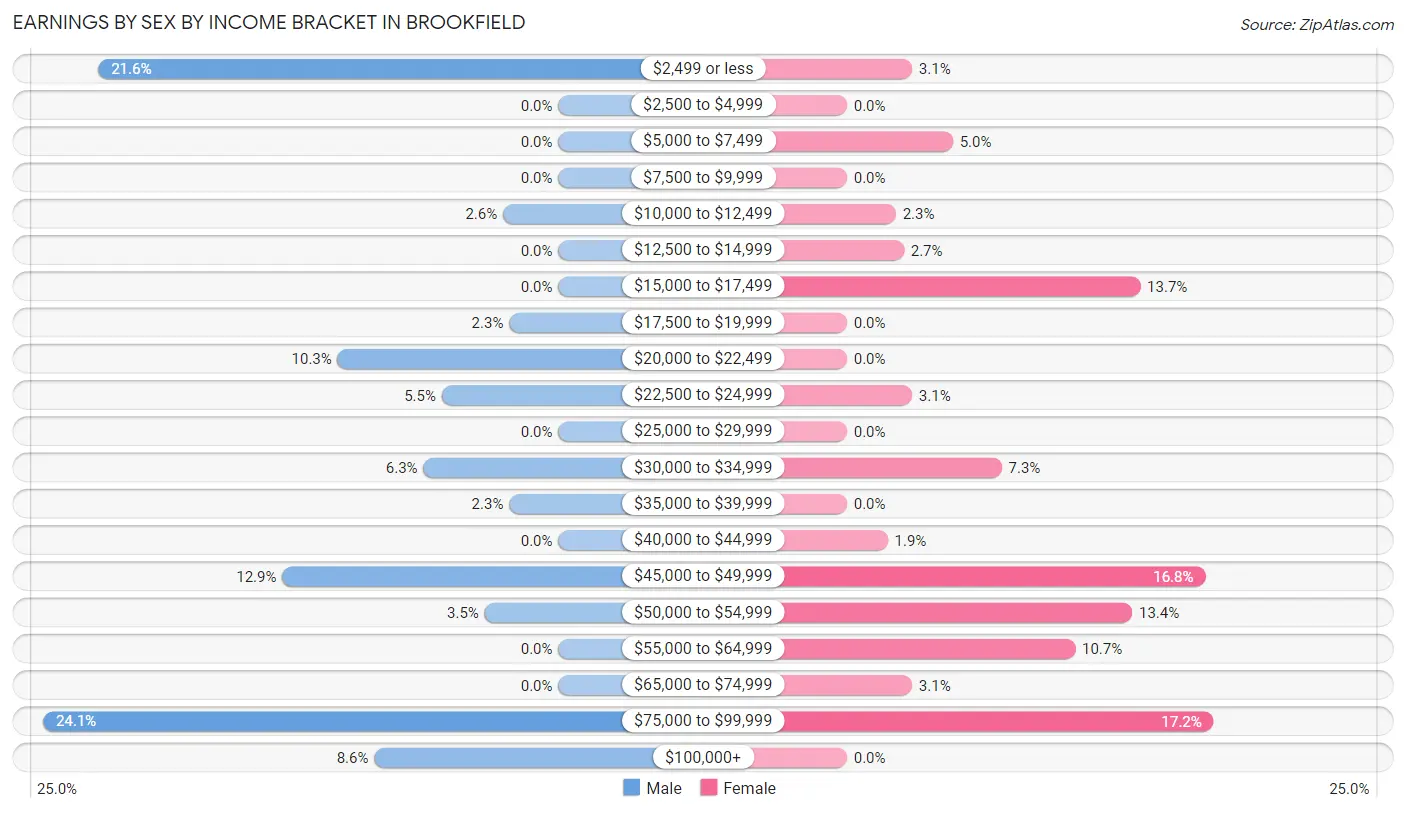
| Income | Male | Female |
| $2,499 or less | 75 (21.5%) | 8 (3.0%) |
| $2,500 to $4,999 | 0 (0.0%) | 0 (0.0%) |
| $5,000 to $7,499 | 0 (0.0%) | 13 (5.0%) |
| $7,500 to $9,999 | 0 (0.0%) | 0 (0.0%) |
| $10,000 to $12,499 | 9 (2.6%) | 6 (2.3%) |
| $12,500 to $14,999 | 0 (0.0%) | 7 (2.7%) |
| $15,000 to $17,499 | 0 (0.0%) | 36 (13.7%) |
| $17,500 to $19,999 | 8 (2.3%) | 0 (0.0%) |
| $20,000 to $22,499 | 36 (10.3%) | 0 (0.0%) |
| $22,500 to $24,999 | 19 (5.5%) | 8 (3.0%) |
| $25,000 to $29,999 | 0 (0.0%) | 0 (0.0%) |
| $30,000 to $34,999 | 22 (6.3%) | 19 (7.2%) |
| $35,000 to $39,999 | 8 (2.3%) | 0 (0.0%) |
| $40,000 to $44,999 | 0 (0.0%) | 5 (1.9%) |
| $45,000 to $49,999 | 45 (12.9%) | 44 (16.8%) |
| $50,000 to $54,999 | 12 (3.5%) | 35 (13.4%) |
| $55,000 to $64,999 | 0 (0.0%) | 28 (10.7%) |
| $65,000 to $74,999 | 0 (0.0%) | 8 (3.0%) |
| $75,000 to $99,999 | 84 (24.1%) | 45 (17.2%) |
| $100,000+ | 30 (8.6%) | 0 (0.0%) |
| Total | 348 (100.0%) | 262 (100.0%) |
Earnings by Sex by Educational Attainment in Brookfield
Average earnings in Brookfield are $45,833 for men and $53,286 for women, a difference of 14.0%. Men with an educational attainment of high school diploma enjoy the highest average annual earnings of $45,034, while those with high school diploma education earn the least with $45,034. Women with an educational attainment of college or associate's degree earn the most with the average annual earnings of $63,036, while those with college or associate's degree education have the smallest earnings of $63,036.
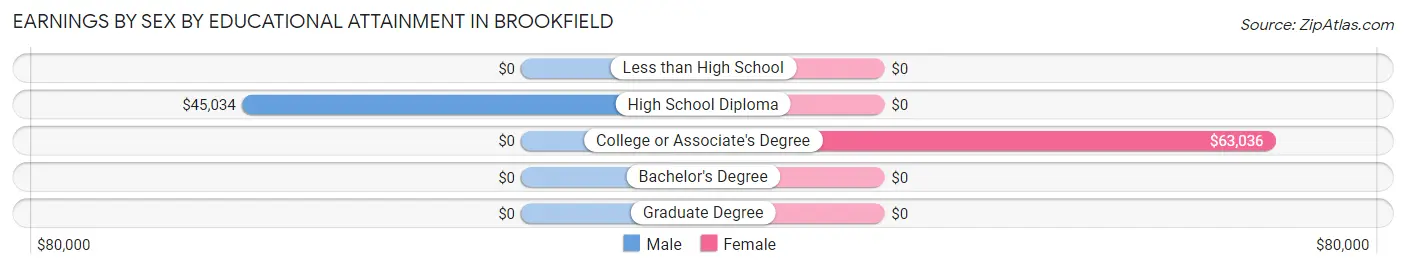
| Educational Attainment | Male Income | Female Income |
| Less than High School | - | - |
| High School Diploma | $45,034 | $0 |
| College or Associate's Degree | - | - |
| Bachelor's Degree | - | - |
| Graduate Degree | - | - |
| Total | $45,833 | $53,286 |
Family Income in Brookfield
Family Income Brackets in Brookfield
According to the Brookfield family income data, there are 56 families falling into the $100,000 to $149,999 income range, which is the most common income bracket and makes up 31.8% of all families.
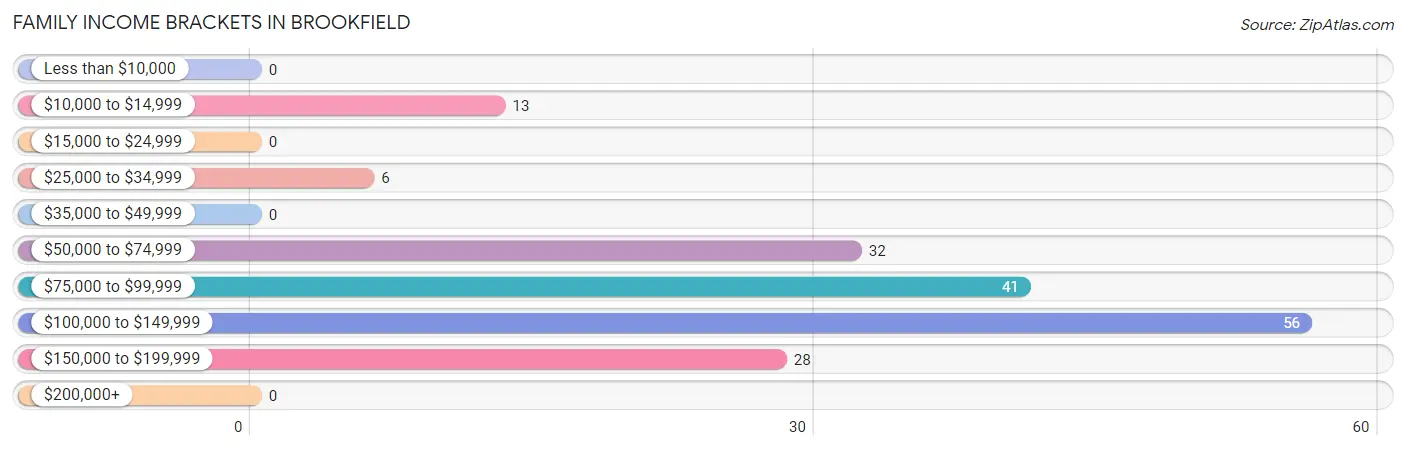
| Income Bracket | # Families | % Families |
| Less than $10,000 | 0 | 0.0% |
| $10,000 to $14,999 | 13 | 7.4% |
| $15,000 to $24,999 | 0 | 0.0% |
| $25,000 to $34,999 | 6 | 3.4% |
| $35,000 to $49,999 | 0 | 0.0% |
| $50,000 to $74,999 | 32 | 18.2% |
| $75,000 to $99,999 | 41 | 23.3% |
| $100,000 to $149,999 | 56 | 31.8% |
| $150,000 to $199,999 | 28 | 15.9% |
| $200,000+ | 0 | 0.0% |
Family Income by Famaliy Size in Brookfield
3-person families (57 | 32.4%) account for the highest median family income in Brookfield with $142,904 per family, while 3-person families (57 | 32.4%) have the highest median income of $47,635 per family member.
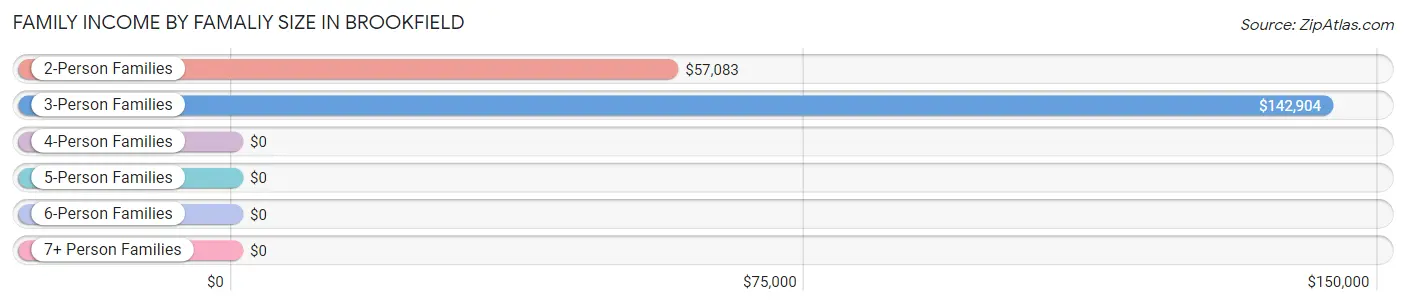
| Income Bracket | # Families | Median Income |
| 2-Person Families | 72 (40.9%) | $57,083 |
| 3-Person Families | 57 (32.4%) | $142,904 |
| 4-Person Families | 8 (4.5%) | $0 |
| 5-Person Families | 28 (15.9%) | $0 |
| 6-Person Families | 5 (2.8%) | $0 |
| 7+ Person Families | 6 (3.4%) | $0 |
| Total | 176 (100.0%) | $98,750 |
Family Income by Number of Earners in Brookfield
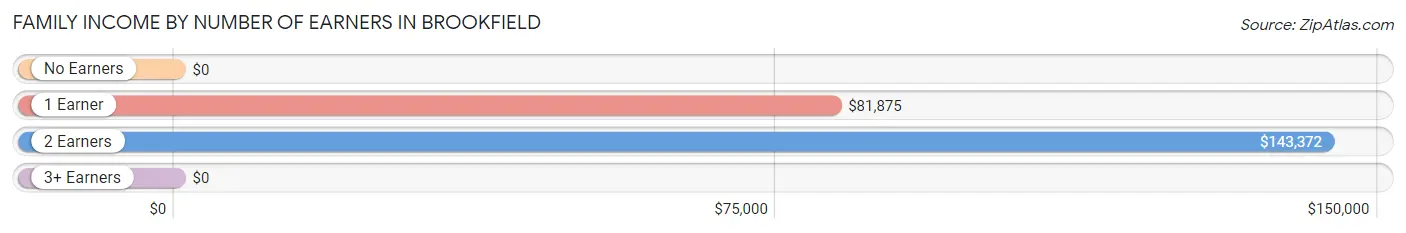
| Number of Earners | # Families | Median Income |
| No Earners | 26 (14.8%) | $0 |
| 1 Earner | 27 (15.3%) | $81,875 |
| 2 Earners | 112 (63.6%) | $143,372 |
| 3+ Earners | 11 (6.2%) | $0 |
| Total | 176 (100.0%) | $98,750 |
Household Income in Brookfield
Household Income Brackets in Brookfield
With 105 households falling in the category, the $50,000 to $74,999 income range is the most frequent in Brookfield, accounting for 26.9% of all households.
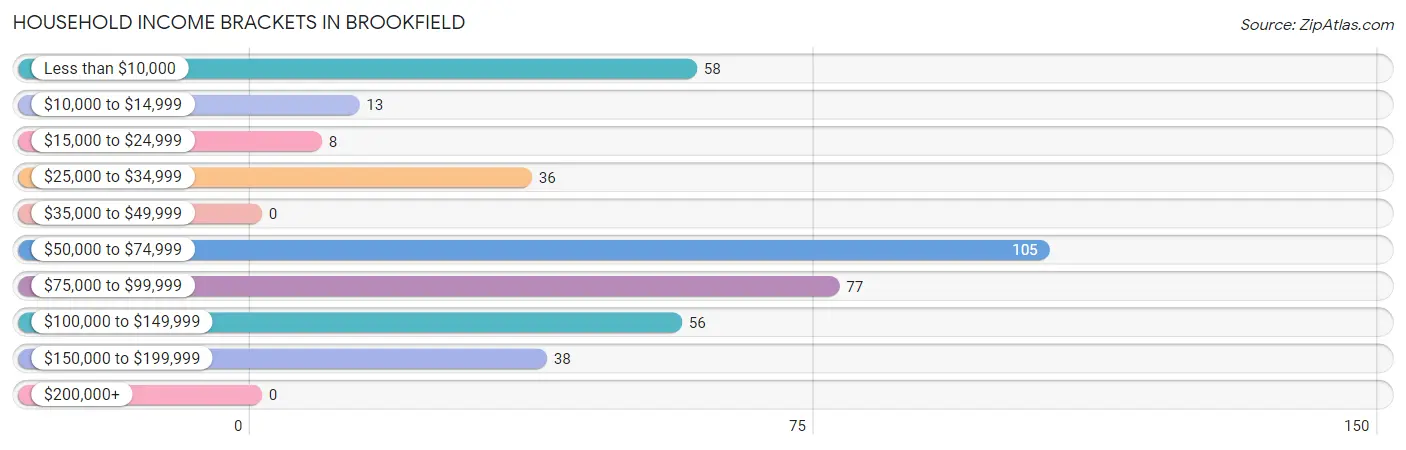
| Income Bracket | # Households | % Households |
| Less than $10,000 | 58 | 14.8% |
| $10,000 to $14,999 | 13 | 3.3% |
| $15,000 to $24,999 | 8 | 2.0% |
| $25,000 to $34,999 | 36 | 9.2% |
| $35,000 to $49,999 | 0 | 0.0% |
| $50,000 to $74,999 | 105 | 26.9% |
| $75,000 to $99,999 | 77 | 19.7% |
| $100,000 to $149,999 | 56 | 14.3% |
| $150,000 to $199,999 | 38 | 9.7% |
| $200,000+ | 0 | 0.0% |
Household Income by Householder Age in Brookfield
The median household income in Brookfield is $68,299, with the highest median household income of $142,537 found in the 25 to 44 years age bracket for the primary householder. A total of 143 households (36.6%) fall into this category. Meanwhile, the 15 to 24 years age bracket for the primary householder has the lowest median household income of $0, with 36 households (9.2%) in this group.
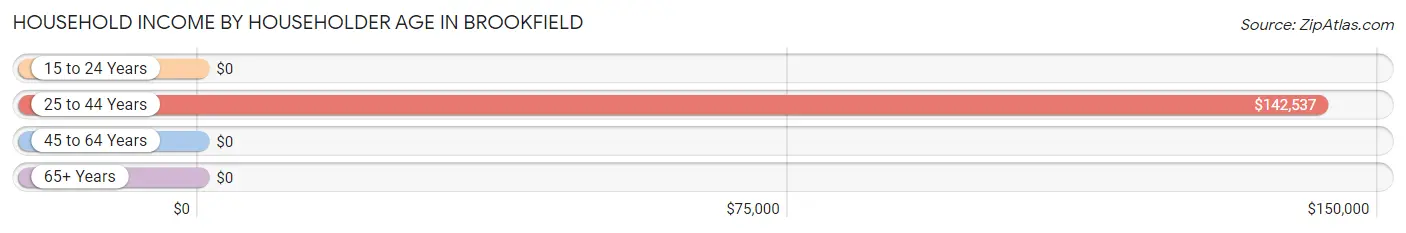
| Income Bracket | # Households | Median Income |
| 15 to 24 Years | 36 (9.2%) | $0 |
| 25 to 44 Years | 143 (36.6%) | $142,537 |
| 45 to 64 Years | 142 (36.3%) | $0 |
| 65+ Years | 70 (17.9%) | $0 |
| Total | 391 (100.0%) | $68,299 |
Poverty in Brookfield
Income Below Poverty by Sex and Age in Brookfield
With 17.8% poverty level for males and 3.9% for females among the residents of Brookfield, 45 to 54 year old males and 65 to 74 year old females are the most vulnerable to poverty, with 58 males (62.4%) and 13 females (29.5%) in their respective age groups living below the poverty level.
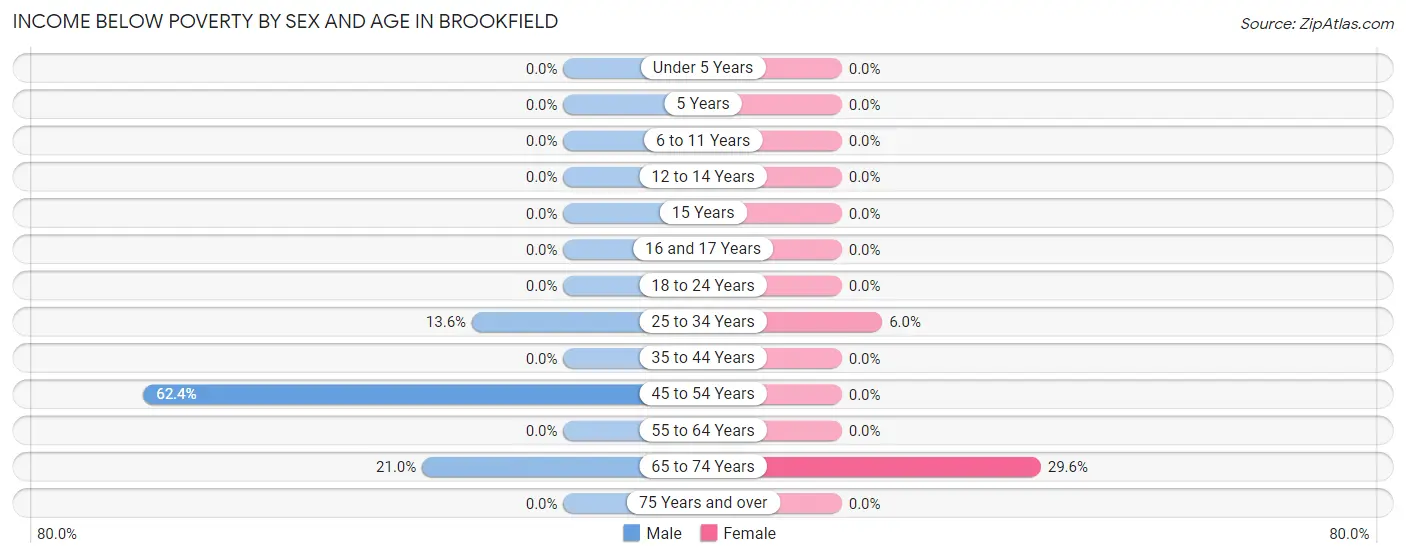
| Age Bracket | Male | Female |
| Under 5 Years | 0 (0.0%) | 0 (0.0%) |
| 5 Years | 0 (0.0%) | 0 (0.0%) |
| 6 to 11 Years | 0 (0.0%) | 0 (0.0%) |
| 12 to 14 Years | 0 (0.0%) | 0 (0.0%) |
| 15 Years | 0 (0.0%) | 0 (0.0%) |
| 16 and 17 Years | 0 (0.0%) | 0 (0.0%) |
| 18 to 24 Years | 0 (0.0%) | 0 (0.0%) |
| 25 to 34 Years | 11 (13.6%) | 6 (6.0%) |
| 35 to 44 Years | 0 (0.0%) | 0 (0.0%) |
| 45 to 54 Years | 58 (62.4%) | 0 (0.0%) |
| 55 to 64 Years | 0 (0.0%) | 0 (0.0%) |
| 65 to 74 Years | 13 (21.0%) | 13 (29.5%) |
| 75 Years and over | 0 (0.0%) | 0 (0.0%) |
| Total | 82 (17.8%) | 19 (3.9%) |
Income Above Poverty by Sex and Age in Brookfield
According to the poverty statistics in Brookfield, males aged under 5 years and females aged under 5 years are the age groups that are most secure financially, with 100.0% of males and 100.0% of females in these age groups living above the poverty line.
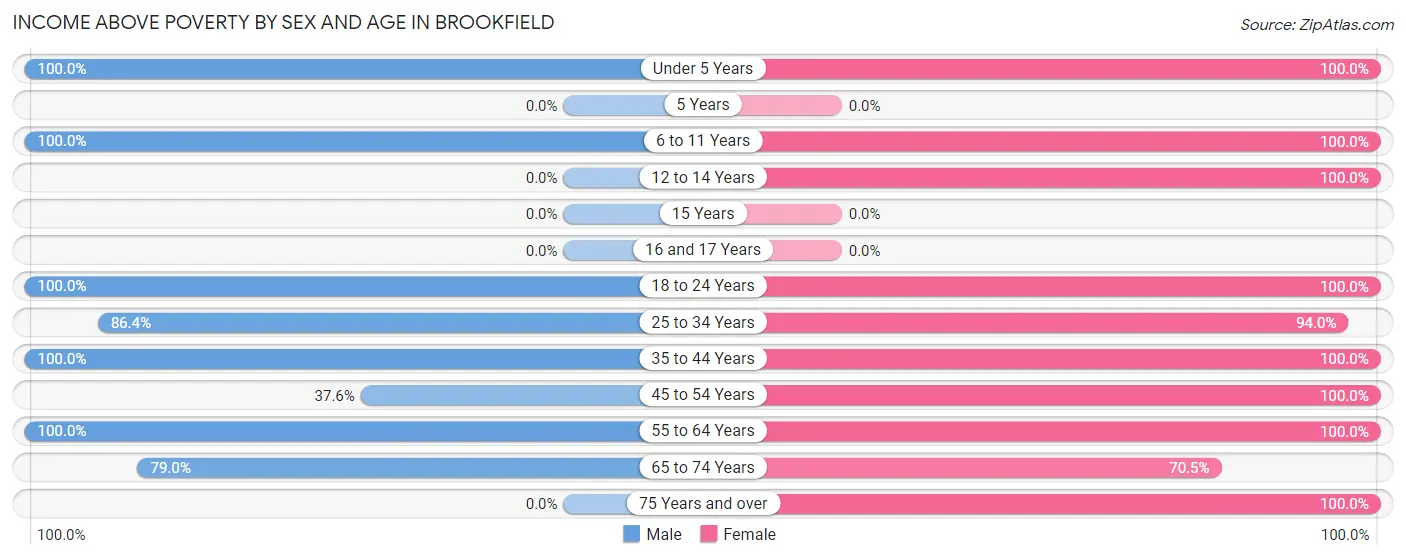
| Age Bracket | Male | Female |
| Under 5 Years | 13 (100.0%) | 36 (100.0%) |
| 5 Years | 0 (0.0%) | 0 (0.0%) |
| 6 to 11 Years | 65 (100.0%) | 53 (100.0%) |
| 12 to 14 Years | 0 (0.0%) | 36 (100.0%) |
| 15 Years | 0 (0.0%) | 0 (0.0%) |
| 16 and 17 Years | 0 (0.0%) | 0 (0.0%) |
| 18 to 24 Years | 36 (100.0%) | 52 (100.0%) |
| 25 to 34 Years | 70 (86.4%) | 94 (94.0%) |
| 35 to 44 Years | 83 (100.0%) | 42 (100.0%) |
| 45 to 54 Years | 35 (37.6%) | 59 (100.0%) |
| 55 to 64 Years | 28 (100.0%) | 20 (100.0%) |
| 65 to 74 Years | 49 (79.0%) | 31 (70.5%) |
| 75 Years and over | 0 (0.0%) | 45 (100.0%) |
| Total | 379 (82.2%) | 468 (96.1%) |
Income Below Poverty Among Married-Couple Families in Brookfield
The poverty statistics for married-couple families in Brookfield show that 8.8% or 13 of the total 148 families live below the poverty line. Families with no children have the highest poverty rate of 19.4%, comprising of 13 families. On the other hand, families with 1 or 2 children have the lowest poverty rate of 0.0%, which includes 0 families.
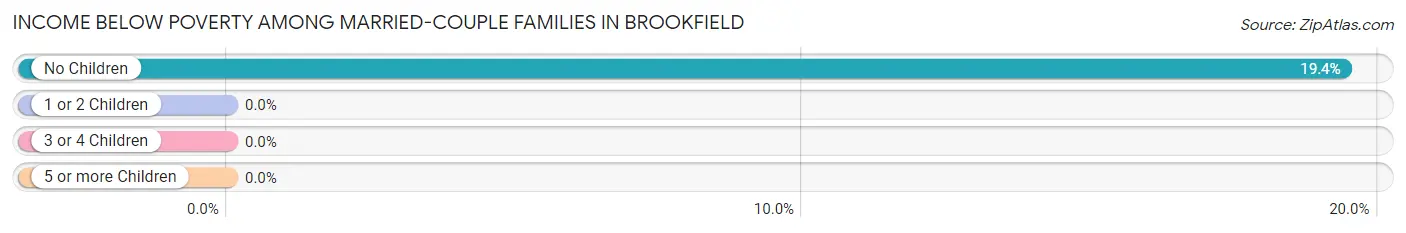
| Children | Above Poverty | Below Poverty |
| No Children | 54 (80.6%) | 13 (19.4%) |
| 1 or 2 Children | 53 (100.0%) | 0 (0.0%) |
| 3 or 4 Children | 28 (100.0%) | 0 (0.0%) |
| 5 or more Children | 0 (0.0%) | 0 (0.0%) |
| Total | 135 (91.2%) | 13 (8.8%) |
Income Below Poverty Among Single-Parent Households in Brookfield
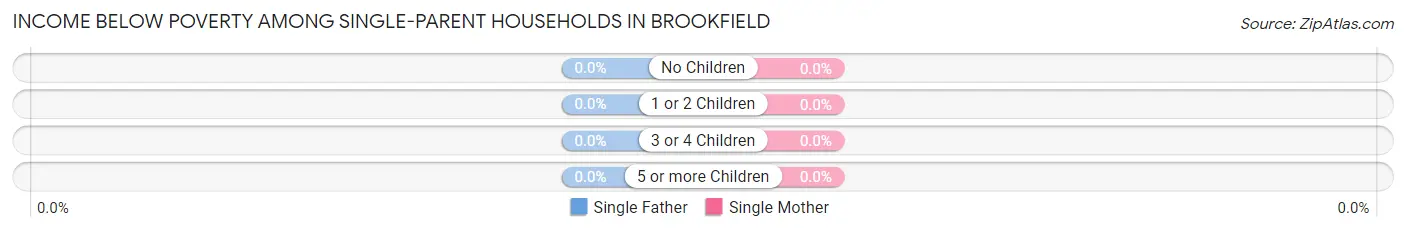
| Children | Single Father | Single Mother |
| No Children | 0 (0.0%) | 0 (0.0%) |
| 1 or 2 Children | 0 (0.0%) | 0 (0.0%) |
| 3 or 4 Children | 0 (0.0%) | 0 (0.0%) |
| 5 or more Children | 0 (0.0%) | 0 (0.0%) |
| Total | 0 (0.0%) | 0 (0.0%) |
Income Below Poverty Among Married-Couple vs Single-Parent Households in Brookfield
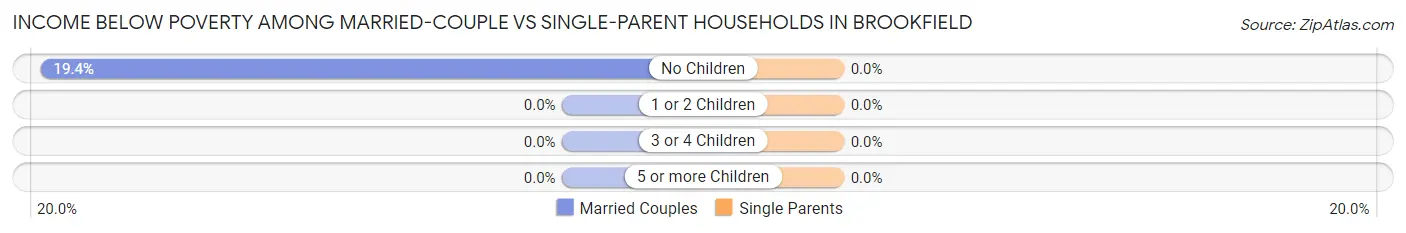
| Children | Married-Couple Families | Single-Parent Households |
| No Children | 13 (19.4%) | 0 (0.0%) |
| 1 or 2 Children | 0 (0.0%) | 0 (0.0%) |
| 3 or 4 Children | 0 (0.0%) | 0 (0.0%) |
| 5 or more Children | 0 (0.0%) | 0 (0.0%) |
| Total | 13 (8.8%) | 0 (0.0%) |
Race in Brookfield
The most populous races in Brookfield are White / Caucasian (847 | 89.3%), Some other Race (93 | 9.8%), and Hispanic or Latino (34 | 3.6%).
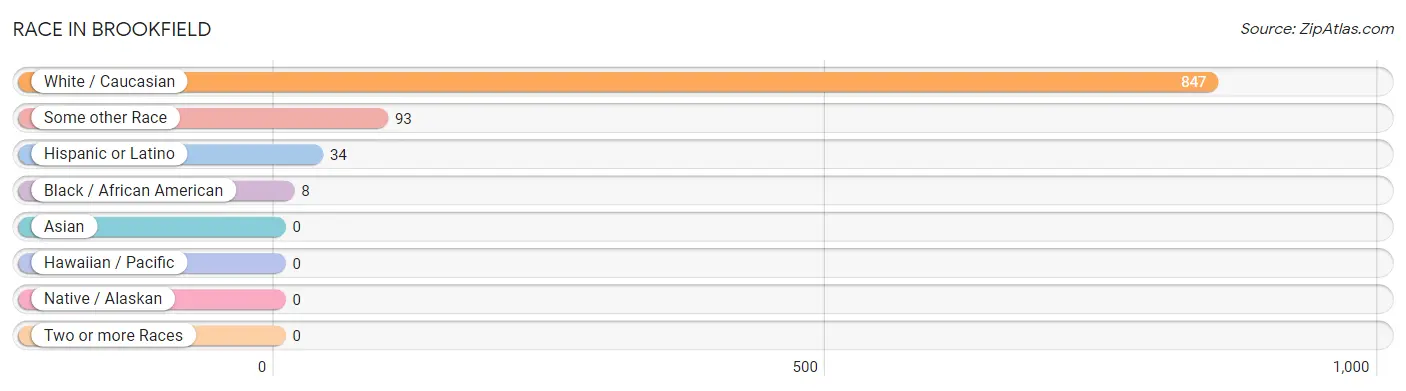
| Race | # Population | % Population |
| Asian | 0 | 0.0% |
| Black / African American | 8 | 0.8% |
| Hawaiian / Pacific | 0 | 0.0% |
| Hispanic or Latino | 34 | 3.6% |
| Native / Alaskan | 0 | 0.0% |
| White / Caucasian | 847 | 89.3% |
| Two or more Races | 0 | 0.0% |
| Some other Race | 93 | 9.8% |
| Total | 948 | 100.0% |
Ancestry in Brookfield
The most populous ancestries reported in Brookfield are American (479 | 50.5%), English (79 | 8.3%), Irish (68 | 7.2%), French (59 | 6.2%), and Italian (47 | 5.0%), together accounting for 77.2% of all Brookfield residents.
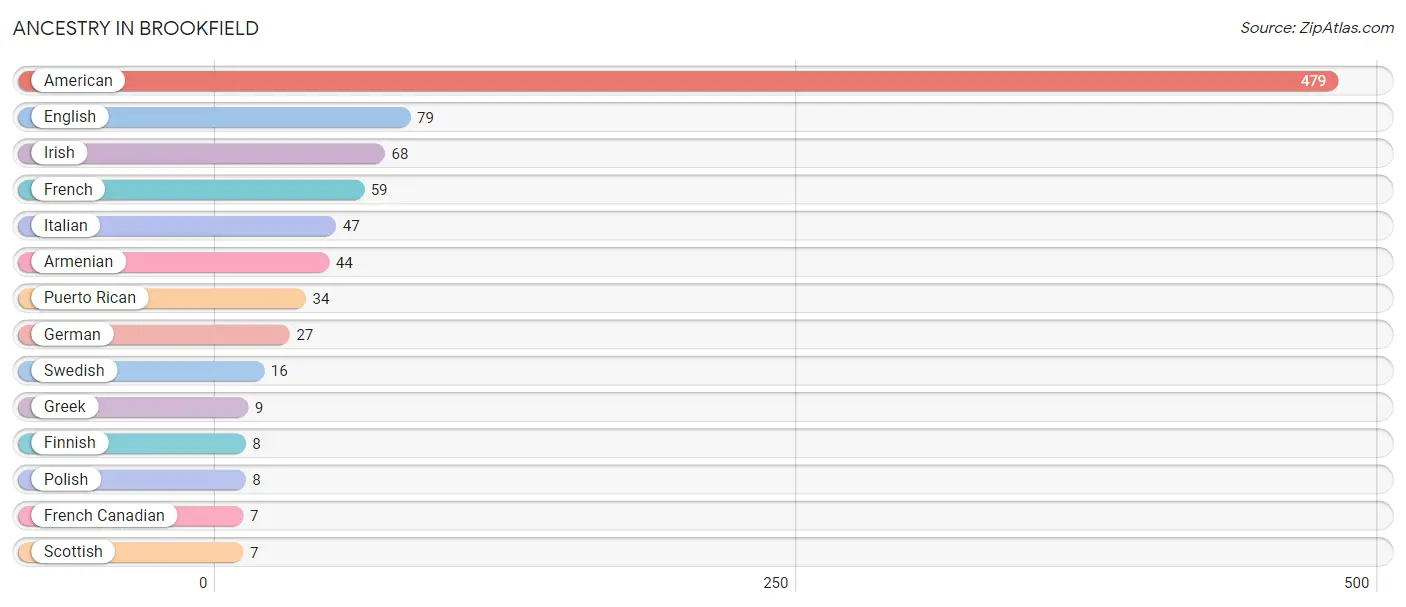
| Ancestry | # Population | % Population |
| American | 479 | 50.5% |
| Armenian | 44 | 4.6% |
| English | 79 | 8.3% |
| Finnish | 8 | 0.8% |
| French | 59 | 6.2% |
| French Canadian | 7 | 0.7% |
| German | 27 | 2.9% |
| Greek | 9 | 0.9% |
| Irish | 68 | 7.2% |
| Italian | 47 | 5.0% |
| Polish | 8 | 0.8% |
| Puerto Rican | 34 | 3.6% |
| Scottish | 7 | 0.7% |
| Swedish | 16 | 1.7% | View All 14 Rows |
Immigrants in Brookfield

| Immigration Origin | # Population | % Population | View All 0 Rows |
Sex and Age in Brookfield
Sex and Age in Brookfield
The most populous age groups in Brookfield are 50 to 54 Years (81 | 17.6%) for men and 10 to 14 Years (65 | 13.4%) for women.
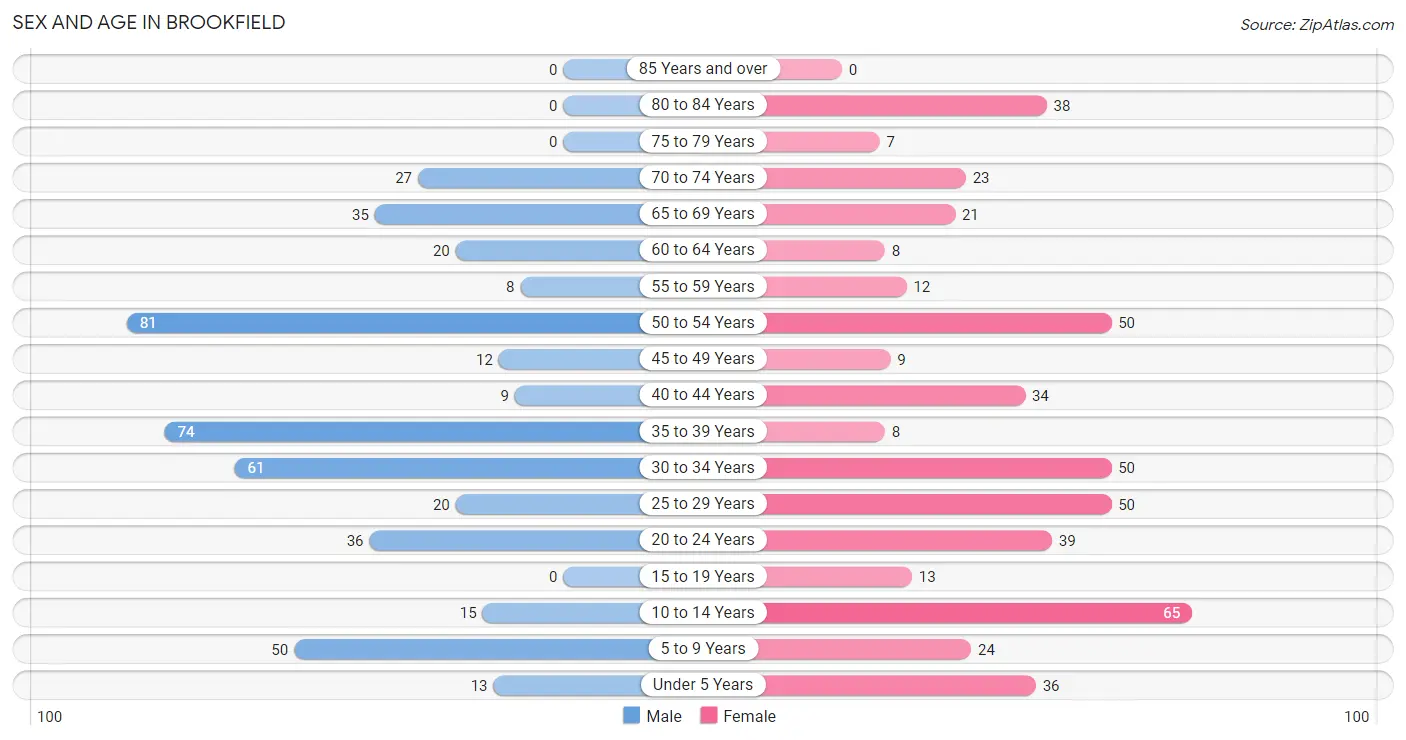
| Age Bracket | Male | Female |
| Under 5 Years | 13 (2.8%) | 36 (7.4%) |
| 5 to 9 Years | 50 (10.8%) | 24 (4.9%) |
| 10 to 14 Years | 15 (3.3%) | 65 (13.4%) |
| 15 to 19 Years | 0 (0.0%) | 13 (2.7%) |
| 20 to 24 Years | 36 (7.8%) | 39 (8.0%) |
| 25 to 29 Years | 20 (4.3%) | 50 (10.3%) |
| 30 to 34 Years | 61 (13.2%) | 50 (10.3%) |
| 35 to 39 Years | 74 (16.1%) | 8 (1.6%) |
| 40 to 44 Years | 9 (1.9%) | 34 (7.0%) |
| 45 to 49 Years | 12 (2.6%) | 9 (1.8%) |
| 50 to 54 Years | 81 (17.6%) | 50 (10.3%) |
| 55 to 59 Years | 8 (1.7%) | 12 (2.5%) |
| 60 to 64 Years | 20 (4.3%) | 8 (1.6%) |
| 65 to 69 Years | 35 (7.6%) | 21 (4.3%) |
| 70 to 74 Years | 27 (5.9%) | 23 (4.7%) |
| 75 to 79 Years | 0 (0.0%) | 7 (1.4%) |
| 80 to 84 Years | 0 (0.0%) | 38 (7.8%) |
| 85 Years and over | 0 (0.0%) | 0 (0.0%) |
| Total | 461 (100.0%) | 487 (100.0%) |
Families and Households in Brookfield
Median Family Size in Brookfield
The median family size in Brookfield is 3.57 persons per family, with married-couple families (148 | 84.1%) accounting for the largest median family size of 3.72 persons per family. On the other hand, single male/father families (12 | 6.8%) represent the smallest median family size with 2.08 persons per family.
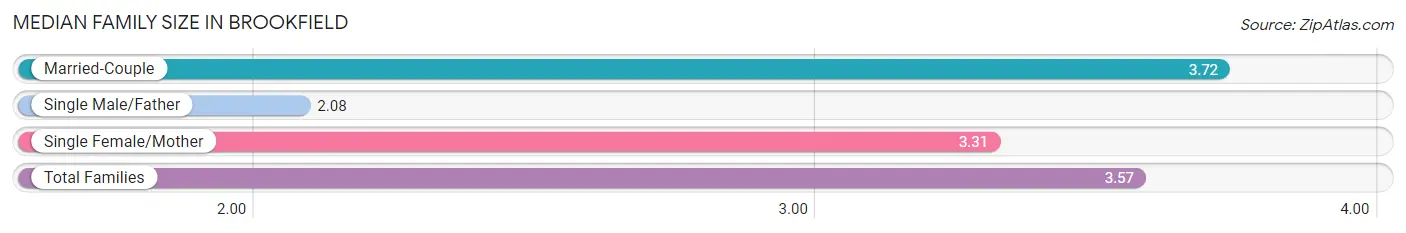
| Family Type | # Families | Family Size |
| Married-Couple | 148 (84.1%) | 3.72 |
| Single Male/Father | 12 (6.8%) | 2.08 |
| Single Female/Mother | 16 (9.1%) | 3.31 |
| Total Families | 176 (100.0%) | 3.57 |
Median Household Size in Brookfield
The median household size in Brookfield is 2.42 persons per household, with single female/mother households (16 | 4.1%) accounting for the largest median household size of 4.06 persons per household. non-family households (215 | 55.0%) represent the smallest median household size with 1.35 persons per household.
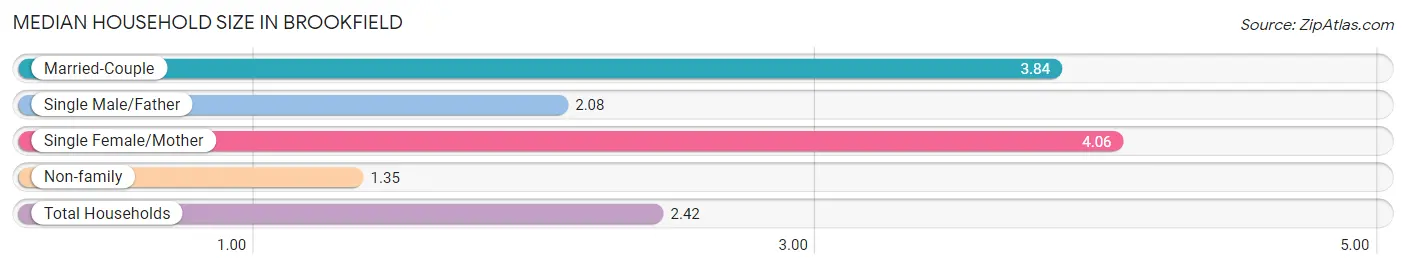
| Household Type | # Households | Household Size |
| Married-Couple | 148 (37.9%) | 3.84 |
| Single Male/Father | 12 (3.1%) | 2.08 |
| Single Female/Mother | 16 (4.1%) | 4.06 |
| Non-family | 215 (55.0%) | 1.35 |
| Total Households | 391 (100.0%) | 2.42 |
Household Size by Marriage Status in Brookfield
Out of a total of 391 households in Brookfield, 176 (45.0%) are family households, while 215 (55.0%) are nonfamily households. The most numerous type of family households are 2-person households, comprising 72, and the most common type of nonfamily households are 1-person households, comprising 142.
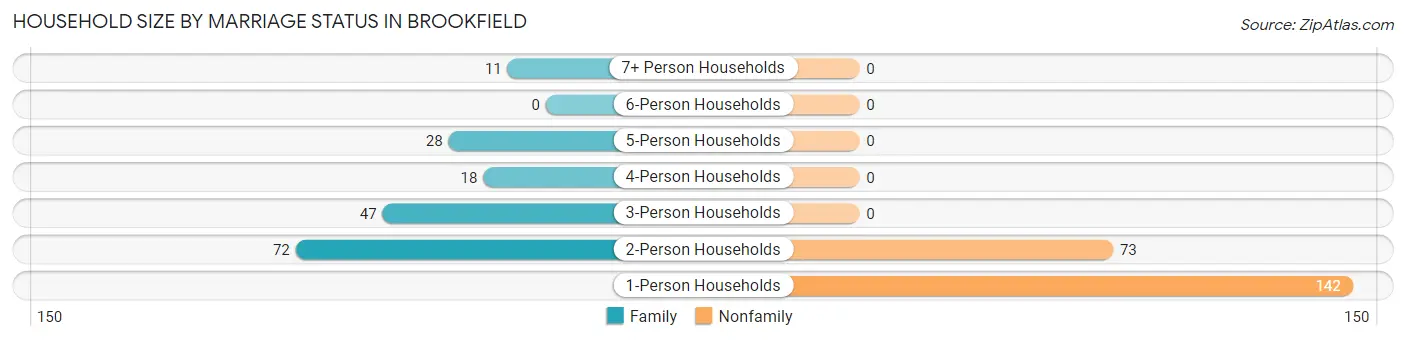
| Household Size | Family Households | Nonfamily Households |
| 1-Person Households | - | 142 (36.3%) |
| 2-Person Households | 72 (18.4%) | 73 (18.7%) |
| 3-Person Households | 47 (12.0%) | 0 (0.0%) |
| 4-Person Households | 18 (4.6%) | 0 (0.0%) |
| 5-Person Households | 28 (7.2%) | 0 (0.0%) |
| 6-Person Households | 0 (0.0%) | 0 (0.0%) |
| 7+ Person Households | 11 (2.8%) | 0 (0.0%) |
| Total | 176 (45.0%) | 215 (55.0%) |
Female Fertility in Brookfield
Fertility by Age in Brookfield
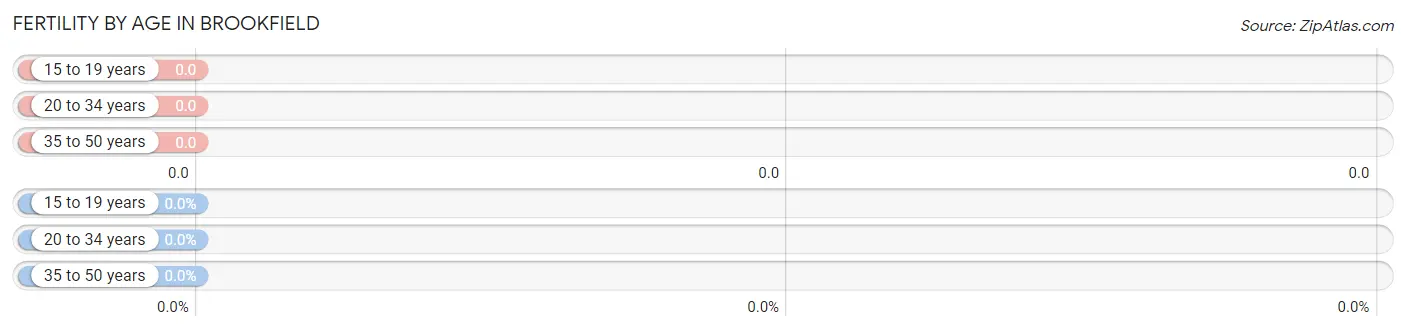
| Age Bracket | Women with Births | Births / 1,000 Women |
| 15 to 19 years | 0 (0.0%) | 0.0 |
| 20 to 34 years | 0 (0.0%) | 0.0 |
| 35 to 50 years | 0 (0.0%) | 0.0 |
| Total | 0 (0.0%) | 0.0 |
Fertility by Age by Marriage Status in Brookfield
| Age Bracket | Married | Unmarried |
| 15 to 19 years | 0 (0.0%) | 0 (0.0%) |
| 20 to 34 years | 0 (0.0%) | 0 (0.0%) |
| 35 to 50 years | 0 (0.0%) | 0 (0.0%) |
| Total | 0 (0.0%) | 0 (0.0%) |
Fertility by Education in Brookfield
| Educational Attainment | Women with Births | Births / 1,000 Women |
| Less than High School | 0 (0.0%) | 0.0 |
| High School Diploma | 0 (0.0%) | 0.0 |
| College or Associate's Degree | 0 (0.0%) | 0.0 |
| Bachelor's Degree | 0 (0.0%) | 0.0 |
| Graduate Degree | 0 (0.0%) | 0.0 |
| Total | 0 (0.0%) | 0.0 |
Fertility by Education by Marriage Status in Brookfield
| Educational Attainment | Married | Unmarried |
| Less than High School | 0 (0.0%) | 0 (0.0%) |
| High School Diploma | 0 (0.0%) | 0 (0.0%) |
| College or Associate's Degree | 0 (0.0%) | 0 (0.0%) |
| Bachelor's Degree | 0 (0.0%) | 0 (0.0%) |
| Graduate Degree | 0 (0.0%) | 0 (0.0%) |
| Total | 0 (0.0%) | 0 (0.0%) |
Employment Characteristics in Brookfield
Employment by Class of Employer in Brookfield
Among the 545 employed individuals in Brookfield, private company employees (408 | 74.9%), not-for-profit organizations (63 | 11.6%), and self-employed (not incorporated) (58 | 10.6%) make up the most common classes of employment.
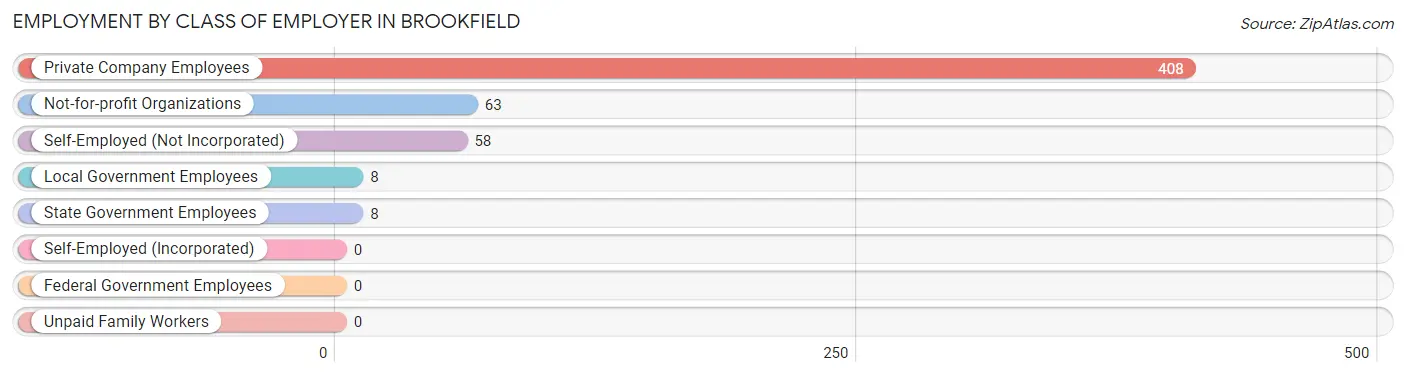
| Employer Class | # Employees | % Employees |
| Private Company Employees | 408 | 74.9% |
| Self-Employed (Incorporated) | 0 | 0.0% |
| Self-Employed (Not Incorporated) | 58 | 10.6% |
| Not-for-profit Organizations | 63 | 11.6% |
| Local Government Employees | 8 | 1.5% |
| State Government Employees | 8 | 1.5% |
| Federal Government Employees | 0 | 0.0% |
| Unpaid Family Workers | 0 | 0.0% |
| Total | 545 | 100.0% |
Employment Status by Age in Brookfield
According to the labor force statistics for Brookfield, out of the total population over 16 years of age (745), 78.3% or 583 individuals are in the labor force, with 2.7% or 16 of them unemployed. The age group with the highest labor force participation rate is 20 to 24 years, with 100.0% or 75 individuals in the labor force. Within the labor force, the 25 to 29 years age range has the highest percentage of unemployed individuals, with 17.7% or 11 of them being unemployed.
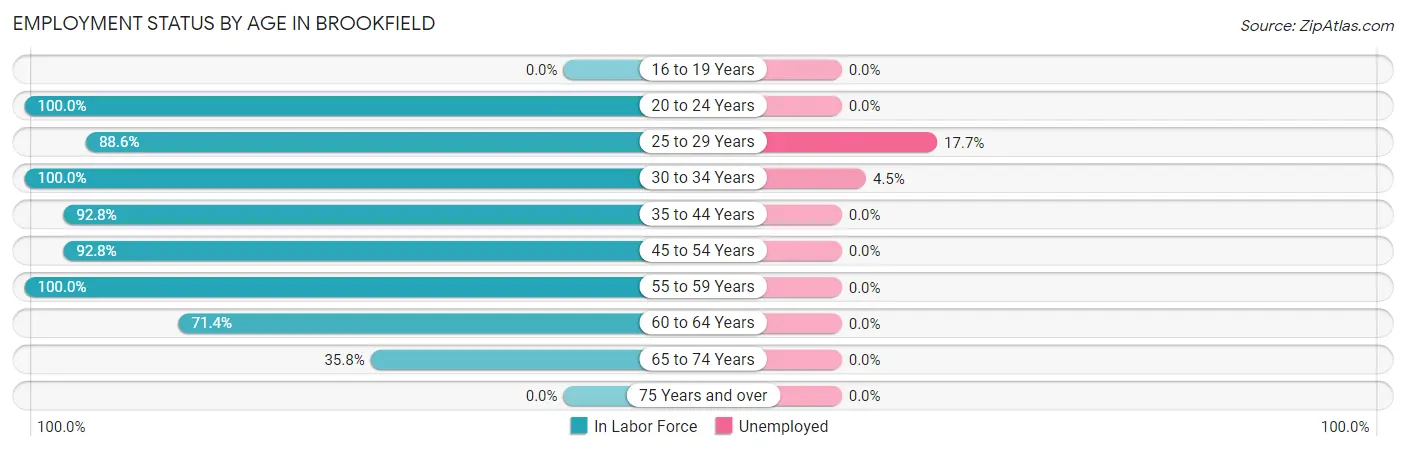
| Age Bracket | In Labor Force | Unemployed |
| 16 to 19 Years | 0 (0.0%) | 0 (0.0%) |
| 20 to 24 Years | 75 (100.0%) | 0 (0.0%) |
| 25 to 29 Years | 62 (88.6%) | 11 (17.7%) |
| 30 to 34 Years | 111 (100.0%) | 5 (4.5%) |
| 35 to 44 Years | 116 (92.8%) | 0 (0.0%) |
| 45 to 54 Years | 141 (92.8%) | 0 (0.0%) |
| 55 to 59 Years | 20 (100.0%) | 0 (0.0%) |
| 60 to 64 Years | 20 (71.4%) | 0 (0.0%) |
| 65 to 74 Years | 38 (35.8%) | 0 (0.0%) |
| 75 Years and over | 0 (0.0%) | 0 (0.0%) |
| Total | 583 (78.3%) | 16 (2.7%) |
Employment Status by Educational Attainment in Brookfield
According to labor force statistics for Brookfield, 92.9% of individuals (470) out of the total population between 25 and 64 years of age (506) are in the labor force, with 3.4% or 16 of them being unemployed. The group with the highest labor force participation rate are those with the educational attainment of college / associate degree, with 100.0% or 227 individuals in the labor force. Within the labor force, individuals with high school diploma education have the highest percentage of unemployment, with 5.4% or 11 of them being unemployed.
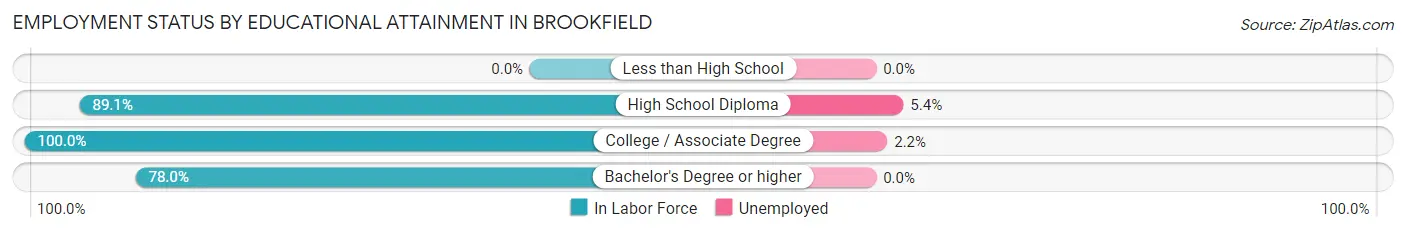
| Educational Attainment | In Labor Force | Unemployed |
| Less than High School | 0 (0.0%) | 0 (0.0%) |
| High School Diploma | 204 (89.1%) | 12 (5.4%) |
| College / Associate Degree | 227 (100.0%) | 5 (2.2%) |
| Bachelor's Degree or higher | 39 (78.0%) | 0 (0.0%) |
| Total | 470 (92.9%) | 17 (3.4%) |
Employment Occupations by Sex in Brookfield
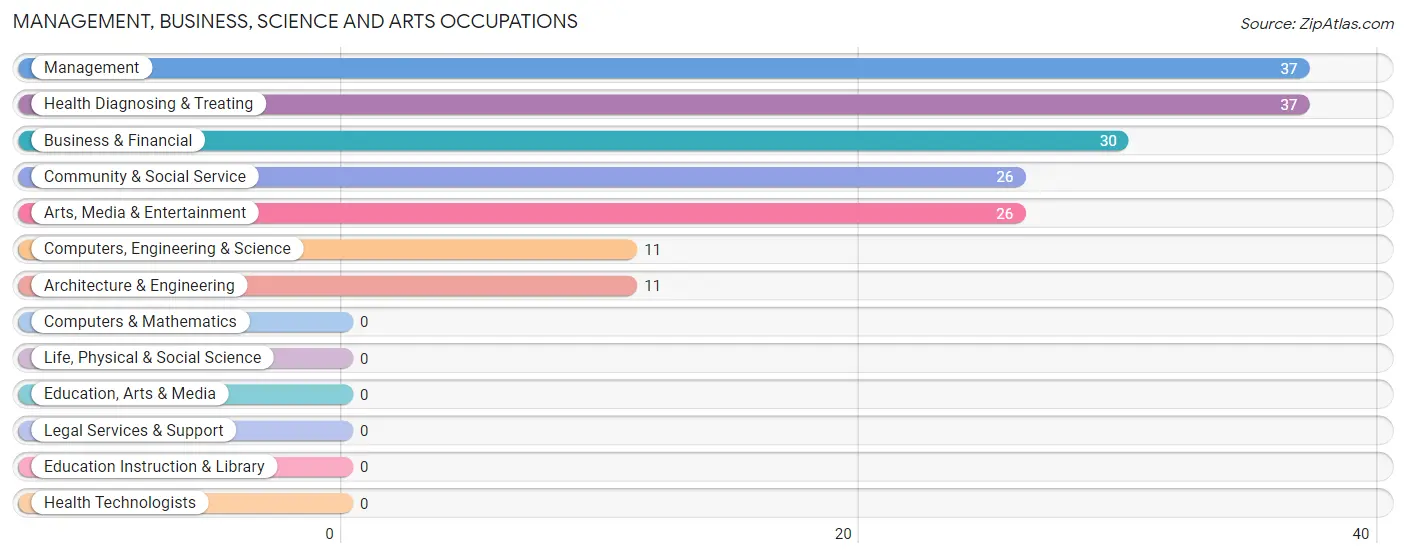
Management, Business, Science and Arts Occupations
The most common Management, Business, Science and Arts occupations in Brookfield are Management (37 | 6.5%), Health Diagnosing & Treating (37 | 6.5%), Business & Financial (30 | 5.3%), Community & Social Service (26 | 4.6%), and Arts, Media & Entertainment (26 | 4.6%).
Management, Business, Science and Arts Occupations by Sex
Within the Management, Business, Science and Arts occupations in Brookfield, the most male-oriented occupations are Business & Financial (100.0%), Computers, Engineering & Science (100.0%), and Architecture & Engineering (100.0%), while the most female-oriented occupations are Community & Social Service (100.0%), Arts, Media & Entertainment (100.0%), and Management (24.3%).
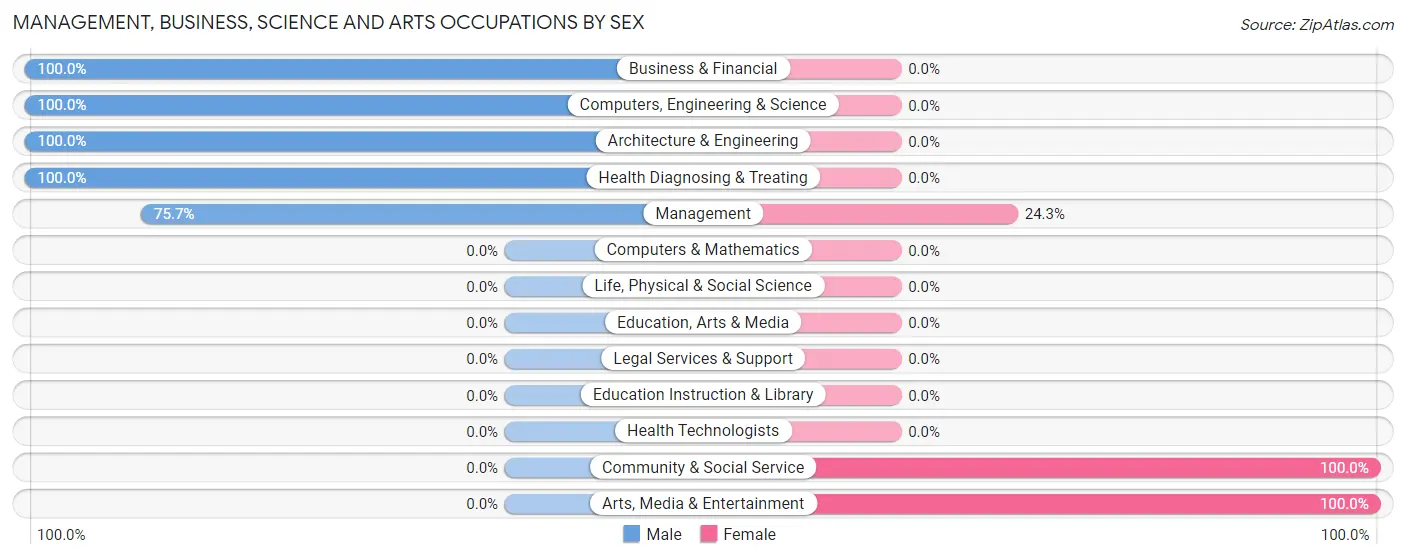
| Occupation | Male | Female |
| Management | 28 (75.7%) | 9 (24.3%) |
| Business & Financial | 30 (100.0%) | 0 (0.0%) |
| Computers, Engineering & Science | 11 (100.0%) | 0 (0.0%) |
| Computers & Mathematics | 0 (0.0%) | 0 (0.0%) |
| Architecture & Engineering | 11 (100.0%) | 0 (0.0%) |
| Life, Physical & Social Science | 0 (0.0%) | 0 (0.0%) |
| Community & Social Service | 0 (0.0%) | 26 (100.0%) |
| Education, Arts & Media | 0 (0.0%) | 0 (0.0%) |
| Legal Services & Support | 0 (0.0%) | 0 (0.0%) |
| Education Instruction & Library | 0 (0.0%) | 0 (0.0%) |
| Arts, Media & Entertainment | 0 (0.0%) | 26 (100.0%) |
| Health Diagnosing & Treating | 37 (100.0%) | 0 (0.0%) |
| Health Technologists | 0 (0.0%) | 0 (0.0%) |
| Total (Category) | 106 (75.2%) | 35 (24.8%) |
| Total (Overall) | 323 (57.0%) | 244 (43.0%) |
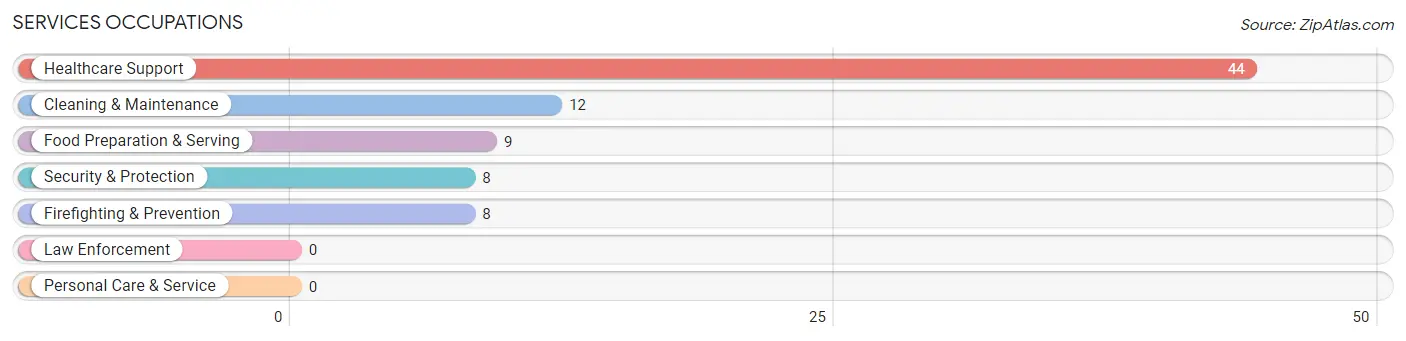
Services Occupations
The most common Services occupations in Brookfield are Healthcare Support (44 | 7.8%), Cleaning & Maintenance (12 | 2.1%), Food Preparation & Serving (9 | 1.6%), Security & Protection (8 | 1.4%), and Firefighting & Prevention (8 | 1.4%).
Services Occupations by Sex
Within the Services occupations in Brookfield, the most male-oriented occupations are Food Preparation & Serving (100.0%), and Cleaning & Maintenance (100.0%), while the most female-oriented occupations are Healthcare Support (100.0%), Security & Protection (100.0%), and Firefighting & Prevention (100.0%).
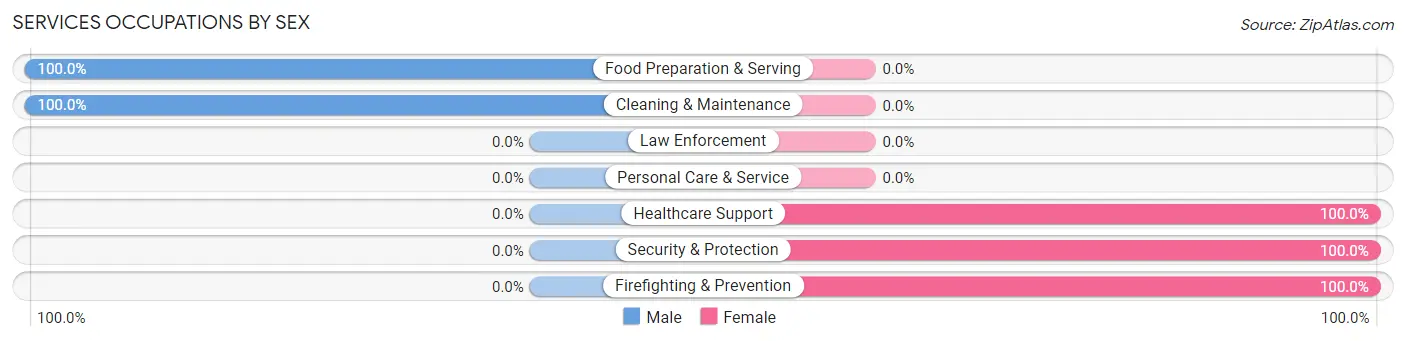
| Occupation | Male | Female |
| Healthcare Support | 0 (0.0%) | 44 (100.0%) |
| Security & Protection | 0 (0.0%) | 8 (100.0%) |
| Firefighting & Prevention | 0 (0.0%) | 8 (100.0%) |
| Law Enforcement | 0 (0.0%) | 0 (0.0%) |
| Food Preparation & Serving | 9 (100.0%) | 0 (0.0%) |
| Cleaning & Maintenance | 12 (100.0%) | 0 (0.0%) |
| Personal Care & Service | 0 (0.0%) | 0 (0.0%) |
| Total (Category) | 21 (28.8%) | 52 (71.2%) |
| Total (Overall) | 323 (57.0%) | 244 (43.0%) |
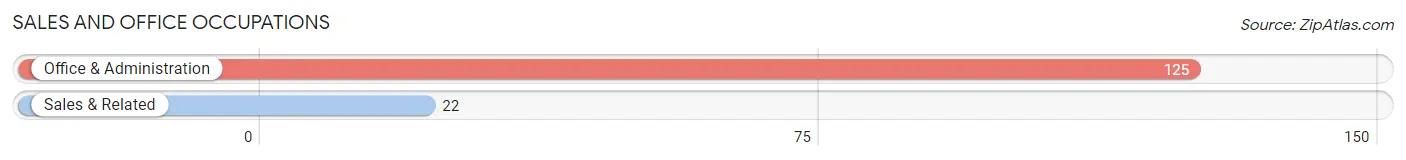
Sales and Office Occupations
The most common Sales and Office occupations in Brookfield are Office & Administration (125 | 22.1%), and Sales & Related (22 | 3.9%).
Sales and Office Occupations by Sex
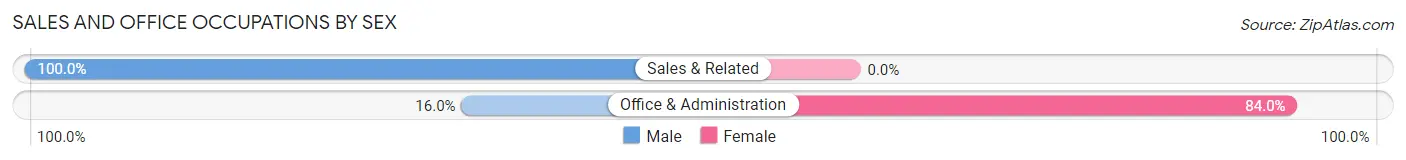
| Occupation | Male | Female |
| Sales & Related | 22 (100.0%) | 0 (0.0%) |
| Office & Administration | 20 (16.0%) | 105 (84.0%) |
| Total (Category) | 42 (28.6%) | 105 (71.4%) |
| Total (Overall) | 323 (57.0%) | 244 (43.0%) |
Natural Resources, Construction and Maintenance Occupations
The most common Natural Resources, Construction and Maintenance occupations in Brookfield are , and Construction & Extraction (112 | 19.8%).
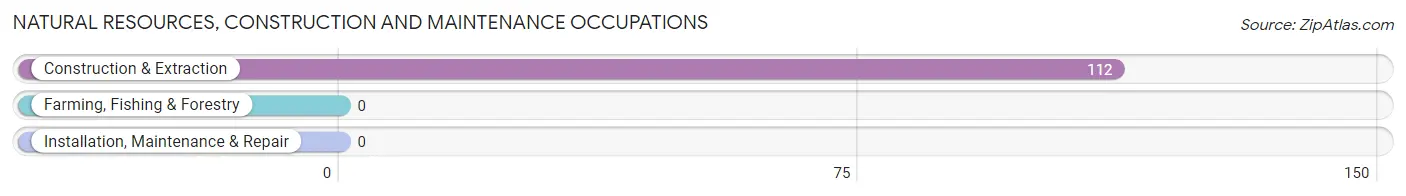
Natural Resources, Construction and Maintenance Occupations by Sex
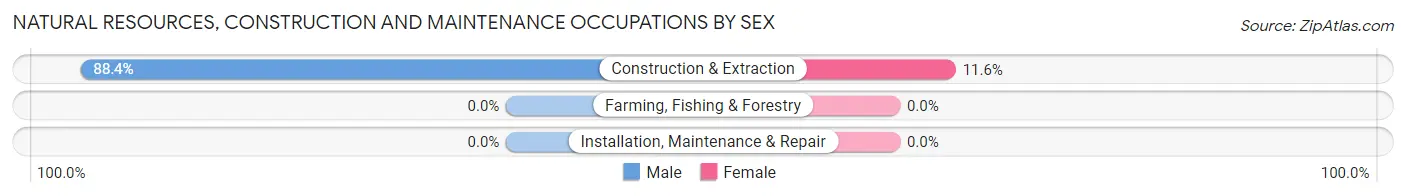
| Occupation | Male | Female |
| Farming, Fishing & Forestry | 0 (0.0%) | 0 (0.0%) |
| Construction & Extraction | 99 (88.4%) | 13 (11.6%) |
| Installation, Maintenance & Repair | 0 (0.0%) | 0 (0.0%) |
| Total (Category) | 99 (88.4%) | 13 (11.6%) |
| Total (Overall) | 323 (57.0%) | 244 (43.0%) |
Production, Transportation and Moving Occupations
The most common Production, Transportation and Moving occupations in Brookfield are , and Production (94 | 16.6%).
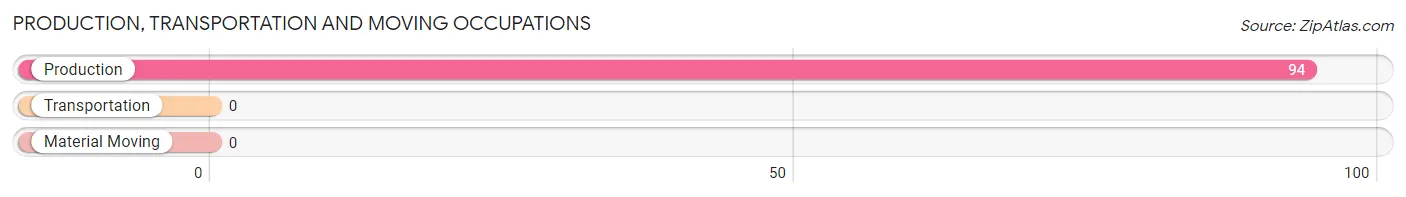
Production, Transportation and Moving Occupations by Sex
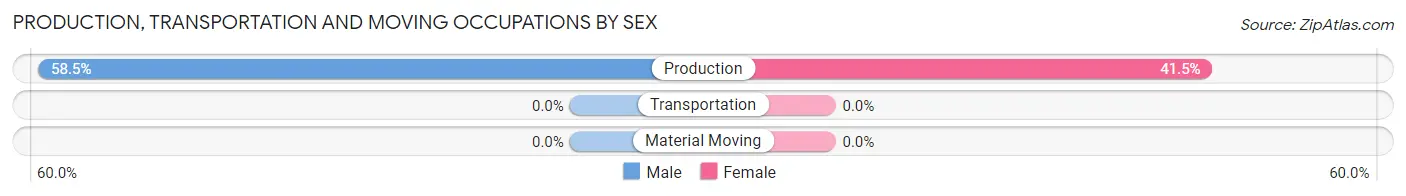
| Occupation | Male | Female |
| Production | 55 (58.5%) | 39 (41.5%) |
| Transportation | 0 (0.0%) | 0 (0.0%) |
| Material Moving | 0 (0.0%) | 0 (0.0%) |
| Total (Category) | 55 (58.5%) | 39 (41.5%) |
| Total (Overall) | 323 (57.0%) | 244 (43.0%) |
Employment Industries by Sex in Brookfield
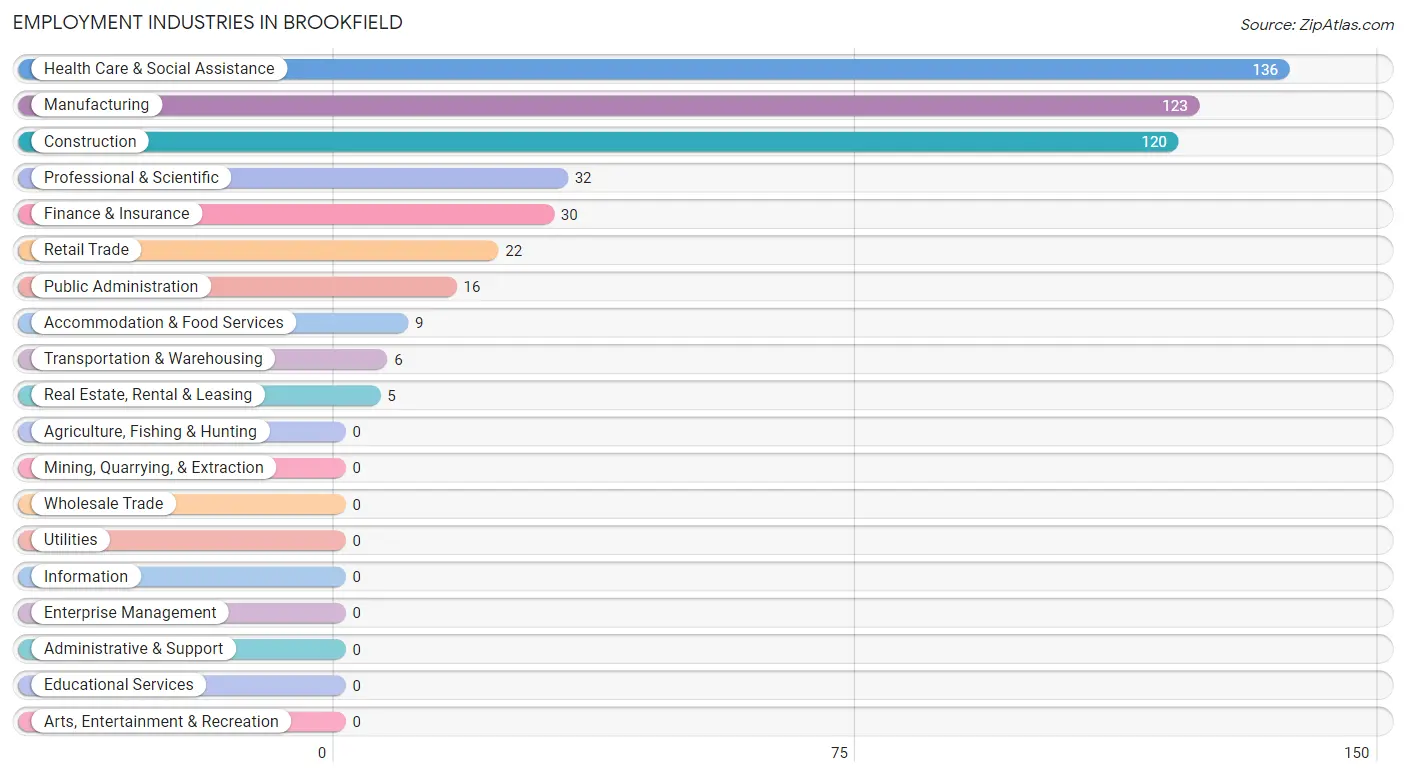
Employment Industries in Brookfield
The major employment industries in Brookfield include Health Care & Social Assistance (136 | 24.0%), Manufacturing (123 | 21.7%), Construction (120 | 21.2%), Professional & Scientific (32 | 5.6%), and Finance & Insurance (30 | 5.3%).
Employment Industries by Sex in Brookfield
The Brookfield industries that see more men than women are Retail Trade (100.0%), Finance & Insurance (100.0%), and Professional & Scientific (100.0%), whereas the industries that tend to have a higher number of women are Transportation & Warehousing (100.0%), Real Estate, Rental & Leasing (100.0%), and Public Administration (100.0%).
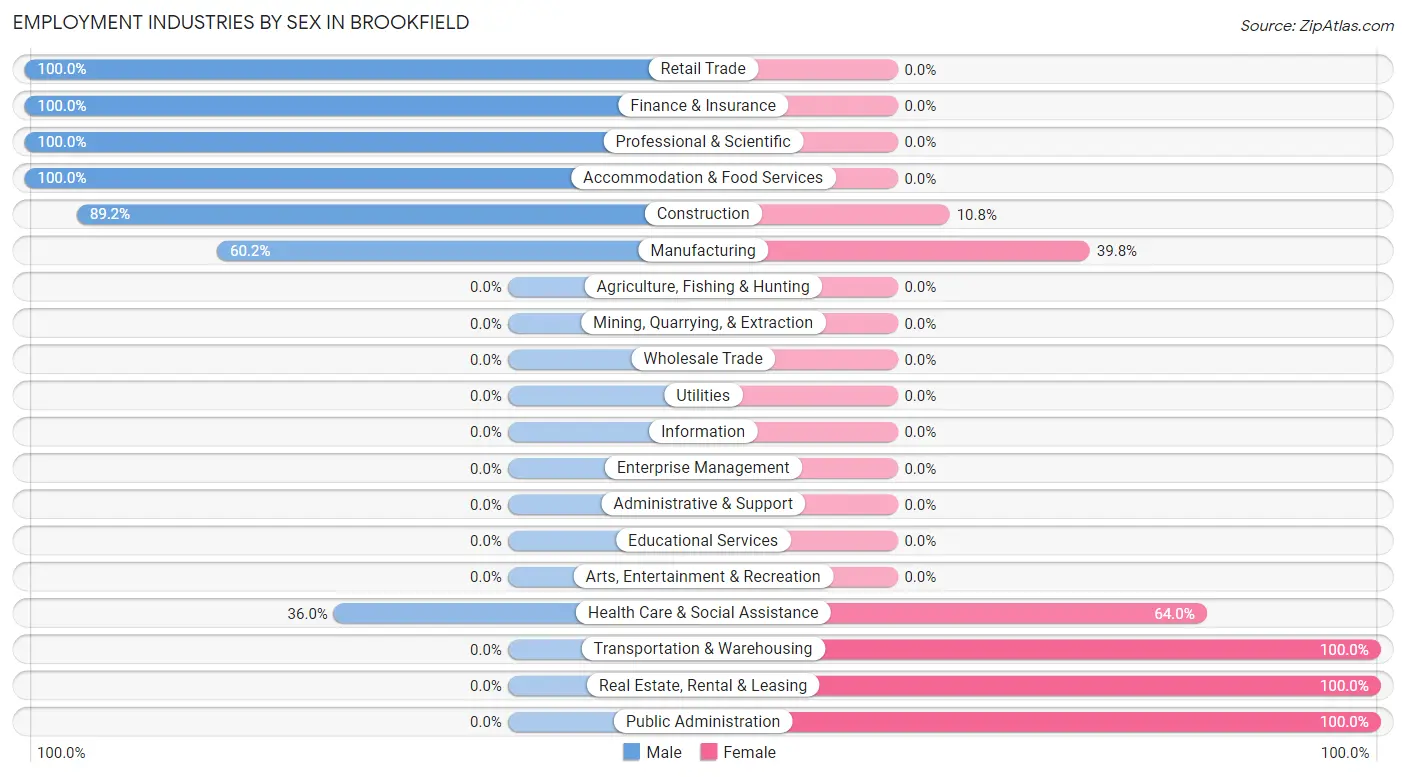
| Industry | Male | Female |
| Agriculture, Fishing & Hunting | 0 (0.0%) | 0 (0.0%) |
| Mining, Quarrying, & Extraction | 0 (0.0%) | 0 (0.0%) |
| Construction | 107 (89.2%) | 13 (10.8%) |
| Manufacturing | 74 (60.2%) | 49 (39.8%) |
| Wholesale Trade | 0 (0.0%) | 0 (0.0%) |
| Retail Trade | 22 (100.0%) | 0 (0.0%) |
| Transportation & Warehousing | 0 (0.0%) | 6 (100.0%) |
| Utilities | 0 (0.0%) | 0 (0.0%) |
| Information | 0 (0.0%) | 0 (0.0%) |
| Finance & Insurance | 30 (100.0%) | 0 (0.0%) |
| Real Estate, Rental & Leasing | 0 (0.0%) | 5 (100.0%) |
| Professional & Scientific | 32 (100.0%) | 0 (0.0%) |
| Enterprise Management | 0 (0.0%) | 0 (0.0%) |
| Administrative & Support | 0 (0.0%) | 0 (0.0%) |
| Educational Services | 0 (0.0%) | 0 (0.0%) |
| Health Care & Social Assistance | 49 (36.0%) | 87 (64.0%) |
| Arts, Entertainment & Recreation | 0 (0.0%) | 0 (0.0%) |
| Accommodation & Food Services | 9 (100.0%) | 0 (0.0%) |
| Public Administration | 0 (0.0%) | 16 (100.0%) |
| Total | 323 (57.0%) | 244 (43.0%) |
Education in Brookfield
School Enrollment in Brookfield
The most common levels of schooling among the 195 students in Brookfield are elementary school (63 | 32.3%), middle school (51 | 26.2%), and college / undergraduate (41 | 21.0%).
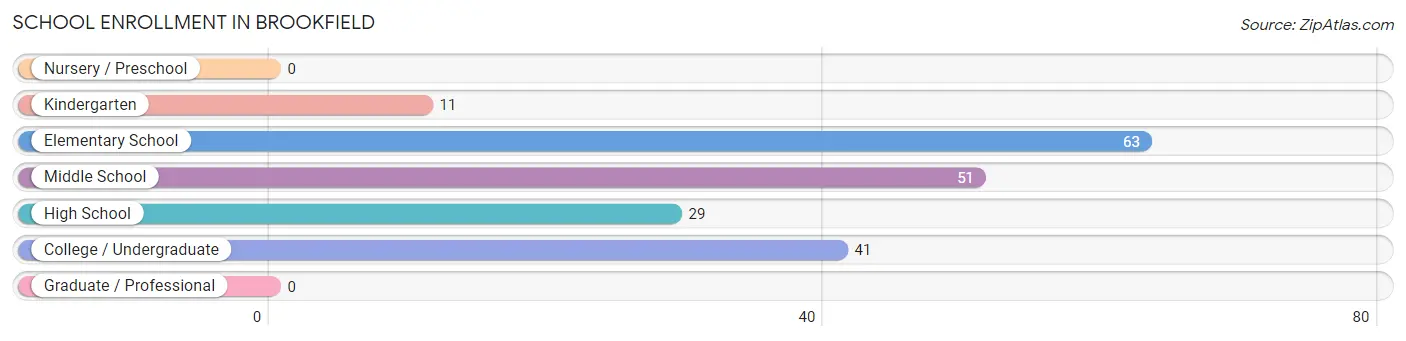
| School Level | # Students | % Students |
| Nursery / Preschool | 0 | 0.0% |
| Kindergarten | 11 | 5.6% |
| Elementary School | 63 | 32.3% |
| Middle School | 51 | 26.2% |
| High School | 29 | 14.9% |
| College / Undergraduate | 41 | 21.0% |
| Graduate / Professional | 0 | 0.0% |
| Total | 195 | 100.0% |
School Enrollment by Age by Funding Source in Brookfield
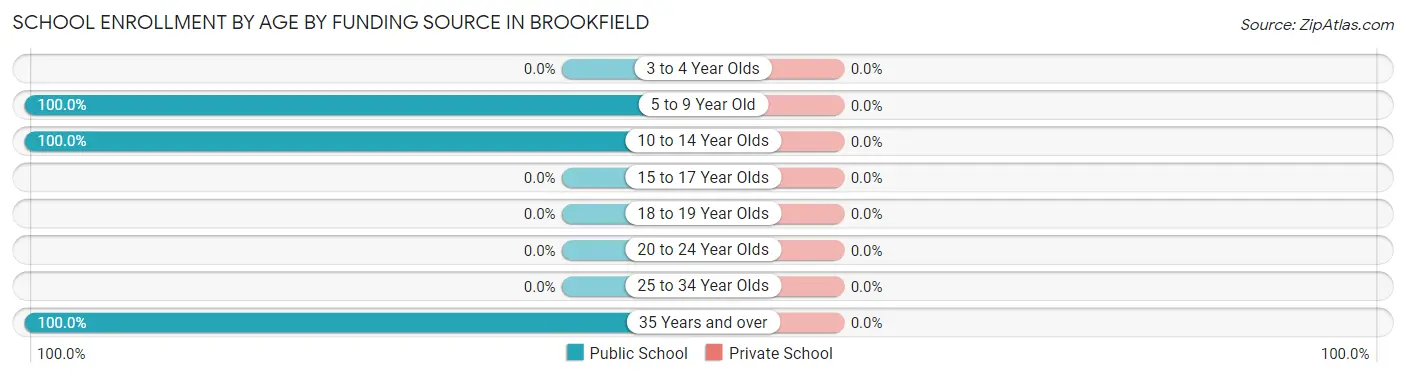
| Age Bracket | Public School | Private School |
| 3 to 4 Year Olds | 0 (0.0%) | 0 (0.0%) |
| 5 to 9 Year Old | 74 (100.0%) | 0 (0.0%) |
| 10 to 14 Year Olds | 80 (100.0%) | 0 (0.0%) |
| 15 to 17 Year Olds | 0 (0.0%) | 0 (0.0%) |
| 18 to 19 Year Olds | 0 (0.0%) | 0 (0.0%) |
| 20 to 24 Year Olds | 0 (0.0%) | 0 (0.0%) |
| 25 to 34 Year Olds | 0 (0.0%) | 0 (0.0%) |
| 35 Years and over | 41 (100.0%) | 0 (0.0%) |
| Total | 195 (100.0%) | 0 (0.0%) |
Educational Attainment by Field of Study in Brookfield
Science & technology (26 | 23.2%), business (18 | 16.1%), computers & mathematics (13 | 11.6%), communications (12 | 10.7%), and literature & languages (11 | 9.8%) are the most common fields of study among 112 individuals in Brookfield who have obtained a bachelor's degree or higher.
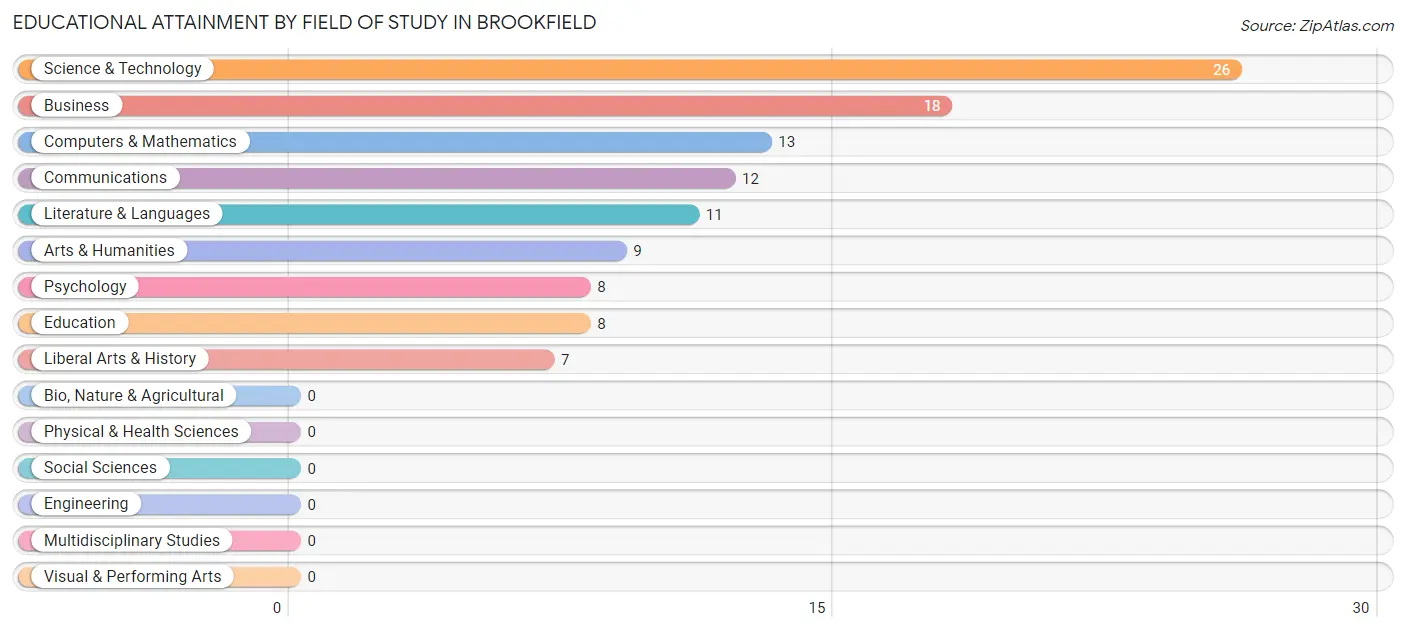
| Field of Study | # Graduates | % Graduates |
| Computers & Mathematics | 13 | 11.6% |
| Bio, Nature & Agricultural | 0 | 0.0% |
| Physical & Health Sciences | 0 | 0.0% |
| Psychology | 8 | 7.1% |
| Social Sciences | 0 | 0.0% |
| Engineering | 0 | 0.0% |
| Multidisciplinary Studies | 0 | 0.0% |
| Science & Technology | 26 | 23.2% |
| Business | 18 | 16.1% |
| Education | 8 | 7.1% |
| Literature & Languages | 11 | 9.8% |
| Liberal Arts & History | 7 | 6.2% |
| Visual & Performing Arts | 0 | 0.0% |
| Communications | 12 | 10.7% |
| Arts & Humanities | 9 | 8.0% |
| Total | 112 | 100.0% |
Transportation & Commute in Brookfield
Vehicle Availability by Sex in Brookfield
The most prevalent vehicle ownership categories in Brookfield are males with 3 vehicles (136, accounting for 45.2%) and females with 3 vehicles (79, making up 55.7%).
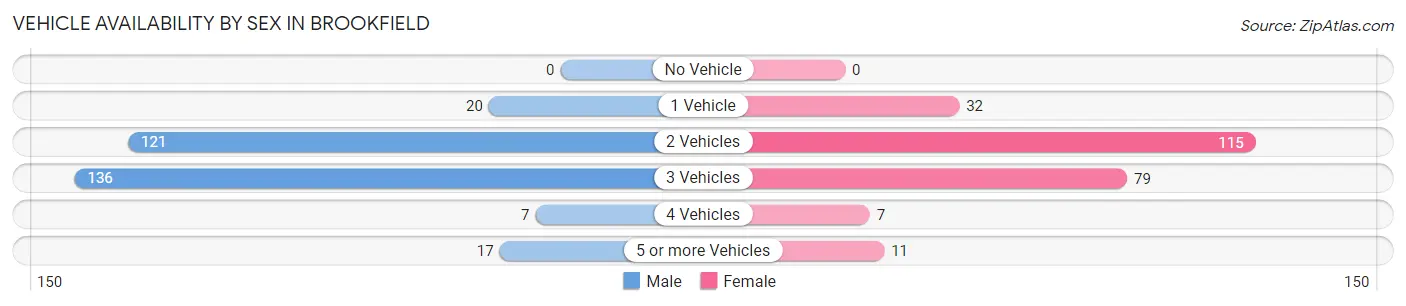
| Vehicles Available | Male | Female |
| No Vehicle | 0 (0.0%) | 0 (0.0%) |
| 1 Vehicle | 20 (6.6%) | 32 (13.1%) |
| 2 Vehicles | 121 (40.2%) | 115 (47.1%) |
| 3 Vehicles | 136 (45.2%) | 79 (32.4%) |
| 4 Vehicles | 7 (2.3%) | 7 (2.9%) |
| 5 or more Vehicles | 17 (5.7%) | 11 (4.5%) |
| Total | 301 (100.0%) | 244 (100.0%) |
Commute Time in Brookfield
The most frequently occuring commute durations in Brookfield are 20 to 24 minutes (131 commuters, 25.3%), 15 to 19 minutes (116 commuters, 22.4%), and 60 to 89 minutes (64 commuters, 12.4%).
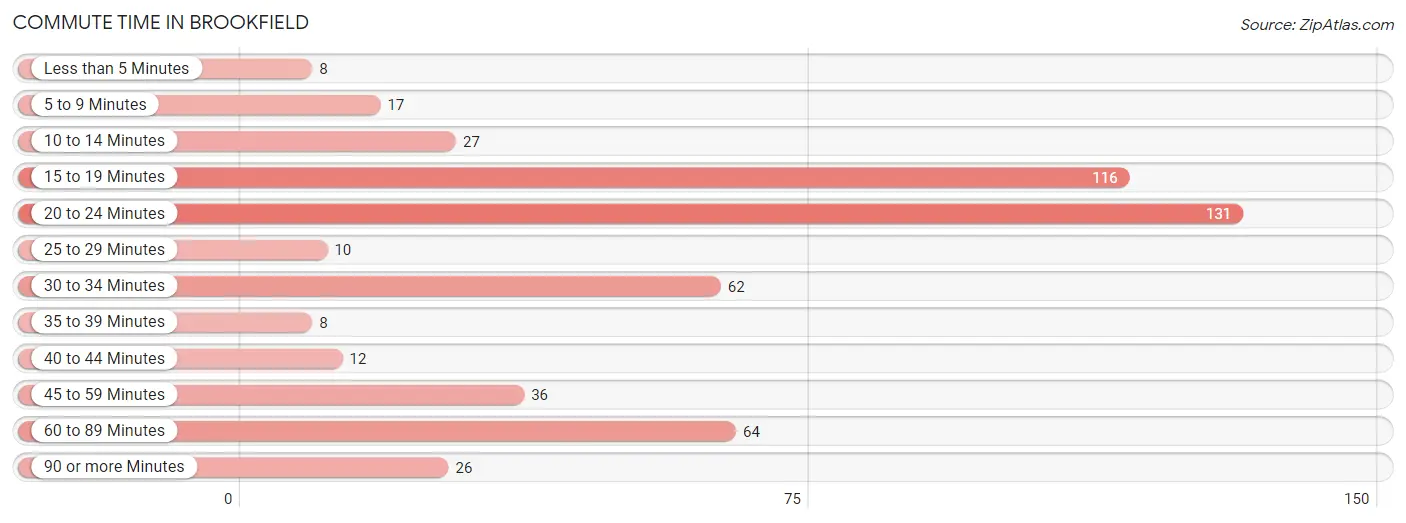
| Commute Time | # Commuters | % Commuters |
| Less than 5 Minutes | 8 | 1.5% |
| 5 to 9 Minutes | 17 | 3.3% |
| 10 to 14 Minutes | 27 | 5.2% |
| 15 to 19 Minutes | 116 | 22.4% |
| 20 to 24 Minutes | 131 | 25.3% |
| 25 to 29 Minutes | 10 | 1.9% |
| 30 to 34 Minutes | 62 | 12.0% |
| 35 to 39 Minutes | 8 | 1.5% |
| 40 to 44 Minutes | 12 | 2.3% |
| 45 to 59 Minutes | 36 | 7.0% |
| 60 to 89 Minutes | 64 | 12.4% |
| 90 or more Minutes | 26 | 5.0% |
Commute Time by Sex in Brookfield
The most common commute times in Brookfield are 15 to 19 minutes (67 commuters, 22.3%) for males and 20 to 24 minutes (88 commuters, 40.7%) for females.
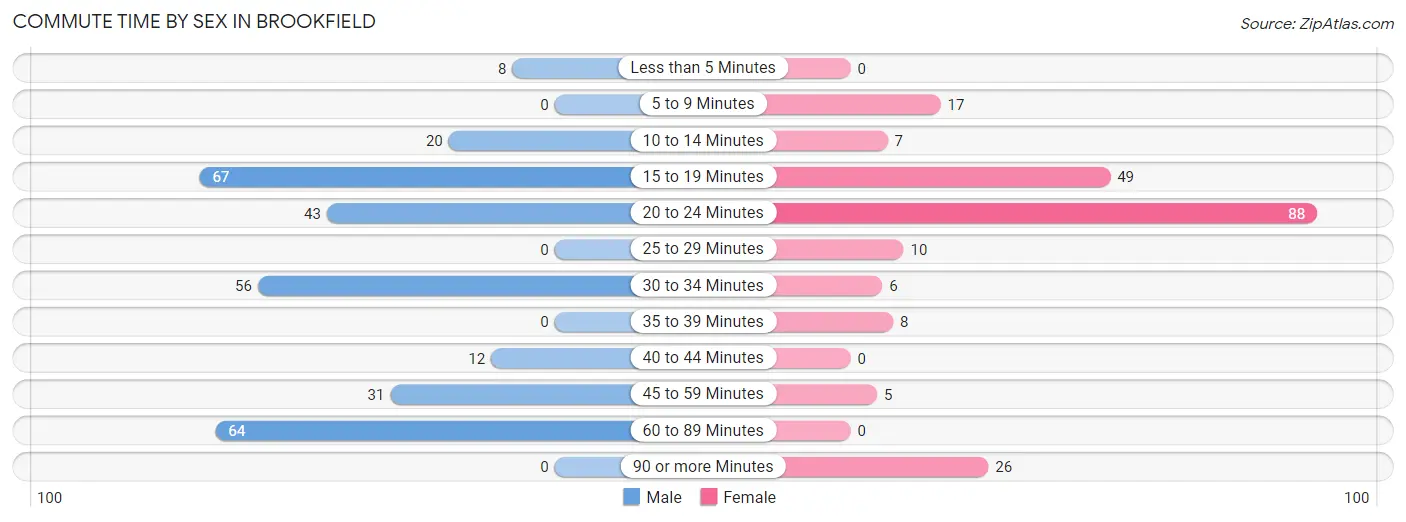
| Commute Time | Male | Female |
| Less than 5 Minutes | 8 (2.7%) | 0 (0.0%) |
| 5 to 9 Minutes | 0 (0.0%) | 17 (7.9%) |
| 10 to 14 Minutes | 20 (6.6%) | 7 (3.2%) |
| 15 to 19 Minutes | 67 (22.3%) | 49 (22.7%) |
| 20 to 24 Minutes | 43 (14.3%) | 88 (40.7%) |
| 25 to 29 Minutes | 0 (0.0%) | 10 (4.6%) |
| 30 to 34 Minutes | 56 (18.6%) | 6 (2.8%) |
| 35 to 39 Minutes | 0 (0.0%) | 8 (3.7%) |
| 40 to 44 Minutes | 12 (4.0%) | 0 (0.0%) |
| 45 to 59 Minutes | 31 (10.3%) | 5 (2.3%) |
| 60 to 89 Minutes | 64 (21.3%) | 0 (0.0%) |
| 90 or more Minutes | 0 (0.0%) | 26 (12.0%) |
Time of Departure to Work by Sex in Brookfield
The most frequent times of departure to work in Brookfield are 7:00 AM to 7:29 AM (81, 26.9%) for males and 8:30 AM to 8:59 AM (131, 60.7%) for females.
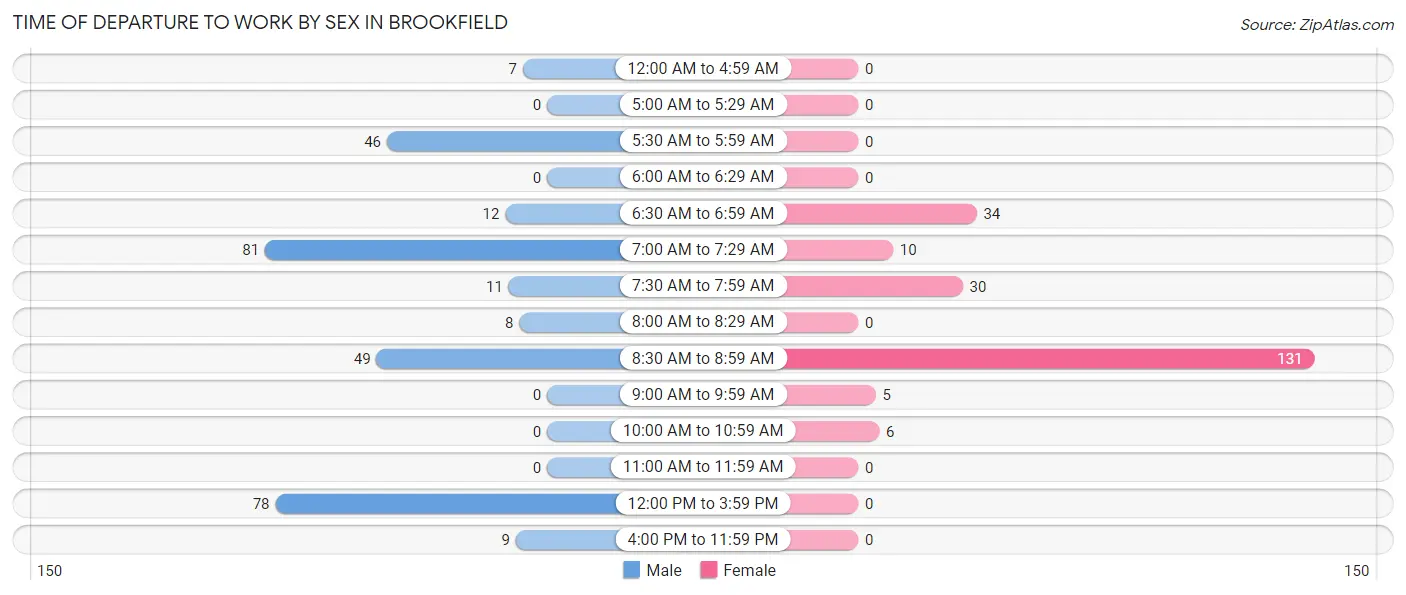
| Time of Departure | Male | Female |
| 12:00 AM to 4:59 AM | 7 (2.3%) | 0 (0.0%) |
| 5:00 AM to 5:29 AM | 0 (0.0%) | 0 (0.0%) |
| 5:30 AM to 5:59 AM | 46 (15.3%) | 0 (0.0%) |
| 6:00 AM to 6:29 AM | 0 (0.0%) | 0 (0.0%) |
| 6:30 AM to 6:59 AM | 12 (4.0%) | 34 (15.7%) |
| 7:00 AM to 7:29 AM | 81 (26.9%) | 10 (4.6%) |
| 7:30 AM to 7:59 AM | 11 (3.6%) | 30 (13.9%) |
| 8:00 AM to 8:29 AM | 8 (2.7%) | 0 (0.0%) |
| 8:30 AM to 8:59 AM | 49 (16.3%) | 131 (60.7%) |
| 9:00 AM to 9:59 AM | 0 (0.0%) | 5 (2.3%) |
| 10:00 AM to 10:59 AM | 0 (0.0%) | 6 (2.8%) |
| 11:00 AM to 11:59 AM | 0 (0.0%) | 0 (0.0%) |
| 12:00 PM to 3:59 PM | 78 (25.9%) | 0 (0.0%) |
| 4:00 PM to 11:59 PM | 9 (3.0%) | 0 (0.0%) |
| Total | 301 (100.0%) | 216 (100.0%) |
Housing Occupancy in Brookfield
Occupancy by Ownership in Brookfield
Of the total 391 dwellings in Brookfield, owner-occupied units account for 287 (73.4%), while renter-occupied units make up 104 (26.6%).
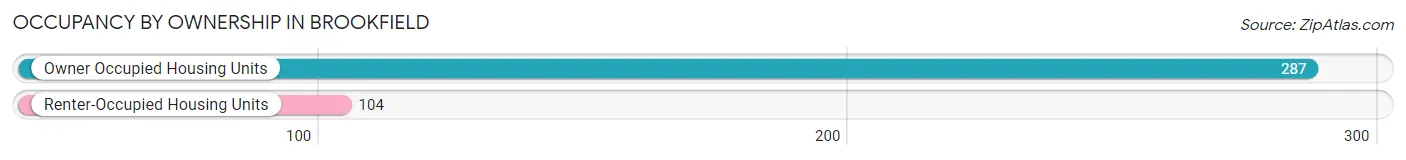
| Occupancy | # Housing Units | % Housing Units |
| Owner Occupied Housing Units | 287 | 73.4% |
| Renter-Occupied Housing Units | 104 | 26.6% |
| Total Occupied Housing Units | 391 | 100.0% |
Occupancy by Household Size in Brookfield
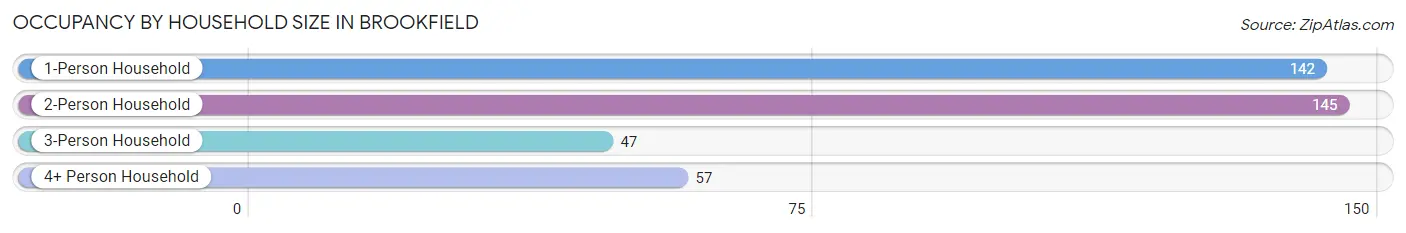
| Household Size | # Housing Units | % Housing Units |
| 1-Person Household | 142 | 36.3% |
| 2-Person Household | 145 | 37.1% |
| 3-Person Household | 47 | 12.0% |
| 4+ Person Household | 57 | 14.6% |
| Total Housing Units | 391 | 100.0% |
Occupancy by Ownership by Household Size in Brookfield
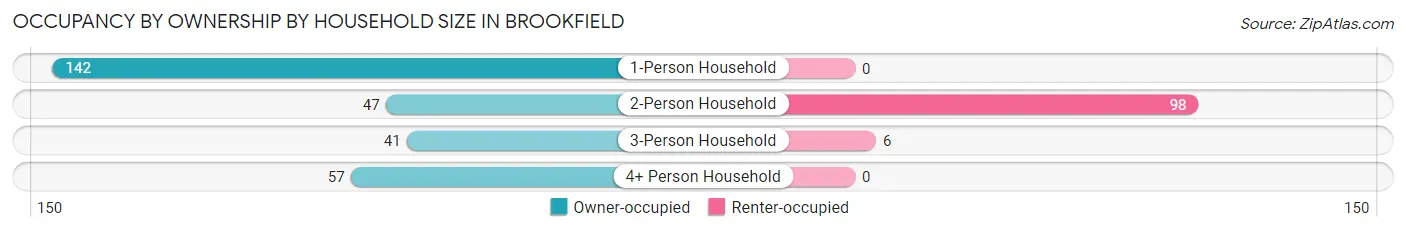
| Household Size | Owner-occupied | Renter-occupied |
| 1-Person Household | 142 (100.0%) | 0 (0.0%) |
| 2-Person Household | 47 (32.4%) | 98 (67.6%) |
| 3-Person Household | 41 (87.2%) | 6 (12.8%) |
| 4+ Person Household | 57 (100.0%) | 0 (0.0%) |
| Total Housing Units | 287 (73.4%) | 104 (26.6%) |
Occupancy by Educational Attainment in Brookfield
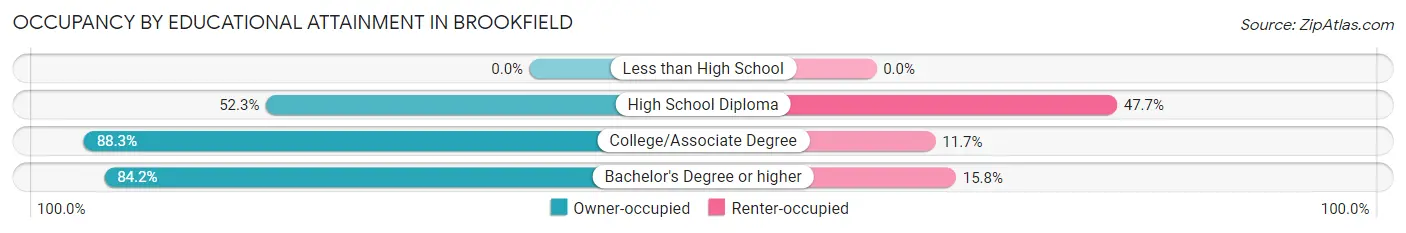
| Household Size | Owner-occupied | Renter-occupied |
| Less than High School | 0 (0.0%) | 0 (0.0%) |
| High School Diploma | 80 (52.3%) | 73 (47.7%) |
| College/Associate Degree | 143 (88.3%) | 19 (11.7%) |
| Bachelor's Degree or higher | 64 (84.2%) | 12 (15.8%) |
Occupancy by Age of Householder in Brookfield
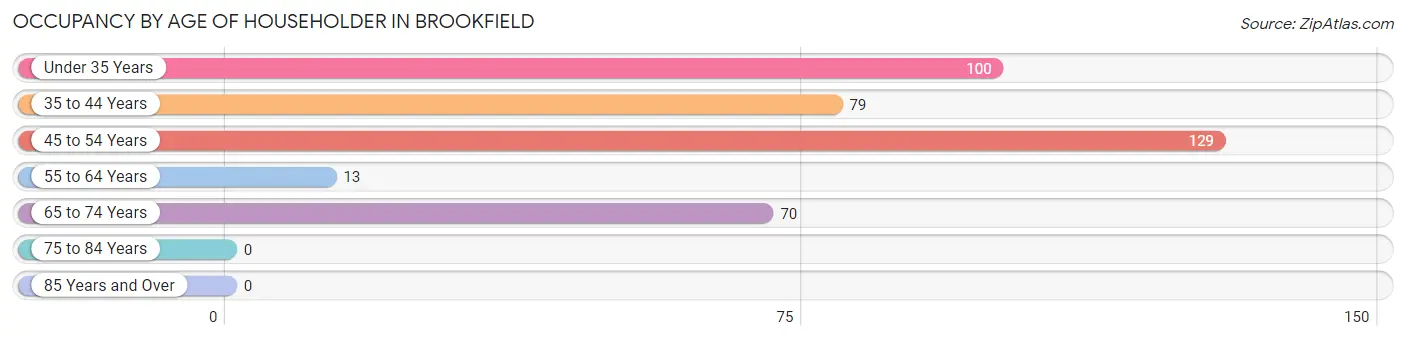
| Age Bracket | # Households | % Households |
| Under 35 Years | 100 | 25.6% |
| 35 to 44 Years | 79 | 20.2% |
| 45 to 54 Years | 129 | 33.0% |
| 55 to 64 Years | 13 | 3.3% |
| 65 to 74 Years | 70 | 17.9% |
| 75 to 84 Years | 0 | 0.0% |
| 85 Years and Over | 0 | 0.0% |
| Total | 391 | 100.0% |
Housing Finances in Brookfield
Median Income by Occupancy in Brookfield
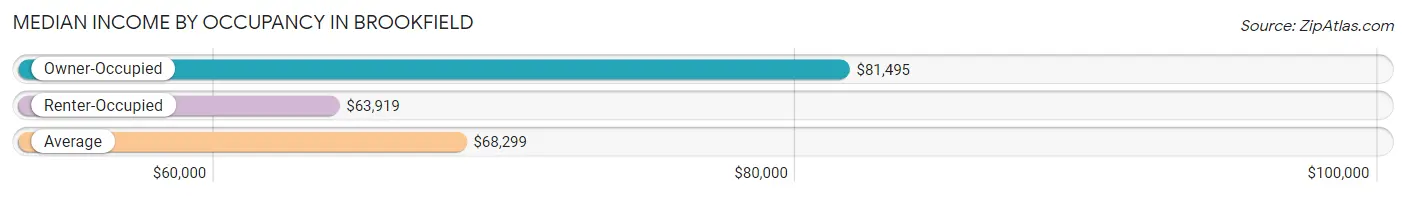
| Occupancy Type | # Households | Median Income |
| Owner-Occupied | 287 (73.4%) | $81,495 |
| Renter-Occupied | 104 (26.6%) | $63,919 |
| Average | 391 (100.0%) | $68,299 |
Occupancy by Householder Income Bracket in Brookfield
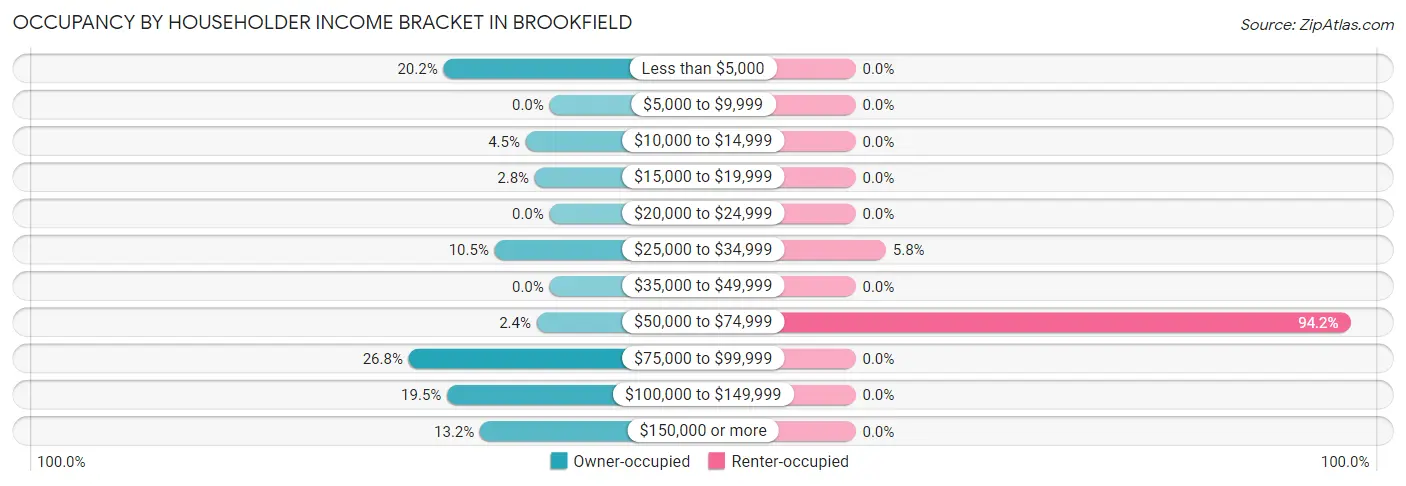
| Income Bracket | Owner-occupied | Renter-occupied |
| Less than $5,000 | 58 (20.2%) | 0 (0.0%) |
| $5,000 to $9,999 | 0 (0.0%) | 0 (0.0%) |
| $10,000 to $14,999 | 13 (4.5%) | 0 (0.0%) |
| $15,000 to $19,999 | 8 (2.8%) | 0 (0.0%) |
| $20,000 to $24,999 | 0 (0.0%) | 0 (0.0%) |
| $25,000 to $34,999 | 30 (10.4%) | 6 (5.8%) |
| $35,000 to $49,999 | 0 (0.0%) | 0 (0.0%) |
| $50,000 to $74,999 | 7 (2.4%) | 98 (94.2%) |
| $75,000 to $99,999 | 77 (26.8%) | 0 (0.0%) |
| $100,000 to $149,999 | 56 (19.5%) | 0 (0.0%) |
| $150,000 or more | 38 (13.2%) | 0 (0.0%) |
| Total | 287 (100.0%) | 104 (100.0%) |
Monthly Housing Cost Tiers in Brookfield
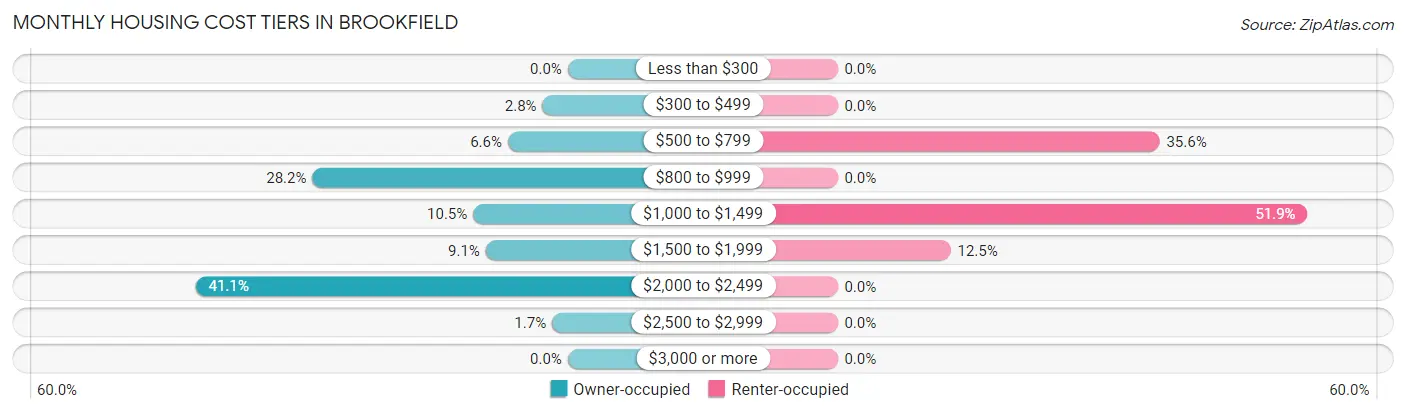
| Monthly Cost | Owner-occupied | Renter-occupied |
| Less than $300 | 0 (0.0%) | 0 (0.0%) |
| $300 to $499 | 8 (2.8%) | 0 (0.0%) |
| $500 to $799 | 19 (6.6%) | 37 (35.6%) |
| $800 to $999 | 81 (28.2%) | 0 (0.0%) |
| $1,000 to $1,499 | 30 (10.4%) | 54 (51.9%) |
| $1,500 to $1,999 | 26 (9.1%) | 13 (12.5%) |
| $2,000 to $2,499 | 118 (41.1%) | 0 (0.0%) |
| $2,500 to $2,999 | 5 (1.7%) | 0 (0.0%) |
| $3,000 or more | 0 (0.0%) | 0 (0.0%) |
| Total | 287 (100.0%) | 104 (100.0%) |
Physical Housing Characteristics in Brookfield
Housing Structures in Brookfield
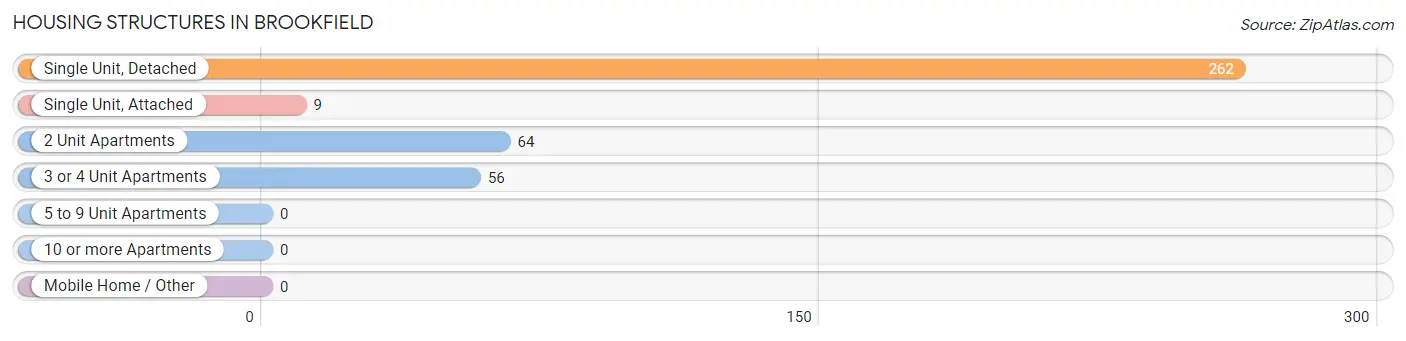
| Structure Type | # Housing Units | % Housing Units |
| Single Unit, Detached | 262 | 67.0% |
| Single Unit, Attached | 9 | 2.3% |
| 2 Unit Apartments | 64 | 16.4% |
| 3 or 4 Unit Apartments | 56 | 14.3% |
| 5 to 9 Unit Apartments | 0 | 0.0% |
| 10 or more Apartments | 0 | 0.0% |
| Mobile Home / Other | 0 | 0.0% |
| Total | 391 | 100.0% |
Housing Structures by Occupancy in Brookfield
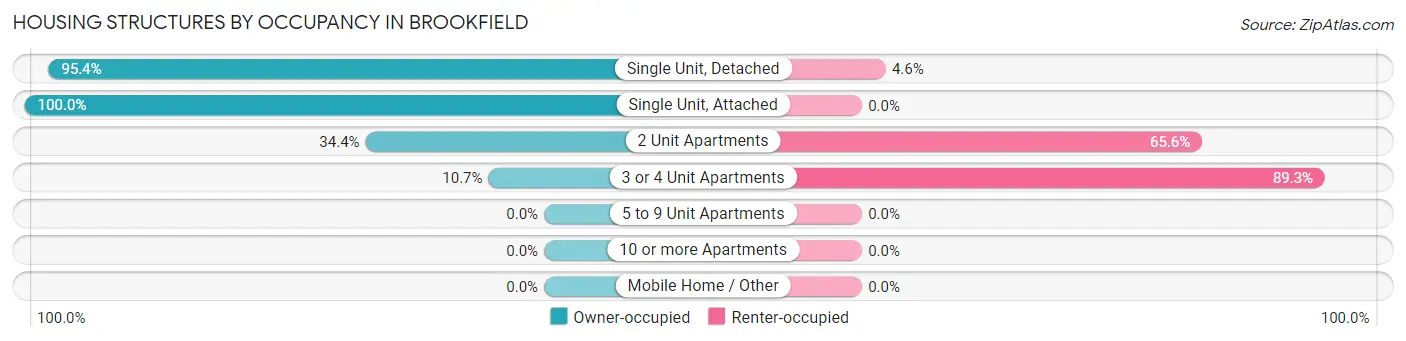
| Structure Type | Owner-occupied | Renter-occupied |
| Single Unit, Detached | 250 (95.4%) | 12 (4.6%) |
| Single Unit, Attached | 9 (100.0%) | 0 (0.0%) |
| 2 Unit Apartments | 22 (34.4%) | 42 (65.6%) |
| 3 or 4 Unit Apartments | 6 (10.7%) | 50 (89.3%) |
| 5 to 9 Unit Apartments | 0 (0.0%) | 0 (0.0%) |
| 10 or more Apartments | 0 (0.0%) | 0 (0.0%) |
| Mobile Home / Other | 0 (0.0%) | 0 (0.0%) |
| Total | 287 (73.4%) | 104 (26.6%) |
Housing Structures by Number of Rooms in Brookfield
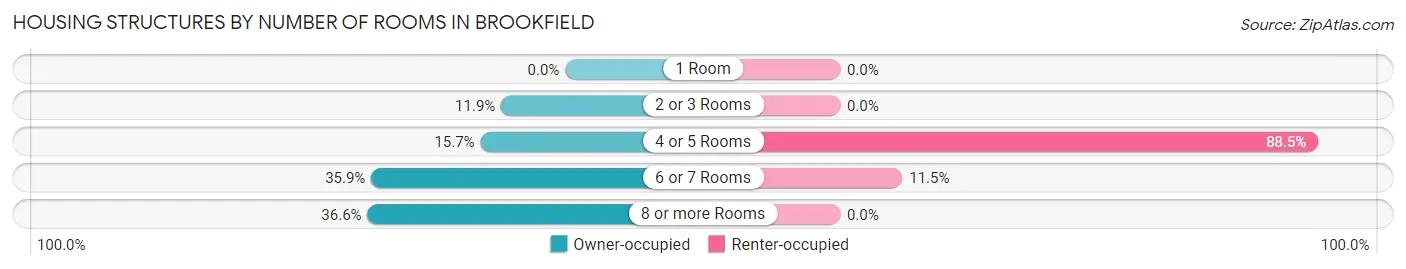
| Number of Rooms | Owner-occupied | Renter-occupied |
| 1 Room | 0 (0.0%) | 0 (0.0%) |
| 2 or 3 Rooms | 34 (11.8%) | 0 (0.0%) |
| 4 or 5 Rooms | 45 (15.7%) | 92 (88.5%) |
| 6 or 7 Rooms | 103 (35.9%) | 12 (11.5%) |
| 8 or more Rooms | 105 (36.6%) | 0 (0.0%) |
| Total | 287 (100.0%) | 104 (100.0%) |
Housing Structure by Heating Type in Brookfield
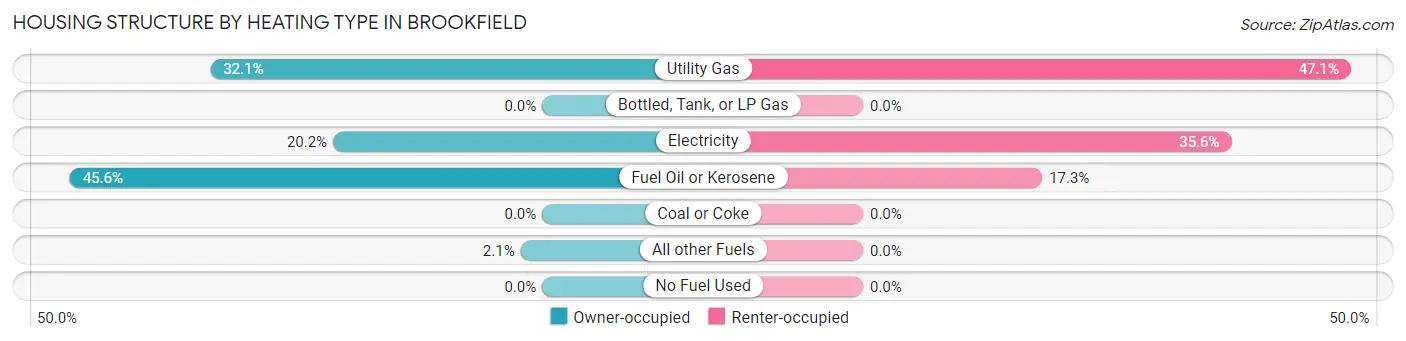
| Heating Type | Owner-occupied | Renter-occupied |
| Utility Gas | 92 (32.1%) | 49 (47.1%) |
| Bottled, Tank, or LP Gas | 0 (0.0%) | 0 (0.0%) |
| Electricity | 58 (20.2%) | 37 (35.6%) |
| Fuel Oil or Kerosene | 131 (45.6%) | 18 (17.3%) |
| Coal or Coke | 0 (0.0%) | 0 (0.0%) |
| All other Fuels | 6 (2.1%) | 0 (0.0%) |
| No Fuel Used | 0 (0.0%) | 0 (0.0%) |
| Total | 287 (100.0%) | 104 (100.0%) |
Household Vehicle Usage in Brookfield
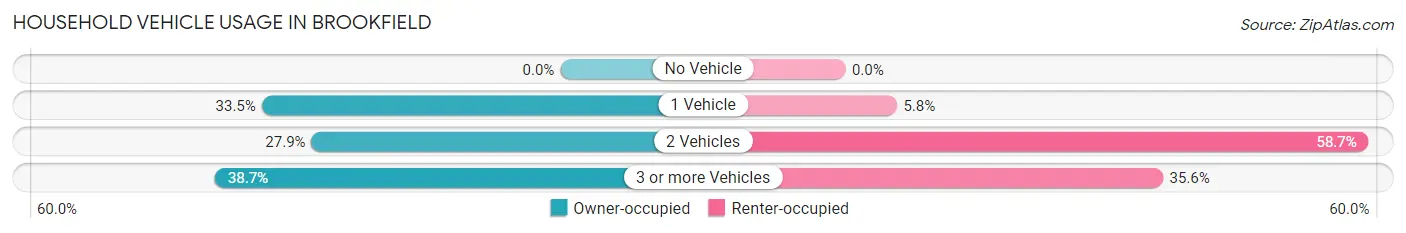
| Vehicles per Household | Owner-occupied | Renter-occupied |
| No Vehicle | 0 (0.0%) | 0 (0.0%) |
| 1 Vehicle | 96 (33.5%) | 6 (5.8%) |
| 2 Vehicles | 80 (27.9%) | 61 (58.7%) |
| 3 or more Vehicles | 111 (38.7%) | 37 (35.6%) |
| Total | 287 (100.0%) | 104 (100.0%) |
Real Estate & Mortgages in Brookfield
Real Estate and Mortgage Overview in Brookfield
| Characteristic | Without Mortgage | With Mortgage |
| Housing Units | 54 | 233 |
| Median Property Value | $281,000 | $297,000 |
| Median Household Income | - | - |
| Monthly Housing Costs | $800 | $0 |
| Real Estate Taxes | $4,421 | $0 |
Property Value by Mortgage Status in Brookfield
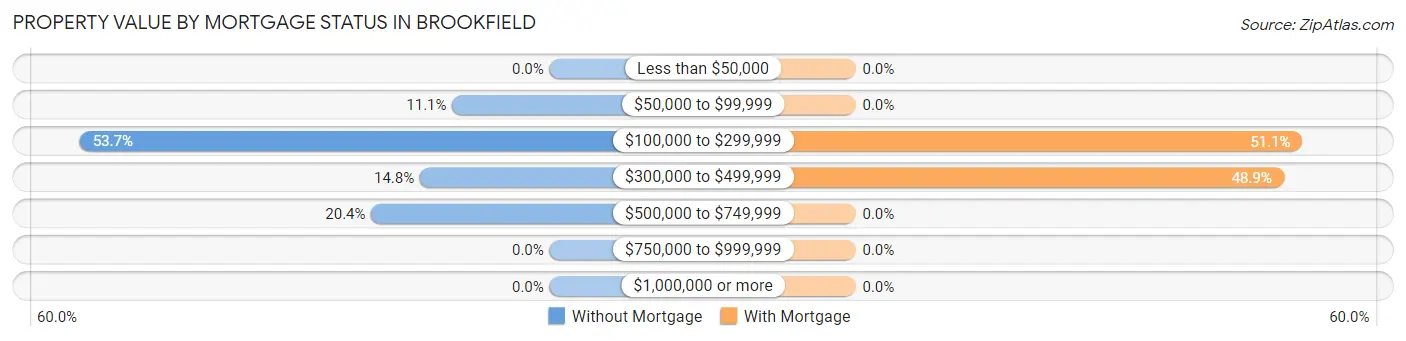
| Property Value | Without Mortgage | With Mortgage |
| Less than $50,000 | 0 (0.0%) | 0 (0.0%) |
| $50,000 to $99,999 | 6 (11.1%) | 0 (0.0%) |
| $100,000 to $299,999 | 29 (53.7%) | 119 (51.1%) |
| $300,000 to $499,999 | 8 (14.8%) | 114 (48.9%) |
| $500,000 to $749,999 | 11 (20.4%) | 0 (0.0%) |
| $750,000 to $999,999 | 0 (0.0%) | 0 (0.0%) |
| $1,000,000 or more | 0 (0.0%) | 0 (0.0%) |
| Total | 54 (100.0%) | 233 (100.0%) |
Household Income by Mortgage Status in Brookfield
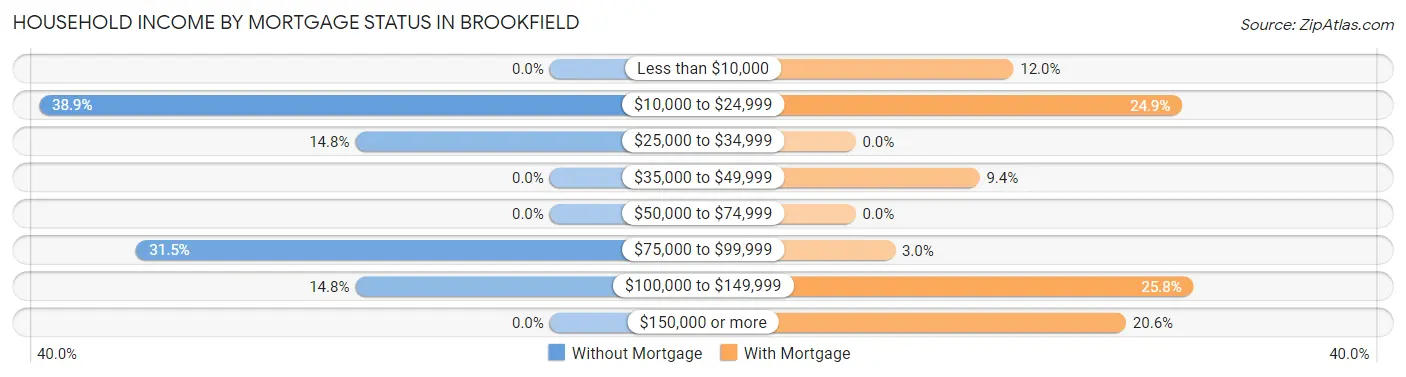
| Household Income | Without Mortgage | With Mortgage |
| Less than $10,000 | 0 (0.0%) | 28 (12.0%) |
| $10,000 to $24,999 | 21 (38.9%) | 58 (24.9%) |
| $25,000 to $34,999 | 8 (14.8%) | 0 (0.0%) |
| $35,000 to $49,999 | 0 (0.0%) | 22 (9.4%) |
| $50,000 to $74,999 | 0 (0.0%) | 0 (0.0%) |
| $75,000 to $99,999 | 17 (31.5%) | 7 (3.0%) |
| $100,000 to $149,999 | 8 (14.8%) | 60 (25.8%) |
| $150,000 or more | 0 (0.0%) | 48 (20.6%) |
| Total | 54 (100.0%) | 233 (100.0%) |
Property Value to Household Income Ratio in Brookfield
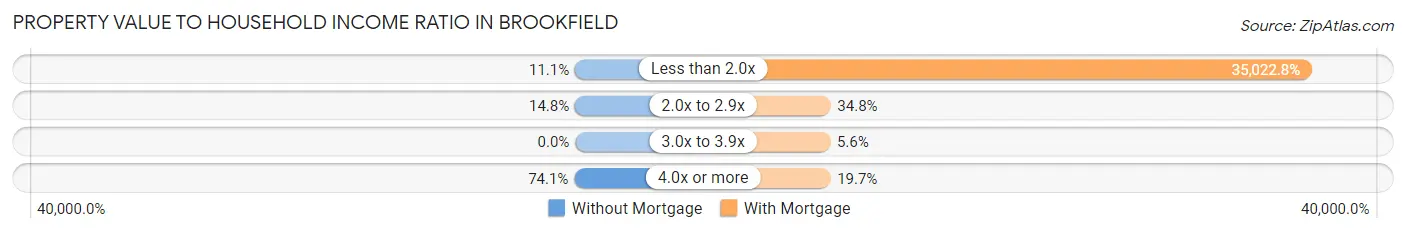
| Value-to-Income Ratio | Without Mortgage | With Mortgage |
| Less than 2.0x | 6 (11.1%) | 81,603 (35,022.8%) |
| 2.0x to 2.9x | 8 (14.8%) | 81 (34.8%) |
| 3.0x to 3.9x | 0 (0.0%) | 13 (5.6%) |
| 4.0x or more | 40 (74.1%) | 46 (19.7%) |
| Total | 54 (100.0%) | 233 (100.0%) |
Real Estate Taxes by Mortgage Status in Brookfield
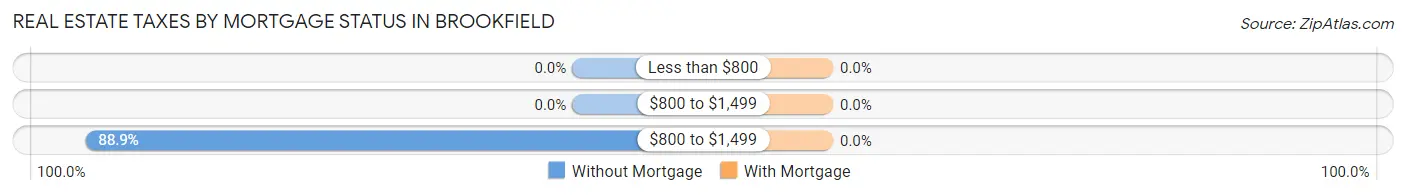
| Property Taxes | Without Mortgage | With Mortgage |
| Less than $800 | 0 (0.0%) | 0 (0.0%) |
| $800 to $1,499 | 0 (0.0%) | 0 (0.0%) |
| $800 to $1,499 | 48 (88.9%) | 0 (0.0%) |
| Total | 54 (100.0%) | 233 (100.0%) |
Health & Disability in Brookfield
Health Insurance Coverage by Age in Brookfield
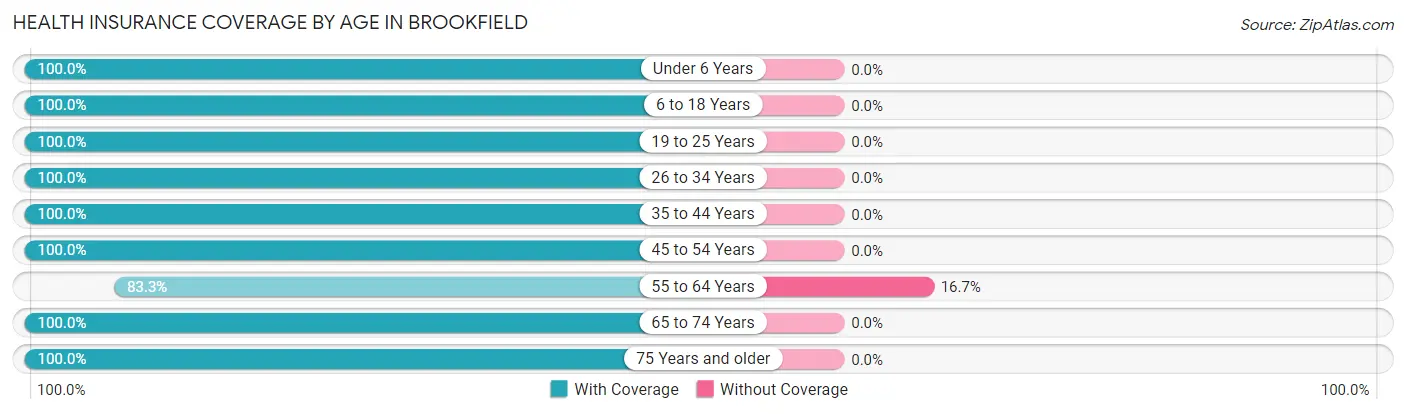
| Age Bracket | With Coverage | Without Coverage |
| Under 6 Years | 49 (100.0%) | 0 (0.0%) |
| 6 to 18 Years | 167 (100.0%) | 0 (0.0%) |
| 19 to 25 Years | 86 (100.0%) | 0 (0.0%) |
| 26 to 34 Years | 170 (100.0%) | 0 (0.0%) |
| 35 to 44 Years | 125 (100.0%) | 0 (0.0%) |
| 45 to 54 Years | 152 (100.0%) | 0 (0.0%) |
| 55 to 64 Years | 40 (83.3%) | 8 (16.7%) |
| 65 to 74 Years | 106 (100.0%) | 0 (0.0%) |
| 75 Years and older | 45 (100.0%) | 0 (0.0%) |
| Total | 940 (99.2%) | 8 (0.8%) |
Health Insurance Coverage by Citizenship Status in Brookfield
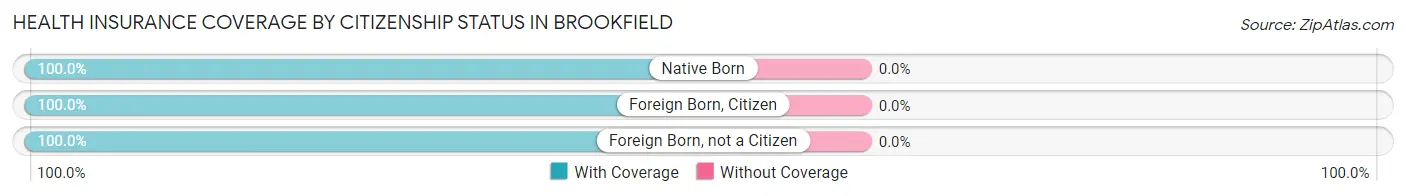
| Citizenship Status | With Coverage | Without Coverage |
| Native Born | 49 (100.0%) | 0 (0.0%) |
| Foreign Born, Citizen | 167 (100.0%) | 0 (0.0%) |
| Foreign Born, not a Citizen | 86 (100.0%) | 0 (0.0%) |
Health Insurance Coverage by Household Income in Brookfield
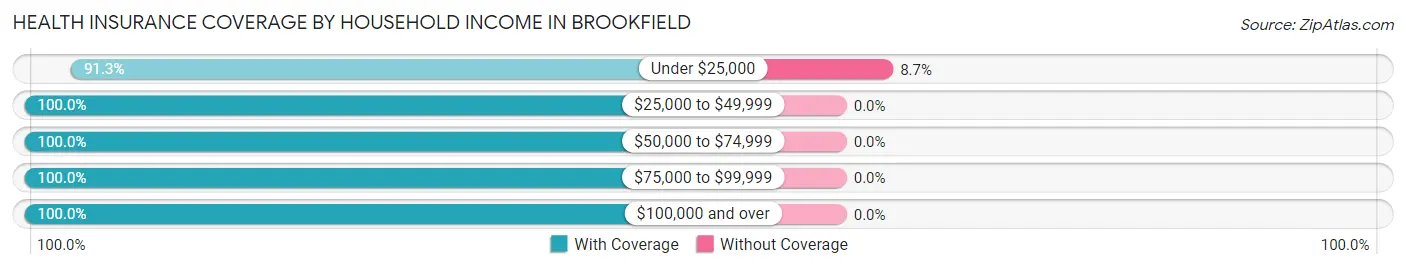
| Household Income | With Coverage | Without Coverage |
| Under $25,000 | 84 (91.3%) | 8 (8.7%) |
| $25,000 to $49,999 | 49 (100.0%) | 0 (0.0%) |
| $50,000 to $74,999 | 222 (100.0%) | 0 (0.0%) |
| $75,000 to $99,999 | 161 (100.0%) | 0 (0.0%) |
| $100,000 and over | 424 (100.0%) | 0 (0.0%) |
Public vs Private Health Insurance Coverage by Age in Brookfield
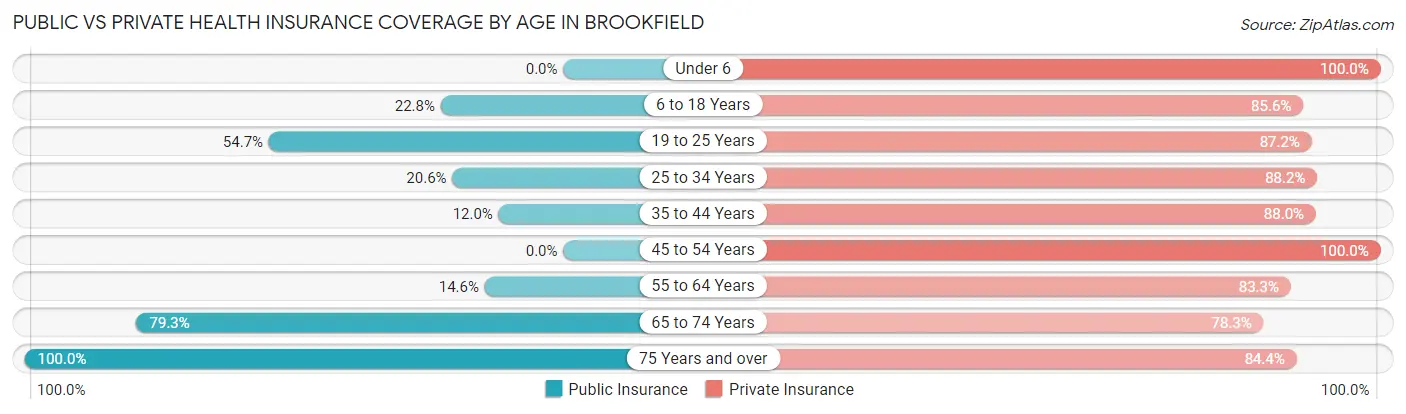
| Age Bracket | Public Insurance | Private Insurance |
| Under 6 | 0 (0.0%) | 49 (100.0%) |
| 6 to 18 Years | 38 (22.8%) | 143 (85.6%) |
| 19 to 25 Years | 47 (54.6%) | 75 (87.2%) |
| 25 to 34 Years | 35 (20.6%) | 150 (88.2%) |
| 35 to 44 Years | 15 (12.0%) | 110 (88.0%) |
| 45 to 54 Years | 0 (0.0%) | 152 (100.0%) |
| 55 to 64 Years | 7 (14.6%) | 40 (83.3%) |
| 65 to 74 Years | 84 (79.2%) | 83 (78.3%) |
| 75 Years and over | 45 (100.0%) | 38 (84.4%) |
| Total | 271 (28.6%) | 840 (88.6%) |
Disability Status by Sex by Age in Brookfield
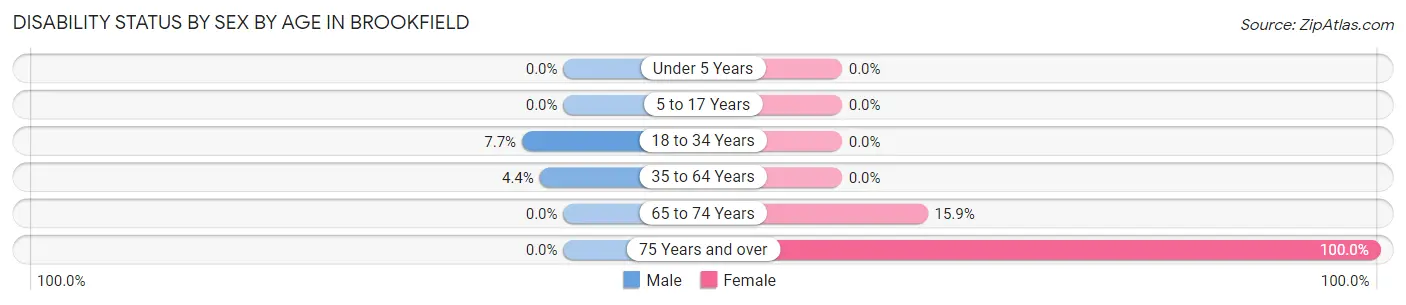
| Age Bracket | Male | Female |
| Under 5 Years | 0 (0.0%) | 0 (0.0%) |
| 5 to 17 Years | 0 (0.0%) | 0 (0.0%) |
| 18 to 34 Years | 9 (7.7%) | 0 (0.0%) |
| 35 to 64 Years | 9 (4.4%) | 0 (0.0%) |
| 65 to 74 Years | 0 (0.0%) | 7 (15.9%) |
| 75 Years and over | 0 (0.0%) | 45 (100.0%) |
Disability Class by Sex by Age in Brookfield
Disability Class: Hearing Difficulty
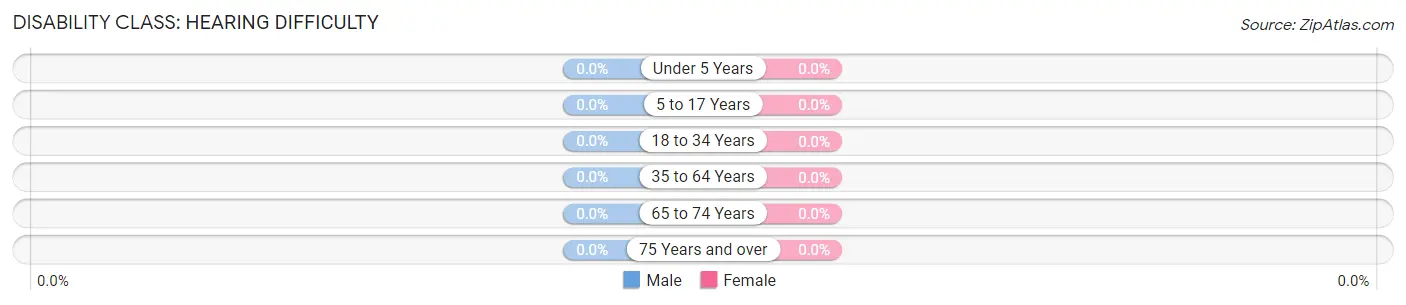
| Age Bracket | Male | Female |
| Under 5 Years | 0 (0.0%) | 0 (0.0%) |
| 5 to 17 Years | 0 (0.0%) | 0 (0.0%) |
| 18 to 34 Years | 0 (0.0%) | 0 (0.0%) |
| 35 to 64 Years | 0 (0.0%) | 0 (0.0%) |
| 65 to 74 Years | 0 (0.0%) | 0 (0.0%) |
| 75 Years and over | 0 (0.0%) | 0 (0.0%) |
Disability Class: Vision Difficulty
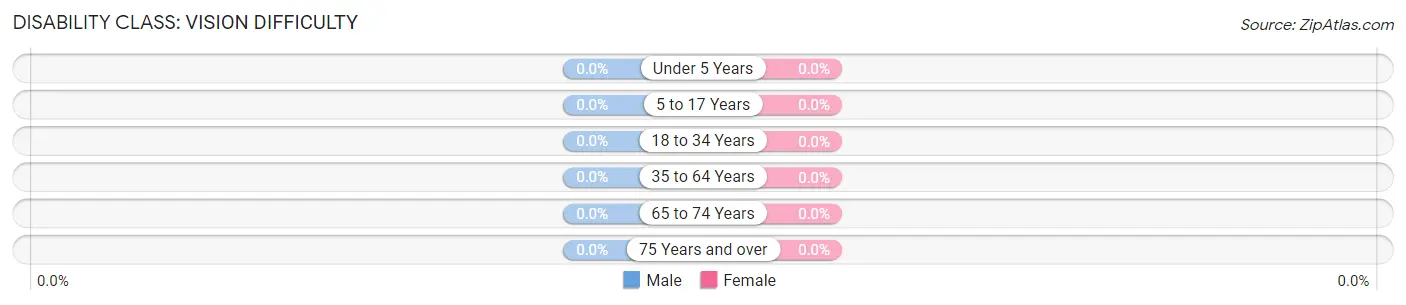
| Age Bracket | Male | Female |
| Under 5 Years | 0 (0.0%) | 0 (0.0%) |
| 5 to 17 Years | 0 (0.0%) | 0 (0.0%) |
| 18 to 34 Years | 0 (0.0%) | 0 (0.0%) |
| 35 to 64 Years | 0 (0.0%) | 0 (0.0%) |
| 65 to 74 Years | 0 (0.0%) | 0 (0.0%) |
| 75 Years and over | 0 (0.0%) | 0 (0.0%) |
Disability Class: Cognitive Difficulty
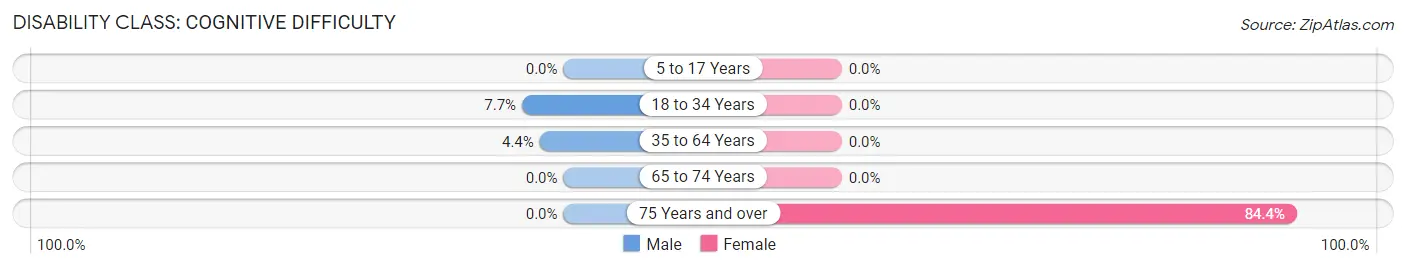
| Age Bracket | Male | Female |
| 5 to 17 Years | 0 (0.0%) | 0 (0.0%) |
| 18 to 34 Years | 9 (7.7%) | 0 (0.0%) |
| 35 to 64 Years | 9 (4.4%) | 0 (0.0%) |
| 65 to 74 Years | 0 (0.0%) | 0 (0.0%) |
| 75 Years and over | 0 (0.0%) | 38 (84.4%) |
Disability Class: Ambulatory Difficulty
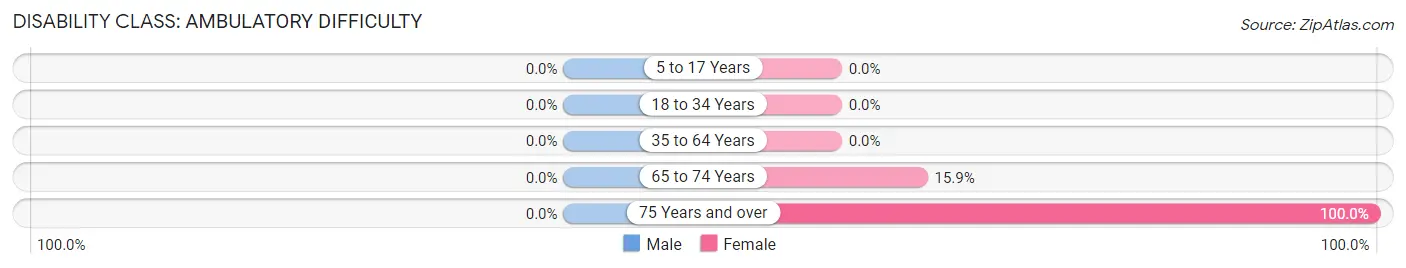
| Age Bracket | Male | Female |
| 5 to 17 Years | 0 (0.0%) | 0 (0.0%) |
| 18 to 34 Years | 0 (0.0%) | 0 (0.0%) |
| 35 to 64 Years | 0 (0.0%) | 0 (0.0%) |
| 65 to 74 Years | 0 (0.0%) | 7 (15.9%) |
| 75 Years and over | 0 (0.0%) | 45 (100.0%) |
Disability Class: Self-Care Difficulty
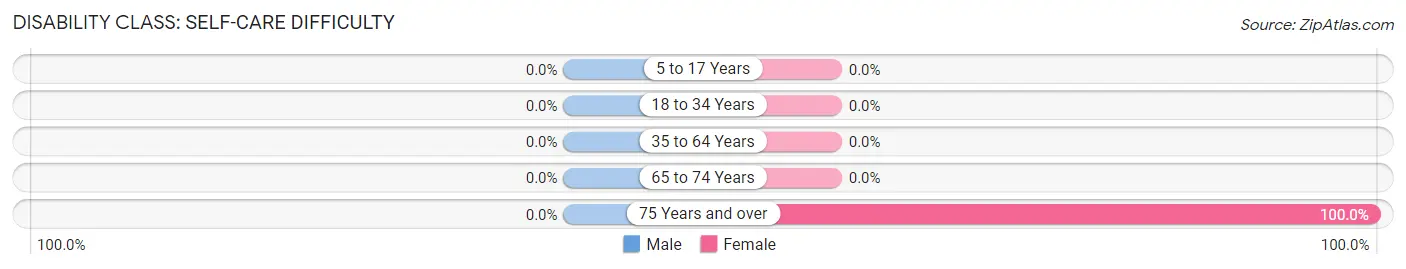
| Age Bracket | Male | Female |
| 5 to 17 Years | 0 (0.0%) | 0 (0.0%) |
| 18 to 34 Years | 0 (0.0%) | 0 (0.0%) |
| 35 to 64 Years | 0 (0.0%) | 0 (0.0%) |
| 65 to 74 Years | 0 (0.0%) | 0 (0.0%) |
| 75 Years and over | 0 (0.0%) | 45 (100.0%) |
Technology Access in Brookfield
Computing Device Access in Brookfield
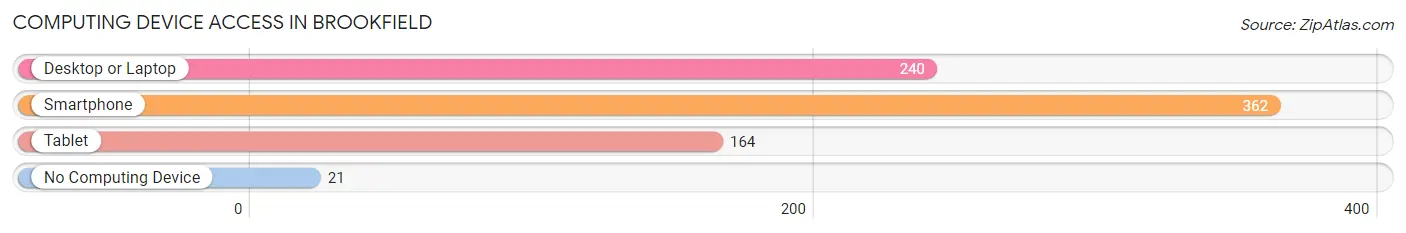
| Device Type | # Households | % Households |
| Desktop or Laptop | 240 | 61.4% |
| Smartphone | 362 | 92.6% |
| Tablet | 164 | 41.9% |
| No Computing Device | 21 | 5.4% |
| Total | 391 | 100.0% |
Internet Access in Brookfield
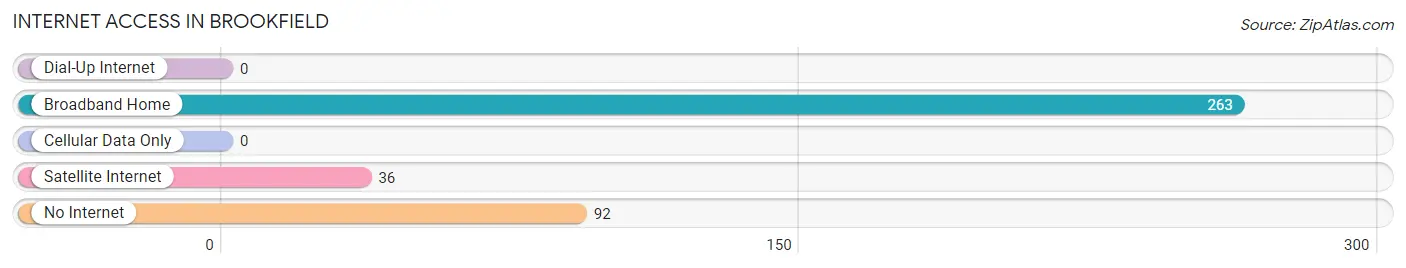
| Internet Type | # Households | % Households |
| Dial-Up Internet | 0 | 0.0% |
| Broadband Home | 263 | 67.3% |
| Cellular Data Only | 0 | 0.0% |
| Satellite Internet | 36 | 9.2% |
| No Internet | 92 | 23.5% |
| Total | 391 | 100.0% |
Brookfield Summary
Brookfield is a town located in Worcester County, Massachusetts, United States. It is situated in the western part of the state, about 25 miles west of Worcester. The population was 3,845 at the 2010 census.
History
The area that is now Brookfield was first settled in 1720 by a group of settlers from Mendon, Massachusetts. The town was officially incorporated in 1765 and was named after the brook that ran through the area.
In the early 19th century, Brookfield was a thriving agricultural community. The town was known for its dairy farms and apple orchards. In the late 19th century, the town began to industrialize, with the opening of several mills and factories.
Geography
Brookfield is located in western Worcester County, about 25 miles west of Worcester. It is bordered by the towns of North Brookfield to the north, East Brookfield to the east, West Brookfield to the west, and Charlton to the south.
The town is located in the Blackstone River Valley, with the Blackstone River running through the center of town. The town is mostly rural, with a few small villages scattered throughout.
The highest point in Brookfield is the summit of East Hill, at an elevation of 845 feet above sea level.
Economy
The economy of Brookfield is largely based on agriculture and manufacturing. The town is home to several dairy farms, apple orchards, and other agricultural operations.
The town is also home to several manufacturing companies, including a plastics manufacturer, a paper mill, and a metal fabrication plant.
Demographics
As of the 2010 census, there were 3,845 people, 1,541 households, and 1,093 families residing in the town. The population density was 166.2 people per square mile. There were 1,637 housing units at an average density of 70.2 per square mile.
The racial makeup of the town was 97.2% White, 0.7% African American, 0.2% Native American, 0.3% Asian, 0.1% Pacific Islander, 0.4% from other races, and 1.1% from two or more races. Hispanic or Latino of any race were 1.3% of the population.
There were 1,541 households, out of which 33.2% had children under the age of 18 living with them, 54.2% were married couples living together, 11.2% had a female householder with no husband present, and 29.2% were non-families. 24.2% of all households were made up of individuals, and 10.2% had someone living alone who was 65 years of age or older. The average household size was 2.51 and the average family size was 2.97.
In the town, the population was spread out, with 25.2% under the age of 18, 6.2% from 18 to 24, 29.2% from 25 to 44, 25.2% from 45 to 64, and 14.2% who were 65 years of age or older. The median age was 39 years. For every 100 females, there were 97.2 males. For every 100 females age 18 and over, there were 94.2 males.
The median income for a household in the town was $50,938, and the median income for a family was $58,906. Males had a median income of $41,964 versus $30,917 for females. The per capita income for the town was $23,945. About 4.2% of families and 5.7% of the population were below the poverty line, including 6.3% of those under age 18 and 6.2% of those age 65 or over.
Common Questions
What is Per Capita Income in Brookfield?
Per Capita income in Brookfield is $31,394.
What is the Median Family Income in Brookfield?
Median Family Income in Brookfield is $98,750.
What is the Median Household income in Brookfield?
Median Household Income in Brookfield is $68,299.
What is Income or Wage Gap in Brookfield?
Income or Wage Gap in Brookfield is 25.6%.
Women in Brookfield earn 74.4 cents for every dollar earned by a man.
What is Inequality or Gini Index in Brookfield?
Inequality or Gini Index in Brookfield is 0.40.
What is the Total Population of Brookfield?
Total Population of Brookfield is 948.
What is the Total Male Population of Brookfield?
Total Male Population of Brookfield is 461.
What is the Total Female Population of Brookfield?
Total Female Population of Brookfield is 487.
What is the Ratio of Males per 100 Females in Brookfield?
There are 94.66 Males per 100 Females in Brookfield.
What is the Ratio of Females per 100 Males in Brookfield?
There are 105.64 Females per 100 Males in Brookfield.
What is the Median Population Age in Brookfield?
Median Population Age in Brookfield is 38.0 Years.
What is the Average Family Size in Brookfield
Average Family Size in Brookfield is 3.6 People.
What is the Average Household Size in Brookfield
Average Household Size in Brookfield is 2.4 People.
How Large is the Labor Force in Brookfield?
There are 583 People in the Labor Forcein in Brookfield.
What is the Percentage of People in the Labor Force in Brookfield?
78.3% of People are in the Labor Force in Brookfield.
What is the Unemployment Rate in Brookfield?
Unemployment Rate in Brookfield is 2.7%.