Zip Codes with the Highest Percentage of Population Employed in Arts, Media & Entertainment in Fall River, MA
RELATED REPORTS & OPTIONS
Arts, Media & Entertainment
Fall River
Compare Zip Codes
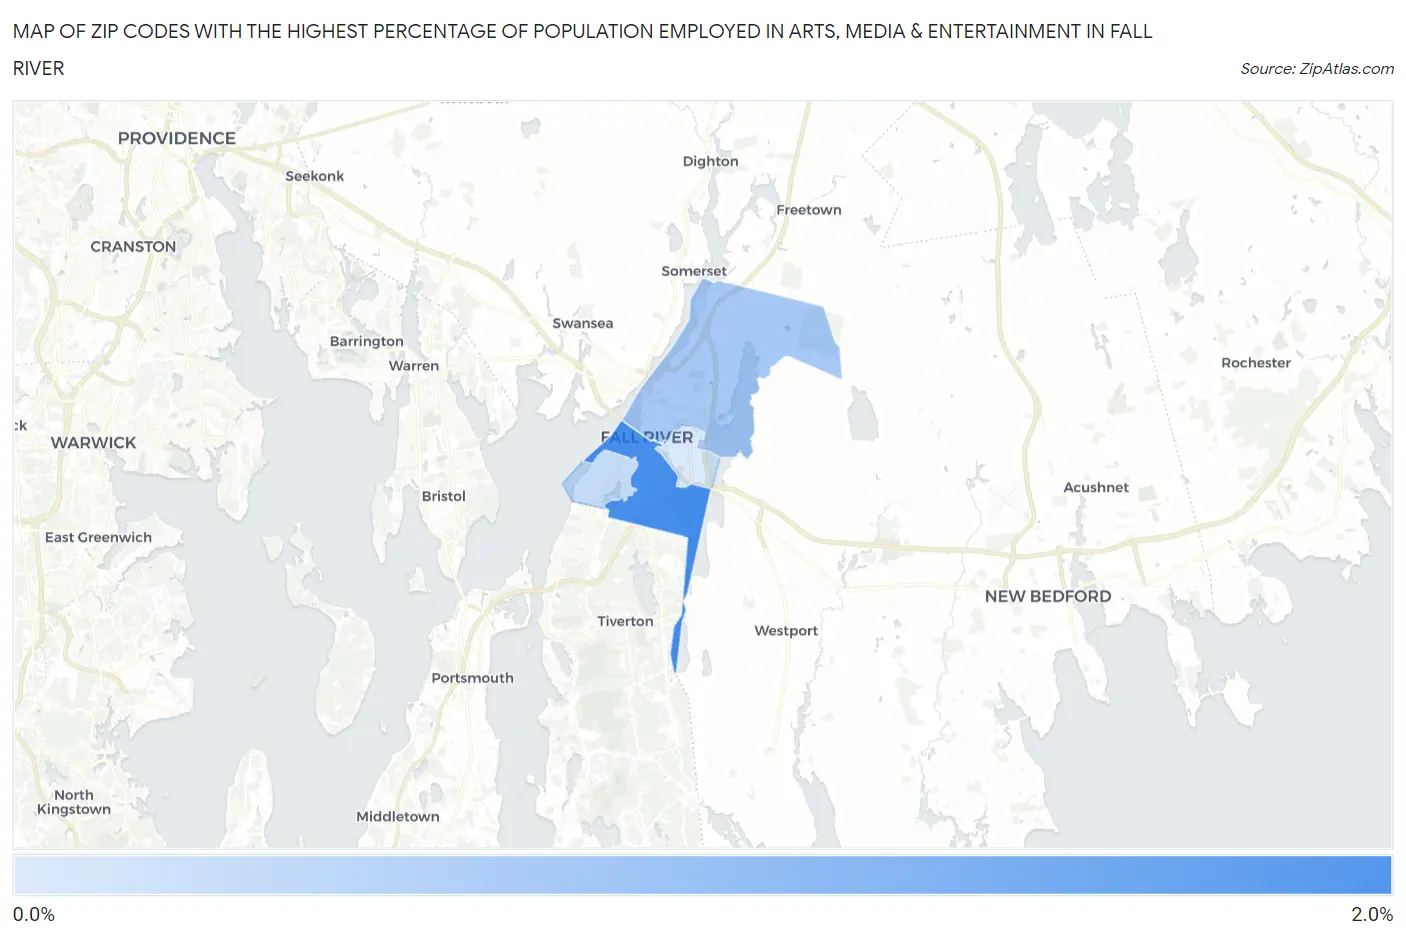
Map of Zip Codes with the Highest Percentage of Population Employed in Arts, Media & Entertainment in Fall River
0.52%
1.9%
Zip Codes with the Highest Percentage of Population Employed in Arts, Media & Entertainment in Fall River, MA
| Zip Code | % Employed | vs State | vs National | |
| 1. | 02721 | 1.9% | 2.4%(-0.503)#295 | 2.1%(-0.205)#8,640 |
| 2. | 02720 | 1.0% | 2.4%(-1.34)#417 | 2.1%(-1.04)#14,670 |
| 3. | 02724 | 0.72% | 2.4%(-1.64)#447 | 2.1%(-1.34)#17,045 |
| 4. | 02723 | 0.52% | 2.4%(-1.84)#461 | 2.1%(-1.54)#18,701 |
1
Common Questions
What are the Top 3 Zip Codes with the Highest Percentage of Population Employed in Arts, Media & Entertainment in Fall River, MA?
Top 3 Zip Codes with the Highest Percentage of Population Employed in Arts, Media & Entertainment in Fall River, MA are:
What zip code has the Highest Percentage of Population Employed in Arts, Media & Entertainment in Fall River, MA?
02721 has the Highest Percentage of Population Employed in Arts, Media & Entertainment in Fall River, MA with 1.9%.
What is the Percentage of Population Employed in Arts, Media & Entertainment in Fall River, MA?
Percentage of Population Employed in Arts, Media & Entertainment in Fall River is 1.1%.
What is the Percentage of Population Employed in Arts, Media & Entertainment in Massachusetts?
Percentage of Population Employed in Arts, Media & Entertainment in Massachusetts is 2.4%.
What is the Percentage of Population Employed in Arts, Media & Entertainment in the United States?
Percentage of Population Employed in Arts, Media & Entertainment in the United States is 2.1%.