Cities with the Lowest Male Poverty Level in Washington
RELATED REPORTS & OPTIONS
Lowest Poverty | Male
Washington
Compare Cities
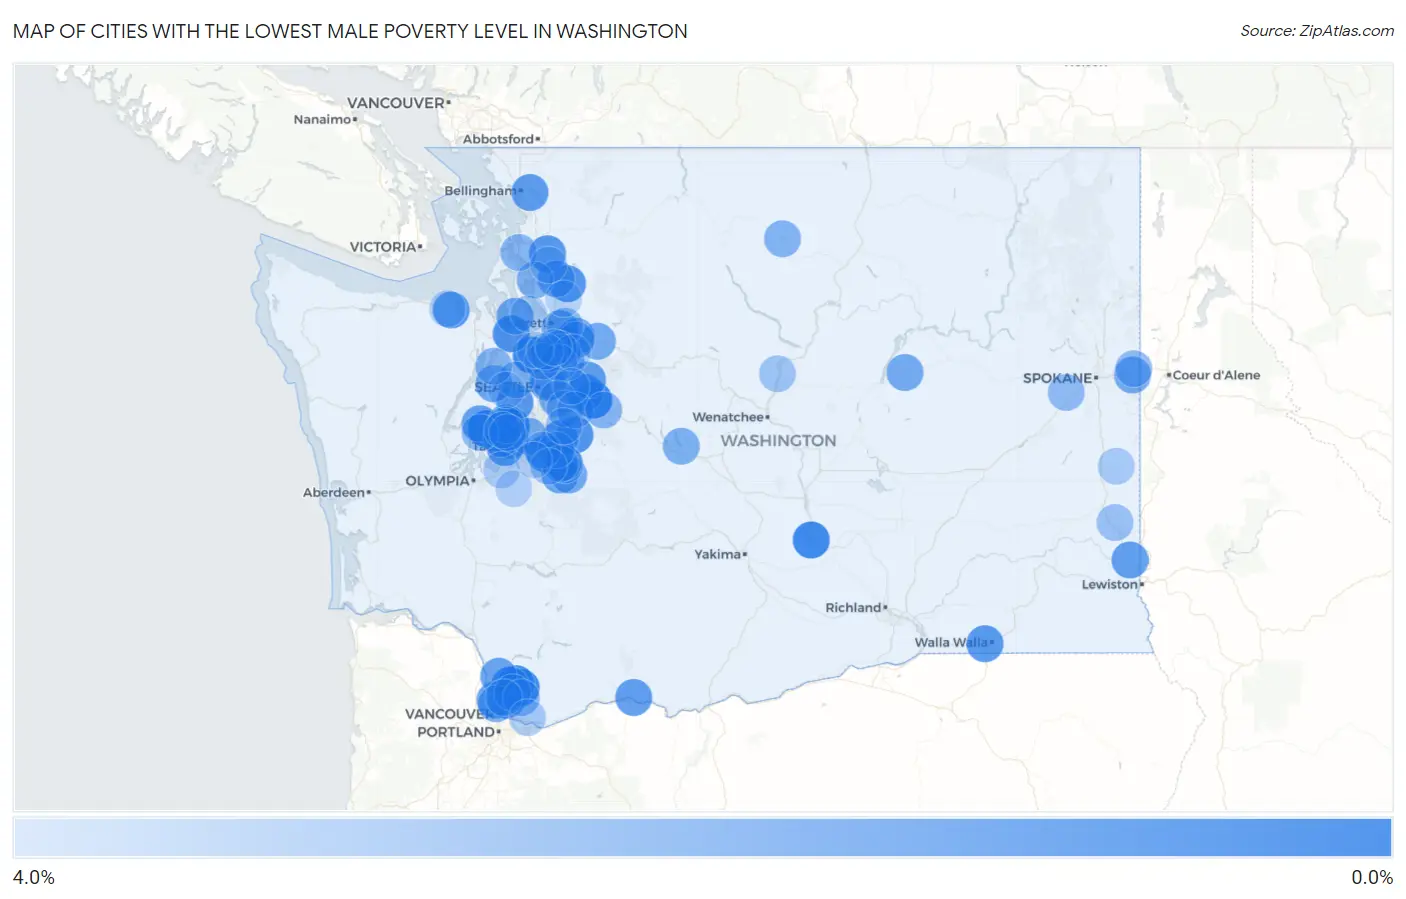
Map of Cities with the Lowest Male Poverty Level in Washington
4.0%
0.0%
Cities with the Lowest Male Poverty Level in Washington
| City | Male Poverty | vs State | vs National | |
| 1. | Maplewood | 0.12% | 9.0%(-8.83)#1 | 11.3%(-11.2)#11 |
| 2. | Snoqualmie | 0.13% | 9.0%(-8.82)#2 | 11.3%(-11.2)#15 |
| 3. | Vaughn | 0.14% | 9.0%(-8.81)#3 | 11.3%(-11.2)#16 |
| 4. | Clear Lake Cdp Pierce County | 0.17% | 9.0%(-8.78)#4 | 11.3%(-11.2)#25 |
| 5. | Woodway | 0.37% | 9.0%(-8.58)#5 | 11.3%(-11.0)#76 |
| 6. | Desert Aire | 0.38% | 9.0%(-8.57)#6 | 11.3%(-11.0)#84 |
| 7. | Venersborg | 0.40% | 9.0%(-8.55)#7 | 11.3%(-10.9)#91 |
| 8. | North Puyallup | 0.61% | 9.0%(-8.34)#8 | 11.3%(-10.7)#203 |
| 9. | Lewisville | 0.72% | 9.0%(-8.23)#9 | 11.3%(-10.6)#275 |
| 10. | Fall City | 0.75% | 9.0%(-8.20)#10 | 11.3%(-10.6)#302 |
| 11. | Hansville | 0.79% | 9.0%(-8.16)#11 | 11.3%(-10.6)#326 |
| 12. | Cherry Grove | 0.79% | 9.0%(-8.16)#12 | 11.3%(-10.6)#327 |
| 13. | Black Diamond | 0.83% | 9.0%(-8.13)#13 | 11.3%(-10.5)#357 |
| 14. | Wollochet | 0.86% | 9.0%(-8.09)#14 | 11.3%(-10.5)#379 |
| 15. | Lake Holm | 0.90% | 9.0%(-8.05)#15 | 11.3%(-10.4)#415 |
| 16. | Arlington Heights | 0.97% | 9.0%(-7.98)#16 | 11.3%(-10.4)#465 |
| 17. | Bell Hill | 1.0% | 9.0%(-7.93)#17 | 11.3%(-10.3)#503 |
| 18. | Big Lake | 1.0% | 9.0%(-7.91)#18 | 11.3%(-10.3)#513 |
| 19. | Garrett | 1.1% | 9.0%(-7.85)#19 | 11.3%(-10.2)#559 |
| 20. | Fox Island | 1.2% | 9.0%(-7.79)#20 | 11.3%(-10.2)#621 |
| 21. | Carnation | 1.2% | 9.0%(-7.77)#21 | 11.3%(-10.2)#646 |
| 22. | Southworth | 1.2% | 9.0%(-7.73)#22 | 11.3%(-10.1)#690 |
| 23. | Geneva | 1.2% | 9.0%(-7.72)#23 | 11.3%(-10.1)#691 |
| 24. | White Salmon | 1.3% | 9.0%(-7.69)#24 | 11.3%(-10.1)#722 |
| 25. | Cathcart | 1.3% | 9.0%(-7.66)#25 | 11.3%(-10.0)#741 |
| 26. | Felida | 1.3% | 9.0%(-7.62)#26 | 11.3%(-10.0)#785 |
| 27. | Colton | 1.3% | 9.0%(-7.61)#27 | 11.3%(-10.00)#794 |
| 28. | Allyn | 1.4% | 9.0%(-7.58)#28 | 11.3%(-9.97)#831 |
| 29. | Barberton | 1.5% | 9.0%(-7.49)#29 | 11.3%(-9.88)#902 |
| 30. | Fobes Hill | 1.5% | 9.0%(-7.47)#30 | 11.3%(-9.86)#922 |
| 31. | Clyde Hill | 1.5% | 9.0%(-7.46)#31 | 11.3%(-9.85)#929 |
| 32. | Crocker | 1.5% | 9.0%(-7.41)#32 | 11.3%(-9.80)#977 |
| 33. | La Center | 1.6% | 9.0%(-7.39)#33 | 11.3%(-9.78)#993 |
| 34. | Chain Lake | 1.6% | 9.0%(-7.31)#34 | 11.3%(-9.70)#1,071 |
| 35. | Bryant | 1.7% | 9.0%(-7.29)#35 | 11.3%(-9.68)#1,087 |
| 36. | Freeland | 1.7% | 9.0%(-7.29)#36 | 11.3%(-9.68)#1,092 |
| 37. | Purdy | 1.7% | 9.0%(-7.25)#37 | 11.3%(-9.64)#1,146 |
| 38. | Chico | 1.7% | 9.0%(-7.23)#38 | 11.3%(-9.62)#1,163 |
| 39. | Hartline | 1.8% | 9.0%(-7.15)#39 | 11.3%(-9.54)#1,259 |
| 40. | Liberty Lake | 1.8% | 9.0%(-7.15)#40 | 11.3%(-9.54)#1,262 |
| 41. | Sultan | 1.8% | 9.0%(-7.12)#41 | 11.3%(-9.51)#1,294 |
| 42. | Carbonado | 1.9% | 9.0%(-7.05)#42 | 11.3%(-9.44)#1,376 |
| 43. | Cottage Lake | 1.9% | 9.0%(-7.03)#43 | 11.3%(-9.42)#1,392 |
| 44. | South Prairie | 2.0% | 9.0%(-6.98)#44 | 11.3%(-9.37)#1,445 |
| 45. | Artondale | 2.0% | 9.0%(-6.98)#45 | 11.3%(-9.37)#1,449 |
| 46. | Lake Shore | 2.0% | 9.0%(-6.92)#46 | 11.3%(-9.31)#1,511 |
| 47. | Medina | 2.0% | 9.0%(-6.91)#47 | 11.3%(-9.30)#1,534 |
| 48. | Dash Point | 2.1% | 9.0%(-6.87)#48 | 11.3%(-9.26)#1,575 |
| 49. | Roslyn | 2.1% | 9.0%(-6.86)#49 | 11.3%(-9.25)#1,586 |
| 50. | Newcastle | 2.2% | 9.0%(-6.80)#50 | 11.3%(-9.19)#1,669 |
| 51. | Lexington | 2.2% | 9.0%(-6.78)#51 | 11.3%(-9.17)#1,697 |
| 52. | East Renton Highlands | 2.2% | 9.0%(-6.77)#52 | 11.3%(-9.16)#1,700 |
| 53. | Stanwood | 2.2% | 9.0%(-6.75)#53 | 11.3%(-9.14)#1,729 |
| 54. | Bothell East | 2.3% | 9.0%(-6.69)#54 | 11.3%(-9.08)#1,808 |
| 55. | Meadow Glade | 2.3% | 9.0%(-6.69)#55 | 11.3%(-9.08)#1,815 |
| 56. | Bainbridge Island | 2.3% | 9.0%(-6.68)#56 | 11.3%(-9.07)#1,832 |
| 57. | Winthrop | 2.3% | 9.0%(-6.65)#57 | 11.3%(-9.04)#1,864 |
| 58. | Hockinson | 2.3% | 9.0%(-6.63)#58 | 11.3%(-9.02)#1,890 |
| 59. | Monroe North | 2.4% | 9.0%(-6.59)#59 | 11.3%(-8.98)#1,926 |
| 60. | Mirrormont | 2.4% | 9.0%(-6.59)#60 | 11.3%(-8.98)#1,931 |
| 61. | Bangor Base | 2.4% | 9.0%(-6.58)#61 | 11.3%(-8.97)#1,951 |
| 62. | La Conner | 2.4% | 9.0%(-6.57)#62 | 11.3%(-8.96)#1,980 |
| 63. | Riverbend | 2.4% | 9.0%(-6.55)#63 | 11.3%(-8.94)#1,994 |
| 64. | Prairie Heights | 2.5% | 9.0%(-6.48)#64 | 11.3%(-8.87)#2,092 |
| 65. | Canterwood | 2.5% | 9.0%(-6.41)#65 | 11.3%(-8.80)#2,204 |
| 66. | Bunk Foss | 2.6% | 9.0%(-6.35)#66 | 11.3%(-8.74)#2,260 |
| 67. | Medical Lake | 2.6% | 9.0%(-6.34)#67 | 11.3%(-8.73)#2,267 |
| 68. | Prairie Ridge | 2.6% | 9.0%(-6.33)#68 | 11.3%(-8.72)#2,285 |
| 69. | Otis Orchards East Farms | 2.6% | 9.0%(-6.32)#69 | 11.3%(-8.71)#2,302 |
| 70. | Maltby | 2.7% | 9.0%(-6.29)#70 | 11.3%(-8.68)#2,351 |
| 71. | Grapeview | 2.7% | 9.0%(-6.25)#71 | 11.3%(-8.64)#2,386 |
| 72. | Bothell West | 2.8% | 9.0%(-6.18)#72 | 11.3%(-8.57)#2,484 |
| 73. | Albion | 2.9% | 9.0%(-6.08)#73 | 11.3%(-8.47)#2,613 |
| 74. | Lake Tapps | 2.9% | 9.0%(-6.07)#74 | 11.3%(-8.46)#2,623 |
| 75. | Edgewood | 3.0% | 9.0%(-5.98)#75 | 11.3%(-8.37)#2,743 |
| 76. | Rosedale | 3.0% | 9.0%(-5.98)#76 | 11.3%(-8.37)#2,756 |
| 77. | Entiat | 3.0% | 9.0%(-5.97)#77 | 11.3%(-8.36)#2,764 |
| 78. | Clearview | 3.0% | 9.0%(-5.92)#78 | 11.3%(-8.31)#2,856 |
| 79. | Woodinville | 3.0% | 9.0%(-5.90)#79 | 11.3%(-8.29)#2,878 |
| 80. | Tehaleh | 3.1% | 9.0%(-5.88)#80 | 11.3%(-8.27)#2,900 |
| 81. | Mcmillin | 3.1% | 9.0%(-5.87)#81 | 11.3%(-8.26)#2,913 |
| 82. | Gig Harbor | 3.2% | 9.0%(-5.75)#82 | 11.3%(-8.14)#3,070 |
| 83. | Mount Vista | 3.2% | 9.0%(-5.74)#83 | 11.3%(-8.13)#3,079 |
| 84. | Camas | 3.3% | 9.0%(-5.69)#84 | 11.3%(-8.08)#3,165 |
| 85. | Covington | 3.3% | 9.0%(-5.69)#85 | 11.3%(-8.08)#3,178 |
| 86. | Oakesdale | 3.3% | 9.0%(-5.66)#86 | 11.3%(-8.05)#3,213 |
| 87. | Dupont | 3.3% | 9.0%(-5.61)#87 | 11.3%(-8.00)#3,296 |
| 88. | Lake Forest Park | 3.4% | 9.0%(-5.58)#88 | 11.3%(-7.97)#3,336 |
| 89. | Edmonds | 3.4% | 9.0%(-5.55)#89 | 11.3%(-7.94)#3,387 |
| 90. | Langley | 3.4% | 9.0%(-5.51)#90 | 11.3%(-7.90)#3,442 |
| 91. | High Bridge | 3.5% | 9.0%(-5.48)#91 | 11.3%(-7.87)#3,491 |
| 92. | Alderwood Manor | 3.5% | 9.0%(-5.48)#92 | 11.3%(-7.87)#3,498 |
| 93. | Lake Mcmurray | 3.5% | 9.0%(-5.46)#93 | 11.3%(-7.85)#3,520 |
| 94. | River Road | 3.5% | 9.0%(-5.44)#94 | 11.3%(-7.83)#3,555 |
| 95. | Sammamish | 3.5% | 9.0%(-5.42)#95 | 11.3%(-7.81)#3,571 |
| 96. | Roy | 3.6% | 9.0%(-5.36)#96 | 11.3%(-7.75)#3,674 |
| 97. | Summit | 3.6% | 9.0%(-5.35)#97 | 11.3%(-7.74)#3,685 |
| 98. | Sisco Heights | 3.6% | 9.0%(-5.31)#98 | 11.3%(-7.70)#3,725 |
| 99. | Enetai | 3.7% | 9.0%(-5.25)#99 | 11.3%(-7.64)#3,821 |
| 100. | Mill Creek East | 3.7% | 9.0%(-5.23)#100 | 11.3%(-7.62)#3,851 |
Common Questions
What are the Top 10 Cities with the Lowest Male Poverty Level in Washington?
Top 10 Cities with the Lowest Male Poverty Level in Washington are:
#1
0.12%
#2
0.13%
#3
0.14%
#4
0.37%
#5
0.38%
#6
0.40%
#7
0.61%
#8
0.72%
#9
0.75%
#10
0.79%
What city has the Lowest Male Poverty Level in Washington?
Maplewood has the Lowest Male Poverty Level in Washington with 0.12%.
What is the Poverty Level Among Males in the State of Washington?
Poverty Level Among Males in Washington is 9.0%.
What is the Poverty Level Among Males in the United States?
Poverty Level Among Males in the United States is 11.3%.