Whitinsville, MA Map & Demographics
Whitinsville Map
Whitinsville Overview
$44,816
PER CAPITA INCOME
$124,422
AVG FAMILY INCOME
$88,750
AVG HOUSEHOLD INCOME
42.2%
WAGE / INCOME GAP [ % ]
57.8¢/ $1
WAGE / INCOME GAP [ $ ]
0.42
INEQUALITY / GINI INDEX
7,273
TOTAL POPULATION
3,309
MALE POPULATION
3,964
FEMALE POPULATION
83.48
MALES / 100 FEMALES
119.79
FEMALES / 100 MALES
38.1
MEDIAN AGE
3.0
AVG FAMILY SIZE
2.5
AVG HOUSEHOLD SIZE
4,163
LABOR FORCE [ PEOPLE ]
71.9%
PERCENT IN LABOR FORCE
4.8%
UNEMPLOYMENT RATE
Whitinsville Zip Codes
Income in Whitinsville
Income Overview in Whitinsville
Per Capita Income in Whitinsville is $44,816, while median incomes of families and households are $124,422 and $88,750 respectively.
| Characteristic | Number | Measure |
| Per Capita Income | 7,273 | $44,816 |
| Median Family Income | 2,003 | $124,422 |
| Mean Family Income | 2,003 | $136,842 |
| Median Household Income | 2,830 | $88,750 |
| Mean Household Income | 2,830 | $114,683 |
| Income Deficit | 2,003 | $0 |
| Wage / Income Gap (%) | 7,273 | 42.24% |
| Wage / Income Gap ($) | 7,273 | 57.76¢ per $1 |
| Gini / Inequality Index | 7,273 | 0.42 |
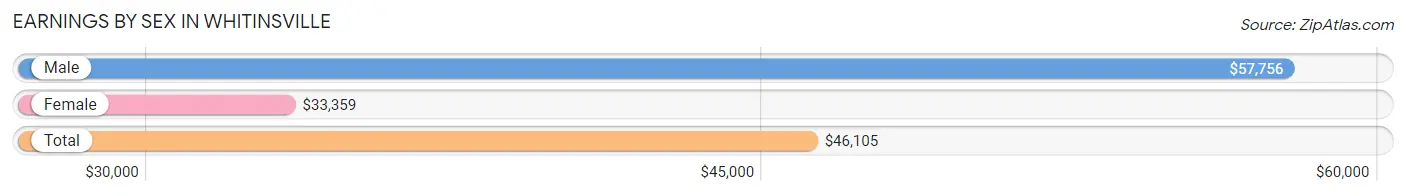
Earnings by Sex in Whitinsville
Average Earnings in Whitinsville are $46,105, $57,756 for men and $33,359 for women, a difference of 42.2%.
| Sex | Number | Average Earnings |
| Male | 2,122 (49.8%) | $57,756 |
| Female | 2,140 (50.2%) | $33,359 |
| Total | 4,262 (100.0%) | $46,105 |
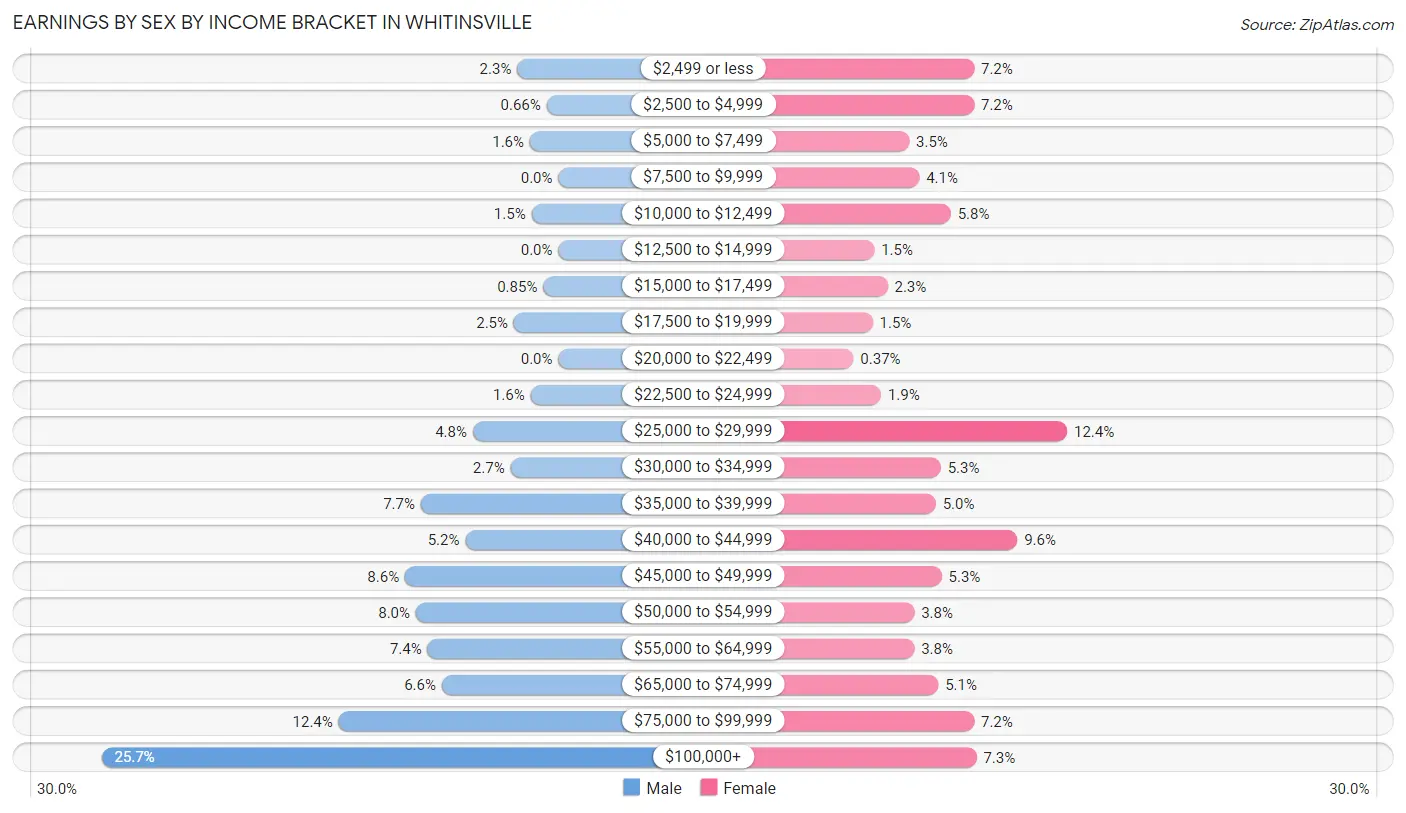
Earnings by Sex by Income Bracket in Whitinsville
The most common earnings brackets in Whitinsville are $100,000+ for men (545 | 25.7%) and $25,000 to $29,999 for women (265 | 12.4%).
| Income | Male | Female |
| $2,499 or less | 49 (2.3%) | 153 (7.1%) |
| $2,500 to $4,999 | 14 (0.7%) | 153 (7.1%) |
| $5,000 to $7,499 | 34 (1.6%) | 75 (3.5%) |
| $7,500 to $9,999 | 0 (0.0%) | 87 (4.1%) |
| $10,000 to $12,499 | 32 (1.5%) | 125 (5.8%) |
| $12,500 to $14,999 | 0 (0.0%) | 33 (1.5%) |
| $15,000 to $17,499 | 18 (0.9%) | 49 (2.3%) |
| $17,500 to $19,999 | 53 (2.5%) | 31 (1.5%) |
| $20,000 to $22,499 | 0 (0.0%) | 8 (0.4%) |
| $22,500 to $24,999 | 33 (1.6%) | 41 (1.9%) |
| $25,000 to $29,999 | 102 (4.8%) | 265 (12.4%) |
| $30,000 to $34,999 | 57 (2.7%) | 113 (5.3%) |
| $35,000 to $39,999 | 164 (7.7%) | 107 (5.0%) |
| $40,000 to $44,999 | 111 (5.2%) | 205 (9.6%) |
| $45,000 to $49,999 | 183 (8.6%) | 114 (5.3%) |
| $50,000 to $54,999 | 170 (8.0%) | 81 (3.8%) |
| $55,000 to $64,999 | 156 (7.3%) | 81 (3.8%) |
| $65,000 to $74,999 | 139 (6.6%) | 110 (5.1%) |
| $75,000 to $99,999 | 262 (12.3%) | 153 (7.1%) |
| $100,000+ | 545 (25.7%) | 156 (7.3%) |
| Total | 2,122 (100.0%) | 2,140 (100.0%) |
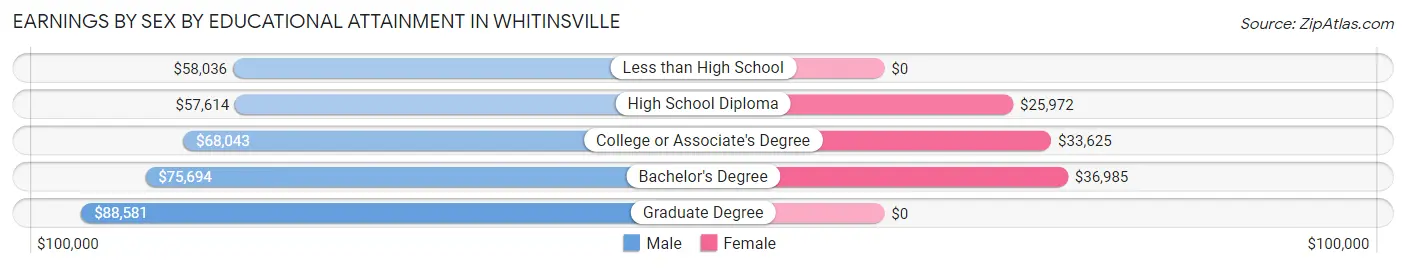
Earnings by Sex by Educational Attainment in Whitinsville
Average earnings in Whitinsville are $64,964 for men and $33,997 for women, a difference of 47.7%. Men with an educational attainment of graduate degree enjoy the highest average annual earnings of $88,581, while those with high school diploma education earn the least with $57,614. Women with an educational attainment of bachelor's degree earn the most with the average annual earnings of $36,985, while those with high school diploma education have the smallest earnings of $25,972.
| Educational Attainment | Male Income | Female Income |
| Less than High School | $58,036 | $0 |
| High School Diploma | $57,614 | $25,972 |
| College or Associate's Degree | $68,043 | $33,625 |
| Bachelor's Degree | $75,694 | $36,985 |
| Graduate Degree | $88,581 | $0 |
| Total | $64,964 | $33,997 |
Family Income in Whitinsville
Family Income Brackets in Whitinsville
According to the Whitinsville family income data, there are 405 families falling into the $150,000 to $199,999 income range, which is the most common income bracket and makes up 20.2% of all families. Conversely, the $15,000 to $24,999 income bracket is the least frequent group with only 18 families (0.9%) belonging to this category.
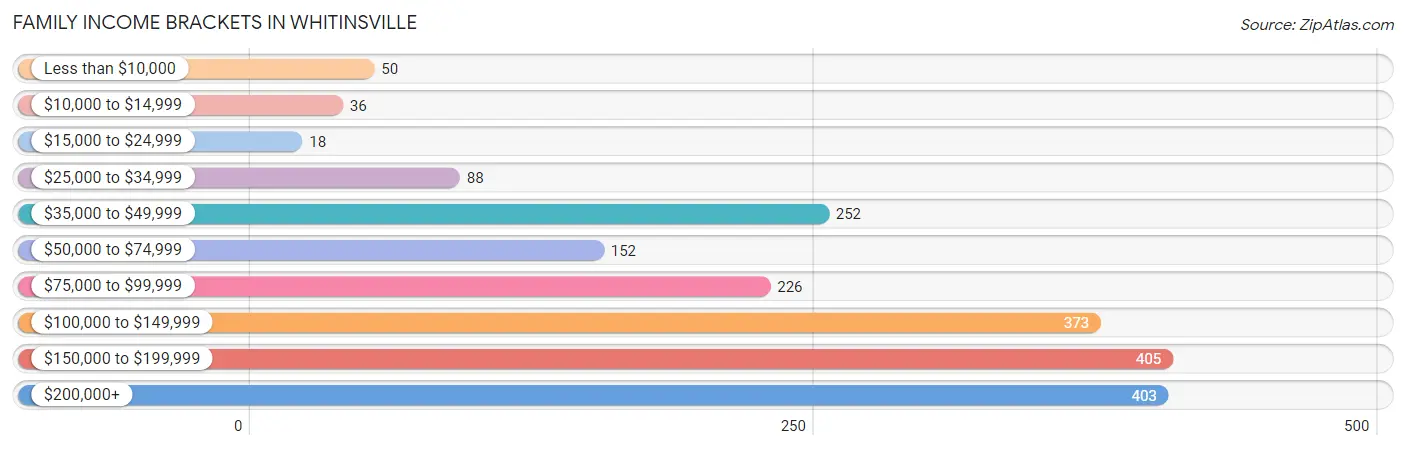
| Income Bracket | # Families | % Families |
| Less than $10,000 | 50 | 2.5% |
| $10,000 to $14,999 | 36 | 1.8% |
| $15,000 to $24,999 | 18 | 0.9% |
| $25,000 to $34,999 | 88 | 4.4% |
| $35,000 to $49,999 | 252 | 12.6% |
| $50,000 to $74,999 | 152 | 7.6% |
| $75,000 to $99,999 | 226 | 11.3% |
| $100,000 to $149,999 | 373 | 18.6% |
| $150,000 to $199,999 | 405 | 20.2% |
| $200,000+ | 403 | 20.1% |
Family Income by Famaliy Size in Whitinsville
5-person families (168 | 8.4%) account for the highest median family income in Whitinsville with $145,769 per family, while 2-person families (1,017 | 50.8%) have the highest median income of $51,283 per family member.
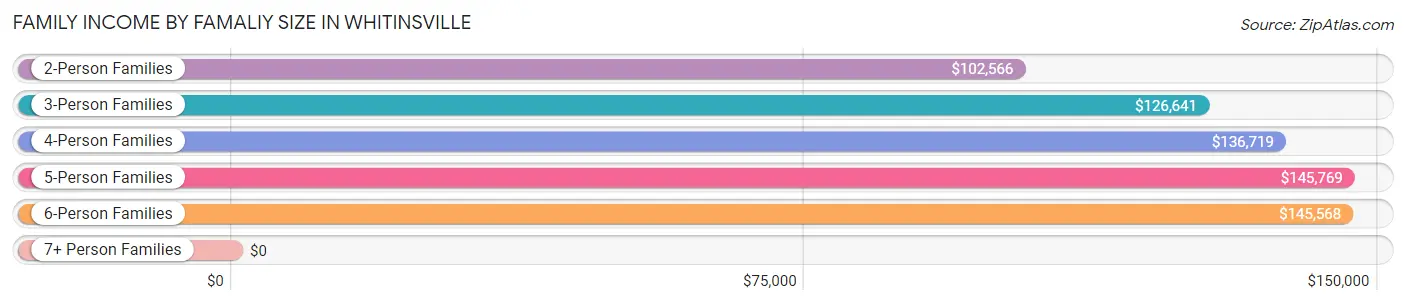
| Income Bracket | # Families | Median Income |
| 2-Person Families | 1,017 (50.8%) | $102,566 |
| 3-Person Families | 441 (22.0%) | $126,641 |
| 4-Person Families | 232 (11.6%) | $136,719 |
| 5-Person Families | 168 (8.4%) | $145,769 |
| 6-Person Families | 120 (6.0%) | $145,568 |
| 7+ Person Families | 25 (1.3%) | $0 |
| Total | 2,003 (100.0%) | $124,422 |
Family Income by Number of Earners in Whitinsville
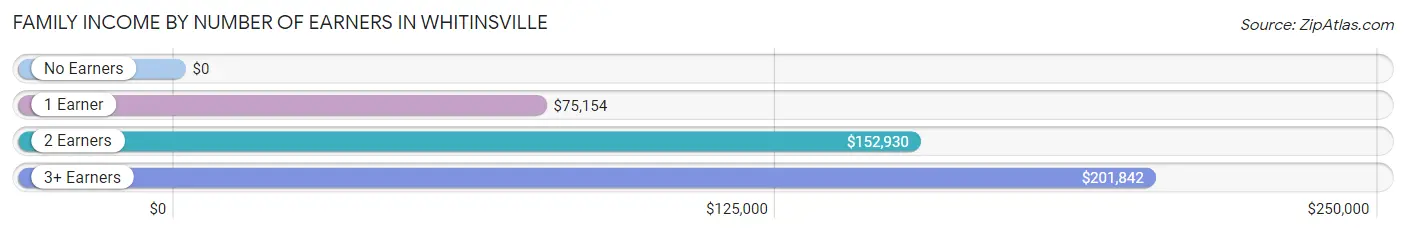
| Number of Earners | # Families | Median Income |
| No Earners | 160 (8.0%) | $0 |
| 1 Earner | 578 (28.9%) | $75,154 |
| 2 Earners | 1,109 (55.4%) | $152,930 |
| 3+ Earners | 156 (7.8%) | $201,842 |
| Total | 2,003 (100.0%) | $124,422 |
Household Income in Whitinsville
Household Income Brackets in Whitinsville
With 509 households falling in the category, the $75,000 to $99,999 income range is the most frequent in Whitinsville, accounting for 18.0% of all households. In contrast, only 48 households (1.7%) fall into the $10,000 to $14,999 income bracket, making it the least populous group.
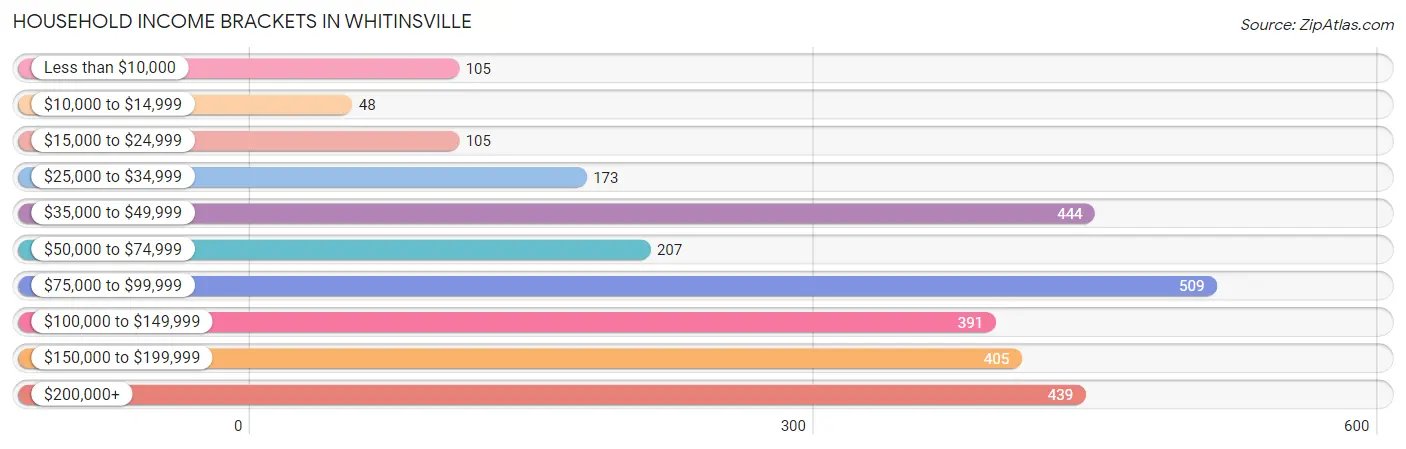
| Income Bracket | # Households | % Households |
| Less than $10,000 | 105 | 3.7% |
| $10,000 to $14,999 | 48 | 1.7% |
| $15,000 to $24,999 | 105 | 3.7% |
| $25,000 to $34,999 | 173 | 6.1% |
| $35,000 to $49,999 | 444 | 15.7% |
| $50,000 to $74,999 | 207 | 7.3% |
| $75,000 to $99,999 | 509 | 18.0% |
| $100,000 to $149,999 | 391 | 13.8% |
| $150,000 to $199,999 | 405 | 14.3% |
| $200,000+ | 439 | 15.5% |
Household Income by Householder Age in Whitinsville
The median household income in Whitinsville is $88,750, with the highest median household income of $134,904 found in the 45 to 64 years age bracket for the primary householder. A total of 1,189 households (42.0%) fall into this category. Meanwhile, the 15 to 24 years age bracket for the primary householder has the lowest median household income of $0, with 135 households (4.8%) in this group.
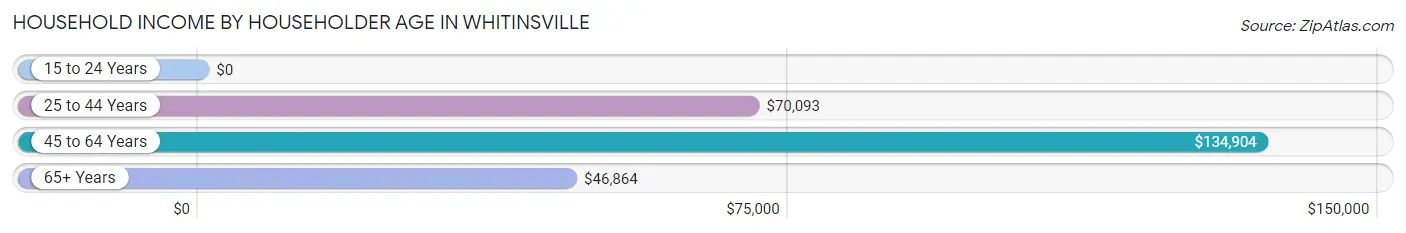
| Income Bracket | # Households | Median Income |
| 15 to 24 Years | 135 (4.8%) | $0 |
| 25 to 44 Years | 928 (32.8%) | $70,093 |
| 45 to 64 Years | 1,189 (42.0%) | $134,904 |
| 65+ Years | 578 (20.4%) | $46,864 |
| Total | 2,830 (100.0%) | $88,750 |
Poverty in Whitinsville
Income Below Poverty by Sex and Age in Whitinsville
With 3.5% poverty level for males and 14.0% for females among the residents of Whitinsville, 5 year old males and 12 to 14 year old females are the most vulnerable to poverty, with 36 males (100.0%) and 74 females (49.7%) in their respective age groups living below the poverty level.
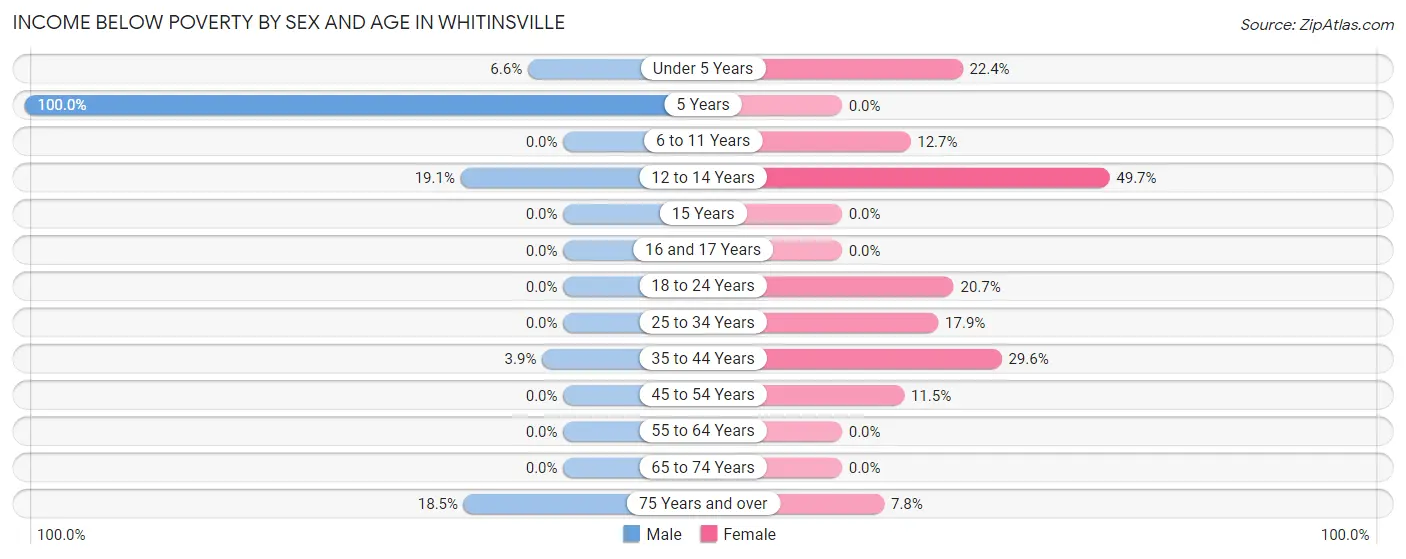
| Age Bracket | Male | Female |
| Under 5 Years | 12 (6.6%) | 60 (22.4%) |
| 5 Years | 36 (100.0%) | 0 (0.0%) |
| 6 to 11 Years | 0 (0.0%) | 38 (12.7%) |
| 12 to 14 Years | 20 (19.1%) | 74 (49.7%) |
| 15 Years | 0 (0.0%) | 0 (0.0%) |
| 16 and 17 Years | 0 (0.0%) | 0 (0.0%) |
| 18 to 24 Years | 0 (0.0%) | 101 (20.7%) |
| 25 to 34 Years | 0 (0.0%) | 83 (17.9%) |
| 35 to 44 Years | 18 (3.9%) | 123 (29.6%) |
| 45 to 54 Years | 0 (0.0%) | 54 (11.5%) |
| 55 to 64 Years | 0 (0.0%) | 0 (0.0%) |
| 65 to 74 Years | 0 (0.0%) | 0 (0.0%) |
| 75 Years and over | 29 (18.5%) | 12 (7.8%) |
| Total | 115 (3.5%) | 545 (14.0%) |
Income Above Poverty by Sex and Age in Whitinsville
According to the poverty statistics in Whitinsville, males aged 6 to 11 years and females aged 5 years are the age groups that are most secure financially, with 100.0% of males and 100.0% of females in these age groups living above the poverty line.
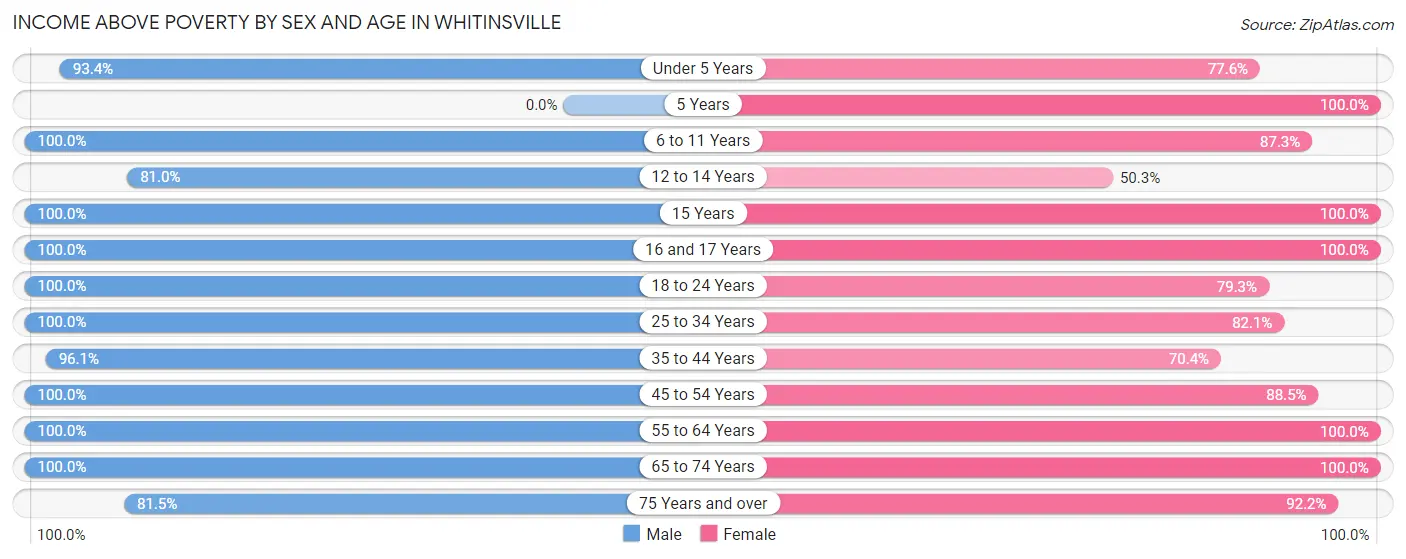
| Age Bracket | Male | Female |
| Under 5 Years | 171 (93.4%) | 208 (77.6%) |
| 5 Years | 0 (0.0%) | 132 (100.0%) |
| 6 to 11 Years | 217 (100.0%) | 261 (87.3%) |
| 12 to 14 Years | 85 (80.9%) | 75 (50.3%) |
| 15 Years | 50 (100.0%) | 44 (100.0%) |
| 16 and 17 Years | 46 (100.0%) | 82 (100.0%) |
| 18 to 24 Years | 229 (100.0%) | 386 (79.3%) |
| 25 to 34 Years | 467 (100.0%) | 381 (82.1%) |
| 35 to 44 Years | 441 (96.1%) | 292 (70.4%) |
| 45 to 54 Years | 427 (100.0%) | 414 (88.5%) |
| 55 to 64 Years | 605 (100.0%) | 523 (100.0%) |
| 65 to 74 Years | 301 (100.0%) | 400 (100.0%) |
| 75 Years and over | 128 (81.5%) | 141 (92.2%) |
| Total | 3,167 (96.5%) | 3,339 (86.0%) |
Income Below Poverty Among Married-Couple Families in Whitinsville
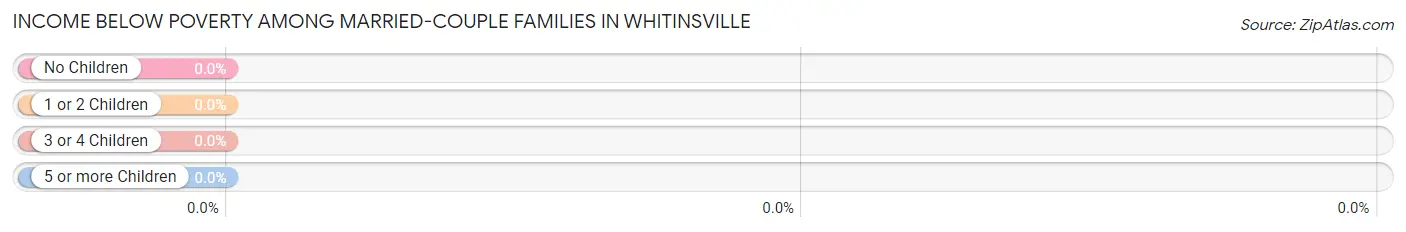
| Children | Above Poverty | Below Poverty |
| No Children | 878 (100.0%) | 0 (0.0%) |
| 1 or 2 Children | 393 (100.0%) | 0 (0.0%) |
| 3 or 4 Children | 135 (100.0%) | 0 (0.0%) |
| 5 or more Children | 0 (0.0%) | 0 (0.0%) |
| Total | 1,406 (100.0%) | 0 (0.0%) |
Income Below Poverty Among Single-Parent Households in Whitinsville
According to the poverty data in Whitinsville, 5.1% or 18 single-father households and 65.6% or 160 single-mother households are living below the poverty line. Among single-father households, those with 1 or 2 children have the highest poverty rate, with 18 households (7.2%) experiencing poverty. Likewise, among single-mother households, those with 1 or 2 children have the highest poverty rate, with 160 households (80.8%) falling below the poverty line.
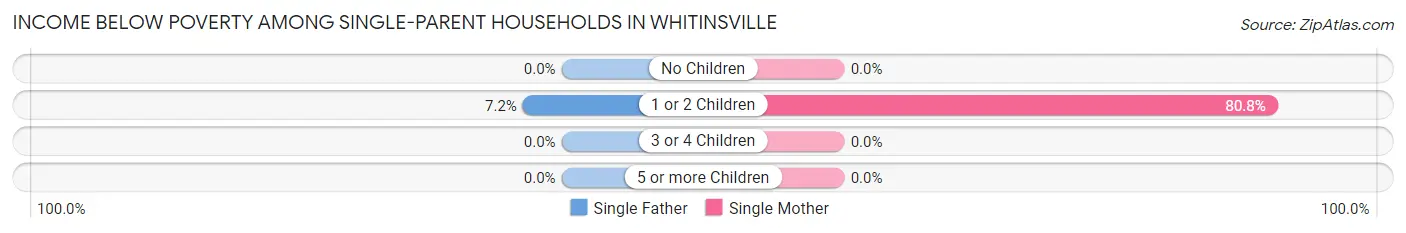
| Children | Single Father | Single Mother |
| No Children | 0 (0.0%) | 0 (0.0%) |
| 1 or 2 Children | 18 (7.2%) | 160 (80.8%) |
| 3 or 4 Children | 0 (0.0%) | 0 (0.0%) |
| 5 or more Children | 0 (0.0%) | 0 (0.0%) |
| Total | 18 (5.1%) | 160 (65.6%) |
Income Below Poverty Among Married-Couple vs Single-Parent Households in Whitinsville
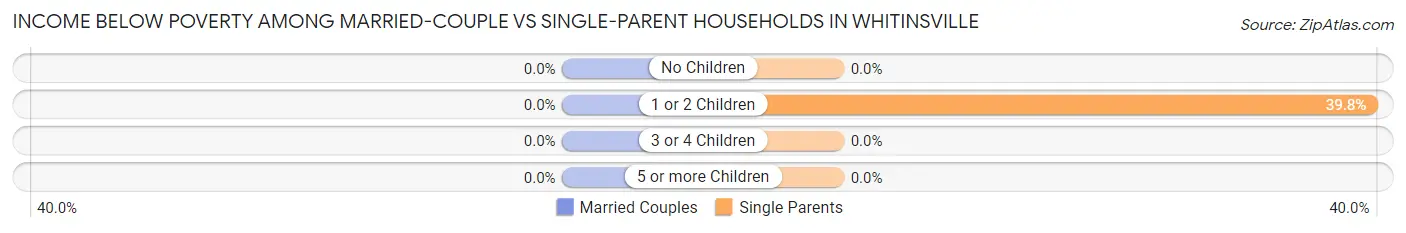
| Children | Married-Couple Families | Single-Parent Households |
| No Children | 0 (0.0%) | 0 (0.0%) |
| 1 or 2 Children | 0 (0.0%) | 178 (39.8%) |
| 3 or 4 Children | 0 (0.0%) | 0 (0.0%) |
| 5 or more Children | 0 (0.0%) | 0 (0.0%) |
| Total | 0 (0.0%) | 178 (29.8%) |
Race in Whitinsville
The most populous races in Whitinsville are White / Caucasian (6,462 | 88.8%), Hispanic or Latino (763 | 10.5%), and Two or more Races (503 | 6.9%).
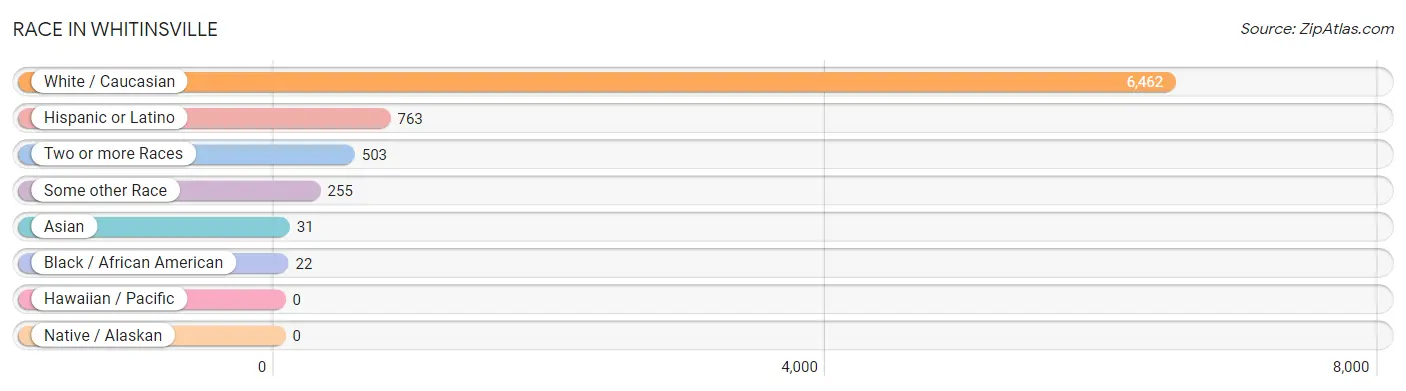
| Race | # Population | % Population |
| Asian | 31 | 0.4% |
| Black / African American | 22 | 0.3% |
| Hawaiian / Pacific | 0 | 0.0% |
| Hispanic or Latino | 763 | 10.5% |
| Native / Alaskan | 0 | 0.0% |
| White / Caucasian | 6,462 | 88.8% |
| Two or more Races | 503 | 6.9% |
| Some other Race | 255 | 3.5% |
| Total | 7,273 | 100.0% |
Ancestry in Whitinsville
The most populous ancestries reported in Whitinsville are Irish (1,265 | 17.4%), Italian (1,176 | 16.2%), French (1,006 | 13.8%), English (817 | 11.2%), and German (772 | 10.6%), together accounting for 69.2% of all Whitinsville residents.
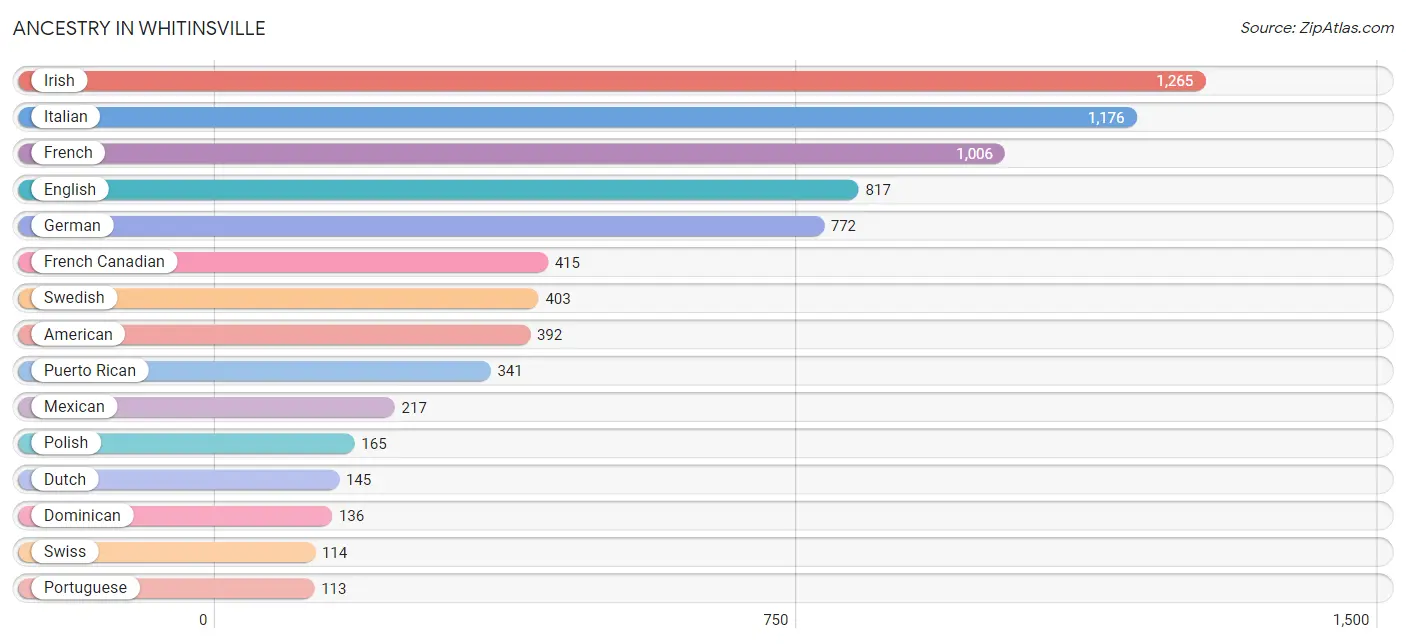
| Ancestry | # Population | % Population |
| American | 392 | 5.4% |
| Armenian | 73 | 1.0% |
| Austrian | 9 | 0.1% |
| Brazilian | 75 | 1.0% |
| British | 18 | 0.3% |
| Canadian | 41 | 0.6% |
| Cape Verdean | 28 | 0.4% |
| Central American | 11 | 0.2% |
| Colombian | 58 | 0.8% |
| Dominican | 136 | 1.9% |
| Dutch | 145 | 2.0% |
| Eastern European | 39 | 0.5% |
| English | 817 | 11.2% |
| European | 82 | 1.1% |
| French | 1,006 | 13.8% |
| French Canadian | 415 | 5.7% |
| German | 772 | 10.6% |
| Honduran | 11 | 0.2% |
| Irish | 1,265 | 17.4% |
| Italian | 1,176 | 16.2% |
| Korean | 89 | 1.2% |
| Lithuanian | 10 | 0.1% |
| Malaysian | 31 | 0.4% |
| Mexican | 217 | 3.0% |
| Norwegian | 33 | 0.4% |
| Polish | 165 | 2.3% |
| Portuguese | 113 | 1.5% |
| Puerto Rican | 341 | 4.7% |
| Russian | 26 | 0.4% |
| Scotch-Irish | 36 | 0.5% |
| Scottish | 102 | 1.4% |
| South American | 58 | 0.8% |
| Subsaharan African | 28 | 0.4% |
| Swedish | 403 | 5.5% |
| Swiss | 114 | 1.6% |
| Welsh | 6 | 0.1% | View All 36 Rows |
Immigrants in Whitinsville
The most numerous immigrant groups reported in Whitinsville came from Latin America (208 | 2.9%), South America (113 | 1.5%), Central America (95 | 1.3%), Mexico (95 | 1.3%), and Europe (68 | 0.9%), together accounting for 8.0% of all Whitinsville residents.
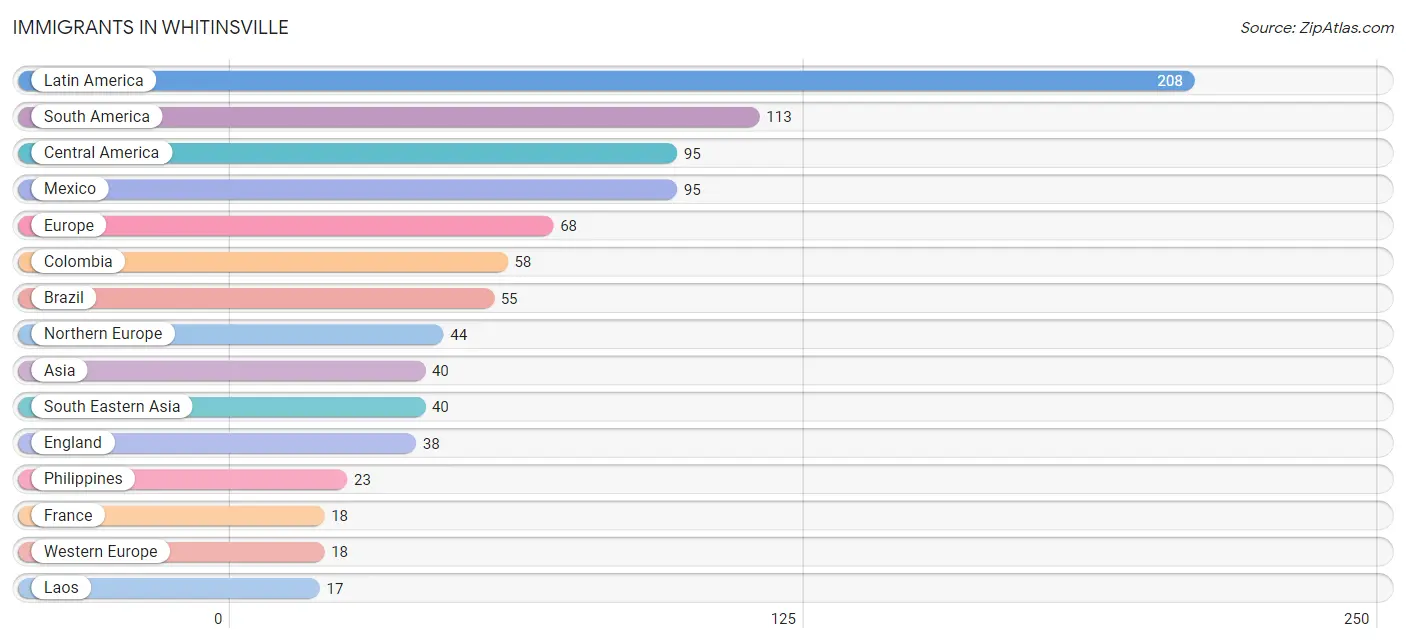
| Immigration Origin | # Population | % Population |
| Asia | 40 | 0.5% |
| Brazil | 55 | 0.8% |
| Central America | 95 | 1.3% |
| Colombia | 58 | 0.8% |
| England | 38 | 0.5% |
| Europe | 68 | 0.9% |
| France | 18 | 0.3% |
| Italy | 6 | 0.1% |
| Laos | 17 | 0.2% |
| Latin America | 208 | 2.9% |
| Mexico | 95 | 1.3% |
| Northern Europe | 44 | 0.6% |
| Philippines | 23 | 0.3% |
| South America | 113 | 1.5% |
| South Eastern Asia | 40 | 0.5% |
| Southern Europe | 6 | 0.1% |
| Western Europe | 18 | 0.3% | View All 17 Rows |
Sex and Age in Whitinsville
Sex and Age in Whitinsville
The most populous age groups in Whitinsville are 55 to 59 Years (346 | 10.5%) for men and 20 to 24 Years (312 | 7.9%) for women.
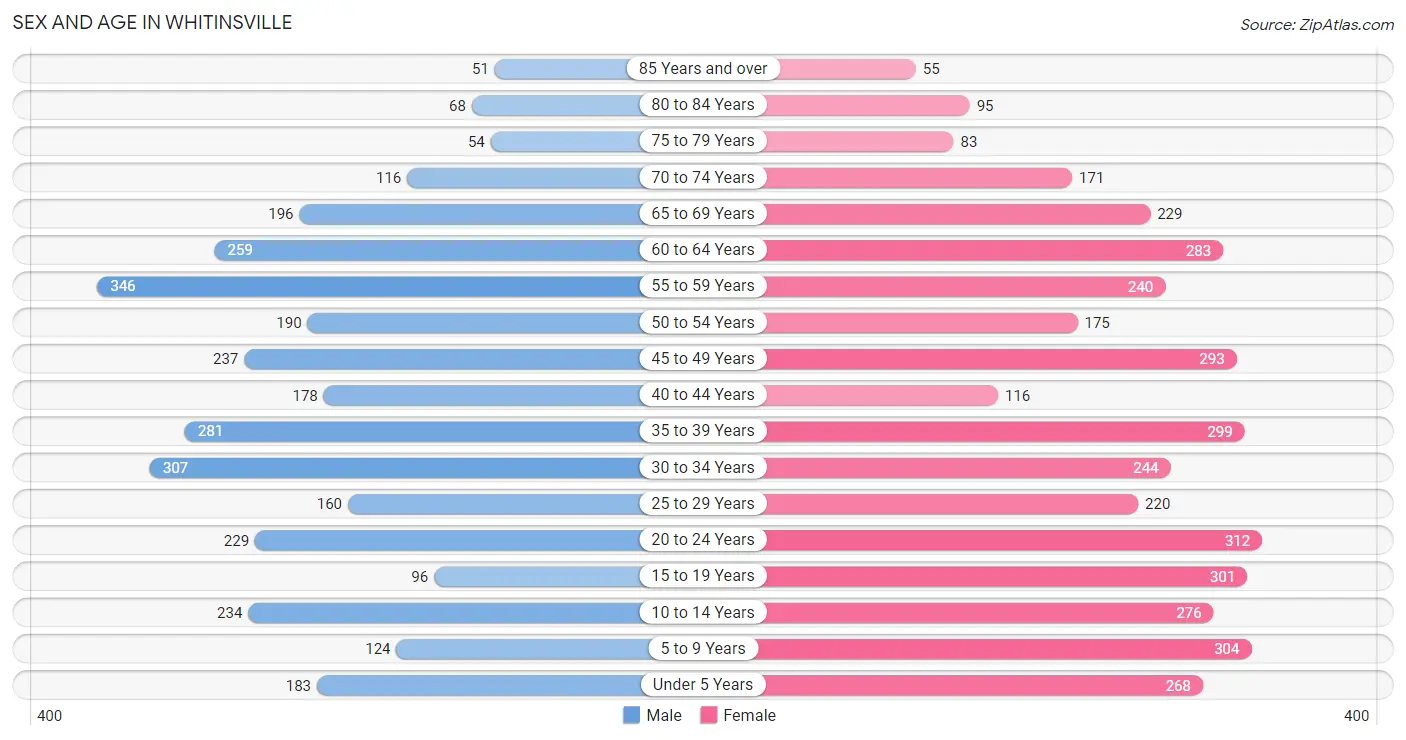
| Age Bracket | Male | Female |
| Under 5 Years | 183 (5.5%) | 268 (6.8%) |
| 5 to 9 Years | 124 (3.7%) | 304 (7.7%) |
| 10 to 14 Years | 234 (7.1%) | 276 (7.0%) |
| 15 to 19 Years | 96 (2.9%) | 301 (7.6%) |
| 20 to 24 Years | 229 (6.9%) | 312 (7.9%) |
| 25 to 29 Years | 160 (4.8%) | 220 (5.6%) |
| 30 to 34 Years | 307 (9.3%) | 244 (6.2%) |
| 35 to 39 Years | 281 (8.5%) | 299 (7.5%) |
| 40 to 44 Years | 178 (5.4%) | 116 (2.9%) |
| 45 to 49 Years | 237 (7.2%) | 293 (7.4%) |
| 50 to 54 Years | 190 (5.7%) | 175 (4.4%) |
| 55 to 59 Years | 346 (10.5%) | 240 (6.0%) |
| 60 to 64 Years | 259 (7.8%) | 283 (7.1%) |
| 65 to 69 Years | 196 (5.9%) | 229 (5.8%) |
| 70 to 74 Years | 116 (3.5%) | 171 (4.3%) |
| 75 to 79 Years | 54 (1.6%) | 83 (2.1%) |
| 80 to 84 Years | 68 (2.1%) | 95 (2.4%) |
| 85 Years and over | 51 (1.5%) | 55 (1.4%) |
| Total | 3,309 (100.0%) | 3,964 (100.0%) |
Families and Households in Whitinsville
Median Family Size in Whitinsville
The median family size in Whitinsville is 2.97 persons per family, with married-couple families (1,406 | 70.2%) accounting for the largest median family size of 3.14 persons per family. On the other hand, single male/father families (353 | 17.6%) represent the smallest median family size with 2.30 persons per family.
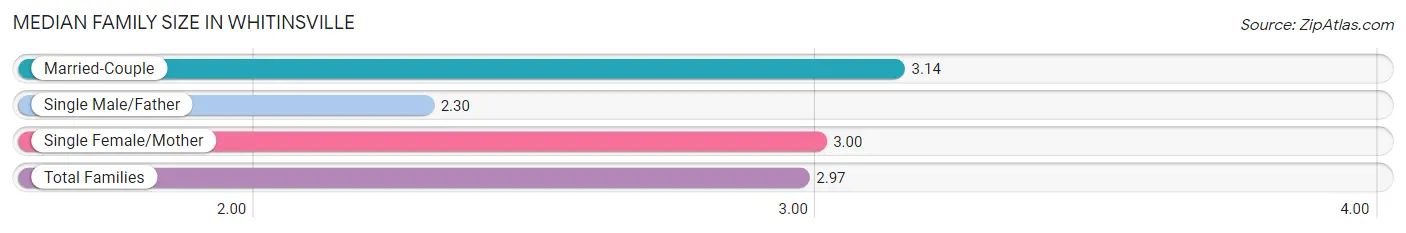
| Family Type | # Families | Family Size |
| Married-Couple | 1,406 (70.2%) | 3.14 |
| Single Male/Father | 353 (17.6%) | 2.30 |
| Single Female/Mother | 244 (12.2%) | 3.00 |
| Total Families | 2,003 (100.0%) | 2.97 |
Median Household Size in Whitinsville
The median household size in Whitinsville is 2.53 persons per household, with single female/mother households (244 | 8.6%) accounting for the largest median household size of 3.29 persons per household. non-family households (827 | 29.2%) represent the smallest median household size with 1.29 persons per household.
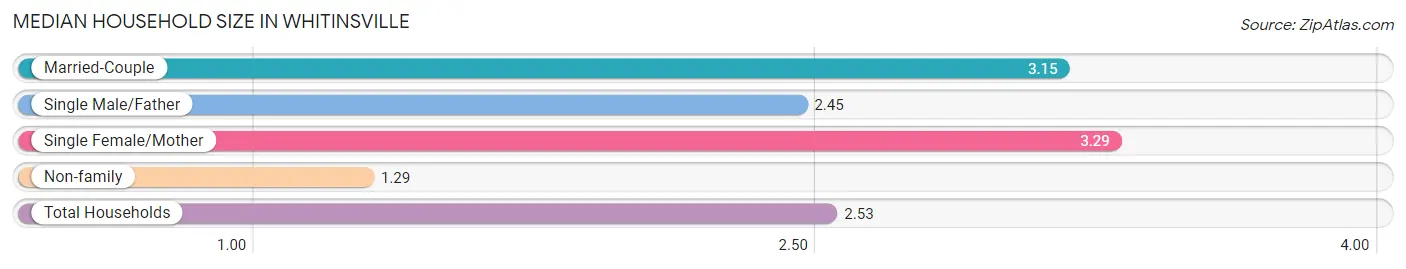
| Household Type | # Households | Household Size |
| Married-Couple | 1,406 (49.7%) | 3.15 |
| Single Male/Father | 353 (12.5%) | 2.45 |
| Single Female/Mother | 244 (8.6%) | 3.29 |
| Non-family | 827 (29.2%) | 1.29 |
| Total Households | 2,830 (100.0%) | 2.53 |
Household Size by Marriage Status in Whitinsville
Out of a total of 2,830 households in Whitinsville, 2,003 (70.8%) are family households, while 827 (29.2%) are nonfamily households. The most numerous type of family households are 2-person households, comprising 977, and the most common type of nonfamily households are 1-person households, comprising 541.
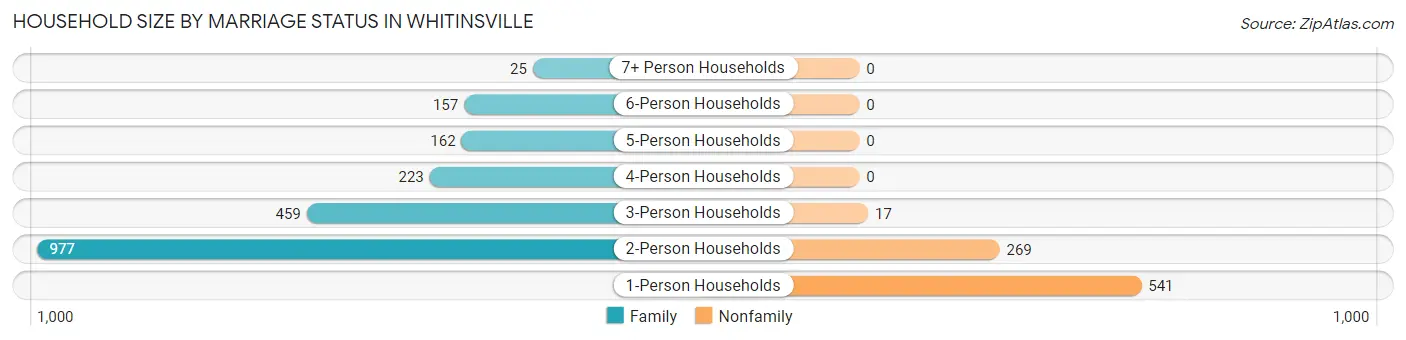
| Household Size | Family Households | Nonfamily Households |
| 1-Person Households | - | 541 (19.1%) |
| 2-Person Households | 977 (34.5%) | 269 (9.5%) |
| 3-Person Households | 459 (16.2%) | 17 (0.6%) |
| 4-Person Households | 223 (7.9%) | 0 (0.0%) |
| 5-Person Households | 162 (5.7%) | 0 (0.0%) |
| 6-Person Households | 157 (5.6%) | 0 (0.0%) |
| 7+ Person Households | 25 (0.9%) | 0 (0.0%) |
| Total | 2,003 (70.8%) | 827 (29.2%) |
Female Fertility in Whitinsville
Fertility by Age in Whitinsville
Average fertility rate in Whitinsville is 63.0 births per 1,000 women. Women in the age bracket of 20 to 34 years have the highest fertility rate with 128.0 births per 1,000 women. Women in the age bracket of 20 to 34 years acount for 88.4% of all women with births.
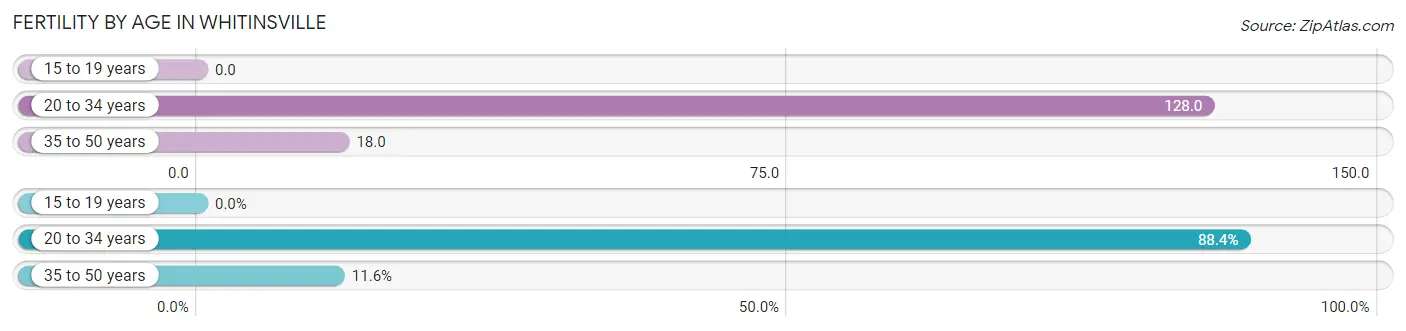
| Age Bracket | Women with Births | Births / 1,000 Women |
| 15 to 19 years | 0 (0.0%) | 0.0 |
| 20 to 34 years | 99 (88.4%) | 128.0 |
| 35 to 50 years | 13 (11.6%) | 18.0 |
| Total | 112 (100.0%) | 63.0 |
Fertility by Age by Marriage Status in Whitinsville
11.6% of women with births (112) in Whitinsville are married. The highest percentage of unmarried women with births falls into 20 to 34 years age bracket with 100.0% of them unmarried at the time of birth, while the lowest percentage of unmarried women with births belong to 35 to 50 years age bracket with 0.0% of them unmarried.
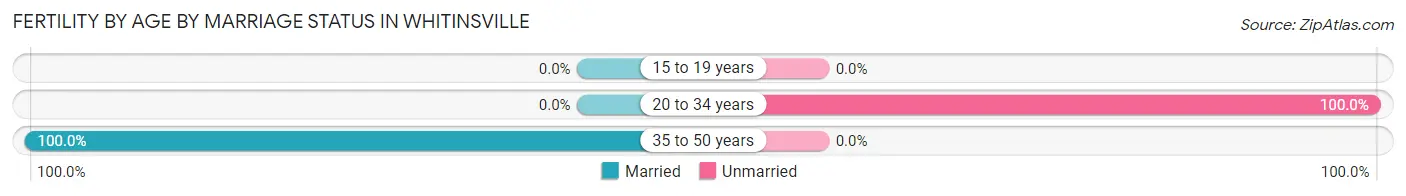
| Age Bracket | Married | Unmarried |
| 15 to 19 years | 0 (0.0%) | 0 (0.0%) |
| 20 to 34 years | 0 (0.0%) | 99 (100.0%) |
| 35 to 50 years | 13 (100.0%) | 0 (0.0%) |
| Total | 13 (11.6%) | 99 (88.4%) |
Fertility by Education in Whitinsville
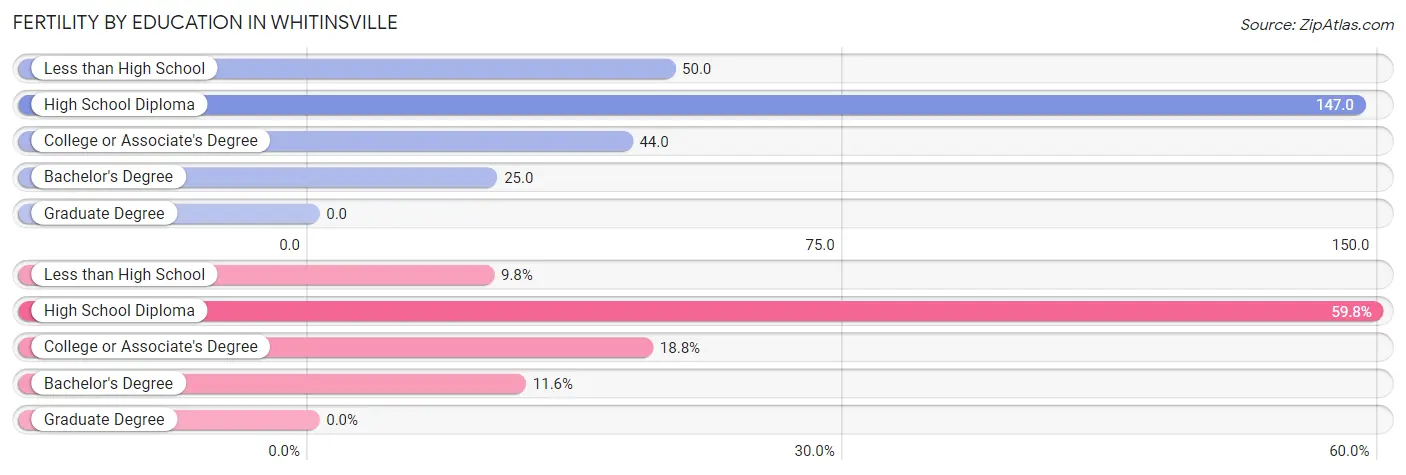
| Educational Attainment | Women with Births | Births / 1,000 Women |
| Less than High School | 11 (9.8%) | 50.0 |
| High School Diploma | 67 (59.8%) | 147.0 |
| College or Associate's Degree | 21 (18.8%) | 44.0 |
| Bachelor's Degree | 13 (11.6%) | 25.0 |
| Graduate Degree | 0 (0.0%) | 0.0 |
| Total | 112 (100.0%) | 63.0 |
Fertility by Education by Marriage Status in Whitinsville
88.4% of women with births in Whitinsville are unmarried. Women with the educational attainment of bachelor's degree are most likely to be married with 100.0% of them married at childbirth, while women with the educational attainment of less than high school are least likely to be married with 100.0% of them unmarried at childbirth.
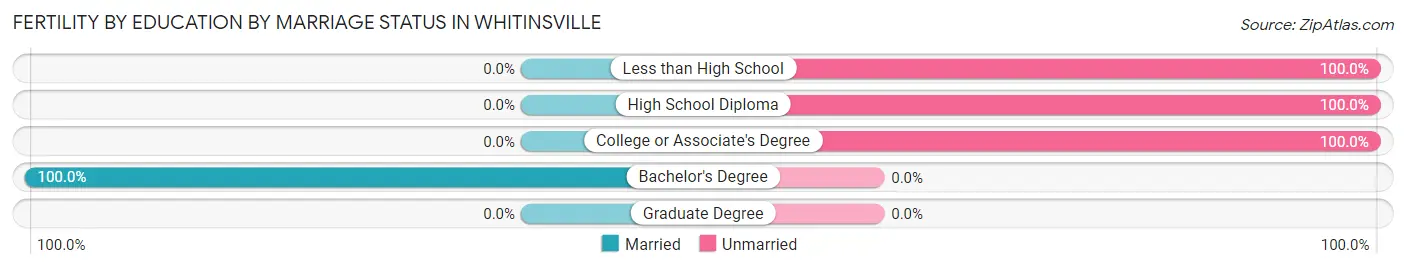
| Educational Attainment | Married | Unmarried |
| Less than High School | 0 (0.0%) | 11 (100.0%) |
| High School Diploma | 0 (0.0%) | 67 (100.0%) |
| College or Associate's Degree | 0 (0.0%) | 21 (100.0%) |
| Bachelor's Degree | 13 (100.0%) | 0 (0.0%) |
| Graduate Degree | 0 (0.0%) | 0 (0.0%) |
| Total | 13 (11.6%) | 99 (88.4%) |
Employment Characteristics in Whitinsville
Employment by Class of Employer in Whitinsville
Among the 3,805 employed individuals in Whitinsville, private company employees (2,754 | 72.4%), not-for-profit organizations (312 | 8.2%), and local government employees (256 | 6.7%) make up the most common classes of employment.
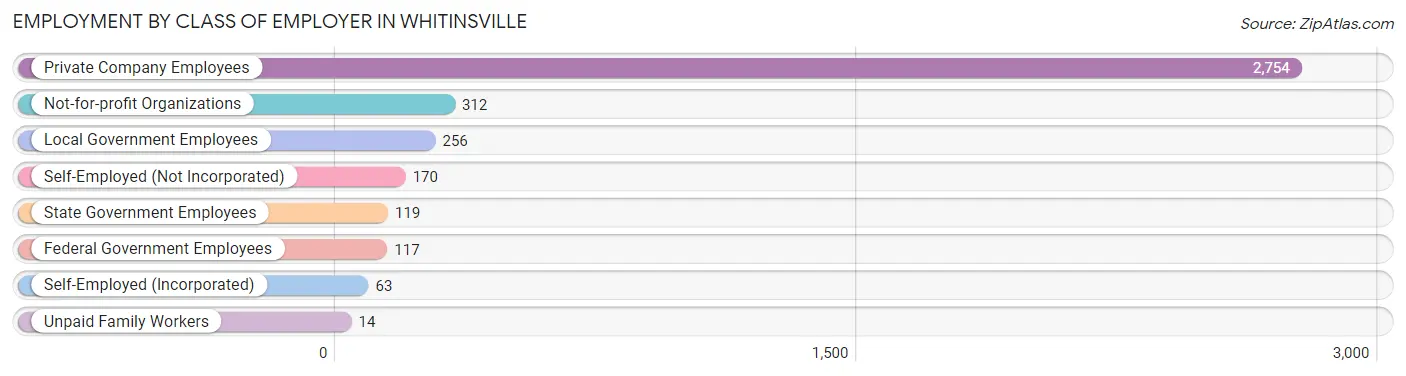
| Employer Class | # Employees | % Employees |
| Private Company Employees | 2,754 | 72.4% |
| Self-Employed (Incorporated) | 63 | 1.7% |
| Self-Employed (Not Incorporated) | 170 | 4.5% |
| Not-for-profit Organizations | 312 | 8.2% |
| Local Government Employees | 256 | 6.7% |
| State Government Employees | 119 | 3.1% |
| Federal Government Employees | 117 | 3.1% |
| Unpaid Family Workers | 14 | 0.4% |
| Total | 3,805 | 100.0% |
Employment Status by Age in Whitinsville
According to the labor force statistics for Whitinsville, out of the total population over 16 years of age (5,790), 71.9% or 4,163 individuals are in the labor force, with 4.8% or 200 of them unemployed. The age group with the highest labor force participation rate is 20 to 24 years, with 100.0% or 541 individuals in the labor force. Within the labor force, the 16 to 19 years age range has the highest percentage of unemployed individuals, with 13.1% or 37 of them being unemployed.
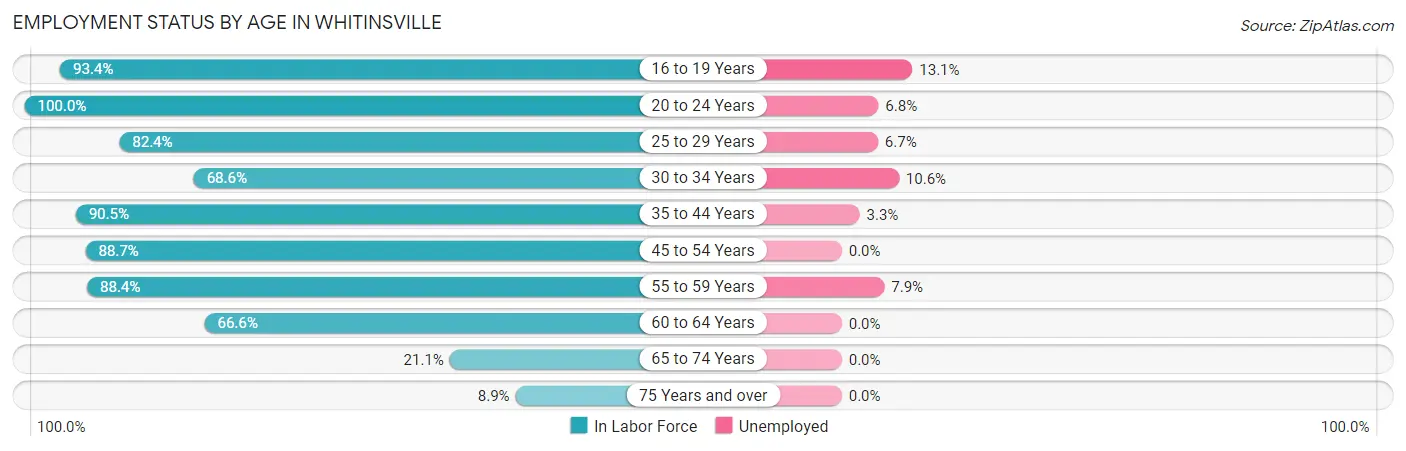
| Age Bracket | In Labor Force | Unemployed |
| 16 to 19 Years | 283 (93.4%) | 37 (13.1%) |
| 20 to 24 Years | 541 (100.0%) | 37 (6.8%) |
| 25 to 29 Years | 313 (82.4%) | 21 (6.7%) |
| 30 to 34 Years | 378 (68.6%) | 40 (10.6%) |
| 35 to 44 Years | 791 (90.5%) | 26 (3.3%) |
| 45 to 54 Years | 794 (88.7%) | 0 (0.0%) |
| 55 to 59 Years | 518 (88.4%) | 41 (7.9%) |
| 60 to 64 Years | 361 (66.6%) | 0 (0.0%) |
| 65 to 74 Years | 150 (21.1%) | 0 (0.0%) |
| 75 Years and over | 36 (8.9%) | 0 (0.0%) |
| Total | 4,163 (71.9%) | 200 (4.8%) |
Employment Status by Educational Attainment in Whitinsville
According to labor force statistics for Whitinsville, 82.4% of individuals (3,154) out of the total population between 25 and 64 years of age (3,828) are in the labor force, with 4.1% or 129 of them being unemployed. The group with the highest labor force participation rate are those with the educational attainment of bachelor's degree or higher, with 96.1% or 1,124 individuals in the labor force. Within the labor force, individuals with high school diploma education have the highest percentage of unemployment, with 10.6% or 80 of them being unemployed.
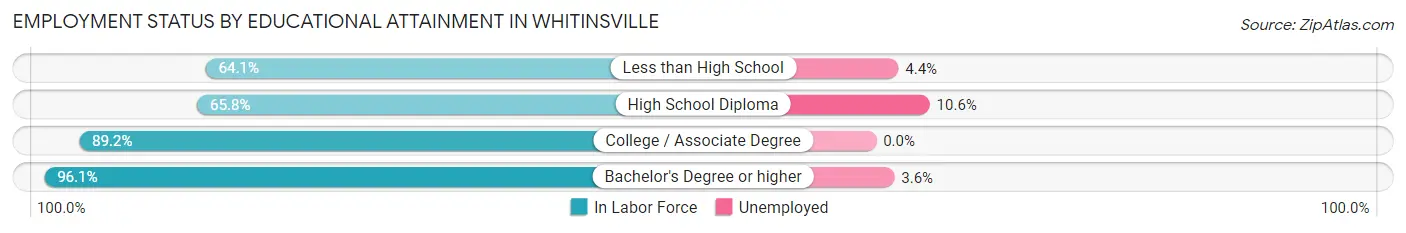
| Educational Attainment | In Labor Force | Unemployed |
| Less than High School | 182 (64.1%) | 12 (4.4%) |
| High School Diploma | 755 (65.8%) | 122 (10.6%) |
| College / Associate Degree | 1,094 (89.2%) | 0 (0.0%) |
| Bachelor's Degree or higher | 1,124 (96.1%) | 42 (3.6%) |
| Total | 3,154 (82.4%) | 157 (4.1%) |
Employment Occupations by Sex in Whitinsville
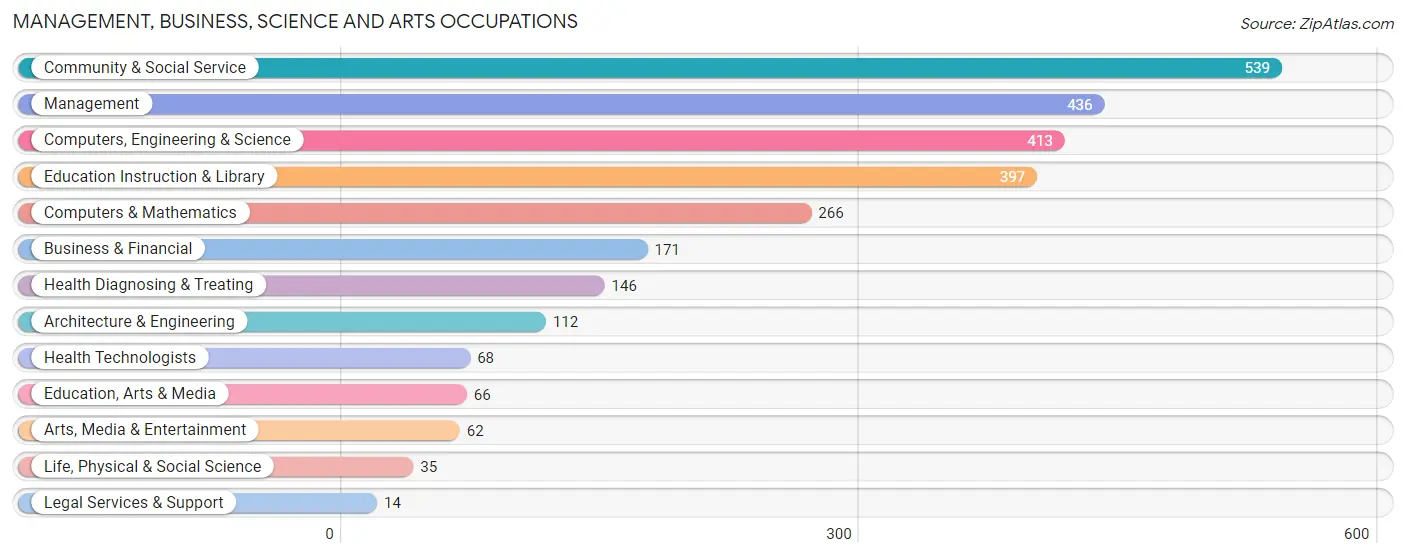
Management, Business, Science and Arts Occupations
The most common Management, Business, Science and Arts occupations in Whitinsville are Community & Social Service (539 | 13.6%), Management (436 | 11.0%), Computers, Engineering & Science (413 | 10.4%), Education Instruction & Library (397 | 10.0%), and Computers & Mathematics (266 | 6.7%).
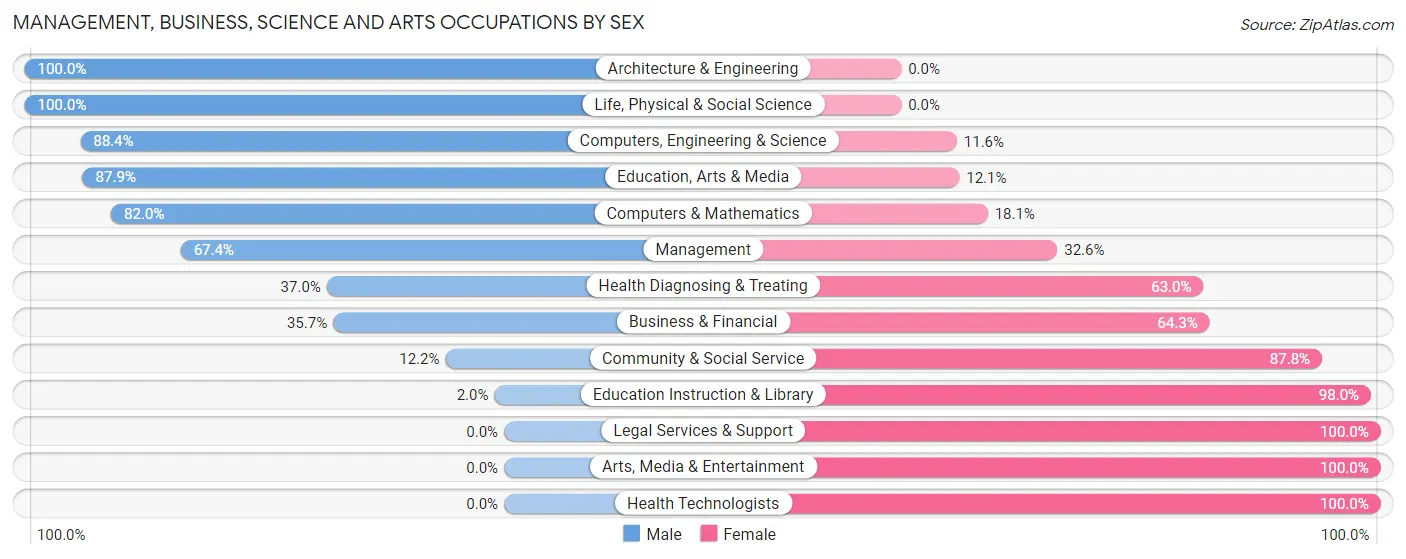
Management, Business, Science and Arts Occupations by Sex
Within the Management, Business, Science and Arts occupations in Whitinsville, the most male-oriented occupations are Architecture & Engineering (100.0%), Life, Physical & Social Science (100.0%), and Computers, Engineering & Science (88.4%), while the most female-oriented occupations are Legal Services & Support (100.0%), Arts, Media & Entertainment (100.0%), and Health Technologists (100.0%).
| Occupation | Male | Female |
| Management | 294 (67.4%) | 142 (32.6%) |
| Business & Financial | 61 (35.7%) | 110 (64.3%) |
| Computers, Engineering & Science | 365 (88.4%) | 48 (11.6%) |
| Computers & Mathematics | 218 (82.0%) | 48 (18.0%) |
| Architecture & Engineering | 112 (100.0%) | 0 (0.0%) |
| Life, Physical & Social Science | 35 (100.0%) | 0 (0.0%) |
| Community & Social Service | 66 (12.2%) | 473 (87.8%) |
| Education, Arts & Media | 58 (87.9%) | 8 (12.1%) |
| Legal Services & Support | 0 (0.0%) | 14 (100.0%) |
| Education Instruction & Library | 8 (2.0%) | 389 (98.0%) |
| Arts, Media & Entertainment | 0 (0.0%) | 62 (100.0%) |
| Health Diagnosing & Treating | 54 (37.0%) | 92 (63.0%) |
| Health Technologists | 0 (0.0%) | 68 (100.0%) |
| Total (Category) | 840 (49.3%) | 865 (50.7%) |
| Total (Overall) | 1,965 (49.6%) | 1,998 (50.4%) |
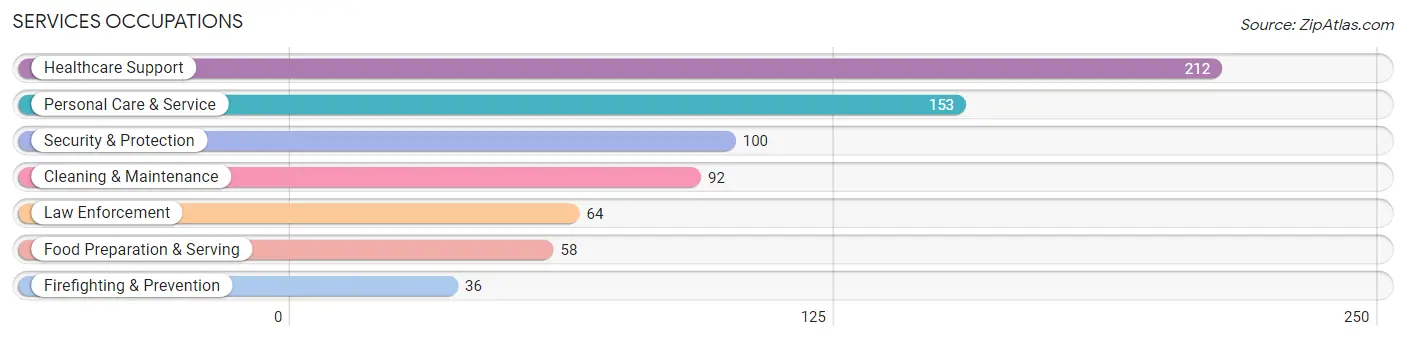
Services Occupations
The most common Services occupations in Whitinsville are Healthcare Support (212 | 5.3%), Personal Care & Service (153 | 3.9%), Security & Protection (100 | 2.5%), Cleaning & Maintenance (92 | 2.3%), and Law Enforcement (64 | 1.6%).
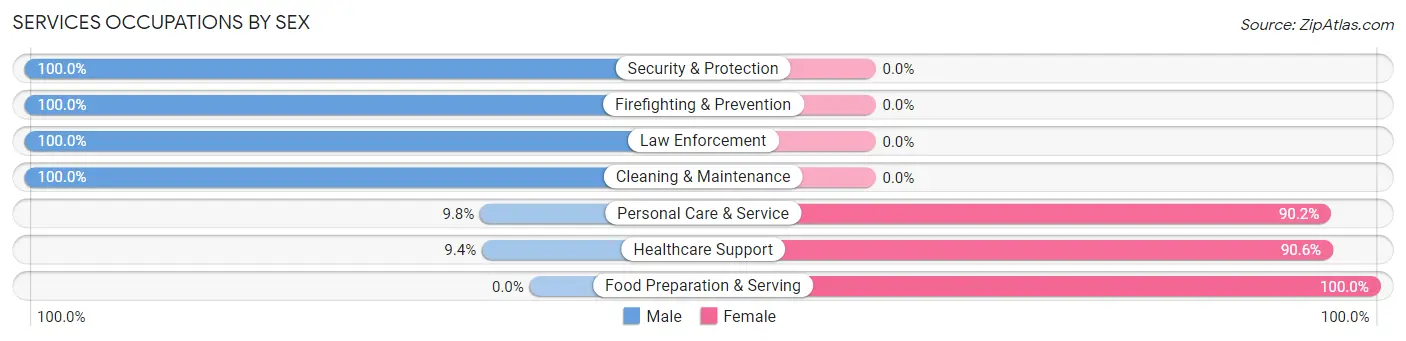
Services Occupations by Sex
Within the Services occupations in Whitinsville, the most male-oriented occupations are Security & Protection (100.0%), Firefighting & Prevention (100.0%), and Law Enforcement (100.0%), while the most female-oriented occupations are Food Preparation & Serving (100.0%), Healthcare Support (90.6%), and Personal Care & Service (90.2%).
| Occupation | Male | Female |
| Healthcare Support | 20 (9.4%) | 192 (90.6%) |
| Security & Protection | 100 (100.0%) | 0 (0.0%) |
| Firefighting & Prevention | 36 (100.0%) | 0 (0.0%) |
| Law Enforcement | 64 (100.0%) | 0 (0.0%) |
| Food Preparation & Serving | 0 (0.0%) | 58 (100.0%) |
| Cleaning & Maintenance | 92 (100.0%) | 0 (0.0%) |
| Personal Care & Service | 15 (9.8%) | 138 (90.2%) |
| Total (Category) | 227 (36.9%) | 388 (63.1%) |
| Total (Overall) | 1,965 (49.6%) | 1,998 (50.4%) |
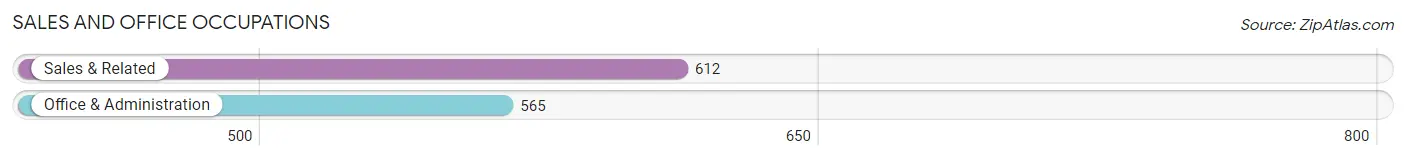
Sales and Office Occupations
The most common Sales and Office occupations in Whitinsville are Sales & Related (612 | 15.4%), and Office & Administration (565 | 14.3%).
Sales and Office Occupations by Sex
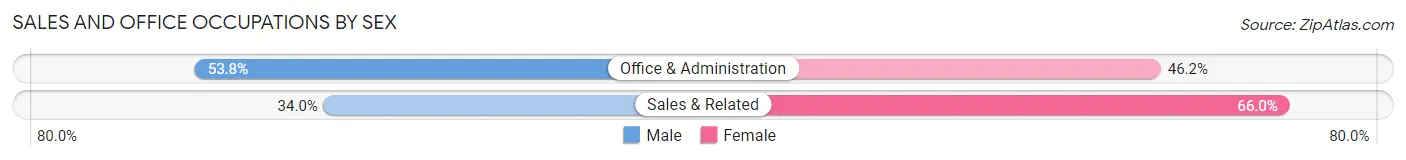
| Occupation | Male | Female |
| Sales & Related | 208 (34.0%) | 404 (66.0%) |
| Office & Administration | 304 (53.8%) | 261 (46.2%) |
| Total (Category) | 512 (43.5%) | 665 (56.5%) |
| Total (Overall) | 1,965 (49.6%) | 1,998 (50.4%) |
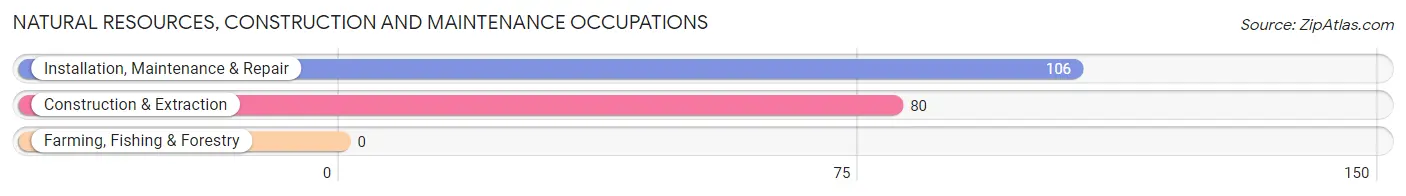
Natural Resources, Construction and Maintenance Occupations
The most common Natural Resources, Construction and Maintenance occupations in Whitinsville are Installation, Maintenance & Repair (106 | 2.7%), and Construction & Extraction (80 | 2.0%).
Natural Resources, Construction and Maintenance Occupations by Sex
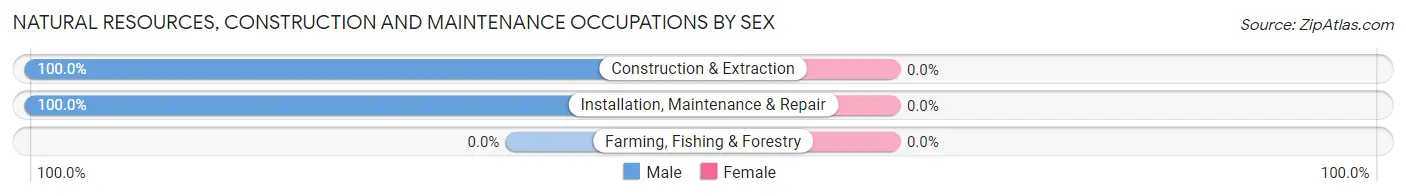
| Occupation | Male | Female |
| Farming, Fishing & Forestry | 0 (0.0%) | 0 (0.0%) |
| Construction & Extraction | 80 (100.0%) | 0 (0.0%) |
| Installation, Maintenance & Repair | 106 (100.0%) | 0 (0.0%) |
| Total (Category) | 186 (100.0%) | 0 (0.0%) |
| Total (Overall) | 1,965 (49.6%) | 1,998 (50.4%) |
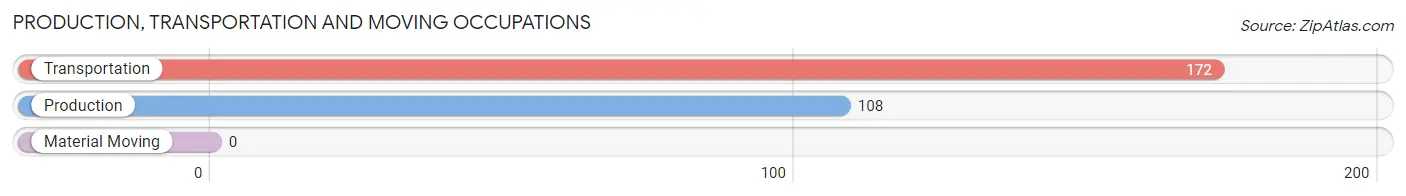
Production, Transportation and Moving Occupations
The most common Production, Transportation and Moving occupations in Whitinsville are Transportation (172 | 4.3%), and Production (108 | 2.7%).
Production, Transportation and Moving Occupations by Sex
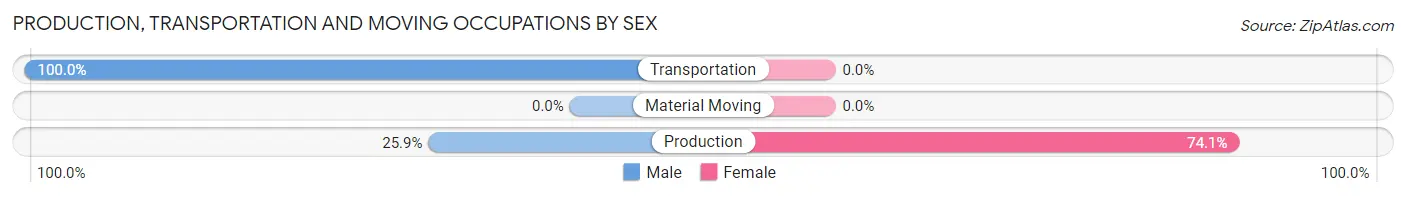
| Occupation | Male | Female |
| Production | 28 (25.9%) | 80 (74.1%) |
| Transportation | 172 (100.0%) | 0 (0.0%) |
| Material Moving | 0 (0.0%) | 0 (0.0%) |
| Total (Category) | 200 (71.4%) | 80 (28.6%) |
| Total (Overall) | 1,965 (49.6%) | 1,998 (50.4%) |
Employment Industries by Sex in Whitinsville
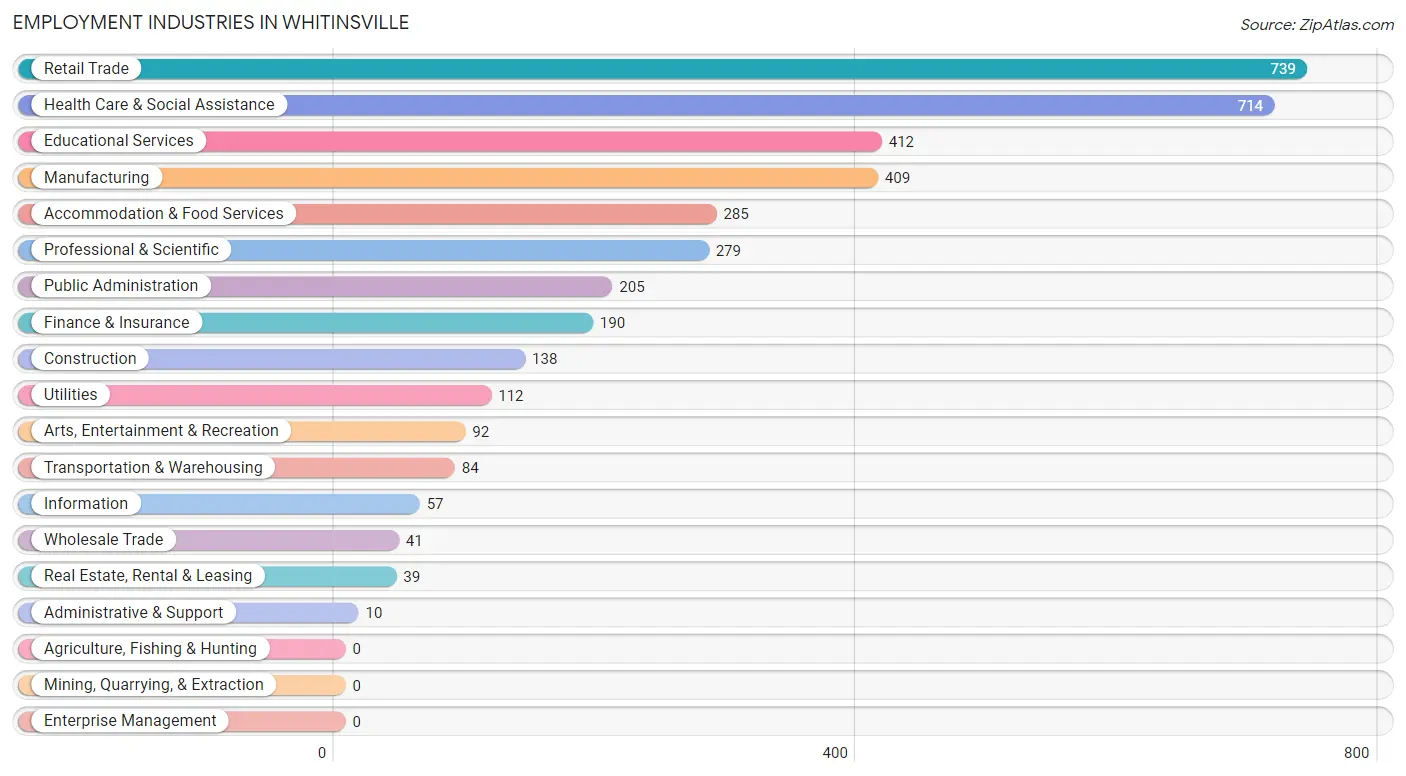
Employment Industries in Whitinsville
The major employment industries in Whitinsville include Retail Trade (739 | 18.6%), Health Care & Social Assistance (714 | 18.0%), Educational Services (412 | 10.4%), Manufacturing (409 | 10.3%), and Accommodation & Food Services (285 | 7.2%).
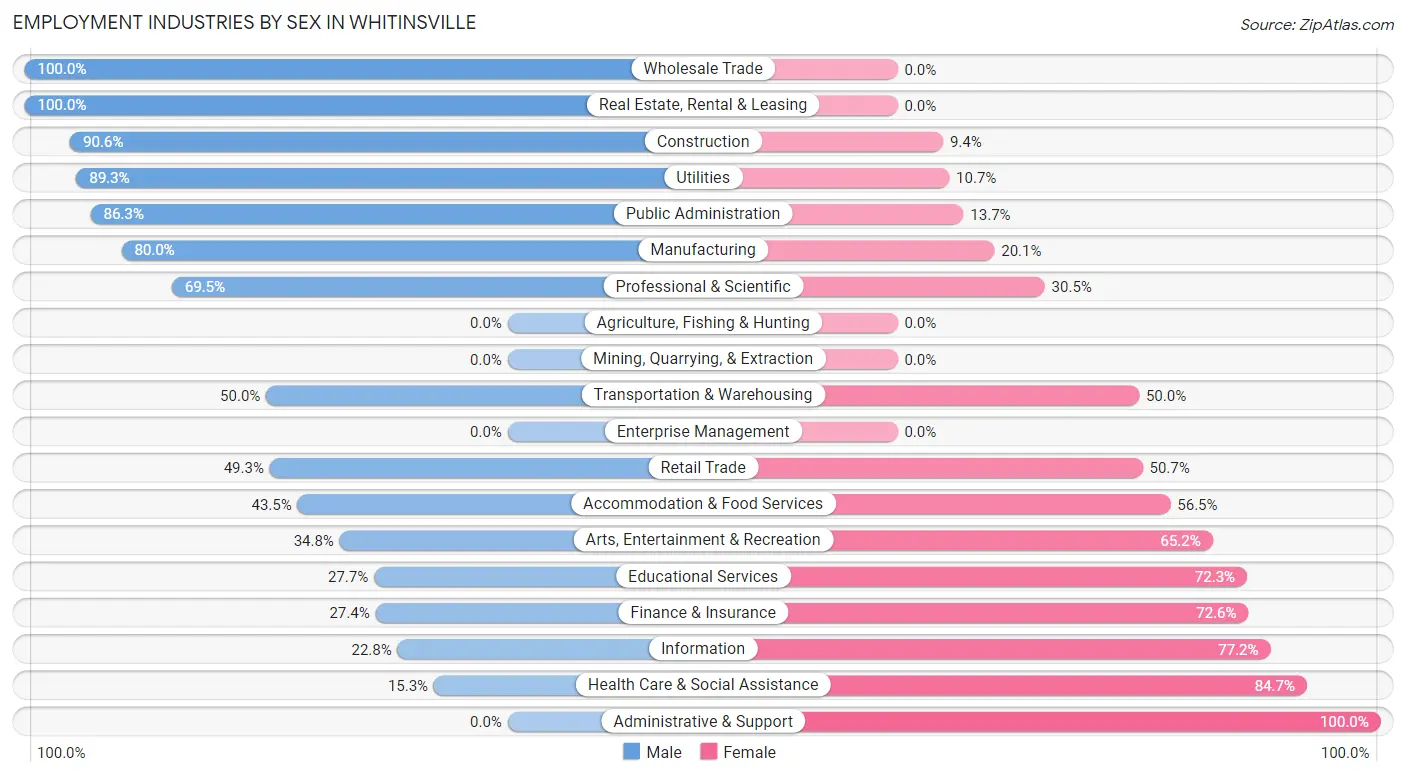
Employment Industries by Sex in Whitinsville
The Whitinsville industries that see more men than women are Wholesale Trade (100.0%), Real Estate, Rental & Leasing (100.0%), and Construction (90.6%), whereas the industries that tend to have a higher number of women are Administrative & Support (100.0%), Health Care & Social Assistance (84.7%), and Information (77.2%).
| Industry | Male | Female |
| Agriculture, Fishing & Hunting | 0 (0.0%) | 0 (0.0%) |
| Mining, Quarrying, & Extraction | 0 (0.0%) | 0 (0.0%) |
| Construction | 125 (90.6%) | 13 (9.4%) |
| Manufacturing | 327 (79.9%) | 82 (20.1%) |
| Wholesale Trade | 41 (100.0%) | 0 (0.0%) |
| Retail Trade | 364 (49.3%) | 375 (50.7%) |
| Transportation & Warehousing | 42 (50.0%) | 42 (50.0%) |
| Utilities | 100 (89.3%) | 12 (10.7%) |
| Information | 13 (22.8%) | 44 (77.2%) |
| Finance & Insurance | 52 (27.4%) | 138 (72.6%) |
| Real Estate, Rental & Leasing | 39 (100.0%) | 0 (0.0%) |
| Professional & Scientific | 194 (69.5%) | 85 (30.5%) |
| Enterprise Management | 0 (0.0%) | 0 (0.0%) |
| Administrative & Support | 0 (0.0%) | 10 (100.0%) |
| Educational Services | 114 (27.7%) | 298 (72.3%) |
| Health Care & Social Assistance | 109 (15.3%) | 605 (84.7%) |
| Arts, Entertainment & Recreation | 32 (34.8%) | 60 (65.2%) |
| Accommodation & Food Services | 124 (43.5%) | 161 (56.5%) |
| Public Administration | 177 (86.3%) | 28 (13.7%) |
| Total | 1,965 (49.6%) | 1,998 (50.4%) |
Education in Whitinsville
School Enrollment in Whitinsville
The most common levels of schooling among the 1,598 students in Whitinsville are middle school (426 | 26.7%), college / undergraduate (335 | 21.0%), and high school (310 | 19.4%).
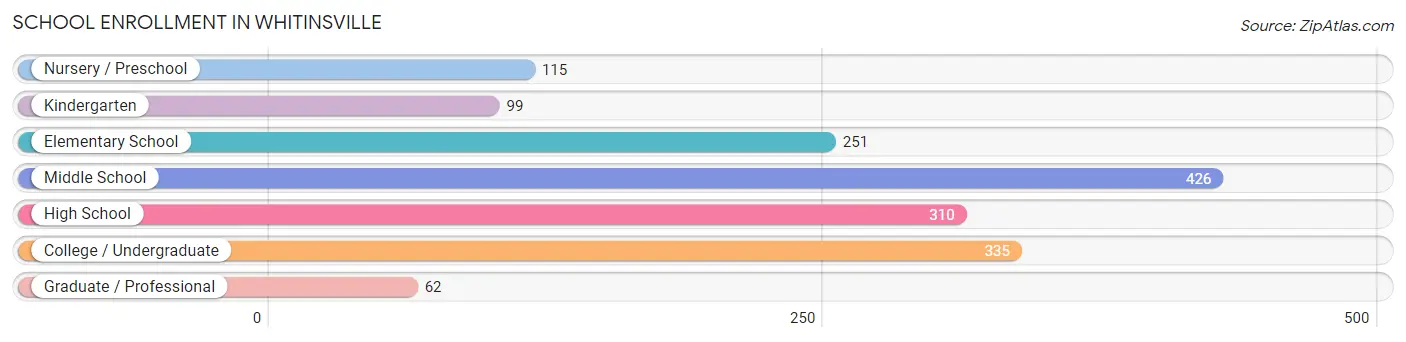
| School Level | # Students | % Students |
| Nursery / Preschool | 115 | 7.2% |
| Kindergarten | 99 | 6.2% |
| Elementary School | 251 | 15.7% |
| Middle School | 426 | 26.7% |
| High School | 310 | 19.4% |
| College / Undergraduate | 335 | 21.0% |
| Graduate / Professional | 62 | 3.9% |
| Total | 1,598 | 100.0% |
School Enrollment by Age by Funding Source in Whitinsville
Out of a total of 1,598 students who are enrolled in schools in Whitinsville, 217 (13.6%) attend a private institution, while the remaining 1,381 (86.4%) are enrolled in public schools. The age group of 3 to 4 year olds has the highest likelihood of being enrolled in private schools, with 60 (83.3% in the age bracket) enrolled. Conversely, the age group of 5 to 9 year old has the lowest likelihood of being enrolled in a private school, with 326 (100.0% in the age bracket) attending a public institution.
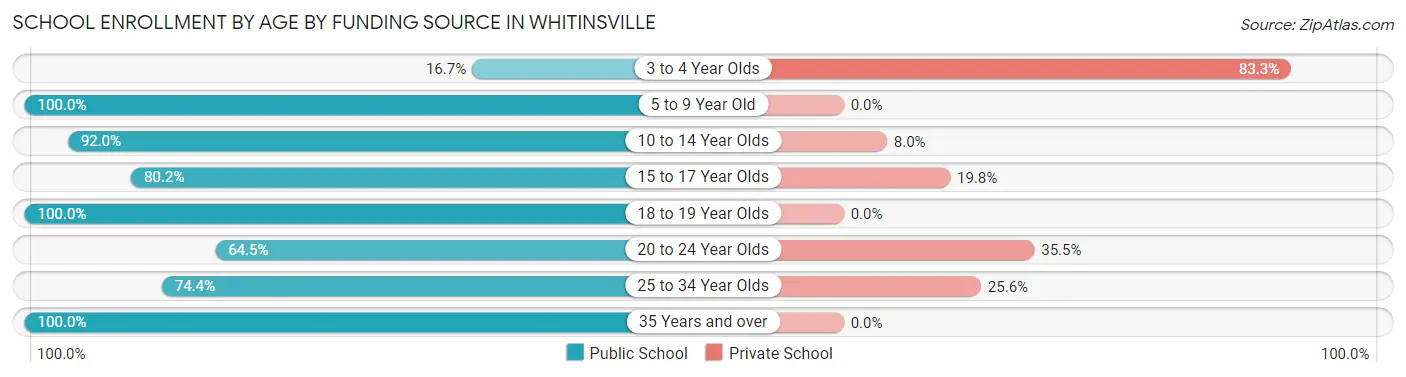
| Age Bracket | Public School | Private School |
| 3 to 4 Year Olds | 12 (16.7%) | 60 (83.3%) |
| 5 to 9 Year Old | 326 (100.0%) | 0 (0.0%) |
| 10 to 14 Year Olds | 469 (92.0%) | 41 (8.0%) |
| 15 to 17 Year Olds | 178 (80.2%) | 44 (19.8%) |
| 18 to 19 Year Olds | 175 (100.0%) | 0 (0.0%) |
| 20 to 24 Year Olds | 69 (64.5%) | 38 (35.5%) |
| 25 to 34 Year Olds | 99 (74.4%) | 34 (25.6%) |
| 35 Years and over | 53 (100.0%) | 0 (0.0%) |
| Total | 1,381 (86.4%) | 217 (13.6%) |
Educational Attainment by Field of Study in Whitinsville
Social sciences (226 | 14.8%), business (214 | 14.0%), arts & humanities (210 | 13.7%), science & technology (123 | 8.0%), and education (123 | 8.0%) are the most common fields of study among 1,529 individuals in Whitinsville who have obtained a bachelor's degree or higher.
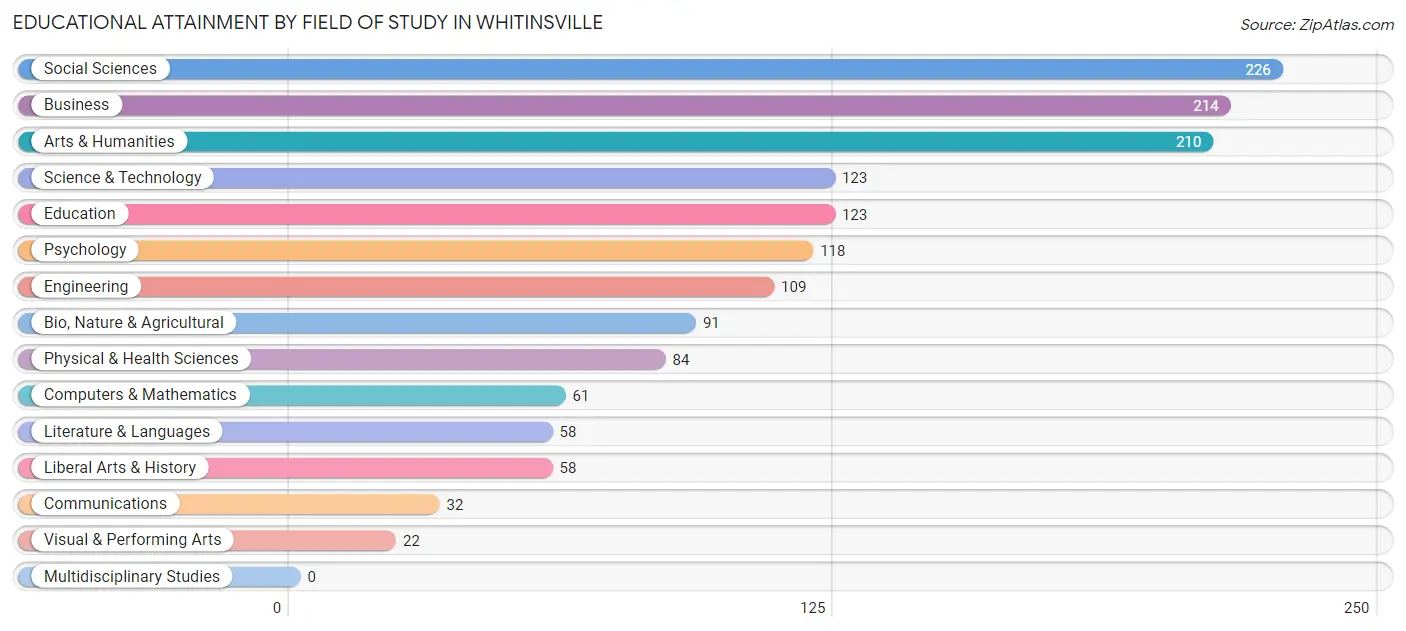
| Field of Study | # Graduates | % Graduates |
| Computers & Mathematics | 61 | 4.0% |
| Bio, Nature & Agricultural | 91 | 5.9% |
| Physical & Health Sciences | 84 | 5.5% |
| Psychology | 118 | 7.7% |
| Social Sciences | 226 | 14.8% |
| Engineering | 109 | 7.1% |
| Multidisciplinary Studies | 0 | 0.0% |
| Science & Technology | 123 | 8.0% |
| Business | 214 | 14.0% |
| Education | 123 | 8.0% |
| Literature & Languages | 58 | 3.8% |
| Liberal Arts & History | 58 | 3.8% |
| Visual & Performing Arts | 22 | 1.4% |
| Communications | 32 | 2.1% |
| Arts & Humanities | 210 | 13.7% |
| Total | 1,529 | 100.0% |
Transportation & Commute in Whitinsville
Vehicle Availability by Sex in Whitinsville
The most prevalent vehicle ownership categories in Whitinsville are males with 2 vehicles (943, accounting for 50.2%) and females with 2 vehicles (819, making up 49.0%).
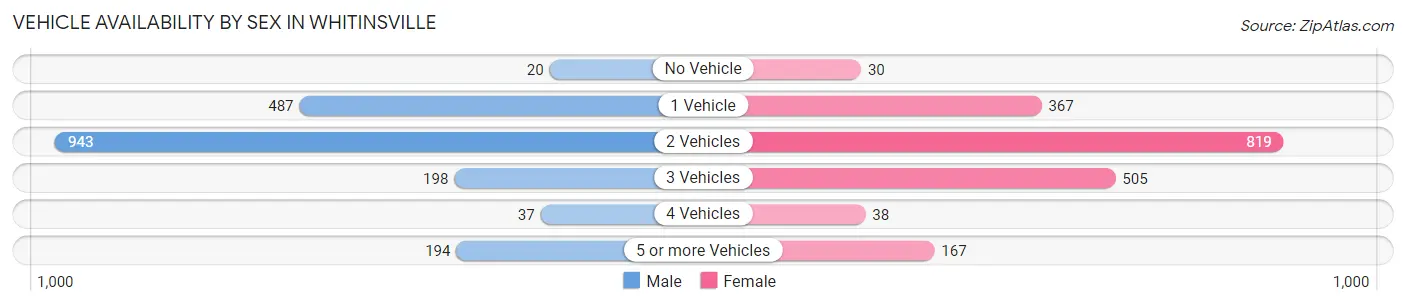
| Vehicles Available | Male | Female |
| No Vehicle | 20 (1.1%) | 30 (1.6%) |
| 1 Vehicle | 487 (25.9%) | 367 (19.1%) |
| 2 Vehicles | 943 (50.2%) | 819 (42.5%) |
| 3 Vehicles | 198 (10.5%) | 505 (26.2%) |
| 4 Vehicles | 37 (2.0%) | 38 (2.0%) |
| 5 or more Vehicles | 194 (10.3%) | 167 (8.7%) |
| Total | 1,879 (100.0%) | 1,926 (100.0%) |
Commute Time in Whitinsville
The most frequently occuring commute durations in Whitinsville are 30 to 34 minutes (557 commuters, 16.9%), 60 to 89 minutes (507 commuters, 15.4%), and 5 to 9 minutes (367 commuters, 11.1%).
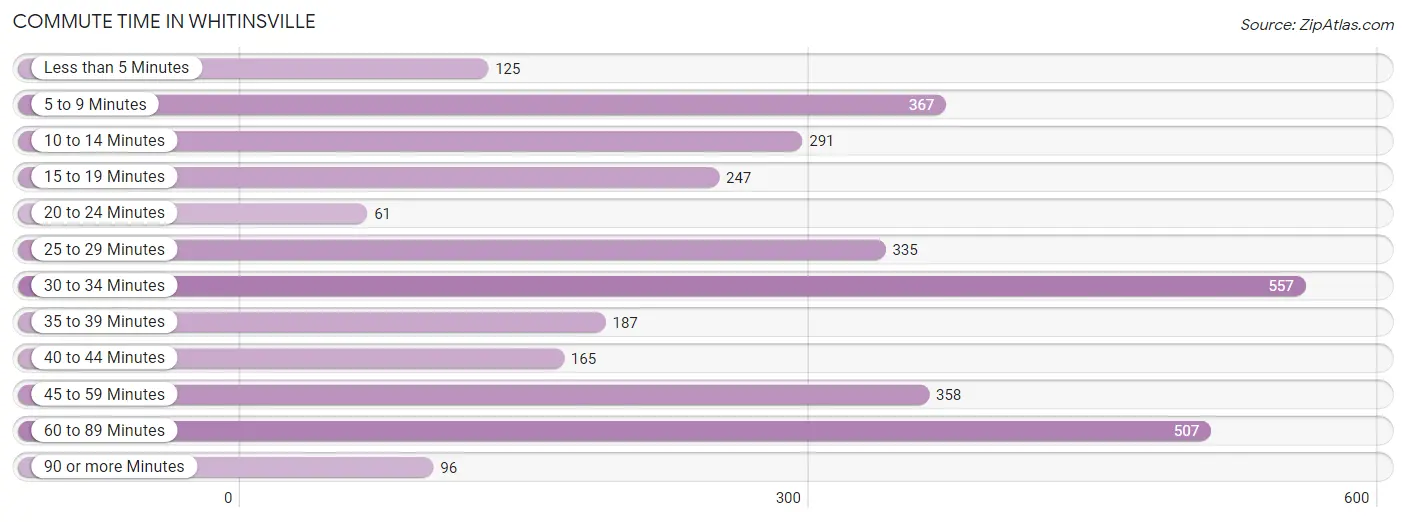
| Commute Time | # Commuters | % Commuters |
| Less than 5 Minutes | 125 | 3.8% |
| 5 to 9 Minutes | 367 | 11.1% |
| 10 to 14 Minutes | 291 | 8.8% |
| 15 to 19 Minutes | 247 | 7.5% |
| 20 to 24 Minutes | 61 | 1.8% |
| 25 to 29 Minutes | 335 | 10.2% |
| 30 to 34 Minutes | 557 | 16.9% |
| 35 to 39 Minutes | 187 | 5.7% |
| 40 to 44 Minutes | 165 | 5.0% |
| 45 to 59 Minutes | 358 | 10.9% |
| 60 to 89 Minutes | 507 | 15.4% |
| 90 or more Minutes | 96 | 2.9% |
Commute Time by Sex in Whitinsville
The most common commute times in Whitinsville are 30 to 34 minutes (400 commuters, 24.9%) for males and 5 to 9 minutes (258 commuters, 15.2%) for females.
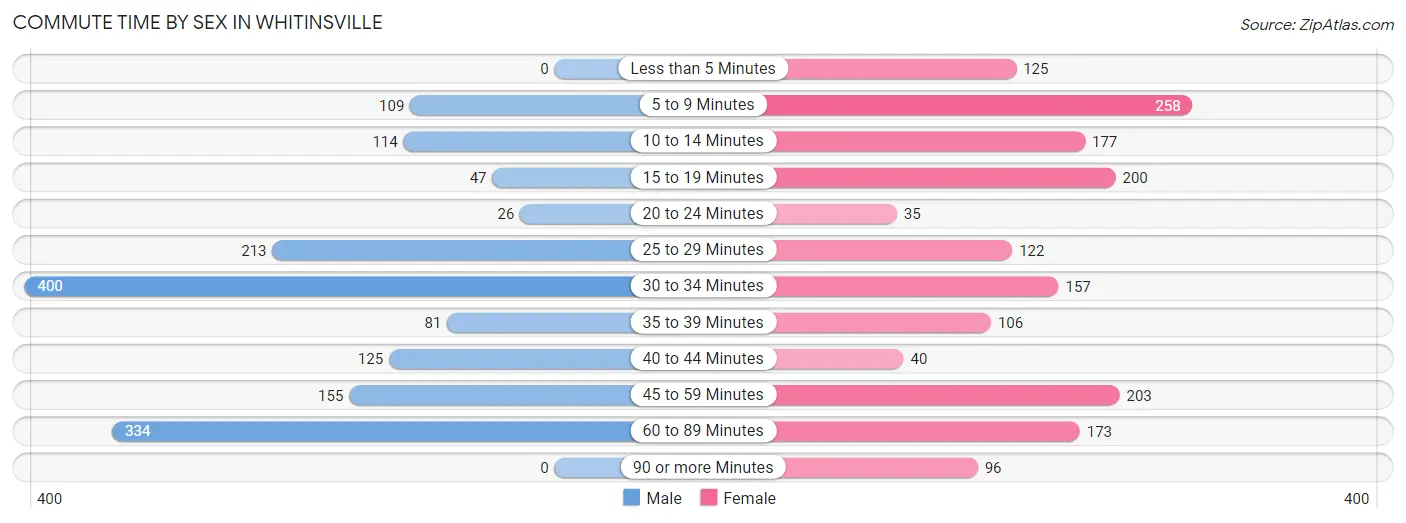
| Commute Time | Male | Female |
| Less than 5 Minutes | 0 (0.0%) | 125 (7.4%) |
| 5 to 9 Minutes | 109 (6.8%) | 258 (15.2%) |
| 10 to 14 Minutes | 114 (7.1%) | 177 (10.5%) |
| 15 to 19 Minutes | 47 (2.9%) | 200 (11.8%) |
| 20 to 24 Minutes | 26 (1.6%) | 35 (2.1%) |
| 25 to 29 Minutes | 213 (13.3%) | 122 (7.2%) |
| 30 to 34 Minutes | 400 (24.9%) | 157 (9.3%) |
| 35 to 39 Minutes | 81 (5.1%) | 106 (6.3%) |
| 40 to 44 Minutes | 125 (7.8%) | 40 (2.4%) |
| 45 to 59 Minutes | 155 (9.7%) | 203 (12.0%) |
| 60 to 89 Minutes | 334 (20.8%) | 173 (10.2%) |
| 90 or more Minutes | 0 (0.0%) | 96 (5.7%) |
Time of Departure to Work by Sex in Whitinsville
The most frequent times of departure to work in Whitinsville are 12:00 AM to 4:59 AM (302, 18.8%) for males and 7:30 AM to 7:59 AM (244, 14.4%) for females.
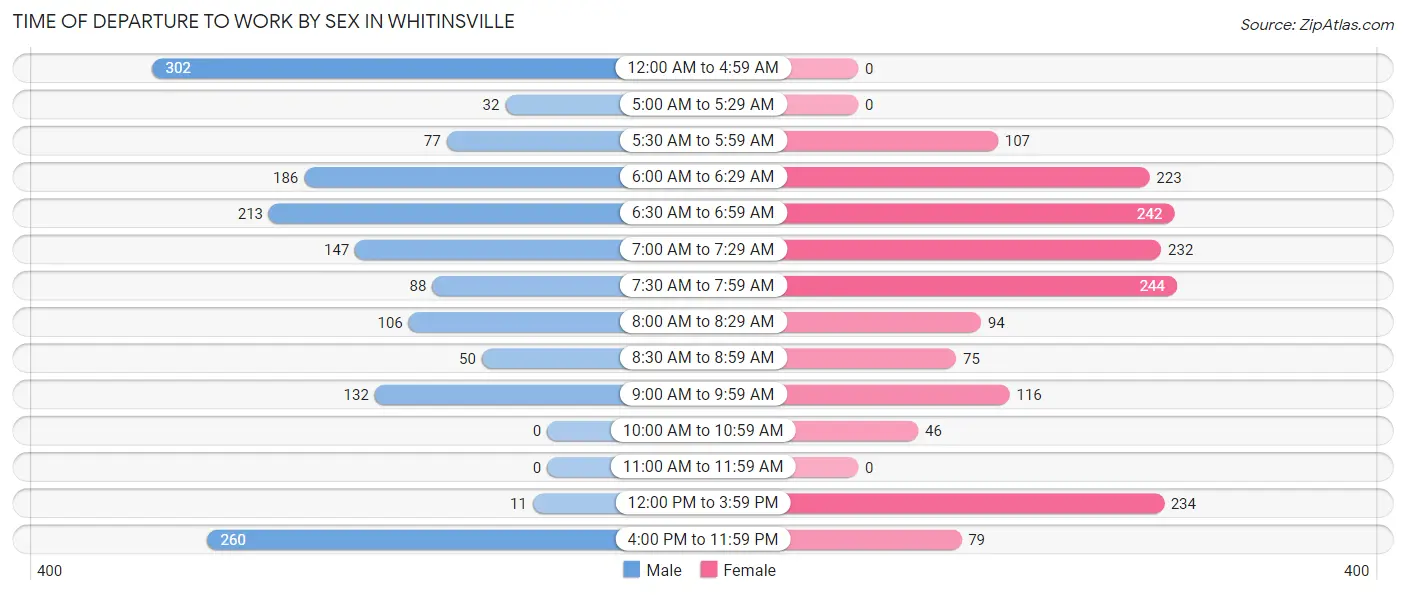
| Time of Departure | Male | Female |
| 12:00 AM to 4:59 AM | 302 (18.8%) | 0 (0.0%) |
| 5:00 AM to 5:29 AM | 32 (2.0%) | 0 (0.0%) |
| 5:30 AM to 5:59 AM | 77 (4.8%) | 107 (6.3%) |
| 6:00 AM to 6:29 AM | 186 (11.6%) | 223 (13.2%) |
| 6:30 AM to 6:59 AM | 213 (13.3%) | 242 (14.3%) |
| 7:00 AM to 7:29 AM | 147 (9.2%) | 232 (13.7%) |
| 7:30 AM to 7:59 AM | 88 (5.5%) | 244 (14.4%) |
| 8:00 AM to 8:29 AM | 106 (6.6%) | 94 (5.6%) |
| 8:30 AM to 8:59 AM | 50 (3.1%) | 75 (4.4%) |
| 9:00 AM to 9:59 AM | 132 (8.2%) | 116 (6.9%) |
| 10:00 AM to 10:59 AM | 0 (0.0%) | 46 (2.7%) |
| 11:00 AM to 11:59 AM | 0 (0.0%) | 0 (0.0%) |
| 12:00 PM to 3:59 PM | 11 (0.7%) | 234 (13.8%) |
| 4:00 PM to 11:59 PM | 260 (16.2%) | 79 (4.7%) |
| Total | 1,604 (100.0%) | 1,692 (100.0%) |
Housing Occupancy in Whitinsville
Occupancy by Ownership in Whitinsville
Of the total 2,830 dwellings in Whitinsville, owner-occupied units account for 1,629 (57.6%), while renter-occupied units make up 1,201 (42.4%).
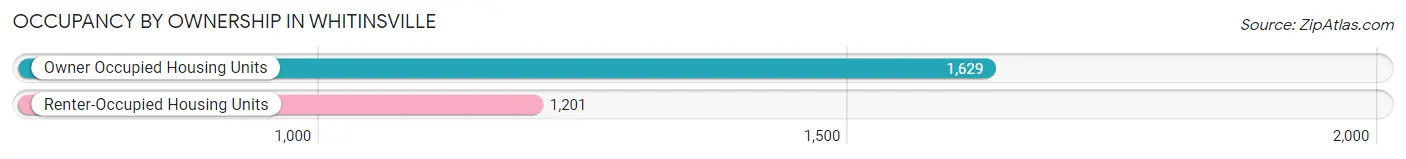
| Occupancy | # Housing Units | % Housing Units |
| Owner Occupied Housing Units | 1,629 | 57.6% |
| Renter-Occupied Housing Units | 1,201 | 42.4% |
| Total Occupied Housing Units | 2,830 | 100.0% |
Occupancy by Household Size in Whitinsville
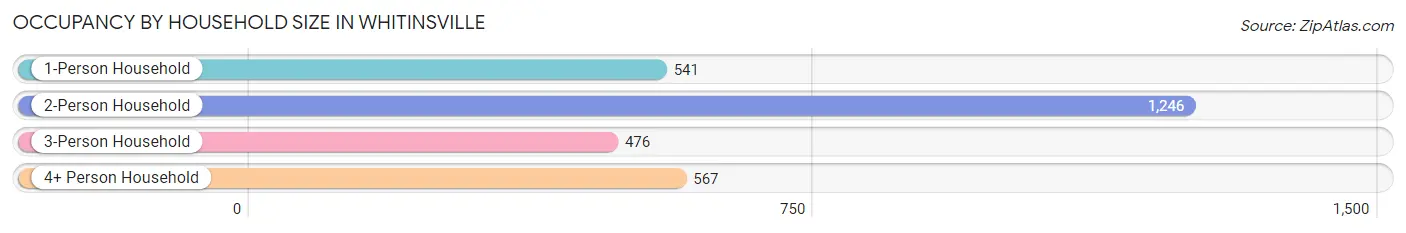
| Household Size | # Housing Units | % Housing Units |
| 1-Person Household | 541 | 19.1% |
| 2-Person Household | 1,246 | 44.0% |
| 3-Person Household | 476 | 16.8% |
| 4+ Person Household | 567 | 20.0% |
| Total Housing Units | 2,830 | 100.0% |
Occupancy by Ownership by Household Size in Whitinsville
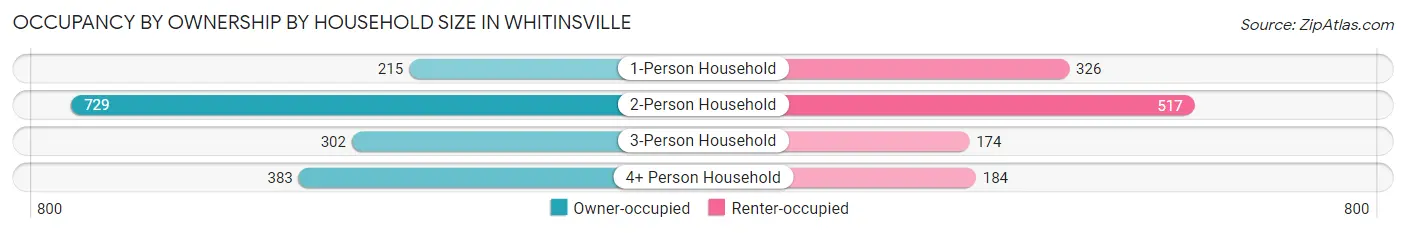
| Household Size | Owner-occupied | Renter-occupied |
| 1-Person Household | 215 (39.7%) | 326 (60.3%) |
| 2-Person Household | 729 (58.5%) | 517 (41.5%) |
| 3-Person Household | 302 (63.4%) | 174 (36.5%) |
| 4+ Person Household | 383 (67.5%) | 184 (32.5%) |
| Total Housing Units | 1,629 (57.6%) | 1,201 (42.4%) |
Occupancy by Educational Attainment in Whitinsville
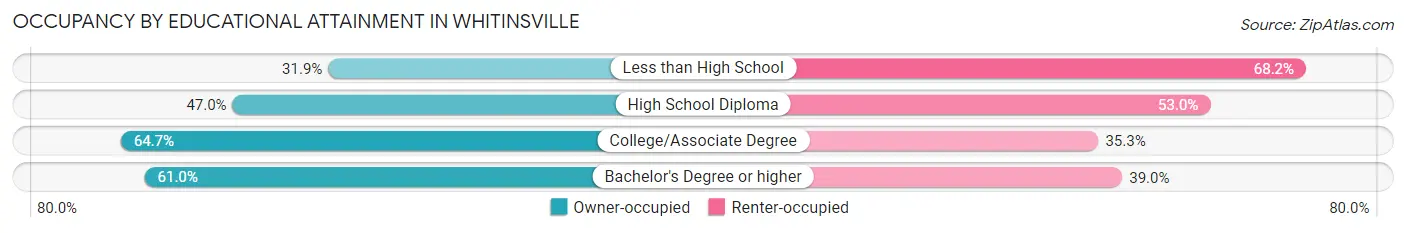
| Household Size | Owner-occupied | Renter-occupied |
| Less than High School | 43 (31.9%) | 92 (68.1%) |
| High School Diploma | 340 (47.0%) | 383 (53.0%) |
| College/Associate Degree | 751 (64.7%) | 409 (35.3%) |
| Bachelor's Degree or higher | 495 (61.0%) | 317 (39.0%) |
Occupancy by Age of Householder in Whitinsville
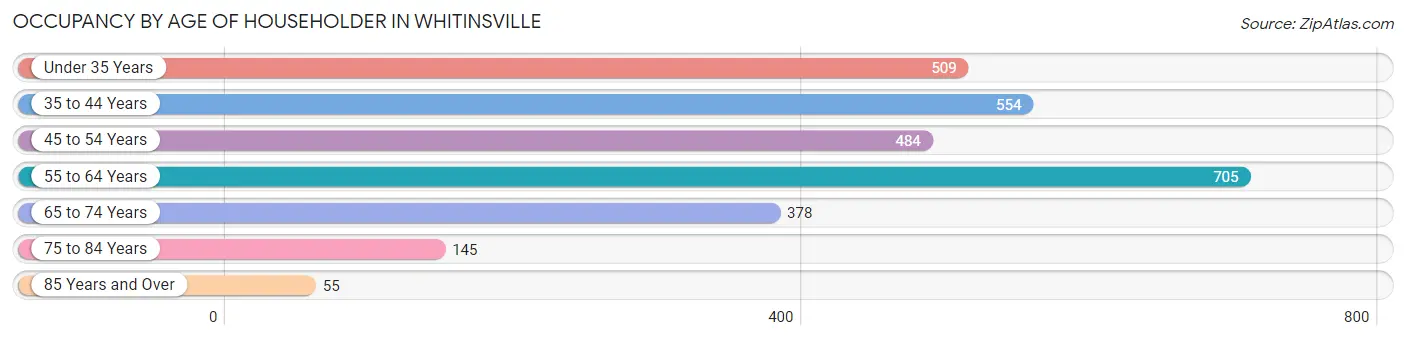
| Age Bracket | # Households | % Households |
| Under 35 Years | 509 | 18.0% |
| 35 to 44 Years | 554 | 19.6% |
| 45 to 54 Years | 484 | 17.1% |
| 55 to 64 Years | 705 | 24.9% |
| 65 to 74 Years | 378 | 13.4% |
| 75 to 84 Years | 145 | 5.1% |
| 85 Years and Over | 55 | 1.9% |
| Total | 2,830 | 100.0% |
Housing Finances in Whitinsville
Median Income by Occupancy in Whitinsville
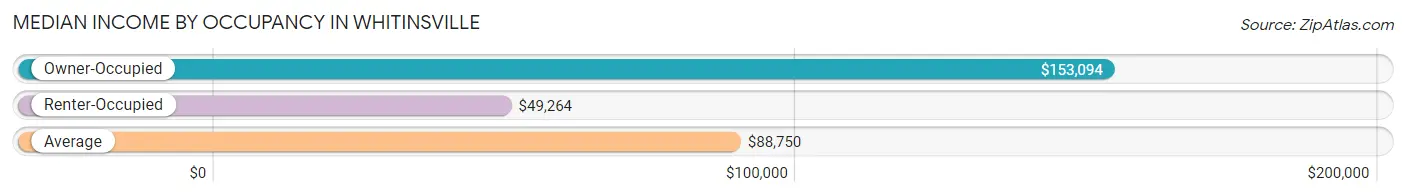
| Occupancy Type | # Households | Median Income |
| Owner-Occupied | 1,629 (57.6%) | $153,094 |
| Renter-Occupied | 1,201 (42.4%) | $49,264 |
| Average | 2,830 (100.0%) | $88,750 |
Occupancy by Householder Income Bracket in Whitinsville
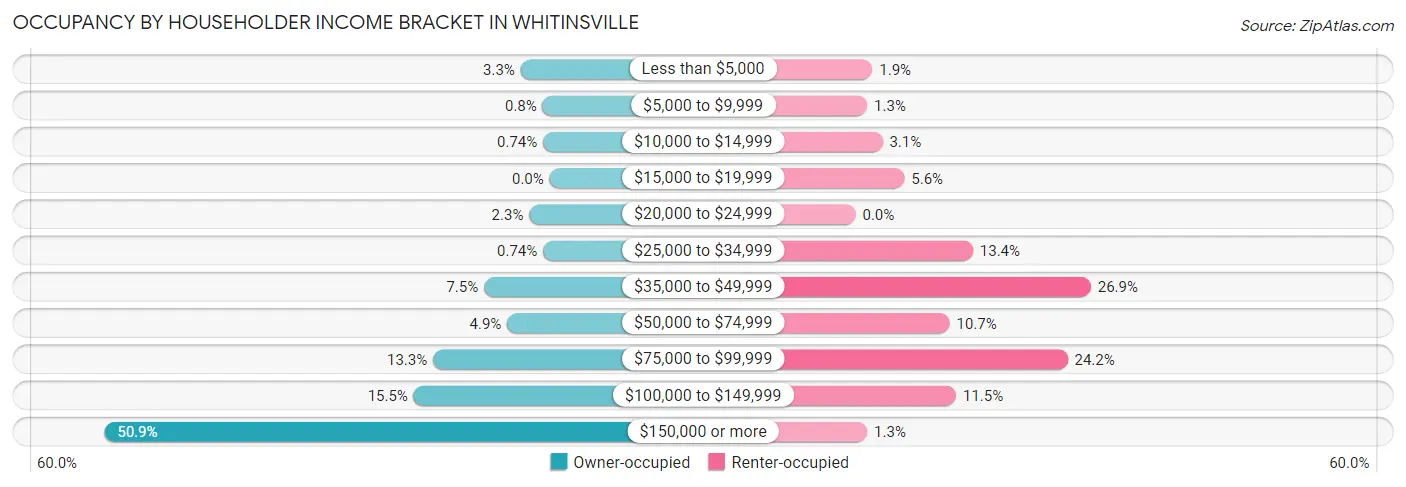
| Income Bracket | Owner-occupied | Renter-occupied |
| Less than $5,000 | 54 (3.3%) | 23 (1.9%) |
| $5,000 to $9,999 | 13 (0.8%) | 16 (1.3%) |
| $10,000 to $14,999 | 12 (0.7%) | 37 (3.1%) |
| $15,000 to $19,999 | 0 (0.0%) | 67 (5.6%) |
| $20,000 to $24,999 | 38 (2.3%) | 0 (0.0%) |
| $25,000 to $34,999 | 12 (0.7%) | 161 (13.4%) |
| $35,000 to $49,999 | 122 (7.5%) | 323 (26.9%) |
| $50,000 to $74,999 | 79 (4.9%) | 129 (10.7%) |
| $75,000 to $99,999 | 217 (13.3%) | 291 (24.2%) |
| $100,000 to $149,999 | 253 (15.5%) | 138 (11.5%) |
| $150,000 or more | 829 (50.9%) | 16 (1.3%) |
| Total | 1,629 (100.0%) | 1,201 (100.0%) |
Monthly Housing Cost Tiers in Whitinsville
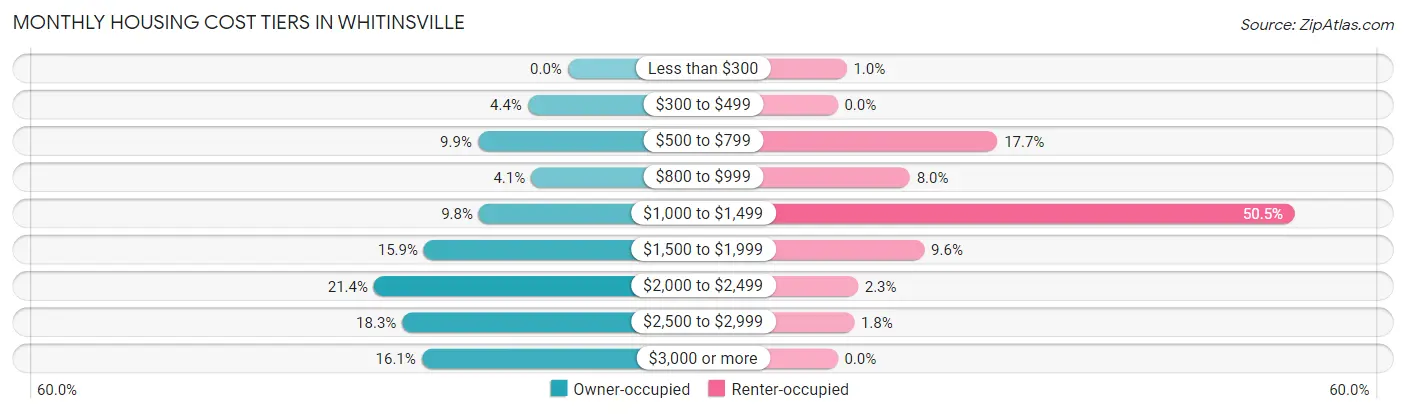
| Monthly Cost | Owner-occupied | Renter-occupied |
| Less than $300 | 0 (0.0%) | 12 (1.0%) |
| $300 to $499 | 72 (4.4%) | 0 (0.0%) |
| $500 to $799 | 162 (9.9%) | 212 (17.6%) |
| $800 to $999 | 66 (4.1%) | 96 (8.0%) |
| $1,000 to $1,499 | 160 (9.8%) | 607 (50.5%) |
| $1,500 to $1,999 | 259 (15.9%) | 115 (9.6%) |
| $2,000 to $2,499 | 349 (21.4%) | 27 (2.2%) |
| $2,500 to $2,999 | 298 (18.3%) | 22 (1.8%) |
| $3,000 or more | 263 (16.1%) | 0 (0.0%) |
| Total | 1,629 (100.0%) | 1,201 (100.0%) |
Physical Housing Characteristics in Whitinsville
Housing Structures in Whitinsville
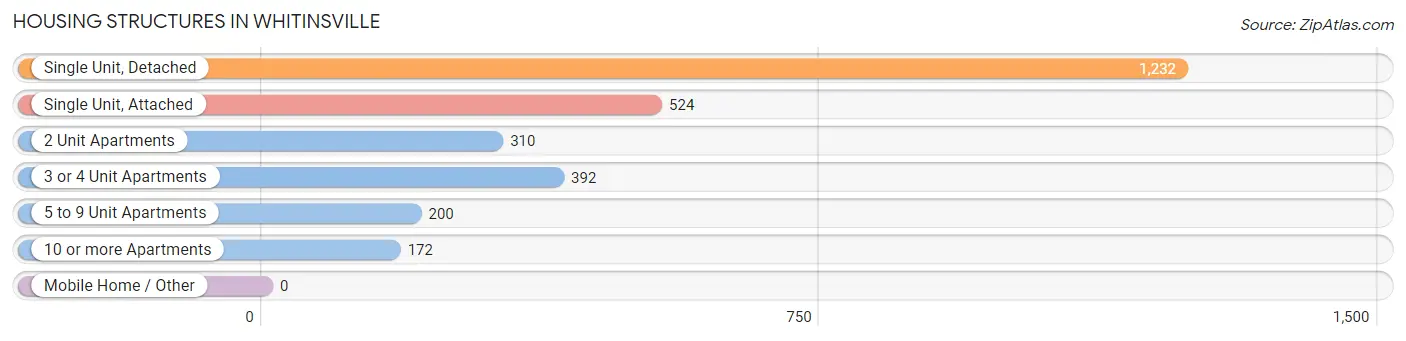
| Structure Type | # Housing Units | % Housing Units |
| Single Unit, Detached | 1,232 | 43.5% |
| Single Unit, Attached | 524 | 18.5% |
| 2 Unit Apartments | 310 | 11.0% |
| 3 or 4 Unit Apartments | 392 | 13.9% |
| 5 to 9 Unit Apartments | 200 | 7.1% |
| 10 or more Apartments | 172 | 6.1% |
| Mobile Home / Other | 0 | 0.0% |
| Total | 2,830 | 100.0% |
Housing Structures by Occupancy in Whitinsville
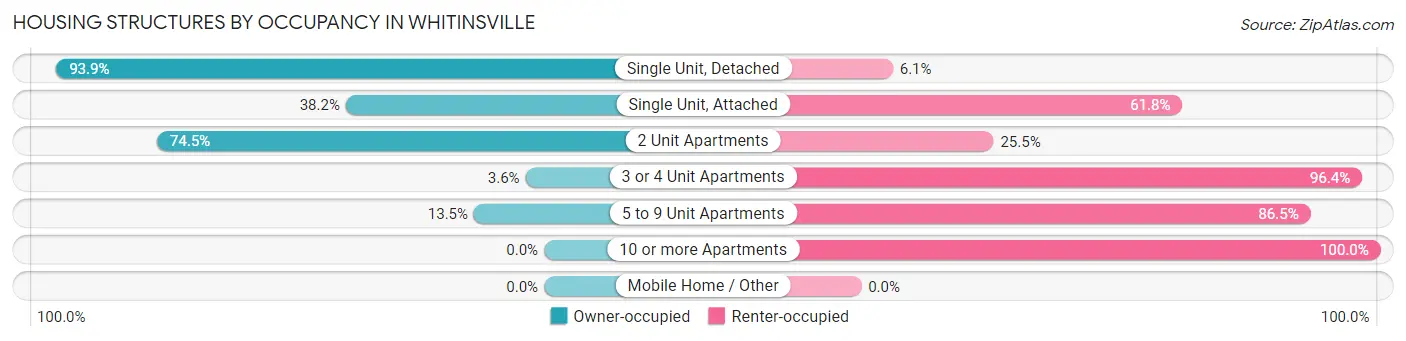
| Structure Type | Owner-occupied | Renter-occupied |
| Single Unit, Detached | 1,157 (93.9%) | 75 (6.1%) |
| Single Unit, Attached | 200 (38.2%) | 324 (61.8%) |
| 2 Unit Apartments | 231 (74.5%) | 79 (25.5%) |
| 3 or 4 Unit Apartments | 14 (3.6%) | 378 (96.4%) |
| 5 to 9 Unit Apartments | 27 (13.5%) | 173 (86.5%) |
| 10 or more Apartments | 0 (0.0%) | 172 (100.0%) |
| Mobile Home / Other | 0 (0.0%) | 0 (0.0%) |
| Total | 1,629 (57.6%) | 1,201 (42.4%) |
Housing Structures by Number of Rooms in Whitinsville
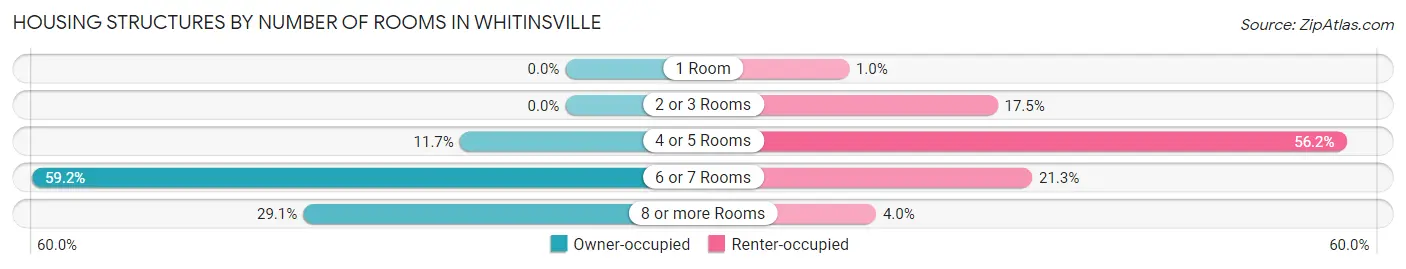
| Number of Rooms | Owner-occupied | Renter-occupied |
| 1 Room | 0 (0.0%) | 12 (1.0%) |
| 2 or 3 Rooms | 0 (0.0%) | 210 (17.5%) |
| 4 or 5 Rooms | 191 (11.7%) | 675 (56.2%) |
| 6 or 7 Rooms | 964 (59.2%) | 256 (21.3%) |
| 8 or more Rooms | 474 (29.1%) | 48 (4.0%) |
| Total | 1,629 (100.0%) | 1,201 (100.0%) |
Housing Structure by Heating Type in Whitinsville
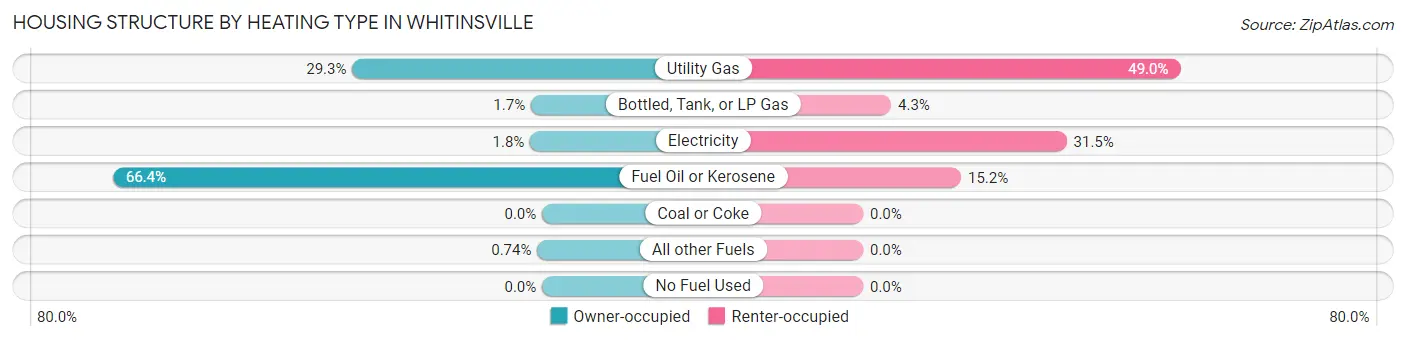
| Heating Type | Owner-occupied | Renter-occupied |
| Utility Gas | 478 (29.3%) | 589 (49.0%) |
| Bottled, Tank, or LP Gas | 28 (1.7%) | 52 (4.3%) |
| Electricity | 30 (1.8%) | 378 (31.5%) |
| Fuel Oil or Kerosene | 1,081 (66.4%) | 182 (15.1%) |
| Coal or Coke | 0 (0.0%) | 0 (0.0%) |
| All other Fuels | 12 (0.7%) | 0 (0.0%) |
| No Fuel Used | 0 (0.0%) | 0 (0.0%) |
| Total | 1,629 (100.0%) | 1,201 (100.0%) |
Household Vehicle Usage in Whitinsville
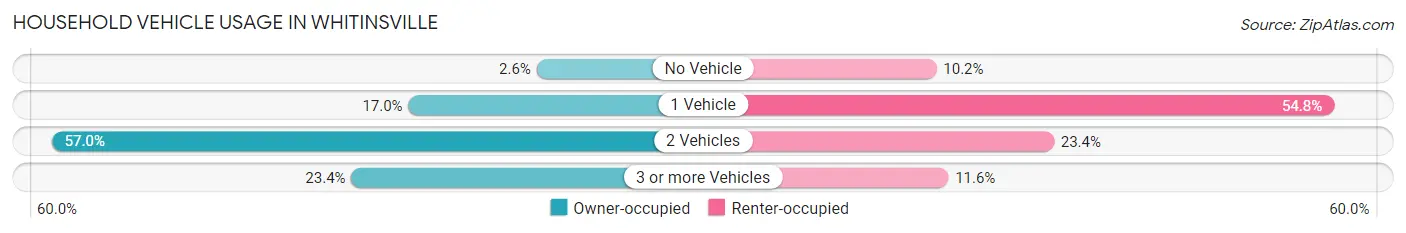
| Vehicles per Household | Owner-occupied | Renter-occupied |
| No Vehicle | 43 (2.6%) | 123 (10.2%) |
| 1 Vehicle | 277 (17.0%) | 658 (54.8%) |
| 2 Vehicles | 928 (57.0%) | 281 (23.4%) |
| 3 or more Vehicles | 381 (23.4%) | 139 (11.6%) |
| Total | 1,629 (100.0%) | 1,201 (100.0%) |
Real Estate & Mortgages in Whitinsville
Real Estate and Mortgage Overview in Whitinsville
| Characteristic | Without Mortgage | With Mortgage |
| Housing Units | 371 | 1,258 |
| Median Property Value | $328,200 | $417,500 |
| Median Household Income | $117,604 | $774 |
| Monthly Housing Costs | $751 | $263 |
| Real Estate Taxes | $3,113 | $0 |
Property Value by Mortgage Status in Whitinsville
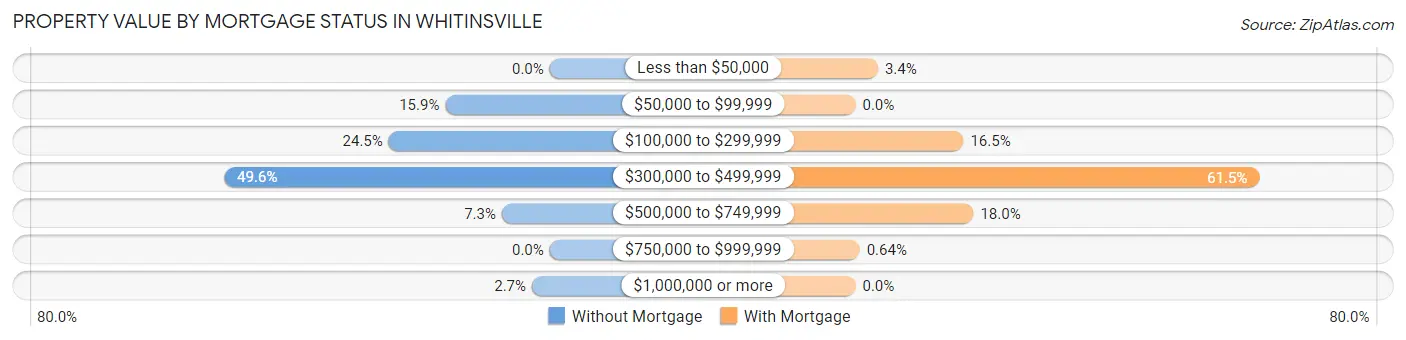
| Property Value | Without Mortgage | With Mortgage |
| Less than $50,000 | 0 (0.0%) | 43 (3.4%) |
| $50,000 to $99,999 | 59 (15.9%) | 0 (0.0%) |
| $100,000 to $299,999 | 91 (24.5%) | 207 (16.5%) |
| $300,000 to $499,999 | 184 (49.6%) | 774 (61.5%) |
| $500,000 to $749,999 | 27 (7.3%) | 226 (18.0%) |
| $750,000 to $999,999 | 0 (0.0%) | 8 (0.6%) |
| $1,000,000 or more | 10 (2.7%) | 0 (0.0%) |
| Total | 371 (100.0%) | 1,258 (100.0%) |
Household Income by Mortgage Status in Whitinsville
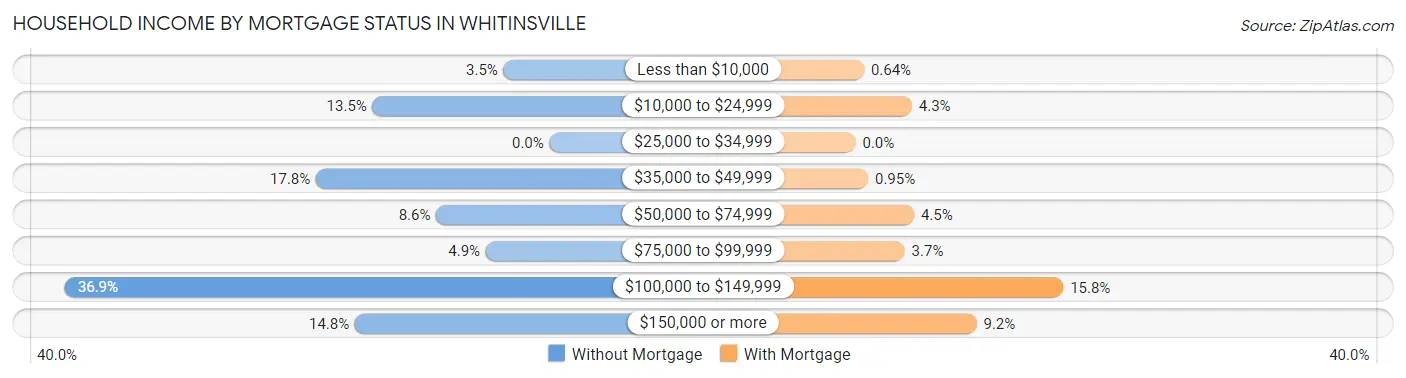
| Household Income | Without Mortgage | With Mortgage |
| Less than $10,000 | 13 (3.5%) | 8 (0.6%) |
| $10,000 to $24,999 | 50 (13.5%) | 54 (4.3%) |
| $25,000 to $34,999 | 0 (0.0%) | 0 (0.0%) |
| $35,000 to $49,999 | 66 (17.8%) | 12 (0.9%) |
| $50,000 to $74,999 | 32 (8.6%) | 56 (4.4%) |
| $75,000 to $99,999 | 18 (4.9%) | 47 (3.7%) |
| $100,000 to $149,999 | 137 (36.9%) | 199 (15.8%) |
| $150,000 or more | 55 (14.8%) | 116 (9.2%) |
| Total | 371 (100.0%) | 1,258 (100.0%) |
Property Value to Household Income Ratio in Whitinsville
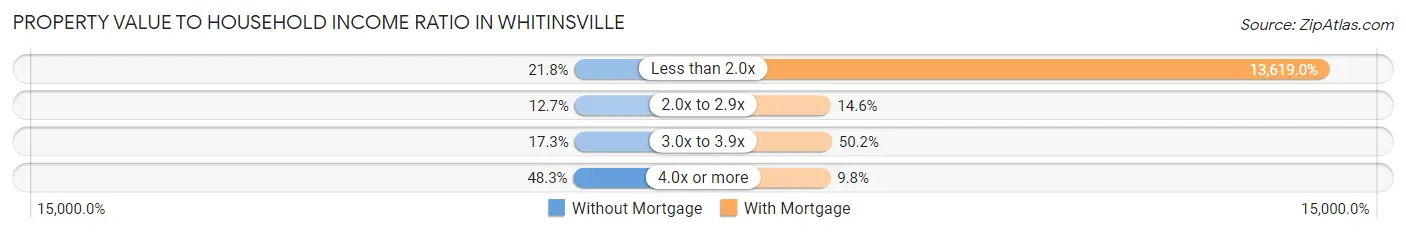
| Value-to-Income Ratio | Without Mortgage | With Mortgage |
| Less than 2.0x | 81 (21.8%) | 171,327 (13,619.0%) |
| 2.0x to 2.9x | 47 (12.7%) | 184 (14.6%) |
| 3.0x to 3.9x | 64 (17.2%) | 632 (50.2%) |
| 4.0x or more | 179 (48.2%) | 123 (9.8%) |
| Total | 371 (100.0%) | 1,258 (100.0%) |
Real Estate Taxes by Mortgage Status in Whitinsville
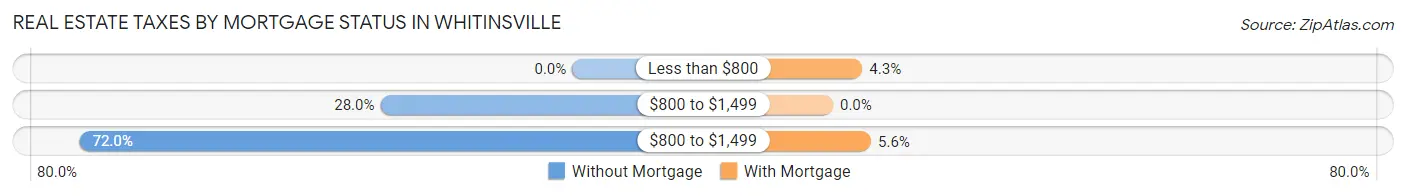
| Property Taxes | Without Mortgage | With Mortgage |
| Less than $800 | 0 (0.0%) | 54 (4.3%) |
| $800 to $1,499 | 104 (28.0%) | 0 (0.0%) |
| $800 to $1,499 | 267 (72.0%) | 70 (5.6%) |
| Total | 371 (100.0%) | 1,258 (100.0%) |
Health & Disability in Whitinsville
Health Insurance Coverage by Age in Whitinsville
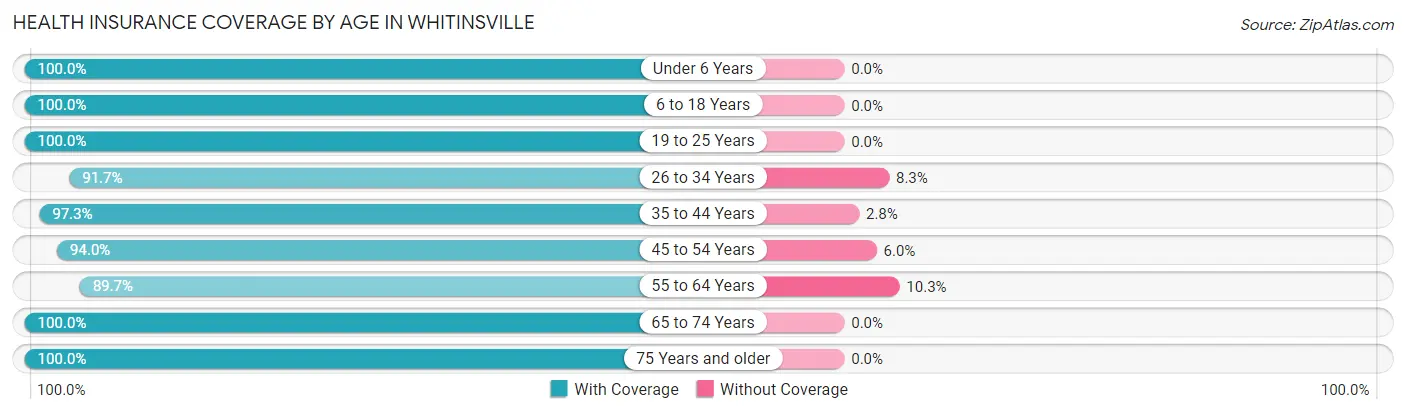
| Age Bracket | With Coverage | Without Coverage |
| Under 6 Years | 619 (100.0%) | 0 (0.0%) |
| 6 to 18 Years | 1,093 (100.0%) | 0 (0.0%) |
| 19 to 25 Years | 695 (100.0%) | 0 (0.0%) |
| 26 to 34 Years | 780 (91.7%) | 71 (8.3%) |
| 35 to 44 Years | 850 (97.3%) | 24 (2.8%) |
| 45 to 54 Years | 841 (94.0%) | 54 (6.0%) |
| 55 to 64 Years | 1,012 (89.7%) | 116 (10.3%) |
| 65 to 74 Years | 701 (100.0%) | 0 (0.0%) |
| 75 Years and older | 310 (100.0%) | 0 (0.0%) |
| Total | 6,901 (96.3%) | 265 (3.7%) |
Health Insurance Coverage by Citizenship Status in Whitinsville
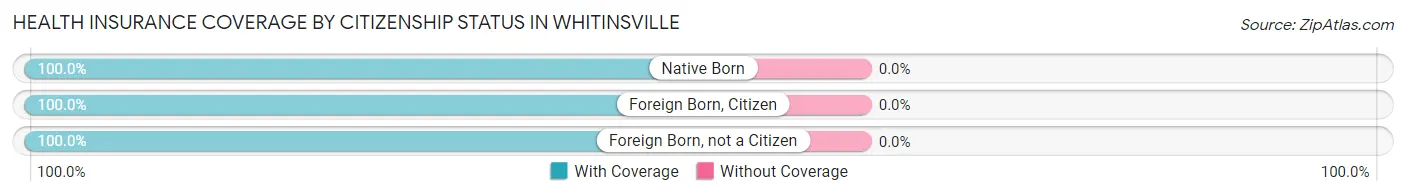
| Citizenship Status | With Coverage | Without Coverage |
| Native Born | 619 (100.0%) | 0 (0.0%) |
| Foreign Born, Citizen | 1,093 (100.0%) | 0 (0.0%) |
| Foreign Born, not a Citizen | 695 (100.0%) | 0 (0.0%) |
Health Insurance Coverage by Household Income in Whitinsville
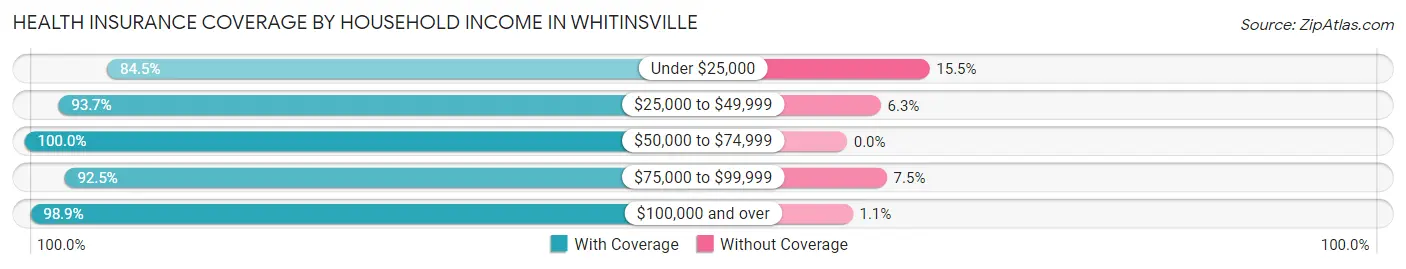
| Household Income | With Coverage | Without Coverage |
| Under $25,000 | 295 (84.5%) | 54 (15.5%) |
| $25,000 to $49,999 | 1,051 (93.7%) | 71 (6.3%) |
| $50,000 to $74,999 | 443 (100.0%) | 0 (0.0%) |
| $75,000 to $99,999 | 1,214 (92.5%) | 98 (7.5%) |
| $100,000 and over | 3,897 (98.9%) | 42 (1.1%) |
Public vs Private Health Insurance Coverage by Age in Whitinsville
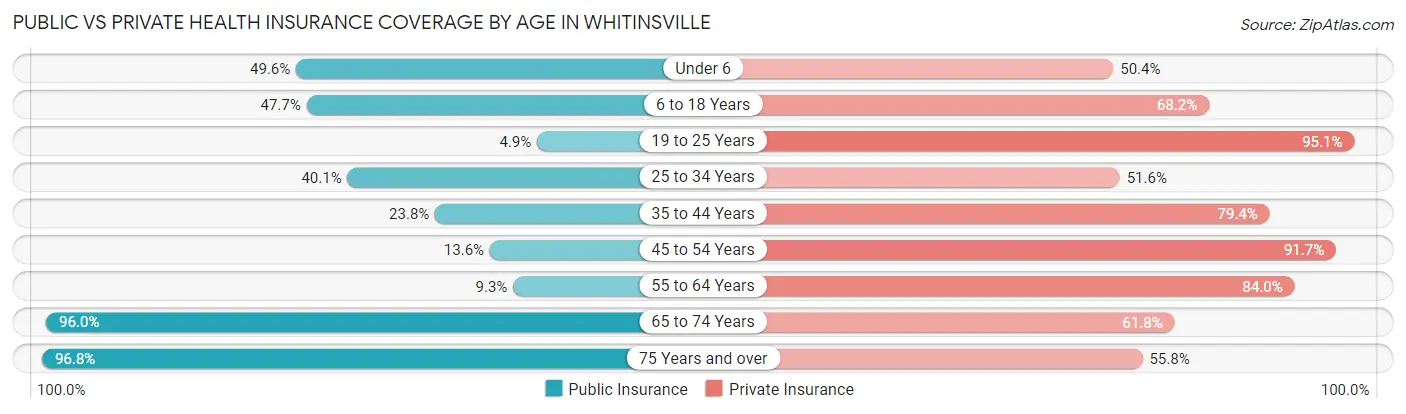
| Age Bracket | Public Insurance | Private Insurance |
| Under 6 | 307 (49.6%) | 312 (50.4%) |
| 6 to 18 Years | 521 (47.7%) | 745 (68.2%) |
| 19 to 25 Years | 34 (4.9%) | 661 (95.1%) |
| 25 to 34 Years | 341 (40.1%) | 439 (51.6%) |
| 35 to 44 Years | 208 (23.8%) | 694 (79.4%) |
| 45 to 54 Years | 122 (13.6%) | 821 (91.7%) |
| 55 to 64 Years | 105 (9.3%) | 948 (84.0%) |
| 65 to 74 Years | 673 (96.0%) | 433 (61.8%) |
| 75 Years and over | 300 (96.8%) | 173 (55.8%) |
| Total | 2,611 (36.4%) | 5,226 (72.9%) |
Disability Status by Sex by Age in Whitinsville
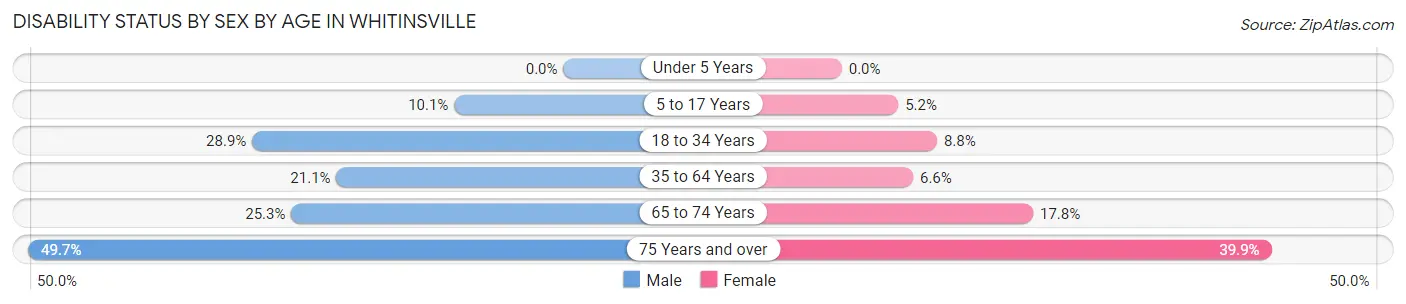
| Age Bracket | Male | Female |
| Under 5 Years | 0 (0.0%) | 0 (0.0%) |
| 5 to 17 Years | 46 (10.1%) | 37 (5.2%) |
| 18 to 34 Years | 201 (28.9%) | 84 (8.8%) |
| 35 to 64 Years | 314 (21.1%) | 93 (6.6%) |
| 65 to 74 Years | 76 (25.3%) | 71 (17.7%) |
| 75 Years and over | 78 (49.7%) | 61 (39.9%) |
Disability Class by Sex by Age in Whitinsville
Disability Class: Hearing Difficulty
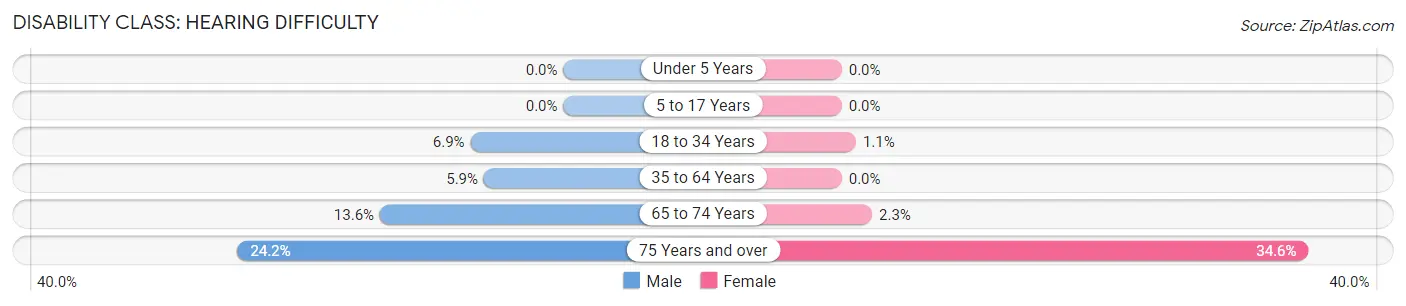
| Age Bracket | Male | Female |
| Under 5 Years | 0 (0.0%) | 0 (0.0%) |
| 5 to 17 Years | 0 (0.0%) | 0 (0.0%) |
| 18 to 34 Years | 48 (6.9%) | 10 (1.1%) |
| 35 to 64 Years | 88 (5.9%) | 0 (0.0%) |
| 65 to 74 Years | 41 (13.6%) | 9 (2.2%) |
| 75 Years and over | 38 (24.2%) | 53 (34.6%) |
Disability Class: Vision Difficulty
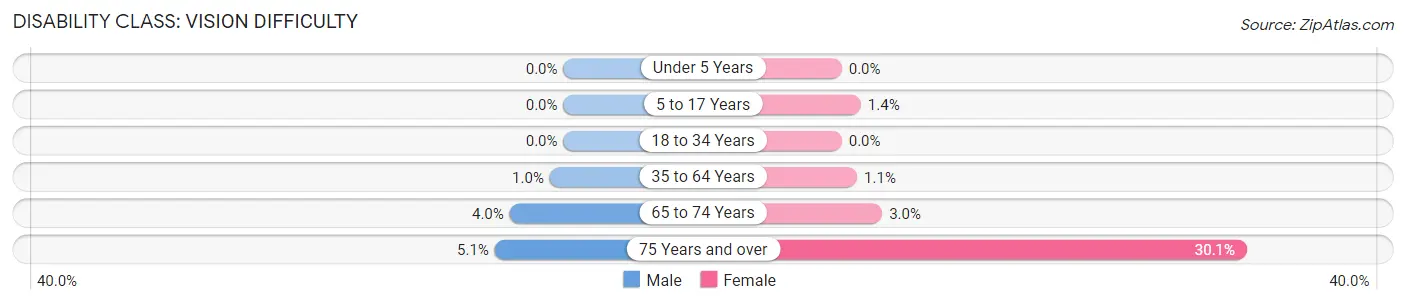
| Age Bracket | Male | Female |
| Under 5 Years | 0 (0.0%) | 0 (0.0%) |
| 5 to 17 Years | 0 (0.0%) | 10 (1.4%) |
| 18 to 34 Years | 0 (0.0%) | 0 (0.0%) |
| 35 to 64 Years | 15 (1.0%) | 16 (1.1%) |
| 65 to 74 Years | 12 (4.0%) | 12 (3.0%) |
| 75 Years and over | 8 (5.1%) | 46 (30.1%) |
Disability Class: Cognitive Difficulty
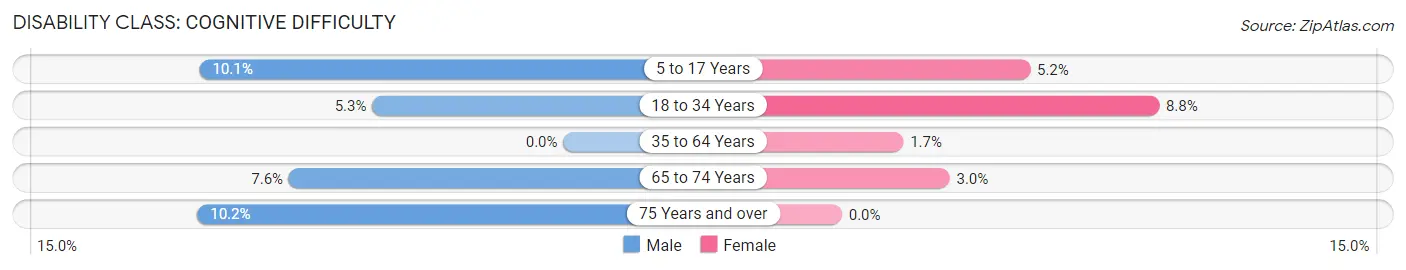
| Age Bracket | Male | Female |
| 5 to 17 Years | 46 (10.1%) | 37 (5.2%) |
| 18 to 34 Years | 37 (5.3%) | 84 (8.8%) |
| 35 to 64 Years | 0 (0.0%) | 24 (1.7%) |
| 65 to 74 Years | 23 (7.6%) | 12 (3.0%) |
| 75 Years and over | 16 (10.2%) | 0 (0.0%) |
Disability Class: Ambulatory Difficulty
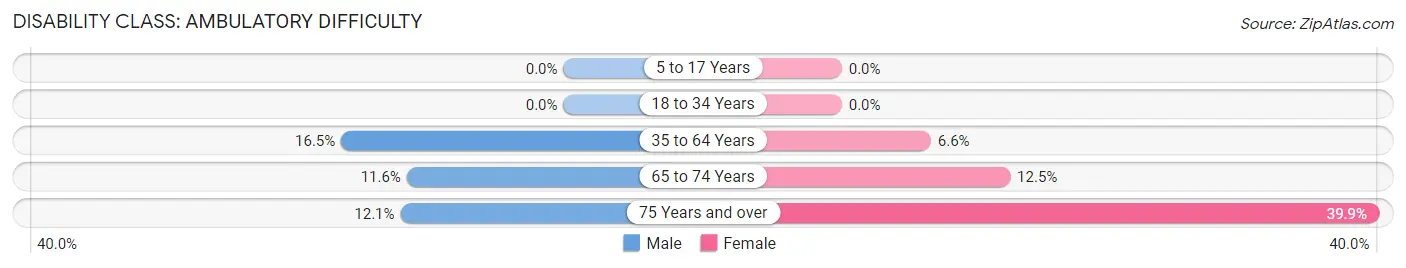
| Age Bracket | Male | Female |
| 5 to 17 Years | 0 (0.0%) | 0 (0.0%) |
| 18 to 34 Years | 0 (0.0%) | 0 (0.0%) |
| 35 to 64 Years | 246 (16.5%) | 93 (6.6%) |
| 65 to 74 Years | 35 (11.6%) | 50 (12.5%) |
| 75 Years and over | 19 (12.1%) | 61 (39.9%) |
Disability Class: Self-Care Difficulty
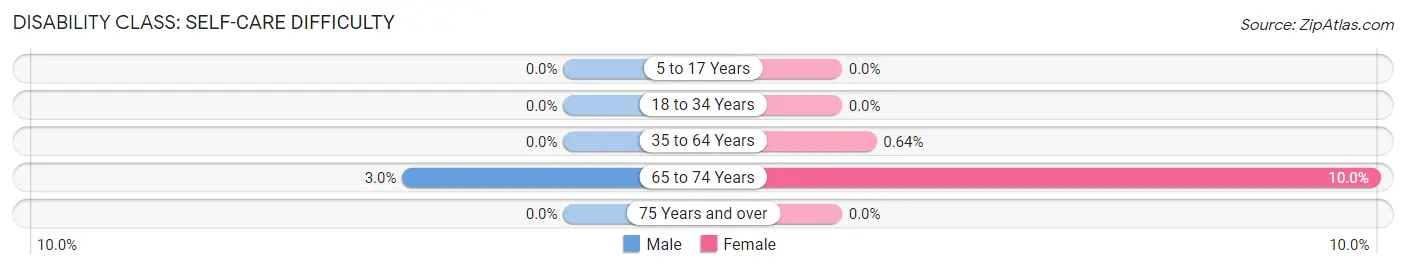
| Age Bracket | Male | Female |
| 5 to 17 Years | 0 (0.0%) | 0 (0.0%) |
| 18 to 34 Years | 0 (0.0%) | 0 (0.0%) |
| 35 to 64 Years | 0 (0.0%) | 9 (0.6%) |
| 65 to 74 Years | 9 (3.0%) | 40 (10.0%) |
| 75 Years and over | 0 (0.0%) | 0 (0.0%) |
Technology Access in Whitinsville
Computing Device Access in Whitinsville
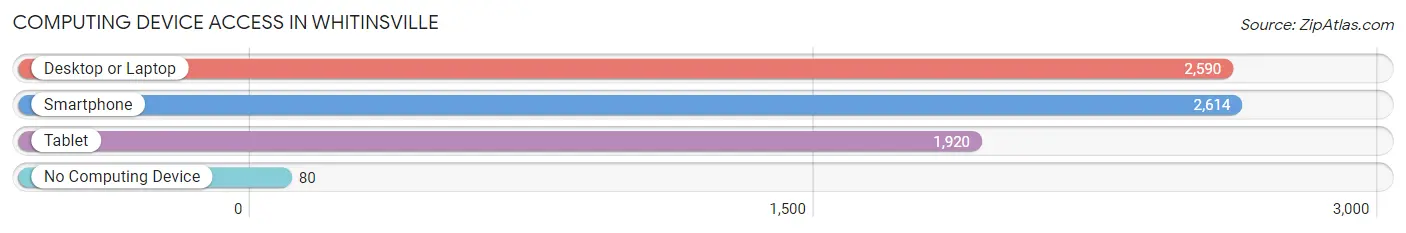
| Device Type | # Households | % Households |
| Desktop or Laptop | 2,590 | 91.5% |
| Smartphone | 2,614 | 92.4% |
| Tablet | 1,920 | 67.8% |
| No Computing Device | 80 | 2.8% |
| Total | 2,830 | 100.0% |
Internet Access in Whitinsville
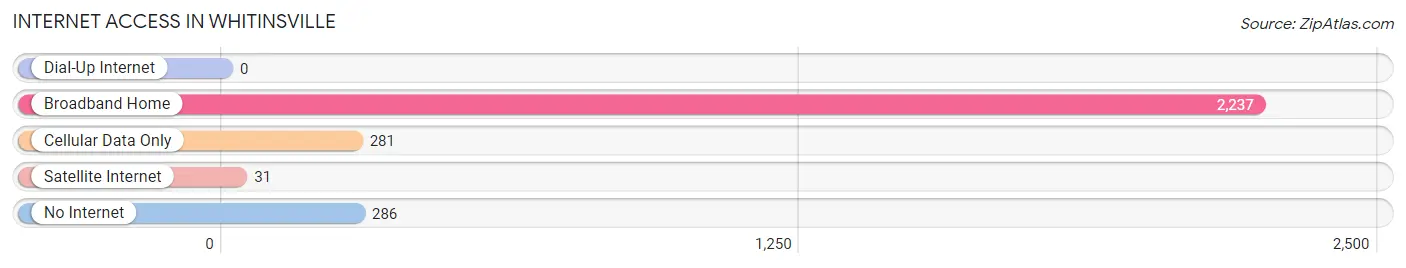
| Internet Type | # Households | % Households |
| Dial-Up Internet | 0 | 0.0% |
| Broadband Home | 2,237 | 79.0% |
| Cellular Data Only | 281 | 9.9% |
| Satellite Internet | 31 | 1.1% |
| No Internet | 286 | 10.1% |
| Total | 2,830 | 100.0% |
Whitinsville Summary
Whitinsville is a small town located in the Blackstone Valley region of Massachusetts. It is situated in the northern part of Worcester County, about 25 miles southwest of Boston. The town is bordered by Northbridge to the north, Uxbridge to the east, and Douglas to the south. The population of Whitinsville was 6,097 at the 2010 census.
History
Whitinsville was first settled in 1720 by the Whitin family, who were among the first settlers of the Blackstone Valley. The town was originally known as North Village, but was later renamed Whitinsville in 1838 in honor of the Whitin family. The town was officially incorporated in 1848.
In the 19th century, Whitinsville was a major industrial center, with several factories producing textiles, paper, and other goods. The Whitin Machine Works, founded in 1831, was one of the largest employers in the area. The company produced a variety of products, including cotton and woolen machinery, paper-making machinery, and steam engines. The company was a major employer in the area until it closed in the late 20th century.
Geography
Whitinsville is located at 42°06'N 71°37'W (42.10, -71.62). According to the United States Census Bureau, the town has a total area of 8.2 square miles (21.2 km2), of which 8.1 square miles (21.0 km2) is land and 0.1 square miles (0.2 km2) (1.25%) is water.
The town is located in the Blackstone Valley region of Massachusetts, and is bordered by Northbridge to the north, Uxbridge to the east, and Douglas to the south. The Blackstone River runs through the town, and the town is home to several ponds, including Lake Siog, Lake Siog Beach, and Lake Siog Park.
Economy
Whitinsville is a small, rural town with a population of just over 6,000. The town is home to several small businesses, including a few restaurants, a grocery store, and a few retail stores. The town is also home to several industrial businesses, including the Whitin Machine Works, which produces paper-making machinery, and the Whitin Foundry, which produces castings for the automotive and aerospace industries.
Demographics
As of the 2010 census, there were 6,097 people, 2,521 households, and 1,637 families residing in the town. The population density was 751.2 people per square mile (290.2/km2). There were 2,717 housing units at an average density of 334.3 per square mile (129.2/km2). The racial makeup of the town was 94.2% White, 1.2% African American, 0.3% Native American, 1.2% Asian, 0.1% Pacific Islander, 1.3% from other races, and 1.7% from two or more races. Hispanic or Latino of any race were 3.2% of the population.
There were 2,521 households, out of which 28.7% had children under the age of 18 living with them, 49.2% were married couples living together, 11.7% had a female householder with no husband present, and 34.2% were non-families. 28.2% of all households were made up of individuals, and 11.7% had someone living alone who was 65 years of age or older. The average household size was 2.41 and the average family size was 2.94.
In the town, the population was spread out, with 22.7% under the age of 18, 6.7% from 18 to 24, 28.2% from 25 to 44, 27.2% from 45 to 64, and 15.2% who were 65 years of age or older. The median age was 40 years. For every 100 females, there were 93.2 males. For every 100 females age 18 and over, there were 90.2 males.
The median income for a household in the town was $50,902, and the median income for a family was $60,902. Males had a median income of $41,902 versus $30,902 for females. The per capita income for the town was $24,902. About 4.2% of families and 5.7% of the population were below the poverty line, including 6.7% of those under age 18 and 6.2% of those age 65 or over.
Common Questions
What is Per Capita Income in Whitinsville?
Per Capita income in Whitinsville is $44,816.
What is the Median Family Income in Whitinsville?
Median Family Income in Whitinsville is $124,422.
What is the Median Household income in Whitinsville?
Median Household Income in Whitinsville is $88,750.
What is Income or Wage Gap in Whitinsville?
Income or Wage Gap in Whitinsville is 42.2%.
Women in Whitinsville earn 57.8 cents for every dollar earned by a man.
What is Inequality or Gini Index in Whitinsville?
Inequality or Gini Index in Whitinsville is 0.42.
What is the Total Population of Whitinsville?
Total Population of Whitinsville is 7,273.
What is the Total Male Population of Whitinsville?
Total Male Population of Whitinsville is 3,309.
What is the Total Female Population of Whitinsville?
Total Female Population of Whitinsville is 3,964.
What is the Ratio of Males per 100 Females in Whitinsville?
There are 83.48 Males per 100 Females in Whitinsville.
What is the Ratio of Females per 100 Males in Whitinsville?
There are 119.79 Females per 100 Males in Whitinsville.
What is the Median Population Age in Whitinsville?
Median Population Age in Whitinsville is 38.1 Years.
What is the Average Family Size in Whitinsville
Average Family Size in Whitinsville is 3.0 People.
What is the Average Household Size in Whitinsville
Average Household Size in Whitinsville is 2.5 People.
How Large is the Labor Force in Whitinsville?
There are 4,163 People in the Labor Forcein in Whitinsville.
What is the Percentage of People in the Labor Force in Whitinsville?
71.9% of People are in the Labor Force in Whitinsville.
What is the Unemployment Rate in Whitinsville?
Unemployment Rate in Whitinsville is 4.8%.